determining the power and energy capacities of a battery
TRANSCRIPT

Portland State University Portland State University
PDXScholar PDXScholar
Electrical and Computer Engineering Faculty Publications and Presentations Electrical and Computer Engineering
7-11-2016
Determining the Power and Energy Capacities of a Determining the Power and Energy Capacities of a
Battery Energy Storage System to Accommodate Battery Energy Storage System to Accommodate
High Photovoltaic Penetration on a Distribution High Photovoltaic Penetration on a Distribution
Feeder Feeder
Robert B. Bass Portland State University, [email protected]
Jennifer Carr Peak Reliability
José Aguilar Portland State University
Kevin Whitener Portland General Electric
Follow this and additional works at: https://pdxscholar.library.pdx.edu/ece_fac
Part of the Electrical and Computer Engineering Commons
Let us know how access to this document benefits you.
Citation Details Citation Details R. B. Bass, J. Carr, J. Aguilar and K. Whitener, "Determining the Power and Energy Capacities of a Battery Energy Storage System to Accommodate High Photovoltaic Penetration on a Distribution Feeder," in IEEE Power and Energy Technology Systems Journal, vol. 3, no. 3, pp. 119-127, Sept. 2016.
This Article is brought to you for free and open access. It has been accepted for inclusion in Electrical and Computer Engineering Faculty Publications and Presentations by an authorized administrator of PDXScholar. Please contact us if we can make this document more accessible: [email protected].

IEEE Power and Energy Technology Systems Journal
Received 24 December 2015; revised 15 April 2016; accepted 24 June 2016. Date of publication 11 July 2016;date of current version 16 September 2016.
Digital Object Identifier 10.1109/JPETS.2016.2586072
Determining the Power and EnergyCapacities of a Battery Energy
Storage System to AccommodateHigh Photovoltaic Penetration
on a Distribution FeederROBERT B. BASS1 (Member, IEEE), JENNIFER CARR2 (Member, IEEE),
JOSÉ AGUILAR1, AND KEVIN WHITENER3 (Member, IEEE)1Maseeh College of Engineering and Computer Science, Portland State University, Portland, OR 97201 USA
2Peak Reliability, Vancouver, WA 98662 USA3Portland General Electric, Portland, OR 97204 USA
CORRESPONDING AUTHOR: R. B. BASS ([email protected])
ABSTRACT The integration of distributed energy generation systems has begun to impact the operationof distribution feeders within the balancing areas of numerous electrical utilities. Battery energy storagesystems may be used to facilitate greater integration of renewable energy generation. This paper describesa method for determining the power and energy capacities a battery energy storage system would need inorder to accommodate a particular photovoltaic penetration level within a distribution feeder, or conversely,the amount of photovoltaic that could be installed on a feeder with a minimal investment in power and energybattery energy storage system (BESS) capacities. This method determines the BESS capacities required tocompensate both intra-hour and inter-hour load and photovoltaic fluctuations to achieve a flat feeder powerprofile. By managing the feeder power, the voltage drop along the length of feeder may be managed, therebymitigating the voltage fluctuation induced by the stochastic nature of both renewables generation and load.Doing so facilitates system benefits, such as conservation voltage reduction, fewer operations of load tapchangers, and voltage regulators, and allows for deferment of capital expenditures.
INDEX TERMS Battery energy storage systems, firming, photovoltaic (PV) integration, shaping.
I. INTRODUCTION
THE purpose of this paper is to describe and demon-strate a method for determining the power (MW) and
energy (MWh) capacities required of a battery energy stor-age system (BESS) in order to accommodate a particularphotovoltaic (PV) penetration level on a distribution feeder.This method involves using a BESS s-domain plant modeland a PI (proportional-integral) compensator, feeder loaddata, and local insolation data to determine the BESS MWand MWh capacities required to provide both firming (intra-hour compensation) and shaping (inter-hour) on a distributionfeeder in response to both photovoltaic (PV) and loadfluctuations.
This method is applicable to any distribution feeder, solong as relevant load and insolation data are available.
The results presented in this report are unique to the Oxford-Rural feeder, part of Portland General Electric’s (PGE) dis-tribution network in Salem, Oregon (despite it’s name, thefeeder is not in a rural area). The Oxford-Rural feeder hasan average daily maximum load of 2.94 MW. It was foundthat a BESS with 0.61 MW of power capacity and 2.4 MWhof energy capacity would be able to achieve a flat feederprofile with 35% PV penetration on this feeder. Other feederswill present different load curves and be subject to differentinsolation profiles. As such the BESS capacity recommenda-tions will differ from feeder to feeder. It is expected thoughthat the general behaviour of the results are extensible toother feeders. The general trend will be consistent; there islikely an ideal level of PV penetration, perhaps 25% to 35%,where BESS capacity requirements are minimal.
VOLUME 3, NO. 3, SEPTEMBER 2016
2332-7707 2016 IEEE. Translations and content mining are permitted for academic research only.Personal use is also permitted, but republication/redistribution requires IEEE permission.
See http://www.ieee.org/publications_standards/publications/rights/index.html for more information. 119

IEEE Power and Energy Technology Systems Journal
Capital costs for BESS have declined significantly overthe past several years. There are few up-to-date figures forthe costs of BESS within the academic literature. However,Nykvist and Nilsson compiled capital cost data from bothacademic and non-academic sources to develop an under-standing of recent cost trends [1]. These data are specific toLi-ion electric vehicle battery packs, rather than utility BESS.However, the EVmarket is a significant driver of battery costsand Li-ion technologies are often used for utility BESS. Theconsensus Nykvist and Nilsson report is that Li-ion capitalcosts will continue to decline, settling asymptotically withinthe $150-$300/kWh price range by 2025. As such, we canexpect an increasing rate of adoption of BESS for utilityapplications.
II. BACKGROUNDBESS are capable of providing a number of ancillary services,including frequency regulation, economic arbitrage, voltageregulation or reactive power (VAr) support, and the firm-ing and shaping of power. In 2013, PGE commissioned itsSalem Smart Power Project (SSPP), which features a 5 MW,1.25 MWh lithium ion BESS. Since its commissioning, theSSPP has helped establish the value of integrating BESSinto distribution feeders. The system was used to demon-strate the concept of a high reliability zone by providingpower between the moment of an outage and when back-up internal combustion engines come on line. While suc-cessful, the system is not currently utilized in this way. TheSSPP has also demonstrated extremely rapid response to fre-quency events, responding in approximately seven seconds,with full 5 MW output within 30 seconds. PGE, and manyother utilities, would like to know if systems like the SSPPmay be used to facilitate greater integration of renewableenergy generation within their balancing area. The objectiveof this research is to develop a method for evaluating theMW and MWh capacities of a BESS to increase the pene-tration level of photovoltaic generation within a distributionfeeder.
Many research groups have investigated how BESS maybe used to integrate renewables within distribution feeders,particularly those subject to high penetration levels of PVgeneration. Several groups have analyzed BESS distributedalong the length of a feeder, mixed in with distributed PV orintegrated directly with PV systems. Jackson, et al.model theeffects of various penetration levels of PV systems within dis-tribution feeders and how PV impacts may be mitigated withBESS that are distributed along the length of the feeder [2].Jayasekara, et al. investigated the impact of co-located PVand storage distributed throughout a feeder [3]. They use apower management tool to direct these distributed storagesystems to regulate both the feeder voltage profile and peakshaving. Tant, et al. propose using a multiobjective opti-mization method for a BESS installed within a residentialdistribution feeder experiencing over-voltage problems, witha single BESS located strategically along the feeder, not atthe substation. The BESS helps mitigate power quality issues
while simultaneously allowing for deferment of distributionasset upgrades [4]. Mardira, et al. investigated the impact onpeak demand that distributed residential PV has on the loadprofile of customers on a distribution feeder, both with andwithout integrated BESS. They found that the aggregated loadprofile of customers with both PV and BESS is characterizedby reductions in both average and peak load while the aggre-gated load profiles of customers with just PV experienceda reduction only in average load [5]. Alam, et al. use aninverter ramp-rate control algorithm and BESS to managevoltage ramp rates induced by cloud coverage within weakdistribution feeders [6], [7]. BESS and PV are co-located atmultiple points along the length of the feeder. Pandya andAware propose managing distribution feeder voltage profilesusing a D-STATCOM and BESS, co-located with BESS. TheD-STATCOM and BESS provide reactive and real power,respectively, which are used to manage the feeder voltageprofile [8].
Other researchers have analyzed the economic and assetmanagement impacts BESS have on distribution feeders.Kleinberg, et al. analyze the economic consequences energystorage has on distribution feeders impacted by PV gener-ation [9]. Nagarajan and Ayyanar use convex optimizationto calculate the optimal charge/discharge cycling of a BESSin order to minimize feeder transformer losses as well asBESS life-cycle costs through economic arbitrage of energypricewithin a distribution feeder subject to PV-induced powerfluctuations [10].
Gaztañaga, et al. demonstrate how the stochastic genera-tion of PVmay be compensated through coupling with BESS.They use BESS to compensate PV at the plant, rather thanaddressing a feeder profile. Theirs is an approach well-suited for large PV generation plants rather than feeders withmultiple distributed load and subject to high penetration ofdistributed PV [11].
This paper differs from these approaches in three ways.One, this method manages the feeder voltage by controllingthe net power coming out of the feeder: load minus PV gen-eration plus/minus BESS power. It is variations in the netload, calculated as the feeder load minus PV generation, thatresult in voltage drops along the feeder that affect feedervoltage profiles. Voltage is a service sold to utility customers,guaranteed to be within ±5%. Deviations in voltage outsideof these bounds can result in stalling of induction machines,unintended tripping of relays, or excessive tap changes withinload tap changers and voltage regulators. And, rapid changesin voltage cause flicker in lighting systems and disrupt cus-tomer operations that require high quality power, such asdata centers [12]. It is the net load against which the BESSwas used to provide firming and shaping of the feeder powerprofile.
Two, a procedure was developed by which the MW andMWh BESS capacities may be determined, given a particularpenetration level of PV on the feeder, in order to achieve thisflat feeder power profile. Alternatively, the approach can beused to determine the possible PV penetration within a feeder
120 VOLUME 3, NO. 3, SEPTEMBER 2016
Bass et al.: Determining the Power and Energy Capacities of a BESS
that may be achieved with a minimal investment in MW andMWh capacities.
And three, this new approach is realizable using the func-tionality available within industry-standard contol systems,specifically programmable logic controllers (PLCs). PLCsare used to provide outer-loop control for BESS, and controlsengineers are familiar with using the toolboxes provided forPLCs to build complex control systems. For instance, PLCsprovide PI control loop feedback code blocks and PI coeffi-cient tuning tools. A practical approach for BESS manage-ment must be realizable using the capabilities of PLCs, thecontroller of choice for utility-scale BESS.
III. METHODOLOGYDeveloping a clear depiction of the firming and shapingcapabilities of a BESS requires developing representativedata models of the load, PV generation and desired feederprofile. After developing these data models, the MW andMWh requirements are determined for each specific seasonaland PV configuration.
To characterize seasonal discrepancies in both load andPV insolation throughout the year, data were gathered fromrepresentative days near the equinoxes and solstices. Loaddata come from the Oxford-Rural feeder. PV data came fromtwo sources. Five-minute data came from a solar insolationmonitoring site at the SSPP. One-second data, used to modelcloud effects, came from an insolation monitoring station onOahu, Hawai’i.
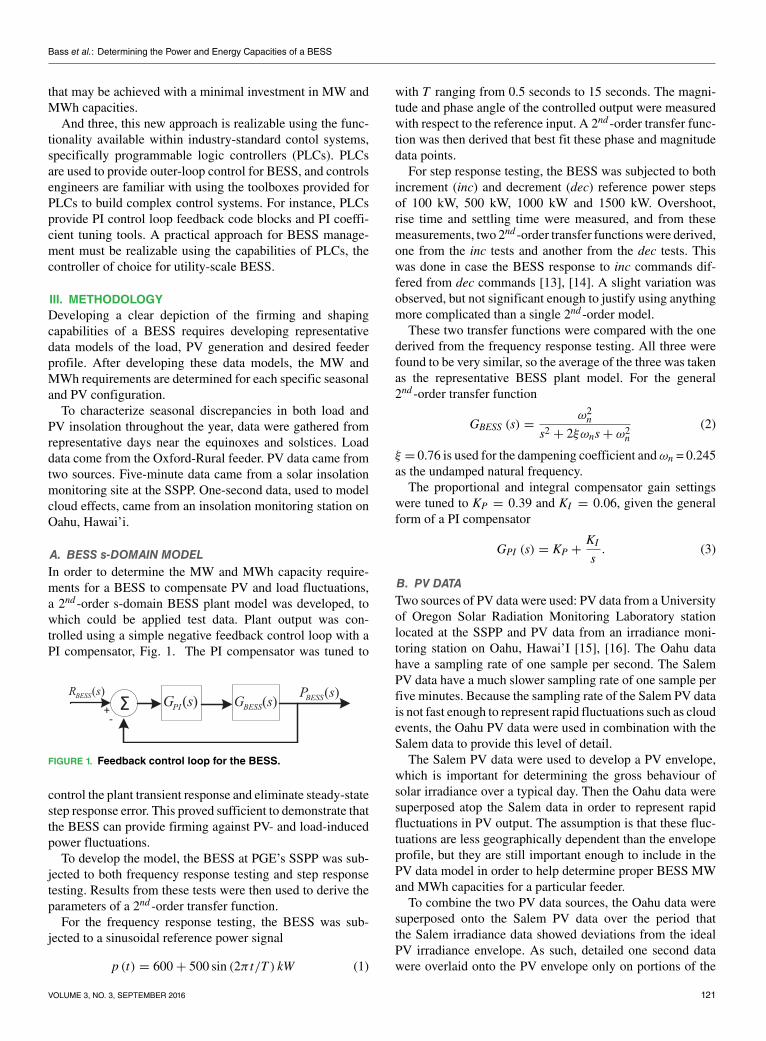
A. BESS s-DOMAIN MODELIn order to determine the MW and MWh capacity require-ments for a BESS to compensate PV and load fluctuations,a 2nd -order s-domain BESS plant model was developed, towhich could be applied test data. Plant output was con-trolled using a simple negative feedback control loop with aPI compensator, Fig. 1. The PI compensator was tuned to
FIGURE 1. Feedback control loop for the BESS.
control the plant transient response and eliminate steady-statestep response error. This proved sufficient to demonstrate thatthe BESS can provide firming against PV- and load-inducedpower fluctuations.
To develop the model, the BESS at PGE’s SSPP was sub-jected to both frequency response testing and step responsetesting. Results from these tests were then used to derive theparameters of a 2nd -order transfer function.
For the frequency response testing, the BESS was sub-jected to a sinusoidal reference power signal
p (t) = 600+ 500 sin (2π t/T ) kW (1)
with T ranging from 0.5 seconds to 15 seconds. The magni-tude and phase angle of the controlled output were measuredwith respect to the reference input. A 2nd -order transfer func-tion was then derived that best fit these phase and magnitudedata points.
For step response testing, the BESS was subjected to bothincrement (inc) and decrement (dec) reference power stepsof 100 kW, 500 kW, 1000 kW and 1500 kW. Overshoot,rise time and settling time were measured, and from thesemeasurements, two 2nd -order transfer functionswere derived,one from the inc tests and another from the dec tests. Thiswas done in case the BESS response to inc commands dif-fered from dec commands [13], [14]. A slight variation wasobserved, but not significant enough to justify using anythingmore complicated than a single 2nd -order model.These two transfer functions were compared with the one
derived from the frequency response testing. All three werefound to be very similar, so the average of the three was takenas the representative BESS plant model. For the general2nd -order transfer function
GBESS (s) =ω2n
s2 + 2ξωns+ ω2n
(2)
ξ = 0.76 is used for the dampening coefficient andωn = 0.245as the undamped natural frequency.
The proportional and integral compensator gain settingswere tuned to KP = 0.39 and KI = 0.06, given the generalform of a PI compensator
GPI (s) = KP +KIs. (3)
B. PV DATATwo sources of PV data were used: PV data from a Universityof Oregon Solar Radiation Monitoring Laboratory stationlocated at the SSPP and PV data from an irradiance moni-toring station on Oahu, Hawai’I [15], [16]. The Oahu datahave a sampling rate of one sample per second. The SalemPV data have a much slower sampling rate of one sample perfive minutes. Because the sampling rate of the Salem PV datais not fast enough to represent rapid fluctuations such as cloudevents, the Oahu PV data were used in combination with theSalem data to provide this level of detail.
The Salem PV data were used to develop a PV envelope,which is important for determining the gross behaviour ofsolar irradiance over a typical day. Then the Oahu data weresuperposed atop the Salem data in order to represent rapidfluctuations in PV output. The assumption is that these fluc-tuations are less geographically dependent than the envelopeprofile, but they are still important enough to include in thePV data model in order to help determine proper BESS MWand MWh capacities for a particular feeder.
To combine the two PV data sources, the Oahu data weresuperposed onto the Salem PV data over the period thatthe Salem irradiance data showed deviations from the idealPV irradiance envelope. As such, detailed one second datawere overlaid onto the PV envelope only on portions of the
VOLUME 3, NO. 3, SEPTEMBER 2016 121

IEEE Power and Energy Technology Systems Journal
envelope where there was known to be fluctuations. For theOahu data, a lower envelope curve was determined usinga PV envelope function.1 The cloud-induced fluctuationswere then isolated by taking the difference between the actualPV data and the PV envelope, as shown in Fig. 2, which wasthen normalized.
FIGURE 2. Oahu data provide the necessary one-secondsampling rate needed to represent rapid PV fluctuations.To extract these fluctuations, an ideal PV envelope wascalculated. This envelope was then subtracted fromthe data, leaving behind only the fluctuations.
The envelope function was also applied to the Salem PVdata, which is also normalized. The span of fluctuation of theSalem PV data for each season was determined by comparingthe original Salem PV data with the Salem PV envelope. TheOahu data were then superposed over the Salem envelope,with the centers of fluctuations aligned. The fluctuation span,as well as the time of day that the fluctuation occurred, variedby season.
C. COMBINATION OF LOAD AND PV PENETRATIONDeveloping a feeder load profile involved normalization ofthe load data from the Oxford-Rural feeder. To normalizethese data, a nominal feeder load was determined by obtain-ing an average daily maximum from the feeder data. Themaximum load for each day over a period of one year wasdetermined; the average daily maximum is the average of allthesemaxima. For the Oxford-Rural feeder, this average dailymaximum was determined to be 2.94 MVA.
Both the normalized load data and the normalized PV datawere scaled using this average daily maximum. The PV datawere then subtracted from the load data, giving the net loadon the system, pnet (t). Seasonal models were developed for arange of PV penetration levels on the Oxford-Rural feeder
pnet (t) = pload (t)− pPV (t). (4)
D. DESIRED FEEDER PROFILEA flat feeder profile was chosen, meaning the feeder powerwould be constant throughout the day. When loading exceeds
1‘‘Envelope1.1,’’ Mathworks File Exchange. [Online]. Available:https://www.mathworks.com/matlabcentral/fileexchange/3142-envelope1-1
the desired feeder profile, the BESS modulates output asan additional generation resource to balance the load. Whenfeeder load falls below the desired feeder profile, the BESSprovides extra load, drawing power from the feeder in pro-portion to the error.
We chose to use a flat feeder profile in order to get a senseof the upper bounds for the BESS MW and MWh capacitiesthat would be required to provide both firming and shapingin response to load and PV fluctuations. The flat profile isthe worst-case scenario; in order to achieve a flat profile,a large amount of energy must be stored during low-demandand/or high PV generation periods, then discharged duringhigh demand and/or low PV generation periods. So the flatfeeder profile is most challenging for shaping, but impor-tantly, it illustrates that any profile can be attained. Consider,a smooth feeder profile could be defined, one whereby thefeeder output was smoothed using an integration function,which would reduce the MW and MWh capacities requiredof the BESS. By using a flat profile however, we get anunderstanding of themaximumMWandMWh capacities thatwould be required of a BESS.
The desired feeder profile was calculated using the averageof the net load for a representative day in a season. Thisstraight-line average represents the ideal target value at whichthe gross energy consumed on the feeder would equal thegross energy produced. The role of the BESS is to charge anddischarge in proportion to the error in order to balance thesestochastic load and generation profiles against the constantdesired feeder profile. If chosen well, the desired feeder pro-file balances the charging requirements with the dischargingrequirements.
The difference between the desired feeder profile and thenet load determines the BESS reference signal, which is fedinto the BESS s-domain plant model
rBESS (t) = pDFP − pnet (t) . (5)
The BESS output power, pBESS (t), is then determinedby applying the BESS reference signal to the plant model,Fig. 1.
PBESS (s) =RBESS (s)
1+ GPI (s)GBESS (s)(6)
where PBESS (s) is the Laplace transform of pBESS (t).The controlled output signal closely follows the reference
signal, which indicates that the BESS is able to accommodatethe PV and load fluctuations. Plots showing the feeder load,PV generation, net load, desired feeder profile, and BESSreference signal are shown in Fig. 3. Application of linearcontrol theory ensures the algorithm may be readily imple-mented within the outer loop PLC of a BESS.
E. MW AND MWh CAPACITY REQUIREMENTSTheMWcapacity for a BESSwas obtained by calculating themaximum of the absolute value of the BESS reference signalcurve. This also equals the maximum difference between
122 VOLUME 3, NO. 3, SEPTEMBER 2016

Bass et al.: Determining the Power and Energy Capacities of a BESS
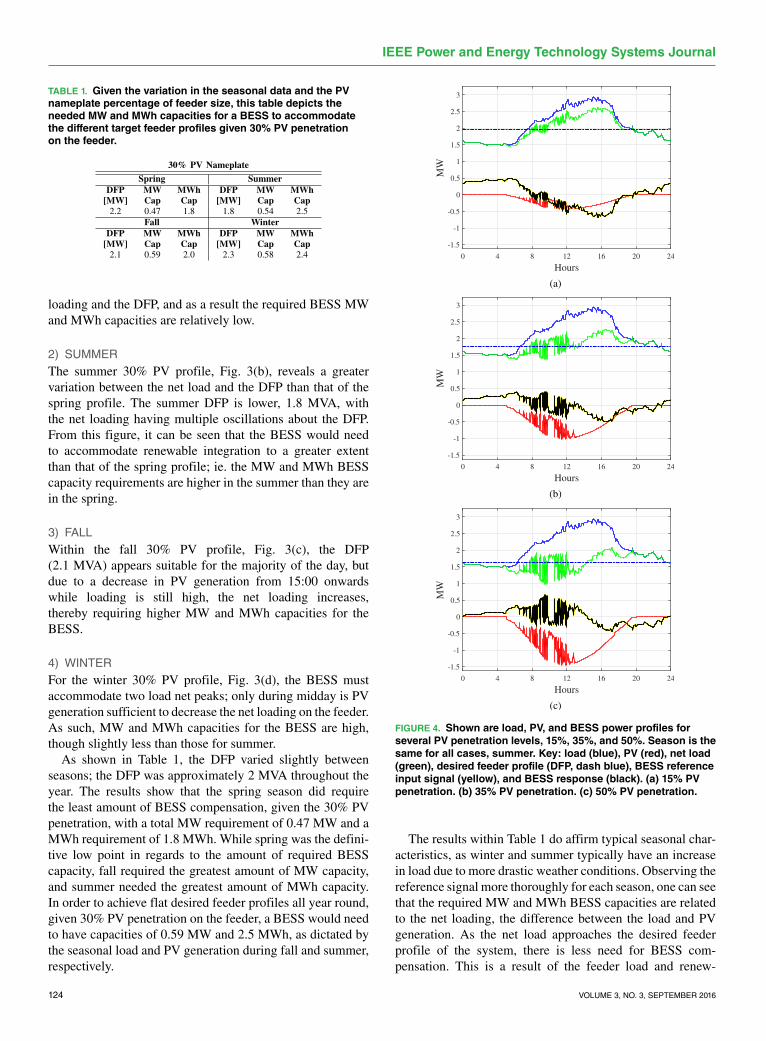
FIGURE 3. Shown are load, PV, and BESS power profiles for sample days from each of the fourseasons. There is 30% PV penetration in all cases. Key: load (blue), PV (red), net load (green), desiredfeeder profile (DFP, dash blue), BESS reference input signal (yellow), and BESS response (black).(a) Spring. (b) Summer. (c) Fall. (d) Winter.
the summed load and PV data and the desired feeder pro-file, and it represents the MW requirement for the BESS toaccommodate a given load and PV penetration. The MWcapacity requirement is dependent on the desired feeder pro-file, seasonal loading, seasonal PV generation and percentPV penetration.
TheMWh capacity for a BESSwas determined by integrat-ing the BESS reference signal curve. The peak MWh valuefrom this curve indicates the required BESS MWh capacity.The MWh capacity also depends on the desired feeder pro-file, seasonal loading, seasonal PV profile and percent PVpenetration. As such, a variety of seasonal scenarios mustbe examined in order to determine both the MW and MWhcapacities required for a particular penetration level of PV anda particular desired feeder profile.
IV. ANALYSIS AND RESULTSUsing the method described, the desired feeder profilewas evaluated with respect to different seasonal load andPV profiles on the Oxford-Rural feeder. Examining the var-ious seasons provides an overview of the BESS response toloading and solar integration throughout the year.
The PV penetration was varied over a range of 10% to 50%of the feeder size, in increments of 5%. This variance in
PV nameplate capacity provided a means for analyzing thenecessary MW and MWh requirements for the BESS underdiffering amounts of renewable penetration. All of these testcases were scaled to a base line feeder size of 2.94 MVA, theaverage daily maximum for the Oxford-Rural feeder.
A. SEASONAL VARIANCEFor this analysis, the PV penetration level is held constantat 30%. The desired feeder profile (DFP) varies seasonally,as each seasonal DFP depends on both the load and the PVinsolation characteristic of the season. From these analyses isdeveloped an understanding of the required MW and MWhcapacities for the BESS as a function of seasonal variations.Results are summarized on Table 1.
1) SPRINGFig. 3(a) shows the spring 30% PV profile, red line. Theloading on the feeder, blue line, peaks at 2.9 MW. The netloading, green line, is the difference between the PV andfeeder load. The DFP, at 2.2 MVA, is the straight dashed blueline about which the net loading is centered. The yellow lineshows the required BESS reference input signal required tobalance the net loading against the DFP. Note that at 30% PVpenetration, there is not a great difference between the net
VOLUME 3, NO. 3, SEPTEMBER 2016 123
IEEE Power and Energy Technology Systems Journal
TABLE 1. Given the variation in the seasonal data and the PVnameplate percentage of feeder size, this table depicts theneeded MW and MWh capacities for a BESS to accommodatethe different target feeder profiles given 30% PV penetrationon the feeder.
loading and the DFP, and as a result the required BESS MWand MWh capacities are relatively low.
2) SUMMERThe summer 30% PV profile, Fig. 3(b), reveals a greatervariation between the net load and the DFP than that of thespring profile. The summer DFP is lower, 1.8 MVA, withthe net loading having multiple oscillations about the DFP.From this figure, it can be seen that the BESS would needto accommodate renewable integration to a greater extentthan that of the spring profile; ie. the MW and MWh BESScapacity requirements are higher in the summer than they arein the spring.
3) FALLWithin the fall 30% PV profile, Fig. 3(c), the DFP(2.1 MVA) appears suitable for the majority of the day, butdue to a decrease in PV generation from 15:00 onwardswhile loading is still high, the net loading increases,thereby requiring higher MW and MWh capacities for theBESS.
4) WINTERFor the winter 30% PV profile, Fig. 3(d), the BESS mustaccommodate two load net peaks; only during midday is PVgeneration sufficient to decrease the net loading on the feeder.As such, MW and MWh capacities for the BESS are high,though slightly less than those for summer.
As shown in Table 1, the DFP varied slightly betweenseasons; the DFP was approximately 2 MVA throughout theyear. The results show that the spring season did requirethe least amount of BESS compensation, given the 30% PVpenetration, with a total MW requirement of 0.47 MW and aMWh requirement of 1.8 MWh. While spring was the defini-tive low point in regards to the amount of required BESScapacity, fall required the greatest amount of MW capacity,and summer needed the greatest amount of MWh capacity.In order to achieve flat desired feeder profiles all year round,given 30% PV penetration on the feeder, a BESS would needto have capacities of 0.59 MW and 2.5 MWh, as dictated bythe seasonal load and PV generation during fall and summer,respectively.
FIGURE 4. Shown are load, PV, and BESS power profiles forseveral PV penetration levels, 15%, 35%, and 50%. Season is thesame for all cases, summer. Key: load (blue), PV (red), net load(green), desired feeder profile (DFP, dash blue), BESS referenceinput signal (yellow), and BESS response (black). (a) 15% PVpenetration. (b) 35% PV penetration. (c) 50% PV penetration.
The results within Table 1 do affirm typical seasonal char-acteristics, as winter and summer typically have an increasein load due to more drastic weather conditions. Observing thereference signal more thoroughly for each season, one can seethat the required MW and MWh BESS capacities are relatedto the net loading, the difference between the load and PVgeneration. As the net load approaches the desired feederprofile of the system, there is less need for BESS com-pensation. This is a result of the feeder load and renew-
124 VOLUME 3, NO. 3, SEPTEMBER 2016

Bass et al.: Determining the Power and Energy Capacities of a BESS
TABLE 2. This table provides the seasonal MW and MWh capacities (Cap) requirements for the various PV penetration levels,indicated as percentages of the feeder size. These data are plotted in Fig. 5(a) and 5(b).
able penetration reaching a threshold point where the targetand net loading are very similar. For this 30% PV pene-tration scenario, the spring case in Fig. 3(a) is an exampleof this threshold point being reached. With the exceptionof a slight peak at approximately 08:00, the rest of theday oscillates marginally about the DFP. In the winter case,Fig. 3(b), there are two peaks for the net loading, one around08:00 and another around 17:00, with the additional timeperiod from 24:00 to 06:00 also requiring excess BESScapacity.
B. PHOTOVOLTAIC PENETRATIONChoosing BESS capacities that provide firming and shapingservices with minimal capital investment depends not only onthe seasonal load and insolation characteristics but also on thePV penetration level within the feeder. The PV penetrationis defined as a percentage of PV AC output to the averagemaximum feeder load. For the Oxford-Rural feeder example,this value is 2.94 MVA. For this analysis, the amount ofPV penetration was varied from 5% to 50%. Note that for agiven seasonal loading, the DFP varies as the PV penetrationchanges: the greater the penetration, the greater the load onthe feeder was offset. So increased PV penetration results ina lower DFP.
Given seasonal load and PV insolation data and a DFP,a range of PV penetration levels were iterated through inorder to establish a relationship between the PV penetrationlevel and the MW and MWh capacities required of a BESSto achieve the DFP. Fig. 4(a) through 4(c) show the effects ofPV penetration on the net loading, DFP, and BESS referenceinput for four different penetration levels in the summercase.
The plots in Fig. 4 show the result of increased PV pene-tration on the feeder. As PV penetration increases, the fluctu-ation of the net load around the DFP decreases, meaning lessMW andMWh capacities are required of the BESS to supportPV integration. This affect, however, is limited; beyond 40%penetration, additional MW andMWh capacities are requiredto support additional PV.
Table 2 shows the BESS MW and MWh capacities neededto accommodate various PV penetrations levels for each ofthe different seasonal scenarios. However, the required BESSMW and MWh capacities required to integrate PV depends
FIGURE 5. Shown are the MW and MWh BESS capacities versusPV penetration that are required to achieve a flat feeder profilefor all seasons on the Oxford-Rural feeder. (a) Required BESSMW required versus percent PV penetration. (b) RequiredBESS MWh required versus percent PV penetration.
on the maximum values from all four seasons. These maximaare shown in the rightmost columns of Table 2.
Fig. 5(a) and 5(b) show plots of the data from Table 2. Thethick black lines define theMWandMWh capacities requiredto accommodate various penetration levels of PV throughoutthe year. Those black lines derive from the maximum valuesfrom each of the seasonal plots. These lines can be used todetermine the amount of MW and MWh capacities required
VOLUME 3, NO. 3, SEPTEMBER 2016 125
IEEE Power and Energy Technology Systems Journal
to accommodate a particular penetration level of PV. On theother hand, the curves can be used to determine the possiblepenetration level of PV on a feeder - the possible PV penetra-tion given the minimum amount of BESS capital investment.For the Oxford-Rural feeder, these data indicate a flat feederprofile can be achieved with a 30% PV penetration using aBESS with capacities of 0.59 MW and 2.5 MWh.
As shown in both Fig. 5(a) and 5(b), the required MWand MWh capacities are dictated by summer loading andgeneration conditions for low PV penetration levels, whilewinter conditions dictate the required capacities for high PVpenetration levels. Fall conditions dictate MW capacities formid-range penetration levels, 25-35%.
Note MW capacity requirements rise steeply as PV pene-tration levels exceed 40%, indicating an increasing challengefor integrating high penetration levels of PV. Note too thehigh MWh capacities required to integrate low levels of PVpenetration; the wide variations between minimum and peakdemand have not been tempered by sufficient PV genera-tion on the feeder, indicating the benefits of shaping fromPV integration are not fully realized until penetration levelsreach 25 to 30%.
V. CONCLUSIONThe objective of this research was to develop a method fordetermining the MW and MWh capacities a BESS wouldneed in order to accommodate a particular PV penetrationlevel on a distribution feeder; or, conversely, the amountof PV that could be installed on a feeder with a minimalinvestment in MW and MWh BESS capacities. An s-domainSSPP plant model was used, along with SSPP load dataand local PV data, to demonstrate this method. The methoddetermines the BESS MW and MWh capacities requiredto compensate against both intra-hour and inter-hour loadand PV fluctuations, phenomena known as ‘‘firming’’ and‘‘shaping,’’ respectively.
To build seasonal data models, measured load data fromPGE’s Oxford-Rural Feeder and insolation data from anearby solar insolation monitoring station were used. TheSalem PV data are not very granular, sampled once every fiveminutes. This insolation data was augmented using highlygranular data (one sample per second) from another insola-tion monitoring station. Adding these fluctuations allowed usto model rapid PV events, particularly cloud-effects, which inturn allowed us to better determine the MW and MWh BESScapacities needed to firm intra-hour PV events.
The developedmethod is applicable to distribution feeders,so long as the requisite load and insolation data are available.However, the results presented in this report are unique to theOxford-Rural feeder. Other feeders will present different loadcurves and insolation profiles, and as such the BESS capacityrecommendations will differ. The general trend of the resultsis expected to be found in other feeders; for every feeder,there is likely a ‘‘sweet spot’’ level of PV penetration, perhapsaround 25% to 35%, where the BESS capacity requirementsare minimal.
Findings indicate a BESSwith 0.61MWof power capacityand 2.4 MWh of energy capacity would be able to achieve aflat DFP with 35% PV penetration: 1.0 MW of the 2.94 MVAestimated as the average daily maximum load currently expe-rienced on the Oxford-Rural feeder. Note that while the MWcapacity of PGE’s SSPP is more than sufficient to meet thesepower requirements, the SSPP’s MWh capacity is too low,1.25 MWh, to facilitate such high levels of penetration of PVon the Oxford-Rural feeder.
These results were obtained using a flat feeder profile,which we use to develop an understanding of the upperbounds for the BESS MW and MWh capacities requiredfor firming and shaping load and PV fluctuations. The flatprofile is the worst-case scenario, but it serves to illustratethat any profile can be attained. A smooth feeder profile issufficient, so long as voltage fluctuations are not outside the±0.05 pu bound and dV/dt is not too extreme. The aim ofour work is to develop a method for BESS sizing that canaddress feeders experiencing very high levels of PV penetra-tion such that problems like the infamous Duck Curve can bemitigated.2
VI. FUTURE WORKFor this work, a simple, flat desired feeder profile (DFP) wasused. With a flat DFP, customer voltages do not fluctuateas PV generation and loads change since the BESS makesup any difference between the net load and the flat DFP.It was hypothesize that other DFPs more closely shapedto approximate the net load would be able to facilitate theintegration of high levels of PV penetration with lessMWandMWh BESS capacities. These could be as simple as piece-wise linear curves that roughly approximate the predicteddaily loading or more complicated functions that specificallymitigate the Duck Curve. On-going work has focused ondeveloping DFPs that provide firming, but much less shaping,by integrating the past 15 to 90 minutes of feeder powerdemand to provide a projection for future power demand ona minute-by-minute basis. Focusing on firming eliminatesshort-term fluctuations of customer voltage profiles, thoughintra-hour voltage fluctuations will still occur. But doing sodoes result in less required MW and MWh BESS capacities,particularly MWh.
VII. ACKNOWLEDGMENTThis work was a collaborative project between Portland StateUniversity and Portland General Electric.
REFERENCES[1] B. Nykvist and M. Nilsson, ‘‘Rapidly falling costs of battery packs
for electric vehicles,’’ Nature Climate Change, vol. 5, pp. 329–332,Mar. 2015.
[2] T. M. Jackson, G. R. Walker, and N. Mithulananthan, ‘‘Integrating PVsystems into distribution networks with battery energy storage systems,’’in Proc. Australian Univ. Power Eng. Conf., Sep./Oct. 2014, pp. 1–7.
2‘‘Fast facts: What the duck curve tells us about managing a greengrid,’’ California Independent System Operator. [Online]. Available:https://www.caiso.com/Documents/FlexibleResourcesHelpRenewables_FastFacts.pdf
126 VOLUME 3, NO. 3, SEPTEMBER 2016

Bass et al.: Determining the Power and Energy Capacities of a BESS
[3] N. Jayasekara, M. A. S. Masoum, and P. Wolfs, ‘‘Optimal power manage-ment for LV distribution feeders with finely distributed PV and co-locatedstorage,’’ in Proc. IEEE Power Energy Soc. General Meeting (PES),Jul. 2013, pp. 1–5.
[4] J. Tant, F. Geth, D. Six, P. Tant, and J. Driesen, ‘‘Multiobjective batterystorage to improve PV integration in residential distribution grids,’’ IEEETrans. Sustain. Energy, vol. 4, no. 1, pp. 182–191, Jan. 2013.
[5] L. Mardira, T. K. Saha, and M. Eghbal, ‘‘Investigating impacts of batteryenergy storage systems on electricity demand profile,’’ in Proc. Austral.Univ. Power Eng. Conf., Sep. 2014, pp. 1–5.
[6] M. J. E. Alam, K.M.Muttaqi, and D. Sutanto, ‘‘Mitigation of rapid voltagevariations caused by passing clouds in distribution networks with solar PVusing energy storage,’’ in Proc. Int. Conf. Elect. Comput. Eng., Dec. 2014,pp. 305–308.
[7] M. J. E. Alam, K.M.Muttaqi, andD. Sutanto, ‘‘A novel approach for ramp-rate control of solar PV using energy storage to mitigate output fluctuationscaused by cloud passing,’’ IEEE Trans. Energy Convers., vol. 29, no. 2,pp. 507–518, Jun. 2014.
[8] M. H. Pandya and M. V. Aware, ‘‘Augmentation of distribution networkcapacity through integration of PV and ES,’’ in Proc. 18th Nat. Power Syst.Conf., Dec. 2014, pp. 1–6.
[9] M. Kleinberg, J. Harrison, and N. Mirhosseini, ‘‘Using energy storage tomitigate PV impacts on distribution feeders,’’ in Proc. IEEE PES Innov.Smart Grid Technol. Conf., pp. 1–5, Feb. 2014
[10] A. Nagarajan and R. Ayyanar, ‘‘Design and strategy for the deploy-ment of energy storage systems in a distribution feeder with penetrationof renewable resources,’’ IEEE Trans. Sustain. Energy, vol. 6, no. 3,pp. 1085–1092, Jul. 2015.
[11] H. Gaztanaga et al., ‘‘Enhanced experimental PV plant grid-integrationwith a MW lithium-ion energy storage system,’’ in Proc. IEEE EnergyConvers. Congr. Expo., Sep. 2013, pp. 1324–1329.
[12] R. C. Dugan, M. F. McGranaghan, S. Santoso, and H. W. Beaty, ElectricalPower Systems Quality, 3rd ed. New York, NY, USA: McGraw-Hill, 2012.
[13] K. Jagannathan and K. Raghunathan, ‘‘Charge-discharge asymmetry ofphase change electrodes from isotropic solid state diffusion models,’’J. Electrochem. Soc., vol. 159, no. 1, pp. A26–A37, 2012.
[14] H. C. Shin et al., ‘‘Asymmetry between charge and discharge duringhigh rate cycling in LiFePO4–In situ X-ray diffraction study,’’ Elec-trochem. Commun., vol. 10, no. 4, pp. 536–540, 2008. [Online]. Available:http://www.sciencedirect.com/science/article/pii/S1388248108000490
[15] S. Wilcox and A. Andreas, ‘‘Solar resource & meteorological assess-ment project (SOLRMAP): Rotating shadowband radiometer (RSR),’’NREL, Kalaeloa, HI, USA, Tech. Rep. DA-5500-56497, 2010. [Online].Available: http://dx.doi.org/10.5439/1052228
[16] F. Vignola, R. Kessler, and J. Peterson. (2015). University of Oregon:Solar Radiation Monitoring Laboratory, SRML Station: Salem, OR (PV).[Online]. Available: http://solardata.uoregon.edu/SalemPV.html
ROBERT B. BASS (M’06) received the Ph.D. degree in electrical engi-neering from the University of Virginia, Charlottesville, VA, USA, in 2004.
He is currently an Associate Professor with the School of Electrical andComputer Engineering, Portland State University, Portland, OR, USA. Hisresearch interests pertain to electric power distribution assets, power quality,renewables integration, and distributed energy storage systems.
JENNIFER CARR (S’13–M’15) received the B.A. degree in philosophyfrom the University of Notre Dame, Notre Dame, IN, USA, in 1996, andthe B.S. degree in electrical and computer engineering from Portland StateUniversity, Portland, OR, USA, in 2015.
She is currently with Peak Reliability, Vancouver, WA.
JOSÉ AQUILAR is currently working toward the degree in electrical andcomputer engineering at Portland State University, Portland, OR, USA.
He is currently a Graduate Research Assistant with the Power Laboratory,Portland State University, Portland, OR, USA. His research interests includepower and energy systems.
KEVINWHITENER (M’13) received the B.S.E.E. degree fromWashingtonState University, Pullman, WA, USA, in 1983, and the M.B.A. degree fromColorado State University, Fort Collins, CO, USA, in 2007.
He is currently an Electrical Engineer with Portland General Electric,Portland, OR, USA. His research interests include energy storage, integrationof renewable energy, and distributed generation.
VOLUME 3, NO. 3, SEPTEMBER 2016 127