determining the major forms of selenium in jose tall ... · pdf filedetermining the major...
TRANSCRIPT

1
Determining the Major Forms of Selenium in Jose Tall Wheatgrass Herbage*
Final Report August 2014
California Department of Water Resources (DWR)
Proposition 204 Agricultural Drainage Program
Agreement Number: 4600008986
Project Duration: July 2011- June 30, 2014*
Principal Investigator
Dr. Sharon E. Benes, Professor of Soils & Crop Nutrition Dept. of Plant Science, California State University, 2415 E. San Ramon Ave., M/S AS72;
Fresno, CA 93740-8033; tel. 559-278-2255; [email protected]
Co-Principal Investigators
Dr. Peter H. Robinson, Dairy Nutrition Specialist
Dept. of Animal Science, University of California, Davis. [email protected]
Dr. Stephen R. Grattan, Plant Water Relations Specialist
Dept. of Land, Air & Water Resources (LAWR), University of California, Davis
Collaborators
Dr. Joy Goto, Associate Professor of Biochemistry,
Dept. of Chemistry, California State University, Fresno. [email protected]
Dr. Bill Maher, Professor, Professor of Environmental Chemistry,
Dept. Environmental Science, University of Canberra, Australia [email protected]
Grace Cun, Graduate student, Dept. of Plant Science, California State University, Fresno.
*this project was an extension of an earlier study (Agreement # 4600003430) entitled “Animal
Evaluation of Salt Tolerant Forages Irrigated with Saline Drainage Water: Forage quality, persistence
under grazing, digestibility and intake by ruminants.

2
I. ABSTRACT
A study conducted at Red Rock Ranch in 2007 and 2008 concluded that beef cattle could be grazed for 6
to 7 months on pastures of ‘Jose’ tall wheatgrass and creeping wildrye (Leymus triticoides) containing up
to 4 ppm total Se in the dry matter without developing symptoms of Se toxicity or other adverse effects
on animal health. A dairy cattle feeding study was then conducted in 2012 to examine the potential of
using Se-enriched tall wheatgrass hay as a substitute for mineral supplements (sodium selenite) fed to
dairy cattle in Se-deficient areas. Results from this study suggested that although the mineral source had
higher bio-availability, there were benefits of utilizing Se-enriched TWG hay as a bioavailable Se source
for dairy cattle, including increased milk production as compared to no supplementation.
Both of these studies revealed the need to determine the chemical forms of Se in the tall wheatgrass hay
so as to better assess its bio-availability for cattle. For the Se speciation study reported here, samples of
tall wheatgrass grown in the greenhouse at different levels of selenium and salinity in the soil, and a tall
wheatgrass hay sample from the Panoche Water District, were submitted to three qualified laboratories
for Se speciation. Due to the complex nature of Se biochemistry in plants, not all of the Se could the
speciated, but Applied Speciation Lab (Bothell, WA) provided the best results. A step-wise, acid-peroxide
digestion (HNO3 /HCl/H2O2, heating to 100C after each addition) was used to extract the samples and
reverse phase, inductively coupled mass spectrometry (RP-ICP-CRC-MS) was used for Se detection. This
process extracted 45 – 60%, and identified 31 – 47%, of the total-Se measured in the forage samples.
The major form of Se in the extractable portion was selenomethionine (Se-Met) which accounted for
21 to 31% of the total Se in the TWG samples. Se-methionine is considered to be a bio-available form for
animals/cattle, based on reports in the literature (Whanger et al., 2006, Knowles et al., 1999). After Se-
Met, the next most abundant species in TWG herbage was selenate, an inorganic form which accounted
for 2 – 16% of the extractable Se. Both of these results agree with Whanger (2002) who reported that Se-
Met is the major selenocompound in cereal grains (same family as tall wheatgrass- Poaceae) and grassland
legumes and that selenate is the predominant inorganic form of Se in both plants and animals. In
vegetables such as garlic, onion, broccoli florets and leeks, however, methylselenocysteine (another Se-
amino acid) has been reported to be the major species.
Bio-availability is a key characteristic to assess the potential for Se toxicity when cattle are grazing Se-
enriched forage and to assess the potential of using Se-enriched tall wheatgrass hay as a substitute for
sodium selenite supplements added to the diets of dairy cattle in Se-deficient areas. The benefit of this
substitution would be to reduce the importation of ‘new’ Se into the San Joaquin Valley in the form of
feed supplements.

3
II. ABBREVIATIONS
CWR creeping wildrye (Leymus triticoides)
DM dry matter
NRC National Research Council
ppm part per million (= mg/L, water and mg/kg dry weight, for plant tissue and soil)
ppb part per billion (= ug/L, water and ug/kg dry weight, for plant tissue and soil)
RP-ICP-CRC-MS reverse phase, inductively coupled plasma, mass spectrometry using a collision
reaction cell.
SJV San Joaquin Valley
TMR total mixed ration (for a confined animal)
TWG tall wheatgrass (Thinopyrum ponticum var. ‘Jose’)
Se-Met selenomethionine
MeSe-Cys methylselenocysteine
MeSe(IV) methylseleninic acid
SeMetO selenomethionine oxide
Tot-Se total selenium
III. PROJECT DESCRIPTION
The research described in this report is an extension of a larger study (Agreement 4600003430) funded
by the Proposition 204 Agricultural Drainage Program which was entitled “Animal Evaluation of Salt
Tolerant Forages Irrigated with Saline Drainage Water: forage quality, persistence under grazing,
digestibility and intake by Cattle”. The objectives of this study conducted at Red Rock Ranch in 2007 and
2008 were to investigate selenium (Se) accumulation in beef cattle (blood, liver, muscle tissue) grazing
forages (‘Jose tall wheatgrass and creeping wildrye) irrigated with saline drainage water high in Se and
sulfur. Potential risks to ruminant health were examined in the context of the exposure period and forage
dry matter (DM) consumption. Results of this study were submitted in ten reports with the last submitted
in August 2010. They are also summarized in the Introduction (section IV) of this report and they were
published as a peer-reviewed article in Science of the Total Environment (Juchem et al. 2012). Grazing as
an Alternative for Utilization of Saline-sodic Soils in the San Joaquin Valley: Selenium accretion and
performance of beef heifers. Sci. Total Environ. 419(1): 44-53 which is provided in Appendix 1.
Upon completion of the grazing study, we identified the need to identify the chemical forms of Se in ‘Jose’
tall wheatgrass so as to better assess its bio-availability in a nutritional sense, and the potential for Se
toxicity in grazing cattle. Se Speciation was also a key issue for a companion study funded by the California
State University Agricultural Research Initiative (CSU-ARI) which investigated the potential of using Se-
enriched tall wheatgrass (TWG) hay as a substitute for the mineral supplement (sodium selenite) which is
fed to dairy cattle in the eastern San Joaquin Valley (SJV) where soils and irrigation water can be deficient

4
in selenium. To substitute for these mineral Se supplements, the Se in TWG hay would need to have
similar bio-availability to sodium selenite.
Thus, the task order objective for this study (agreement 4600008986) which ran from Nov. 2010 to Jan.
2014 was to:
Determine the major forms of selenium (Se) present in ‘Jose’ tall wheatgrass herbage (forage
samples conducted during the period that the beef cattle grazed the pastures at Red Rock
Ranch).
IV. INTRODUCTION
Grazing Study (Se toxicity)
The aim of the “Red Rock Ranch Grazing Study” was to investigate selenium (Se) accumulation in beef
cattle grazing ‘Jose’ tall wheatgrass (Thinopyrum ponticum, var. ‘Jose’ = TWG) and creeping wildrye
(Leymus triticoides = CWR) pastures irrigated with saline drainage water enriched in selenium and sulfur.
Prior research (Suyama et al., 2007a) had shown very high levels of Se in these forages relative to animal
requirements. Indeed from 2002 to 2004 in pastures abundantly irrigated with Se-enriched drainage
water (300-600 ppb), ‘Jose’ Tall Wheatgrass had an average of 6.12 ppm total Se in the herbage and
creeping wild rye had 10.7 ppm which are far above the dietary requirement of 0.3 ppm Se (NRC, 2001).
This study was run for two grazing seasons (2007 and 2008; 190 and 165 days) with a new herd of heifers
(6-8 months old at the start of grazing) each year. Unfortunately, these grazing seasons corresponded to
drought years when saline drainage water was scarce and the pastures, particularly in 2008 were deficit-
irrigated, which reduced Se concentrations in the forage to 4 ppm (TWG) and 2.5 ppm (CWR) and thus,
the Se exposure for the cattle grazing them. Nevertheless, the cattle demonstrated large increases in Se
in blood (2 to 3 fold), liver (8 to 12 fold) and muscle (9 to 17 fold) during the grazing seasons. In spite of
what were clinically toxic levels of Se in the animal tissues based on published guidelines, the heifers had
moderate weight gains (1.30 lb/day (0.59 kg/day) for TWG-grazed and 0.60 lb/day (0.27 kg/day) for CWR-
grazed heifers) in 2007. In 2008 with a new group of heifers, weight gains were lower overall (0.60 lb/day
(0.27 kg/day) for TWG-grazed and 0.79 lb/day (0.36 kg/day) for CWR-grazed) which was likely due to low
forage availability and low crude protein in the forage, rather than Se toxicity. Nitrogen fertilizer had not
been applied to these pastures because the saline drainage water used in earlier years contained high
levels of nitrate. However, with the small volume of drainage water applied to the pastures in 2008, the
forages had insufficient levels of crude protein to support higher body weight gains. In 2008, the beef
heifers were also border-line copper deficient, but after careful analysis of the literature and the potential
impacts of moderate Cu deficiency on cattle weight gains, it was concluded that the low body weight gains
in 2008 were primarily due to insufficient nutrient content in the forages rather than the low Cu levels in
the forages.

5
The overall conclusion of the grazing study was that TWG and CWR forage containing up to 4 ppm total
Se in the dry matter did not cause beef heifers to develop signs of Se toxicity (deformed hooves, loss of
hair, diarrhea or sudden death) and that exposing non-pregnant, non-breeding cattle to these high Se
forages for a grazing season of 6 to 7 months would not likely result in death, or even negative impacts
on animal health or productivity, due to Se intoxication. At this very high level of Se exposure, potential
micro-mineral imbalances in forages grown in soils irrigated with saline drainage water were judged to be
a more relevant concern for animal health and performance (i.e. body weight gain). Therefore, depending
on the outcome of forage quality analyses, macro- and micro-mineral supplementation should be
considered for cattle grazing these Se-enriched forages so as to optimize their performance and to
minimize the risk of undesirable metabolic conditions, particularly hypomagnesia and copper deficiency.
While subsurface agricultural drainage water can provide high levels of nitrogen (N) to growing forages,
application of supplemental N sources should be considered if needed to sustain adequate forage
production and crude protein, as well as body weight gains for the cattle.
This production system could also provide an economic opportunity for ranchers to produce “value-added
beef” with higher levels of Se (an antioxidant with potential anti-cancer activity, Whanger et al. (2006),
which is considered to be low in the diets of Americans), utilizing saline soils and/or saline drainage waters
not suitable for the production of higher value, salt-sensitive crops. One should point out, however, that
not all saline drainage waters are enriched in selenium—some may be high in molybdenum or other trace
elements—thus utilization of saline waters for this type of niche product requires adequate testing of soil,
water, forage, and even animal tissues.
Dairy cattle feeding study (bio-availability of Se in tall wheatgrass hay)
Unlike the western San Joaquin Valley (SJV), soils in the eastern SJV tend to be deficient in Se as are the
forages grown on them. A common practice for dairy producers in the eastern SJV is to add a
supplemental Se source to the diet, which is often sodium selenite. Thus, the question arose as to
whether Se-enriched tall wheatgrass hay could substitute for these dietary supplements and thereby
reduce importation of ‘new’ Se into the SJV. This also raised the issue of the bio-availability of the Se in
TWG hay as compared to that in sodium selenite, and ultimately there arose the need to speciate the
selenium in order to assess its bio-availability. Our dairy cattle feeding study is briefly described here as
the speciation work funded by DWR is relevant to this study.
This study was conducted from February to May 2012 on a commercial dairy farm located near Hanford,
CA (U.S.A). There were three dietary treatments: (1) Control = baseline diet Se, targeted at 0.3 - 0.4 ppm
Se from the normal feedstuffs in the diet, (2) TWG = supplemental Se in the form of Se-enriched (4.65
ppm) tall wheatgrass hay added to the diet at 4.6% of dry matter (DM) and (3) Sodium selenite (SS) =
supplemental Se in the form of a premix (10 g SS/kg ground corn) added to the diet at 4.3 g/kg DM. Both
Se supplements were designed to increase the dietary Se level by 0.3 ppm of DM over the control.
However due to variability in Se content between the initial sample and the 45 tons of TWG hay used in
the study, the final diets had slightly more Se in the SS diet (0.65 mg Se/kg DM) than in the TWG diets
(0.53 mg/kg), but both were substantially increased over the control diet (0.35 mg/kg). Three similar pens,

6
each containing 310 primiparity, pregnant, mid-lactation dairy cows were used. The experiment was a 3
x 3 Latin square design consisting of the three dietary treatments and three pens. A dietary treatment was
randomly assigned to each pen prior to the first period and the treatments were then rotated after 28
and 56 d such that each pen of cows sequentially received all dietary treatments. Se accumulation in
blood, urine and feces was measured to assess its bioavailability amongst the three diets. Se output in
milk was also measured in order to calculate a mass balance for Se for each of the three diets.
Feeding Se-enriched TWG hay increased Se in the dairy cattle whole blood by 6.4% over the control,
whereas sodium selenite increased it by only 4.8%, which suggested higher bioavailability for Se in TWG
hay vs. sodium selenite. However, a complete Se response in whole blood may require a time span equal
to the average life span of red blood cells, which in cattle is 90-120 d, longer than the 28 day exposure
periods for each of our diets. Furthermore, based on the fecal and urine data, a different conclusion was
reached. Several methods for determining the amount of dietary Se that was digested (and not excreted)
were examined and it was concluded that calculation of the “marginal outputs” (i.e. Se from the TWG hay
or the SS supplement, rather than Se in the whole diet, that was excreted in milk, urine and feces) was
the best measure because its inverse (that not excreted) specifically measures the bioavailability of the
supplemented Se. Using marginal Se not excreted in feces as a measure of Se bioavailability, the Se in SS
had a higher Se bioavailability (72.5%) than did the Se in TWG (55.1%).
Interestingly, marginal Se output data also showed that when the dietary Se supplement was from TWG
hay, the milk output was 3.0% of the supplemented Se, whereas for the inorganic Se source (SS), the milk
Se output was only 0.6%. This higher milk output with the TWG vs. SS diet suggests that the Se in TWG
hay may have been more effectively incorporated into milk than was the Se in SS. Similar to Se-enriched
meat, milk enriched in Se could have some health benefits due to its antioxidative properties which can
protect against cancer and its involvement in the immune system (Combs, 2001; Whanger, 2006). In fact,
supplementation of cow’s milk with Se to create a dietary Se supplement for humans already occurs in
some countries.
Overall, results from this study suggested that the inorganic Se source (sodium selenite) was more
bioavailable than the organic Se source (TWG hay); although both would be considered to have high
bioavailability, in general. However, our results also indicated potential benefits of utilizing Se-enriched
TWG hay as a bioavailable Se source in dairy cattle, including increased milk production as compared to
no supplementation. TWG hay can by produced using saline irrigation water and if that water is high in
Se, a value-added, Se-enriched forage product could be produced. Use of Se-enriched TWG hay in place
of SS represents a translocation option for Se from the westside to the eastside of the SJV, thereby
reducing importation of ‘new’ Se into the Valley in the form of dietary supplements for dairy cattle. This
is important because virtually all of this ‘new’ Se is excreted in animal urine and feces and can only leave
the SJV in surface waters or by leaching.
A manuscript describing this work has been drafted and will be submitted to the academic journal
“Science of the Total Environment” (Elsevier Publishing) in October, 2014.

7
Se biochemistry in plants and animals
Se biochemistry is extremely complex with two main forms of inorganic Se (selenate and selenite), but
several more complex organic forms (Lauchli, 1993; Sors et al. 2005; Terry et al., 2000). Figure 1 shows
that in non-accumulator plants, which includes most crop plants and the forages investigated in our
studies, inorganic Se can be incorporated into Se-amino acids such as selenocysteine (Se-Cys) and
selenomethionine (Se-Met) and in turn, these forms can be incorporated in selenoproteins in plants.
Fig. 1. Selenium assimilation in accumulator plants vs. assimilation in non-accumulator species,
marine algae, many bacteria and yeast (from Marschner, 1995 and Schrauzer, 2000).
When present in high concentrations, incorporation of Se-amino acids can lead to dysfunctional amino
acids in plants and other organisms, but at low concentrations, beneficial selenoproteins occur, such as
glutathione peroxidase which protects cells against reactive oxygen species. This enzyme is present in
animals and algae, but its occurrence in plants has not been clearly demonstrated (Lauchli, 1993).
Whanger, who has published extensively on the forms and functions of Se compounds in plants and
animals, states that the selenocompounds present in plants have a profound effect on the health of
animals and humans, and that the total Se content in plants cannot be used as an indicator of its efficacy,
but that speciation (measurement of individual selenocompounds) is critical to interpretation of Se effects
in the environment. And, because animals and humans consume plant materials either directly or
indirectly, this makes the knowledge of the specific selenocompounds in plants even more critical
(Whanger, 2006; Rayman, 2008).
Studies have shown the total net apparent absorption (i.e., bioavailability) of Se from the small intestine
was about 85% of ingested Se in pigs but only 35% in sheep (Wright and Bell, 1966) and 51% in lactating
dairy cows (Ivancic and Weiss, 2001). The less efficient intestinal Se absorption in ruminants vs.
monogastrics is largely due to the reduction of selenite to insoluble forms such as selenide and elemental
Se by rumen microorganisms (Butler and Peterson, 1961; Van Ryssen, 1989). Total net absorption
(digestibility) calculated in our dairy cattle feeding study was similar for the diet supplemented with TWG
hay and the control diet (49.4% vs. 46.7%, respectively), but it was higher (58.0 %) for the diet
supplemented with sodium selenite.
8
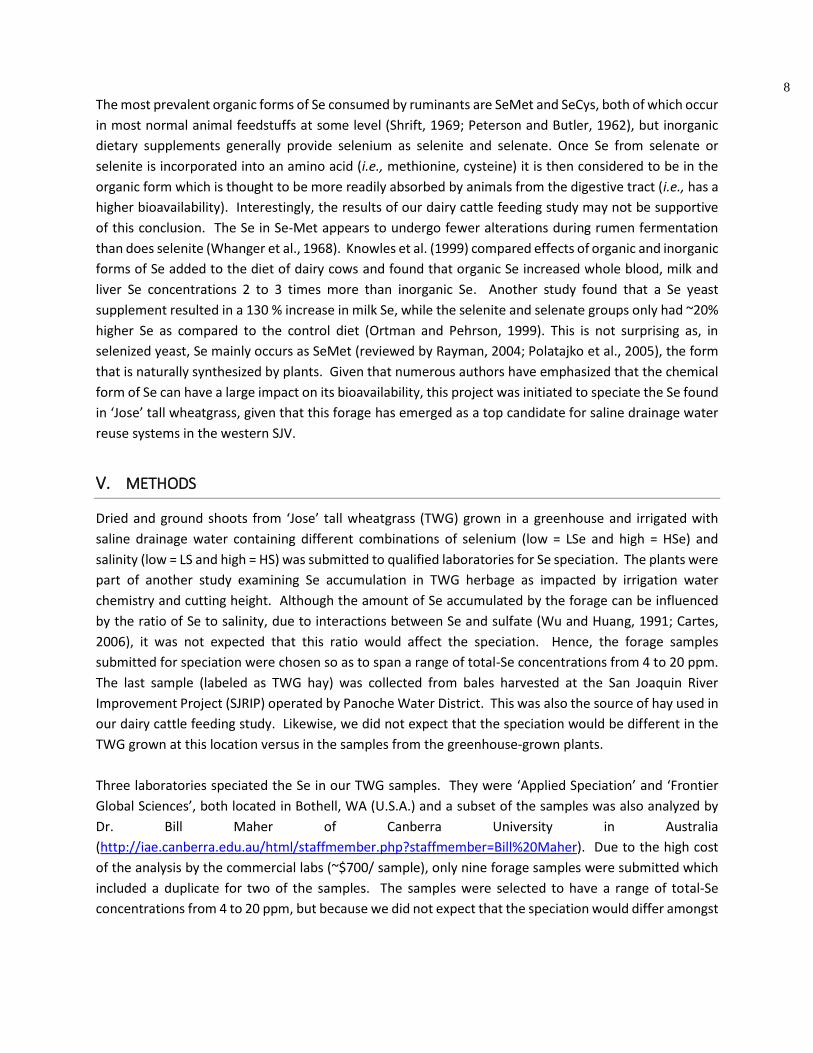
The most prevalent organic forms of Se consumed by ruminants are SeMet and SeCys, both of which occur
in most normal animal feedstuffs at some level (Shrift, 1969; Peterson and Butler, 1962), but inorganic
dietary supplements generally provide selenium as selenite and selenate. Once Se from selenate or
selenite is incorporated into an amino acid (i.e., methionine, cysteine) it is then considered to be in the
organic form which is thought to be more readily absorbed by animals from the digestive tract (i.e., has a
higher bioavailability). Interestingly, the results of our dairy cattle feeding study may not be supportive
of this conclusion. The Se in Se-Met appears to undergo fewer alterations during rumen fermentation
than does selenite (Whanger et al., 1968). Knowles et al. (1999) compared effects of organic and inorganic
forms of Se added to the diet of dairy cows and found that organic Se increased whole blood, milk and
liver Se concentrations 2 to 3 times more than inorganic Se. Another study found that a Se yeast
supplement resulted in a 130 % increase in milk Se, while the selenite and selenate groups only had ~20%
higher Se as compared to the control diet (Ortman and Pehrson, 1999). This is not surprising as, in
selenized yeast, Se mainly occurs as SeMet (reviewed by Rayman, 2004; Polatajko et al., 2005), the form
that is naturally synthesized by plants. Given that numerous authors have emphasized that the chemical
form of Se can have a large impact on its bioavailability, this project was initiated to speciate the Se found
in ‘Jose’ tall wheatgrass, given that this forage has emerged as a top candidate for saline drainage water
reuse systems in the western SJV.
V. METHODS
Dried and ground shoots from ‘Jose’ tall wheatgrass (TWG) grown in a greenhouse and irrigated with
saline drainage water containing different combinations of selenium (low = LSe and high = HSe) and
salinity (low = LS and high = HS) was submitted to qualified laboratories for Se speciation. The plants were
part of another study examining Se accumulation in TWG herbage as impacted by irrigation water
chemistry and cutting height. Although the amount of Se accumulated by the forage can be influenced
by the ratio of Se to salinity, due to interactions between Se and sulfate (Wu and Huang, 1991; Cartes,
2006), it was not expected that this ratio would affect the speciation. Hence, the forage samples
submitted for speciation were chosen so as to span a range of total-Se concentrations from 4 to 20 ppm.
The last sample (labeled as TWG hay) was collected from bales harvested at the San Joaquin River
Improvement Project (SJRIP) operated by Panoche Water District. This was also the source of hay used in
our dairy cattle feeding study. Likewise, we did not expect that the speciation would be different in the
TWG grown at this location versus in the samples from the greenhouse-grown plants.
Three laboratories speciated the Se in our TWG samples. They were ‘Applied Speciation’ and ‘Frontier
Global Sciences’, both located in Bothell, WA (U.S.A.) and a subset of the samples was also analyzed by
Dr. Bill Maher of Canberra University in Australia
(http://iae.canberra.edu.au/html/staffmember.php?staffmember=Bill%20Maher). Due to the high cost
of the analysis by the commercial labs (~$700/ sample), only nine forage samples were submitted which
included a duplicate for two of the samples. The samples were selected to have a range of total-Se
concentrations from 4 to 20 ppm, but because we did not expect that the speciation would differ amongst

9
them, it was concluded that nine samples would be sufficient to identify the major forms of extractable
Se in ‘Jose’ tall wheatgrass herbage.
The methodology employed by ‘Applied Speciation’ was:
Sample Reception: Nine TWG samples were submitted for total Se and Se speciation analyses. The lab
reported that the samples were received in acceptable condition on March 6, 2012 in a sealed container
at ambient temperature. They were received in a laminar flow clean hood void of trace metals
contamination and ultra-violet radiation, assigned discrete sample identifiers and acid-digested. All
samples were then stored in a cryofreezer with a temperature of less than -80oC, known to be free from
trace metal contamination, until Se speciation could be completed.
Sample Preparation: All sample preparation was conducted in laminar flow clean hoods known to be free
from trace metal contamination. All applied water for dilutions and sample preservatives was monitored
for contamination to account for biases associated with sample results.
Total Selenium Analysis by ICP-DRC-MS: Approximately 0.1 g of each sample was transferred to a
polypropylene centrifuge tube followed by the addition of 2mL HNO3. All sample digests were placed in
a hot block digestion apparatus, the temperature of which was slowly increased to 100°C. After 1 hour at
100°C, all samples were removed from the hot block, cooled, and 6.7mL of HCl was added. All sample
digests were placed back in the hot block digestion apparatus at 100oC for 30 minutes. The sample digests
were then boiled down to a thin film. Samples were allowed to cool, 5mL of H2O2 was added, and the
sample digests were heated at 100oC for 1 hour. Samples were removed from the hot block digestion
apparatus and allowed to cool. All sample digests were analyzed by inductively coupled plasma dynamic
reaction cell mass spectrometry (ICP-DRC-MS).
Selenium Speciation by RP-ICP-CRC-MS: Approximately 0.1 g of each sample was transferred to a
polypropylene centrifuge tube followed by the addition of 10 mL of ultra pure deionized water and
enzymes. The solution was mixed with a sonic wand for 5 minutes. The resulting solutions were filtered
and analyzed by RP-ICP-CRC-MS (reverse phase, inductively coupled plasma mass spectrometry using a
collision reaction cell).
Sample Analysis: All sample analysis was precluded by a minimum of a five-point calibration curve
spanning the concentration range of interest. Calibration curves were performed at the beginning of each
analytical day. All calibration curves, associated with each species of interest, were standardized by linear
regression resulting in the response factor.
All sample results were instrument blank-corrected to account for any operational biases associated with
the analytical platform. Prior to sample analysis, all calibration curves were verified using second source
standards identified as initial calibration verification standards (ICV). Ongoing instrument performance
was identified by analysis of continuing calibration verification standards (CCV) and continuing calibration
blanks (CCB) at a minimal interval of every ten analytical runs.

10
Total Selenium Quantification by ICP-DRC-MS: All samples for total selenium quantification were
analyzed by inductively coupled plasma dynamic reaction cell mass spectrometry (ICP-DRC-MS) on April
19, 2012. Aliquots of each sample were introduced into a radio frequency (RF) plasma where energy-
transfer processes cause desolvation, atomization and ionization. Ions were extracted from the plasma
through a differentially-pumped vacuum interface and then they traveled through a pressurized chamber
(DRC) containing a reactive gas which preferentially reacted with interfering ions of the same target mass
to charge ratios (m/z). A solid-state detector detects ions transmitted through the mass analyzer, on the
basis of their mass-to-charge ratio (m/z), and the resulting current is processed by a data handling system.
Selenium Speciation Analysis by RP-ICP-CRC-MS: Each sample for selenium speciation was analyzed by
reverse phase chromatography inductively coupled plasma collision reaction cell mass spectrometry (IC-
ICP-CRC-MS) on May 8, 2012. An aliquot of each sample was injected onto a reverse phase column and
mobilized by a neutral pH gradient. The eluting selenium species were then introduced into a radio
frequency (RF) plasma where energy-transfer processes cause desolvation, atomization, and ionization.
The ions are extracted from the plasma through a differentially-pumped vacuum interface and travel
through a pressurized chamber (CRC) containing a reaction gas which preferentially reacts with interfering
ions of the same target mass to charge ratios (m/z). A solid-state detector detects ions transmitted
through the mass analyzer and the resulting current is processed by a data handling system. Retention
times for each eluting species were compared to known standards for species identification.
The methodology employed by Bill Maher of Canberra University:
This laboratory used a protease to extract the samples (0.1 g protease/ 0.2 g of sample), incubating them
for 24 hours and then the Se species were separated using a PRP X100 anion exchange column. Detection
was by ICP-MS.
VI. RESULTS
Speciation results from ‘Applied Speciation Lab’ and from Bill Maher of Canberra University are in Tables
1 and 2, respectively. We are not presenting the results or describing above the analytical methods
employed by ‘Frontier Global Sciences’ because they had lower recoveries than did ‘Applied Speciation’
and they had poorer detection of Se-methionine which based on the literature should be a major Se
species in TWG. However, this lab was very helpful in discussing the low recoveries and the potential
reasons for them.
Applied Speciation Lab
This lab recovered (extracted) 45 – 60% and identified 31 – 47% of the total-Se measured in the forage
samples. The difference between these two percentages is due to the presence of unidentified Se in the
extract. The major form of Se in the extractable portion was selenomethionine (Se-Met) which
accounted for 21 to 31% of the total Se in the TWG samples. This agrees with Whangher (2002) who

11
reported that Se-Met is the major selenocompound in cereal grains, grassland legumes and soybeans. The
forages used in our studies (tall wheatgrass and creeping wildrye) are members of the same family as
cereal grains (Poaceae).
Table 1. Se speciation results for tall wheatgrass samples submitted to Applied Speciation and Consulting, LLC (Bothell, Washington).
After Se-Met, the next most abundant species in most of the extracts was selenate, an inorganic form of
Se, which accounted for 2 – 16% of extractable Se. Selenate represents Se that has not yet been
assimilated (converted into organic form). This also agrees with Whanger (2002), who reported that
selenate is the predominant inorganic form of Se in both plants and animals and that selenite is not found
in in any biological materials at high levels. This result also agreed with reports in the literature (Gissel-
Nielsen and Hamdy, 1977) that, in alkaline soils, inorganic Se occurs mainly as selenate which is rarely
fixed in soil and more available for uptake by plants. In contrast, a low soil pH favors the selenite form,
which is strongly fixed to soil clay particles and iron hydroxides. The soil in which the TWG was grown in
the greenhouse was alkaline (pH 7.8), as was true for the TWG pastures in Panoche Water District where
samples 8 and 9 were obtained.
For samples #2, 3, 6 and 7, methylseleninic acid, rather than selenate, was the second most abundant
species. Methaneseleninic acid, has been shown to have potent anticancer activity (Zhao, 2004), having
superior inhibitory activity in vivo against prostate cancer, compared to selenomethionine or selenite (ion)
(Li, 2008), and it enhances the efficacy of paclitaxel for treatment of breast cancer in women (Qi, 2012).
However, methylseleninic acid can be a breakdown product of Se-methylselenocysteine, and for our
samples, its levels were highest in the samples with higher levels of methylselenocysteine. Hence, it is
possible that this species formed during the sample digestion.
Bill Maher Canberra University
This researcher is very experienced with analyzing Se in sediment samples and he offered to extract and
analyze Se from our TWG samples. Dr. Maher’s recovery (% extraction) was slightly higher (60 – 72%)
than that of ‘Applied Speciation’, but the % of total Se identified was very low (12- 26%). With his

12
extraction and detection procedures, Se-Met was the only form identified, and it accounted for 8 - 22%
of total Se. Given that he identified a much lower % of the total Se, we feel that the results obtained by
‘Applied Speciation’, in which Se-Met accounted for 21 to 31% of the total Se in TWG, are more reliable.
The procedure used by Dr. Maher to extract the samples was probably not as suitable for plant samples
which have complex structural carbohydrates in their cell walls, as was the acid/peroxide digestion
process used by Applied Speciation.
Table 2: Se speciation results for tall wheatgrass samples submitted to Dr. Bill Maher,
Department of Environmental Chemistry, Canberra University, Australia.
VII. EVALUATION OF RESULTS
‘Applied Speciation’ recovered 45 to 60% of the total Se in the TWG samples which means that 40 to 55%
of the Se is unaccounted. One explanation is that some of this ‘missing Se’ is in selenoproteins that were
not degraded in the acid digestion and are retained on the columns and not eluted. ‘Frontier Global
Sciences’ also tried a basic (alkaline) digestion, but this it did not substantially increase the recoveries.
The fraction labeled as ‘unknown Se species’ in both Table 1 and 2 may include selenoamino acids other
than Se-methionine and methylselenocysteine. The separation protocols used by ‘Applied Speciation’ and
‘Frontier Global Sciences’ were meant for determination of these two species as well as selenate, selenite,
selenocyanate and methylseleninic acid. Separation schemes could be devised for other species, but it
would be very difficult to narrow them down without a generalized idea of what they are and because of
limitations in obtaining reference materials.
Whanger (2002) reported that conjugation of Se to different amino acids affects both its bioavailability
and metabolism. The most prevalent organic forms of Se consumed by ruminants are SeMet and SeCys,
both of which occur in most normal animal feedstuffs at some level (Shrift, 1969; Peterson and Butler,
1962), but inorganic dietary supplements generally provide Se as selenite and selenate. Once Se from
selenate or selenite is incorporated into an amino acid (i.e., methionine or cysteine) it becomes an organic
form, which is thought to be more readily absorbed by animals from the digestive tract (i.e., has a higher
bioavailability). Although results of our dairy cattle feeding study did not support a higher bioavailability

13
for the organic Se provided in TWG hay (as compared to the mineral supplement), we did find potential
benefits of utilizing Se-enriched TWG hay as a bioavailable Se source in dairy cattle, including increased
Se concentrations in whole blood and increased milk production as compared to no supplementation.
The National Research Council (NRC) has published guidelines on maximum tolerable concentration of Se
for animal diets (2 ppm, beef cattle (1996), and 5-40 ppm having the potential for chronic toxicity for dairy
cattle (2001)). Although Se is essential to animal metabolism, there are currently no guidelines regarding
the optimum Se concentration in cattle diets in the United States. Only a legal limit on additional
supplementation to the diet (over and above that in the feed ingredients) of 0.3 mg Se/kg DM (= ppm)
has been issued by the FDA. This would apply to mineral supplements such as sodium selenite, but not to
Se-enriched tall wheatgrass hay if incorporated into the total mixed ration (TMR) of dairy cattle. Care
would need to be taken in order to supplement at beneficial and not toxic concentrations. However, the
Se supplementation levels recommended by the NRC (2001) of 0.3 ppm may not be sufficient for optimal
animal metabolism because in our dairy cattle feeding study, increased milk and milk fat production
occurred in the cows fed both of our Se-supplemented diets (sodium selenite, 0.65 ppm and TWG, 0.53
ppm in the TMR). As milk production responses can only be expected in Se-deficient animals, these
responses suggest that the higher diet Se levels are needed to optimize animal metabolism. This could
legally be achieved by incorporating Se-enriched TWG hay into a TMR at a concentration greater than 0.3
ppm, but it could not be done with mineral supplements
VIII. SUMMARY AND CONCLUSIONS
Our TWG Se speciation indicates that in ‘Jose’ tall wheatgrass hay, the predominant form of extractable
Se is selenomethionine (Se-Met) and the second most abundant form is selenate, an inorganic form. In
some samples methylseleninic acid, rather than selenate, was the second most abundant species. Se-Met
is a form of Se consumed by ruminants in normal feedstuffs and selenate, along with selenite, is often fed
as a dietary supplement. Thus both of these Se species would be considered ‘bioavailable’ and neither
should pose a hazard to ruminant animals if fed at appropriate concentrations. In the case of grazing
animals, our study at Red Rock Ranch demonstrated that TWG and CWR forage containing up to 4 ppm
total Se in the dry matter did not cause beef heifers to develop signs of Se toxicity and exposing non-
pregnant, non-breeding cattle to these Se-enriched forages for a grazing season of 6 to 7 months would
not result in death due to Se intoxication, or even negative impacts on animal metabolism. Weight gains
were acceptable for the cattle as long as the forage availability and nutrient content was adequate in the
TWG and micromineral levels were adequate in the cattle. Methylseleninic acid should also have high
bioavailability given that it has been shown to increase the efficacy of a drug used to protect against breast
cancer in women. With regard to the Se not recovered by our extraction procedures, it is likely that much
of it is present in selenoproteins in the forage tissues. In the digestive tract of ruminants, these
selenoproteins would be degraded into simpler forms such as Se-Met and selenate, making it unlikely that
the Se in TWG that was not extracted and speciated would have negative impacts on ruminant animal
health.

14
The reduction of biologically-active Se from the environment by immobilization into sediments in
wetlands, or its incorporation into plant tissues used as ruminant feed is generally considered to reduce
the potential for ecotoxicological effects of Se in the environment (Wu, 2004), particularly for aquatic
organisms and waterfowl that have a greater risk of Se toxicity (Ohlendorf, 1986).
Forage production using Se-laden drainage waters for irrigation represents a viable option to translocate
Se from areas in the SJV where it is present in concentrations that pose an environmental hazard and
move it into animal feeds that have agronomic value or in the case of Se-enriched beef or milk, that may
be beneficial to human health. In the case of substituting Se-enriched tall wheatgrass hay for sodium
selenite supplements, this would reduce importation of ‘new’ Se into the eastern SJV in the form of dietary
supplements for dairy cattle.
IX. FUTURE WORK
To identify a portion of what remains as the unknown species in our Se speciation work with ‘Jose’ tall
wheatgrass, Dr. Joy Goto (Department of Chemistry at Fresno State) has agreed to work on improving the
extraction procedure. This research does not have funding at present, but we would like to continue,
perhaps as a thesis project for a master’s degree student. Her work plan can be described as:
Assuming the selenium in the forage sample is bound as a selenoprotein, I plan to use a combination
of one-dimensional isoelectric focusing (1-D IEF), two-dimensional sodium dodecyl sulfate-poly
acrylamide gel electrophoresis (2D SDS-PAGE), followed by laser ablation inductively coupled plasma-
mass spectrometry (LA ICP-MS), and then finally with an high performance liquid chromatography with
tandem mass spectrometry (HPLC with quadrupole MS-MS) methods. The main idea is there are many
proteins in the forage samples, and if we can first separate the sample to localize just the selenium-
containing regions then we can narrow our focus to identify the selenium-bound proteins.
These various separation, isolation and mass instruments are used to first define the range of
important selenium specific proteins in the forage samples. Forage samples will first be extracted with
sonication in a neutral pH buffer and the solubilized material will be discarded. Then the final pellet
will be extracted with detergent to release the insoluble or Se-bound proteins which will then be
separated by isoelectric point (IEF range of pH range 3-10) followed by a second dimension separation
using an SDS-PAGE gel to separate proteins based on molecular weight. This gel will then be stained
with Coomassie blue and laser ablated to sample various spots for their selenium metal content (LA
ICP-MS), to produce a ‘map’ of the selenium containing proteins. A second 2D forage sample gel (also
Coomassie stained to identify the spots) will then be used to pick selenium-containing spots from the
identical gel for analysis by HPLC MS-MS. This final mass spectrometry step will allow us to identify the
proteins co-localizing, or perhaps even binding, to selenium.

15
The protocol and procedures are based on the research of Bianga, et al., (Analytical Chemistry 2013,
85:2037-2043) which used the same sequence of instruments to characterize selenium incorporated
into wheat proteins. The key to this sequence of separations and identifications is using LA ICP-MS
(capable of detecting metals in the attomole range (10-18 moles)), to narrow the region of interest to
only the selenium-containing proteins. Bianga et al., report on analyzing wheat with only a 43
microgram/g (ppb) dry weight of Se, with 53% in the water-insoluble portion. Our preliminary metal
content data also shows that ~50% of the total materials contain selenium in the insoluble portion of
the extracted sample. If we utilize these same techniques, we will hopefully be able to identify the
selenium-containing proteins in the TWG forage samples.
X. ACKNOWLEDGEMENTS
The authors sincerely thank the California Department of Water Resources for funding under the
Proposition 204, Agricultural Drainage Program. We also thank the California State University Agricultural
Research Initiative (CSU-ARI) for funding a companion dairy cattle feeding study with ‘Jose’ tall wheatgrass
which provided further impetus for Se speciation. Grace Cun, former graduate student at California State
University, Fresno is acknowledged for the excellent review of Se biogeochemistry (soil, water, plant and
animal) compiled for her thesis submitted to CSU Fresno in June 2014 which provided valuable
information for the interpretation phase of this study.
XI. LITERATURE CITED
1. Bianga, J., Govasmark, E., Szpunar, J., Characterization of Selenium Incorporation into Wheat Proteins by Two-Dimensional Gel Electrophoresis- Laser Ablation ICP-MS followed by capillary HPLC-ICP MS and Electrospray Linear Trap Quadrupole Orbitrap MS. Analytical Chemistry 2013, 85:2037-2043.
2. Butler, G. W., Peterson. P.J., 1961. Aspects of the fecal excretion of selenium by sheep. New Zealand Journal of Agricultural Research 4, 484-491.
3. Cartes, P., Shene, C., Mora, M., 2006. Selenium distribution in ryegrass and its antioxidant role as affected by sulfur fertilization. Plant and soil 285, 187-195.
4. Cun, G., 2014. Bioavailability of Selenium in ‘Jose’ Tall Wheatgrass (Thinopyrum ponticum var ‘Jose’)
Hay as a Substitute for Sodium Selenite in the Diets of Dairy Cattle. M.S. Degree Thesis, California
State University, Fresno. http://ecollections.lib.csufresno.edu/theses/.
5. Gissel-Nielsen, G., Hamdy, A.A., 1977. Leaching of added selenium in soils low in native selenium. Z Pflanzenernaehr Bodenkd 140, 193-198.
6. Ivancic, J. and Weiss, W.P., 2001. Effect of dietary sulfur and selenium concentrations on selenium balance of lactating Holstein cows. Journal of Dairy Science 84, 225-232.
16
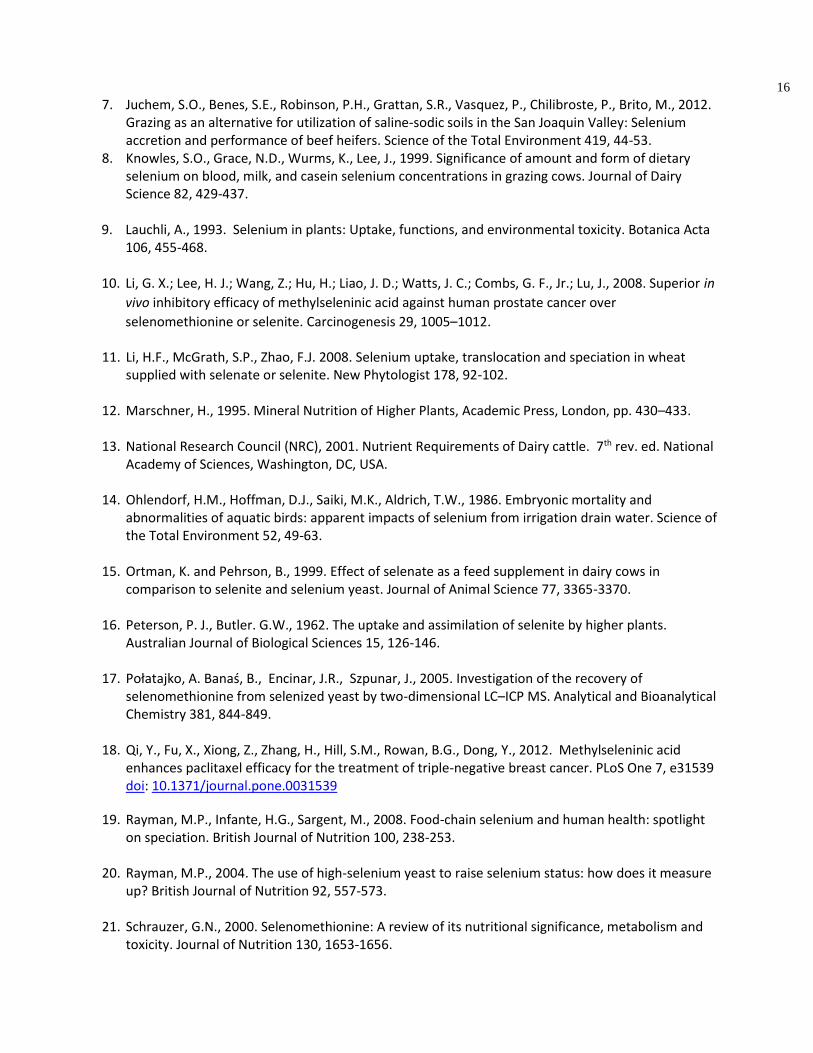
7. Juchem, S.O., Benes, S.E., Robinson, P.H., Grattan, S.R., Vasquez, P., Chilibroste, P., Brito, M., 2012. Grazing as an alternative for utilization of saline-sodic soils in the San Joaquin Valley: Selenium accretion and performance of beef heifers. Science of the Total Environment 419, 44-53.
8. Knowles, S.O., Grace, N.D., Wurms, K., Lee, J., 1999. Significance of amount and form of dietary selenium on blood, milk, and casein selenium concentrations in grazing cows. Journal of Dairy Science 82, 429-437.
9. Lauchli, A., 1993. Selenium in plants: Uptake, functions, and environmental toxicity. Botanica Acta 106, 455-468.
10. Li, G. X.; Lee, H. J.; Wang, Z.; Hu, H.; Liao, J. D.; Watts, J. C.; Combs, G. F., Jr.; Lu, J., 2008. Superior in
vivo inhibitory efficacy of methylseleninic acid against human prostate cancer over
selenomethionine or selenite. Carcinogenesis 29, 1005–1012.
11. Li, H.F., McGrath, S.P., Zhao, F.J. 2008. Selenium uptake, translocation and speciation in wheat supplied with selenate or selenite. New Phytologist 178, 92-102.
12. Marschner, H., 1995. Mineral Nutrition of Higher Plants, Academic Press, London, pp. 430–433. 13. National Research Council (NRC), 2001. Nutrient Requirements of Dairy cattle. 7th rev. ed. National
Academy of Sciences, Washington, DC, USA.
14. Ohlendorf, H.M., Hoffman, D.J., Saiki, M.K., Aldrich, T.W., 1986. Embryonic mortality and abnormalities of aquatic birds: apparent impacts of selenium from irrigation drain water. Science of the Total Environment 52, 49-63.
15. Ortman, K. and Pehrson, B., 1999. Effect of selenate as a feed supplement in dairy cows in
comparison to selenite and selenium yeast. Journal of Animal Science 77, 3365-3370. 16. Peterson, P. J., Butler. G.W., 1962. The uptake and assimilation of selenite by higher plants.
Australian Journal of Biological Sciences 15, 126-146. 17. Połatajko, A. Banaś, B., Encinar, J.R., Szpunar, J., 2005. Investigation of the recovery of
selenomethionine from selenized yeast by two-dimensional LC–ICP MS. Analytical and Bioanalytical Chemistry 381, 844-849.
18. Qi, Y., Fu, X., Xiong, Z., Zhang, H., Hill, S.M., Rowan, B.G., Dong, Y., 2012. Methylseleninic acid
enhances paclitaxel efficacy for the treatment of triple-negative breast cancer. PLoS One 7, e31539 doi: 10.1371/journal.pone.0031539
19. Rayman, M.P., Infante, H.G., Sargent, M., 2008. Food-chain selenium and human health: spotlight on speciation. British Journal of Nutrition 100, 238-253.
20. Rayman, M.P., 2004. The use of high-selenium yeast to raise selenium status: how does it measure up? British Journal of Nutrition 92, 557-573.
21. Schrauzer, G.N., 2000. Selenomethionine: A review of its nutritional significance, metabolism and
toxicity. Journal of Nutrition 130, 1653-1656.

17
22. Scholz, R.W. and Hutchinson, L.J., 1979. Distribution of glutathione peroxidase activity and
selenium in the blood of dairy cows. America Journal of Veterinary Research 40, 245-249. 23. Shrift, A., 1969. Aspects of selenium metabolism in higher plants. Annual Review of Plant
Physiology 20, 475–495.
24. Sors, T.G., Ellis, D.R., Salt, D.E., 2005. Selenium uptake, translocation, assimilation and metabolic fate in plants. Photosynthesis Research 86, 373-389.
25. Suyama, H. Benes, S.E., Robinson, P.H., Grattan, S.R., Gretachew, G., Grieve, C.M., 2007a. Biomass
yield and nutritional quality of forage species under long-term irrigation with saline-sodic drainage water: Field evaluation. Animal Feed Science and Technology 135, 329-345.
26. Terry N., Zayed A.M., de Souza M.P., Tarun A.S., 2000. Selenium in higher plants. Annual Review of
Plant Physiology and Plant Molecular Biology 51, 401-432. 27. Van Ryssen, J.B.J., Deagen, J.T., Beilstein, M.A., Whanger, P.D., 1989. Comparative metabolism of
organic and inorganic selenium by sheep. Journal of Agricultural Food Chemistry 37, 1358-1363. 28. Whanger, P., Weswig, P.H., Muth, O.H., 1968. Metabolism of 75Se-selenite, and
75Seselenomethionine by rumen microorganisms. Federal Proceedings 27, 418 (abstr.). 29. Whanger, P.D., 2002. Selenocompounds in Plants and Animals and their Biological Significance.
Journal of the American College of Nutrition 21, 223-232. 30. Whanger, P.D. 2006. Relationship of Selenium Intake to Cancer. In: Nutrition and Cancer
Prevention. A.S. Award and P.G. Bradford (eds.). CRC, Taylor and Francis Group, Boca Raton, FL. 31. Wright, P.L. and Bell, M.C., 1966. Comparative metabolism of selenium and tellurium in sheep and
swine. American Journal of Physiology 211, 6-10. 32. Wu, L., 2004. Review of 15 years of research on ecotoxicology and remediation of land
contaminated by agricultural drainage sediment rich in selenium. Ecotoxicology and Environmental Safety 57, 257-269.
33. Zhao, H.; Whitfield, M. L.; Xu, T.; Botstein, D.; Brooks, J. D., 2004. Diverse effects of methylseleninic
acid on the transcriptional program of human prostate cancer cells. Molecular Biology of the Cell,
2004, 15, 506–519. doi:10.1091/mbc.E03–07–0501
XII. APPENDIX 1 – publication of results of our grazing study

Science of the Total Environment 419 (2012) 44–53
Contents lists available at ScienceDirect
Science of the Total Environment
j ourna l homepage: www.e lsev ie r.com/ locate /sc i totenv
Grazing as an alternative for utilization of saline-sodic soils in the San Joaquin Valley:Selenium accretion and performance of beef heifers
Sérgio O. Juchem a,b,⁎, Sharon E. Benes b, P.H. Robinson a, Stephen R. Grattan c, Pablo Vasquez b,Pablo Chilibroste d, Martin Brito b
a Department of Animal Science, University of California, Davis, CA 95616, USAb Department of Plant Science, California State University, Fresno, CA 93740-8033, USAc Department of Land and Water Resources, University of California, Davis, CA 95616, USAd Instituto Nacional de Investigación Agropecuária, Paysandu, Uruguay
Abbreviations: ADF, acid detergent fiber; ADICP, aprotein; aNDF and aNDF (om), neutral detergent fibwithout residual ash, respectively; CP, crude proteinelectrical conductivity; ECe, electrical conductivity of a saAES, inductively coupled plasma atomic emission spdetermination utilizing sulfuric acid; ME, metaboliResearch Council; SAR, sodium adsorption ratio; TWG, t⁎ Corresponding author at: Empresa Brasileira de Pe
Pecuária Sul, BR 153 Km 595, Vila Industrial, 96401-970Tel.: +55 53 32404650; fax: +55 53 32404651.
E-mail address: [email protected] (S.O. Juchem)
0048-9697/$ – see front matter © 2011 Elsevier B.V. Adoi:10.1016/j.scitotenv.2011.06.016
a b s t r a c t
a r t i c l e i n f oArticle history:Received 22 February 2011Received in revised form 3 June 2011Accepted 7 June 2011Available online 28 January 2012
Keywords:SalinitySelenium toxicityDrainage water reuseTall wheatgrassSalt-tolerant foragesLiver biopsy
Two experiments were conducted to evaluate Se accumulation and health of non-pregnant, non-breeding beefcattle grazing on forages with a high Se content due to irrigation with saline drainage water. Heifers grazedexperimental pastures of “Jose” tall wheatgrass (TWG; Thinopyrum ponticum var. “Jose”) and creeping wildrye(CWR; Leymus triticoidesvar. “Rio”) for190 days inExperiment1 (2007) and for 165 days in Experiment 2 (2008).In experiment 1,meanSe concentrationswere similar in TWGandCWRherbage (4.0 versus 3.7±0.26 mg/kg dryweight; p=0.34) as was crude protein (113 versus 114±7.9 g/kg dry weight; p=0.94). Concentrations of Se inblood increased by300%during the grazing period, andwere similar for heifers grazing the TWGorCWRpastures(0.94 versus 0.87±0.03 mg/kg; p=0.89). Heifers grazing on TWG gained more body weight than did heifersgrazing on CWR (0.59 versus 0.27±0.07 kg/days; pb0.01). In experiment 2, concentration of Se (4.0 versus2.8 mg/kg±0.19 mg/kg dry weight; pb0.01) and crude protein (79 versus 90±5.6 g/kg dry weight; pb0.01)differed, for TWG and CWR, respectively. Within 20 days, Se concentrations in blood had increased by 300% andby nearly 200% in heifers grazing on TWG or CWR. All data cited are least square means±standard error of themean. Data from our two grazing seasons are consistent in demonstrating the safety of grazing beef cattle for aperiod of up to 6 months on TWG and CWR forages having high levels of Se due to irrigationwith saline drainagewater. This suggests that forage production using saline drainagewater is a viable alternative for saline soils withlimited potential for producing high value, salt-sensitive, crops.
cid detergent insoluble crudeer including residual ash and; CWR, creeping wildrye; EC,turated soil paste extract; ICP-ectrometry; Lignin(sa), ligninzable energy; NRC, Nationalall wheatgrass.squisa Agropecuária, Embrapa, Bagé, P.O.Box: 242 RS, Brazil.
.
ll rights reserved.
© 2011 Elsevier B.V. All rights reserved.
1. Introduction
The San Joaquin Valley of California is one of the most productiveagricultural areas in theUnited States relying on intensive irrigation andfertilization in order to reach high crop yields. Soils from the westernSan Joaquin Valley typically have high levels of soluble salts, boron, andSe and their saline-sodic condition creates a chronic problem foradequate drainage to reduce salt accumulation in the root zone.
Subsurface drainage systems were utilized for water table controlprior to the 1980s, but the occurrence of embryonic deformities in fishand migratory waterfowl traced to Se in agricultural drainage waterstored in the Kesterson reservoir, near Los Banos, CA (Ohlendorf et al.,1990; Ohlendorf et al., 1986) greatly curtailed the use of drainagesystems for salinity andwater tablemanagement in the region (Letey etal., 2002). Recognizing the importance of good soil drainage tominimizesoil salinization and maintain agricultural productivity numerousstrategies, including re-use for irrigation, have been tested to allowfarmers to use subsurface drainage systems in an environmentallyresponsible manner (DWR, 2003).
Former work by this group identified salt-tolerant forages suitablefor drainagewater reuse systems in thewesternSan JoaquinValley, suchas “Jose” tall wheatgrass (TWG; Thinopyrum ponticum var. “Jose”) andcreeping wildrye (CWR; Leymus triticoides var. “Rio”) (Suyama et al.,2007a, 2007b; Grattan et al., 2004a). Although TWG can have highmetabolizable energy under well-watered conditions (Suyama et al.,2007b), both of these forages are characterized by a high fiber content(560 to 650 g/kg dry weight) which reduces forage quality and lowerstheir market value. Utilization of TWG and CWR for grazing, however,
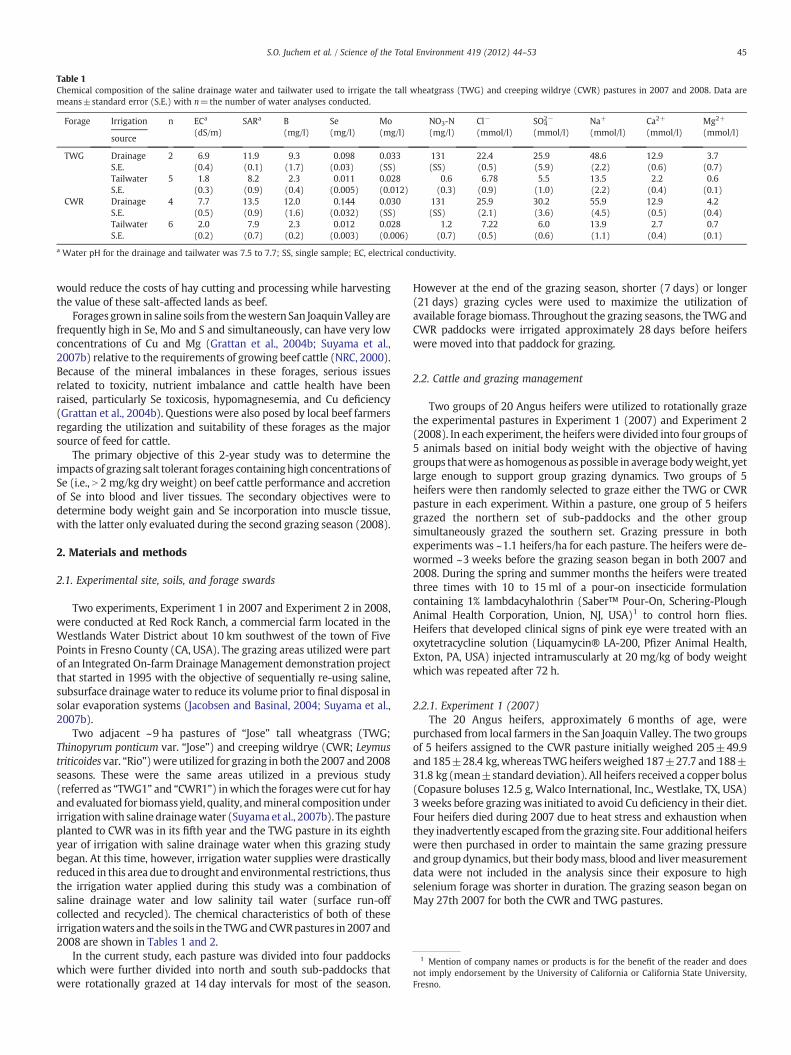
Table 1Chemical composition of the saline drainage water and tailwater used to irrigate the tall wheatgrass (TWG) and creeping wildrye (CWR) pastures in 2007 and 2008. Data aremeans±standard error (S.E.) with n=the number of water analyses conducted.
Forage Irrigation n ECa
(dS/m)SARa B
(mg/l)Se(mg/l)
Mo(mg/l)
NO3-N(mg/l)
Cl−
(mmol/l)SO4
2−
(mmol/l)Na+
(mmol/l)Ca2+
(mmol/l)Mg2+
(mmol/l)source
TWG Drainage 2 6.9 11.9 9.3 0.098 0.033 131 22.4 25.9 48.6 12.9 3.7S.E. (0.4) (0.1) (1.7) (0.03) (SS) (SS) (0.5) (5.9) (2.2) (0.6) (0.7)Tailwater 5 1.8 8.2 2.3 0.011 0.028 0.6 6.78 5.5 13.5 2.2 0.6S.E. (0.3) (0.9) (0.4) (0.005) (0.012) (0.3) (0.9) (1.0) (2.2) (0.4) (0.1)
CWR Drainage 4 7.7 13.5 12.0 0.144 0.030 131 25.9 30.2 55.9 12.9 4.2S.E. (0.5) (0.9) (1.6) (0.032) (SS) (SS) (2.1) (3.6) (4.5) (0.5) (0.4)Tailwater 6 2.0 7.9 2.3 0.012 0.028 1.2 7.22 6.0 13.9 2.7 0.7S.E. (0.2) (0.7) (0.2) (0.003) (0.006) (0.7) (0.5) (0.6) (1.1) (0.4) (0.1)
a Water pH for the drainage and tailwater was 7.5 to 7.7; SS, single sample; EC, electrical conductivity.
1 Mention of company names or products is for the benefit of the reader and doesnot imply endorsement by the University of California or California State University,Fresno.
45S.O. Juchem et al. / Science of the Total Environment 419 (2012) 44–53
would reduce the costs of hay cutting and processing while harvestingthe value of these salt-affected lands as beef.
Forages grown in saline soils from thewestern San JoaquinValley arefrequently high in Se, Mo and S and simultaneously, can have very lowconcentrations of Cu and Mg (Grattan et al., 2004b; Suyama et al.,2007b) relative to the requirements of growing beef cattle (NRC, 2000).Because of the mineral imbalances in these forages, serious issuesrelated to toxicity, nutrient imbalance and cattle health have beenraised, particularly Se toxicosis, hypomagnesemia, and Cu deficiency(Grattan et al., 2004b). Questions were also posed by local beef farmersregarding the utilization and suitability of these forages as the majorsource of feed for cattle.
The primary objective of this 2-year study was to determine theimpacts of grazing salt tolerant forages containinghigh concentrationsofSe (i.e., N 2 mg/kg dry weight) on beef cattle performance and accretionof Se into blood and liver tissues. The secondary objectives were todetermine body weight gain and Se incorporation into muscle tissue,with the latter only evaluated during the second grazing season (2008).
2. Materials and methods
2.1. Experimental site, soils, and forage swards
Two experiments, Experiment 1 in 2007 and Experiment 2 in 2008,were conducted at Red Rock Ranch, a commercial farm located in theWestlands Water District about 10 km southwest of the town of FivePoints in Fresno County (CA, USA). The grazing areas utilized were partof an Integrated On-farm DrainageManagement demonstration projectthat started in 1995 with the objective of sequentially re-using saline,subsurface drainagewater to reduce its volume prior to final disposal insolar evaporation systems (Jacobsen and Basinal, 2004; Suyama et al.,2007b).
Two adjacent ~9 ha pastures of “Jose” tall wheatgrass (TWG;Thinopyrum ponticum var. “Jose”) and creeping wildrye (CWR; Leymustriticoides var. “Rio”)were utilized for grazing in both the 2007 and 2008seasons. These were the same areas utilized in a previous study(referred as “TWG1” and “CWR1”) inwhich the forageswere cut for hayand evaluated for biomass yield, quality, andmineral compositionunderirrigationwith salinedrainagewater (Suyamaet al., 2007b). Thepastureplanted to CWR was in its fifth year and the TWG pasture in its eighthyear of irrigation with saline drainage water when this grazing studybegan. At this time, however, irrigation water supplies were drasticallyreduced in this area due to drought and environmental restrictions, thusthe irrigation water applied during this study was a combination ofsaline drainage water and low salinity tail water (surface run-offcollected and recycled). The chemical characteristics of both of theseirrigationwaters and the soils in the TWGandCWRpastures in 2007and2008 are shown in Tables 1 and 2.
In the current study, each pasture was divided into four paddockswhich were further divided into north and south sub-paddocks thatwere rotationally grazed at 14 day intervals for most of the season.
However at the end of the grazing season, shorter (7 days) or longer(21 days) grazing cycles were used to maximize the utilization ofavailable forage biomass. Throughout the grazing seasons, the TWG andCWR paddocks were irrigated approximately 28 days before heiferswere moved into that paddock for grazing.
2.2. Cattle and grazing management
Two groups of 20 Angus heifers were utilized to rotationally grazethe experimental pastures in Experiment 1 (2007) and Experiment 2(2008). In each experiment, the heiferswere divided into four groups of5 animals based on initial body weight with the objective of havinggroups thatwere ashomogenous aspossible in averagebodyweight, yetlarge enough to support group grazing dynamics. Two groups of 5heifers were then randomly selected to graze either the TWG or CWRpasture in each experiment. Within a pasture, one group of 5 heifersgrazed the northern set of sub-paddocks and the other groupsimultaneously grazed the southern set. Grazing pressure in bothexperiments was ~1.1 heifers/ha for each pasture. The heifers were de-wormed ~3 weeks before the grazing season began in both 2007 and2008. During the spring and summer months the heifers were treatedthree times with 10 to 15 ml of a pour-on insecticide formulationcontaining 1% lambdacyhalothrin (Saber™ Pour-On, Schering-PloughAnimal Health Corporation, Union, NJ, USA)1 to control horn flies.Heifers that developed clinical signs of pink eye were treated with anoxytetracycline solution (Liquamycin® LA-200, Pfizer Animal Health,Exton, PA, USA) injected intramuscularly at 20 mg/kg of body weightwhich was repeated after 72 h.
2.2.1. Experiment 1 (2007)The 20 Angus heifers, approximately 6 months of age, were
purchased from local farmers in the San Joaquin Valley. The two groupsof 5 heifers assigned to the CWR pasture initially weighed 205±49.9and 185±28.4 kg,whereas TWGheifersweighed 187±27.7 and 188±31.8 kg (mean±standard deviation). All heifers received a copper bolus(Copasure boluses 12.5 g, Walco International, Inc., Westlake, TX, USA)3 weeks before grazingwas initiated to avoid Cu deficiency in their diet.Four heifers died during 2007 due to heat stress and exhaustion whenthey inadvertently escaped from the grazing site. Four additional heiferswere then purchased in order to maintain the same grazing pressureand group dynamics, but their bodymass, blood and livermeasurementdata were not included in the analysis since their exposure to highselenium forage was shorter in duration. The grazing season began onMay 27th 2007 for both the CWR and TWG pastures.
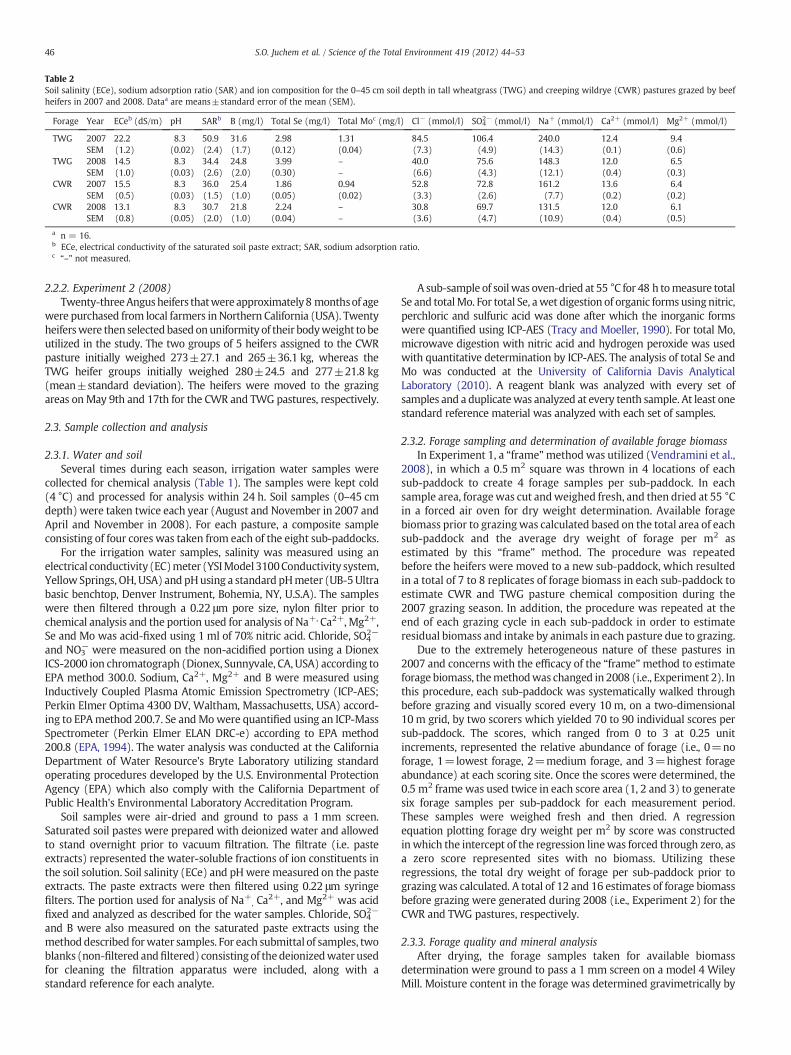
Table 2Soil salinity (ECe), sodium adsorption ratio (SAR) and ion composition for the 0–45 cm soil depth in tall wheatgrass (TWG) and creeping wildrye (CWR) pastures grazed by beefheifers in 2007 and 2008. Dataa are means±standard error of the mean (SEM).
Forage Year ECeb (dS/m) pH SARb B (mg/l) Total Se (mg/l) Total Moc (mg/l) Cl− (mmol/l) SO42− (mmol/l) Na+ (mmol/l) Ca2+ (mmol/l) Mg2+ (mmol/l)
TWG 2007 22.2 8.3 50.9 31.6 2.98 1.31 84.5 106.4 240.0 12.4 9.4SEM (1.2) (0.02) (2.4) (1.7) (0.12) (0.04) (7.3) (4.9) (14.3) (0.1) (0.6)
TWG 2008 14.5 8.3 34.4 24.8 3.99 – 40.0 75.6 148.3 12.0 6.5SEM (1.0) (0.03) (2.6) (2.0) (0.30) – (6.6) (4.3) (12.1) (0.4) (0.3)
CWR 2007 15.5 8.3 36.0 25.4 1.86 0.94 52.8 72.8 161.2 13.6 6.4SEM (0.5) (0.03) (1.5) (1.0) (0.05) (0.02) (3.3) (2.6) (7.7) (0.2) (0.2)
CWR 2008 13.1 8.3 30.7 21.8 2.24 – 30.8 69.7 131.5 12.0 6.1SEM (0.8) (0.05) (2.0) (1.0) (0.04) – (3.6) (4.7) (10.9) (0.4) (0.5)
a n = 16.b ECe, electrical conductivity of the saturated soil paste extract; SAR, sodium adsorption ratio.c “–” not measured.
46 S.O. Juchem et al. / Science of the Total Environment 419 (2012) 44–53
2.2.2. Experiment 2 (2008)Twenty-threeAngusheifers thatwereapproximately8 monthsof age
were purchased from local farmers in Northern California (USA). Twentyheiferswere then selected based onuniformity of their bodyweight to beutilized in the study. The two groups of 5 heifers assigned to the CWRpasture initially weighed 273±27.1 and 265±36.1 kg, whereas theTWG heifer groups initially weighed 280±24.5 and 277±21.8 kg(mean±standard deviation). The heifers were moved to the grazingareas onMay 9th and 17th for the CWR and TWG pastures, respectively.
2.3. Sample collection and analysis
2.3.1. Water and soilSeveral times during each season, irrigation water samples were
collected for chemical analysis (Table 1). The samples were kept cold(4 °C) and processed for analysis within 24 h. Soil samples (0–45 cmdepth) were taken twice each year (August and November in 2007 andApril and November in 2008). For each pasture, a composite sampleconsisting of four cores was taken from each of the eight sub-paddocks.
For the irrigation water samples, salinity was measured using anelectrical conductivity (EC)meter (YSIModel3100Conductivity system,Yellow Springs, OH, USA) and pHusing a standard pHmeter (UB-5Ultrabasic benchtop, Denver Instrument, Bohemia, NY, U.S.A). The sampleswere then filtered through a 0.22 μm pore size, nylon filter prior tochemical analysis and the portion used for analysis of Na+, Ca2+, Mg2+,Se and Mo was acid-fixed using 1 ml of 70% nitric acid. Chloride, SO4
2−
and NO3− were measured on the non-acidified portion using a Dionex
ICS-2000 ion chromatograph (Dionex, Sunnyvale, CA, USA) according toEPA method 300.0. Sodium, Ca2+, Mg2+ and B were measured usingInductively Coupled Plasma Atomic Emission Spectrometry (ICP-AES;Perkin Elmer Optima 4300 DV, Waltham, Massachusetts, USA) accord-ing to EPAmethod 200.7. Se andMowere quantified using an ICP-MassSpectrometer (Perkin Elmer ELAN DRC-e) according to EPA method200.8 (EPA, 1994). The water analysis was conducted at the CaliforniaDepartment of Water Resource's Bryte Laboratory utilizing standardoperating procedures developed by the U.S. Environmental ProtectionAgency (EPA) which also comply with the California Department ofPublic Health's Environmental Laboratory Accreditation Program.
Soil samples were air-dried and ground to pass a 1 mm screen.Saturated soil pastes were prepared with deionized water and allowedto stand overnight prior to vacuum filtration. The filtrate (i.e. pasteextracts) represented the water-soluble fractions of ion constituents inthe soil solution. Soil salinity (ECe) and pHwere measured on the pasteextracts. The paste extracts were then filtered using 0.22 μm syringefilters. The portion used for analysis of Na+, Ca2+, and Mg2+ was acidfixed and analyzed as described for the water samples. Chloride, SO4
2−
and B were also measured on the saturated paste extracts using themethod described forwater samples. For each submittal of samples, twoblanks (non-filtered andfiltered) consisting of thedeionizedwater usedfor cleaning the filtration apparatus were included, along with astandard reference for each analyte.
A sub-sample of soilwas oven-dried at 55 °C for 48 h tomeasure totalSe and totalMo. For total Se, awet digestion of organic forms usingnitric,perchloric and sulfuric acid was done after which the inorganic formswere quantified using ICP-AES (Tracy and Moeller, 1990). For total Mo,microwave digestion with nitric acid and hydrogen peroxide was usedwith quantitative determination by ICP-AES. The analysis of total Se andMo was conducted at the University of California Davis AnalyticalLaboratory (2010). A reagent blank was analyzed with every set ofsamples and a duplicatewas analyzed at every tenth sample. At least onestandard reference material was analyzed with each set of samples.
2.3.2. Forage sampling and determination of available forage biomassIn Experiment 1, a “frame”method was utilized (Vendramini et al.,
2008), in which a 0.5 m2 square was thrown in 4 locations of eachsub-paddock to create 4 forage samples per sub-paddock. In eachsample area, foragewas cut andweighed fresh, and then dried at 55 °Cin a forced air oven for dry weight determination. Available foragebiomass prior to grazingwas calculated based on the total area of eachsub-paddock and the average dry weight of forage per m2 asestimated by this “frame” method. The procedure was repeatedbefore the heifers were moved to a new sub-paddock, which resultedin a total of 7 to 8 replicates of forage biomass in each sub-paddock toestimate CWR and TWG pasture chemical composition during the2007 grazing season. In addition, the procedure was repeated at theend of each grazing cycle in each sub-paddock in order to estimateresidual biomass and intake by animals in each pasture due to grazing.
Due to the extremely heterogeneous nature of these pastures in2007 and concerns with the efficacy of the “frame”method to estimateforage biomass, themethodwas changed in 2008 (i.e., Experiment 2). Inthis procedure, each sub-paddock was systematically walked throughbefore grazing and visually scored every 10 m, on a two-dimensional10 m grid, by two scorers which yielded 70 to 90 individual scores persub-paddock. The scores, which ranged from 0 to 3 at 0.25 unitincrements, represented the relative abundance of forage (i.e., 0=noforage, 1=lowest forage, 2=medium forage, and 3=highest forageabundance) at each scoring site. Once the scores were determined, the0.5 m2 frame was used twice in each score area (1, 2 and 3) to generatesix forage samples per sub-paddock for each measurement period.These samples were weighed fresh and then dried. A regressionequation plotting forage dry weight per m2 by score was constructedin which the intercept of the regression linewas forced through zero, asa zero score represented sites with no biomass. Utilizing theseregressions, the total dry weight of forage per sub-paddock prior tograzingwas calculated. A total of 12 and 16 estimates of forage biomassbefore grazing were generated during 2008 (i.e., Experiment 2) for theCWR and TWG pastures, respectively.
2.3.3. Forage quality and mineral analysisAfter drying, the forage samples taken for available biomass
determination were ground to pass a 1 mm screen on a model 4 WileyMill. Moisture content in the forage was determined gravimetrically by
47S.O. Juchem et al. / Science of the Total Environment 419 (2012) 44–53
measuring the weight difference before and after heating samples to105 °C in a forced air oven for 2 h (Reuter et al., 1986). Neutral detergentfiber analysiswas performedwith additionof sodiumsulphite and aheatstable amylase (Van Soest et al., 1991) and expressed including residualash (aNDF) and without residual ash (aNDFom). Acid detergent fiber(ADF) was determined according to methods of the Association ofOfficial Analytical Chemists (AOAC, 2000; #973.18) and is expressedincluding residual ash. Lignin (sa) was determined by the sulfuric acidprocedure (Robertson and Van Soest, 1981). Ash was determined as thegravimetric residue after heating to 550 °C for 8 h. Total fat in the foragewas determined by extraction with ether (AOAC, 2000; #930.39). Thefatty acid profile was then determined by direct methylation utilizing10%methanolicHCl (Palmquist and Jenkins, 2003).Methyl esters of fattyacids were separated in a Hewlett Packard 5890 gas chromatographequipped with a 100 m capillary column (0.32 mm, 0.20 mm filmthickness; Supelco 2560, Supelco Inc., Bellefonte, PA, USA), utilizinghydrogen as the carrier gas. Gas chromatographic conditions andstandards were as described in DePeters et al. (2001).
The P, S, Ca, Mg, Na, B, Zn, Mn, Fe, Cu, Co and Mo concentrations indried forage samples were determined utilizing nitric acid/hydrogenperoxide microwave digestion and atomic absorption spectrometry(AAS) or ICP-AES (Sah andMiller, 1992;Meyer and Keliher, 1992). TotalK and Cl were extracted using 20 g/l acetic acid with K determined byatomic emission spectrometry (AES; Johnson and Ulrich, 1959) and Clby a chloridometer (Johnson and Ulrich, 1959). Total Se was extractedby nitric/perchloric acid digestion/dissolution and determined by vaporgeneration using ICP-AES (Tracy and Moeller, 1990). The total N andacid detergent insoluble crude protein (ADICP) levels were determinedwith a nitrogen gas analyzer utilizing induction furnace and thermalconductivity (LECO FP-528; AOAC (2000) #990.03). For the determi-nation of NO3-N, forage samples were extracted in acetic acid followedby reduction to nitrite in a copper/cadmium column (Carlson et al.,1990). Analyses were conducted at the University of California DavisAnalytical Laboratory (2010) with quality control procedures asdescribed for total Se and total Mo in soil.
The energy status of the forage material was also assessed. In vitrogas production was assayed in graduated glass syringes where 200 mgof ground forage tissue were incubated with 30 ml of buffered rumenfluid (Menke and Steingass, 1988). The amount of gas produced duringthe first 24 h was recorded and corrected for blank incubation (i.e.,buffered rumen fluid without forage sample). Metabolizable energyvalues were estimated using 24 h in vitro gas values combined withcrudeprotein and fat content (Menke and Steingass, 1988). However, asthese plants contain substantial quantities of ether soluble materialwhich is not fatty acids, the equation of Menke and Steingass (1988)noted above, was modified by replacing the assayed ether extract levelwith the assayed fatty acid level (g/kg dry weight) plus 10 g/kg, assuggested by NRC (2001).
2.3.4. Animal bodyweight, sampling and analysis of blood, liver andmuscleAnimalweightgainsweredetermined at various timesbymeasuring
their biomass. Heifers were weighed at 40 days prior and 139, 155, 159and190 days after grazingbegan in2007andat25 daysprior and20, 45,70, 91, 134 and 165 days after grazing began in 2008.
Blood sampleswere also collected at various times. Onewhole bloodsample from the jugular vein was collected at each sampling time anddispensed into two evacuated tubes (Vacutainer®, Becton Dickinson,Franklin Lakes, NJ, USA) for collection of whole blood (BD Hemogard™Lavender, 10.8 mg of K2EDTA) and serum (BD Hemogard™ Royal Blue).Serum was separated from whole blood through centrifugation at1500×g for 10 min at 5 °C, after which it was removed with a plasticpipette and transferred into a plasticmicrotube.Whole blood and serumwere stored at 5 °Cuntil submission for analysis to the California AnimalHealth and Food Safety Laboratory (Davis, CA, USA) no later than 72 hafter collection. In Experiment 1, blood was drawn at 40 days prior and55, 95, 135 and190 days after grazingbegan. In Experiment2, bloodwas
drawn at 25 days prior and 20, 45, 70, 91, 134 and 165 days after grazingbegan and serum was separated for the samples taken at 25 days priorand 91 and 165 days after grazing. All heifers were individuallyinspected at each blood sampling in both years for occurrence ofdeformed hoofs, alopecia, and diarrhea.
Samples of liver were collected utilizing a biopsy needle (SontecInstruments, Inc., Englewood, CO, USA). Hair on the right flank betweenthe 12th and 10th rib was trimmed with a 0.2 mm blade (Golden A5veterinary clipper, Oster, McMinnville, TN, USA) and cleaned with apaper towel. The area was then evaluated with ultrasound unitequipped with a 3.5 MHz convectional mechanical probe (WED-200A,Well.D Electronics Co., Ltd, Shenzhen, China) to identify the limits of theliver, avoid major blood vessels and determine liver thickness. Thisinformationwas thenused to choose thebest incision sitewhich inmostcases was the 11th intercostal space. The skin was thoroughlydisinfected with a scrub solution of 7.5% povidone-iodine (PurdueProducts L.P., Stanford, CT, USA) for approximately 3 min, rinsed withwater and thenwith 700 ml/l alcohol inwater. A local anesthesia of skinand muscle layer was performed with 2% lidocaine HCl (First Priority,INC., Elgin, IL, USA), and the areawasdisinfected againwith a solutionof10%povidine-iodine for 3 min, followedby 700 ml/l alcohol inwater. Anincision of approximately 4 cm was made through the skin and thebiopsy needle was utilized to puncture the muscular layers andperitoneum to enter the abdominal cavity cranio-ventrally towardsthe left elbow until it reached the liver. The incision was subsequentlyclosed with an interrupted cruciate suture pattern. On average, 1 to 3punctures were necessary to obtain 100 to 300 mg of liver tissue. Livertissuewas individually stored in plasticmicrotubes and kept on ice untilsubmittalwithin 72 h of collection for chemical analysis at the CaliforniaAnimal Health and Food Safety Laboratory (University of California,Davis, CA, USA). All heifers received one intramuscular injection ofpenicillin (22,000 IU / kg of BW) 20 min before each biopsy. Liversamples were collected at 40 days prior and 190 days after the onset ofgrazing in2007 andat 25 days prior and91 and165 days after grazing in2008. In order to compareourmeasurements expressedon awetweightbasis to literature values reported on dry weight basis, a liver moisturecontent of 500 mg/g was utilized for correction. Seventeen samples ofliver fromheifers at 190 days of grazing inExperiment1were submittedfor histopathological examination at the California Animal Health andFood Safety Laboratory (University of California, Davis, CA, USA).
Muscle biopsies from the semitendinosusmusclewere performed inthe right rear leg following the same procedure described for liver,except that muscle samples were collected utilizing a scalpel. Twoparallel incisions about 6 cm long, 1 cm apart, and 2 cm deep, weremade in the semi-membranousmuscle. Themuscle tissuewas clampedwith a curved hemostatic forceps, the dorsal and ventral extremities ofthe muscle fibers were cut, the sample was removed, and the incisionwas suturedwith a simple continuous suture pattern. Samples ofmuscletissue were processed and stored as described for liver tissue. Musclesamples were collected at 25 days prior and 91 and 165 days after theonset of grazing in 2008 only.
Liver andmuscle tissueswere digestedwith nitric acid at 180 °C andsubsequently analyzed for Pb, Mn, Ca, Cu, Fe, Zn, Mo, Ar and Hg by ICP-AES (FISONS, Accuris Model, Thermo Optek Corporation, Franklin, MA,USA) according toMartin et al. (1987). After precipitation of proteins inserum samples, protein free supernatantswere analyzed simultaneous-ly for Zn, Cu, Fe, Mn, Na, P, Ca and K as described byMelton et al. (1990)utilizing ICP-AES. For Se determination, the liver and muscle tissueswere digested in a solution of nitric, sulfuric and perchloric acids at350 °C, followed by reduction with 5 M HCl at 95 °C and quantified byhydride vapor generation using ICP-AES (FISONS, Accuris Model,Thermo Optek Corporation, Franklin, MA, USA) (Tracy and Moeller,1990). Whole blood Se concentrations were measured by ICP-AES, asdescribed previously (Tracy and Moeller, 1990).
A certified standard reference sample, dogfish liver (NationalResearch Council of Canada, DOLT-4) and lobster hepatopancreas

48 S.O. Juchem et al. / Science of the Total Environment 419 (2012) 44–53
(National Research Council of Canada, TORT-2), and 2 mg/kg over-spikes of tissue were utilized to determine ICP accuracies forquantification of Se, Pb, Mn, Ca, Cu, Fe, Zn, Mo, Ar and Hg. Readingsthat were within 2 standard deviations of the certified reference valuesand recoveries within 80–120% were required for a valid run. Accuracyof ICP determinations of trace minerals in serum was determined withstandard reference sera obtained from the Veterinary LaboratoryAssociation Quality Assurance Program (Genzyme Diagnostics, Blaine,MD, USA). Readings within two standard deviations of the referencevalues were necessary for a valid batch of serum determinations.
2.4. Statistical analysis
Data sampled over time, such as blood or serum, but not bodyweight, were analyzed as repeated measures utilizing the PROCMIXED procedure of SAS (2009) with the experimental unit (heifers)nested within sub-paddocks. The statistical model included effects ofheifer, time, forage and the forage by time interaction. Sub-paddockwas the experimental unit for forage chemical composition data, andthe statistical model included effects of forage, sub-paddock, time andthe forage by time interaction. For forage composition data, thevariable “time" was used to identify forage samples collected at thebeginning and end of the grazing season in each year. Forage samplescollected until May 21st, 2007 or June 27th, 2008 were categorized as“early” in Experiments 1 and 2, respectively; whereas forage samplescollected after those dates were categorized as “late” grazing season.Differences with p≤0.05 were considered significant whereas0.05bp≤0.10 were considered to be a tendency toward a difference.All data reported are least square of the means±standard error of themean, unless stated otherwise.
3. Results
Althoughwe tried to estimate the voluntary drymatter intake by theheifers, the extreme heterogeneity of forage biomass in the field madethis assessment impossible. Therefore neither the biomass frame-method used in 2007 nor the biomass ranking-method in 2008 wereadequate to estimate biomass intake. Nonetheless, the heifers grazedthe experimental pastures from May to November (190 days) in 2007and from May to October (165 days) in 2008. In neither experimentwere clinical signs of Se toxicity such as loss of tail hair or abnormalgrowth of the hoof observed. Se accretion due to intake of soil wasconsidered to benegligible in thepresent study. Although it represents a
Table 3AOrganic chemical composition (dry weight basis) of the forages creeping wildrye (CWR) ansquare means±standard error of the mean (SEM).
Experiment 1 (2007)a
CWR TWG SEM Foragea
n 14 16 – –
Ether extract, g/kg 43.5 42.4 0.02 0.73Fatty acids, g/kg 15.0 14.4 0.87 0.63aNDF, g/kgb 675 600 5.82 b 0.01aNDFom, g/kgb 661 586 5.9 b 0.01ADF, g/kgc 371 340 4.0 b 0.01Lignin(sa), g/kgd 43.0 41.5 2.00 0.5924h gas, ml/g 135 169 3.0 b 0.01ME, MJ/kge 6.65 7.61 0.088 b 0.01CP, g/kgf 114.3 113.5 7.92 0.94ADICP, g/kg CPf 92.0 69.3 2.98 b 0.01
a pValues for the effects of forage and the interaction of forage by time; “–,” not applicabb aNDF and aNDF (om), neutral detergent fiber including residual ash and without residc ADF, acid detergent fiber.d Lignin(sa), lignin determination utilizing sulfuric acid.e ME, metabolizable energy.f CP, crude protein; ADICP, acid detergent insoluble crude protein.
true aspect of the interface between the soil, plant and animal, it is notone that can be interpreted independently.
3.1. Forage composition
In Experiment 1, chemical composition of CWRandTWGwas similar(Table 3A) for ether extract, fatty acids, lignin (sa) and crude proteincontents. No interaction between forage and stage of grazing season(early or late) occurred for any of the analytes, indicating that foragechemical composition was relatively constant throughout the grazingperiod. However, fiber content and metabolizable energy differedbetween forage types, independent of the stage of the grazing season.CWR had higher (pb0.01) neutral detergent fiber (675 versus 600±5.8 g/kg dry weight), acid detergent fiber (371 versus 340±4.0 g/kg)and lower metabolizable energy (6.6 versus 7.6±0.09 MJ/kg). Themineral content differed between forages (Table 3B), where P (1.21versus 1.45±0.05 g/kg), Mg (1.1 versus 1.5±0.05 g/kg), S (2.4 versus5.0±0.41 g/kg), and Na (2.5 versus 15.1±2.54 g/kg dry weight) werelower (pb0.01) for CWRas compared to TWG. In contrast, the content ofZn (30.6 versus 19.1±0.41 g/kg) and Cu (6.8 versus 5.5±0.22 g/kg dryweight) were higher (pb0.01) for CWR than for TWG, Se, however, wassimilar (p=0.34) for CWR and TWG (3.7 versus 4.0±0.26 g/kg dryweight, respectively).
In Experiment 2, forage chemical composition was highly affectedby stage of the grazing season (early or late; Table 3C), particularly forcrude protein, metabolizable energy and Se. Themetabolizable energywas lower (pb0.01) for CWR as compared to TWG (5.8 versus 6.8±0.13 MJ/kg dry weight, respectively) during the early grazing season,but it was similar (pN0.10) to TWG at the end of grazing season in2008 (6.2 versus 6.5±0.13 MJ/kg dry weight, respectively; Table 3C).The level of crude protein was low for both CWR and TWG during2008 (less than 100 g/kg dry weight at beginning of grazing) and itdecreased (pb0.01) in TWGpastures to as low as 63.5 g/kg dry weighttowards the end of grazing, likely due to reduced irrigation with thesaline drainage water which normally carries high levels of NO3-N.The content of neutral detergent fiber (683 versus 642 dry weight forCWR and TWG, respectively, Table 3A) was not affected by stage ofgrazing and was consistently higher for CWR as compared to TWGforage. Concentrations of K, B, Zn and Cu varied between stages of thegrazing season (Table 3C) with B being lower and K, Zn, and Cu beinghigher in CWR forage as compared to TWG. The Se level wasconsistently higher (pb0.05) in TWG forages (4.0 mg/kg dry weight)throughout the grazing season in 2008, but Se concentration in CWR
d tall wheatgrass (TWG) during the grazing seasons of 2007 and 2008. Data are least
Experiment 2 (2008)a
F*timea CWR TWG SEM Foragea F*timea
– 60 66 – – –
0.08 – – – – –
– – – – – –
0.17 683 642 6.9 b 0.01 0.130.17 672 630 7.4 b 0.01 0.100.13 – – – – –
0.96 – – – – –
0.48 116 141 3.5 b 0.01 b 0.010.45 6.05 6.66 0.118 b 0.01 b 0.010.90 90.2 78.8 5.62 0.17 b 0.010.62 – – – – –
le.ual ash, respectively. BW, body weight; CP, crude protein.

Table 3BConcentration of minerals in the forages (dry weight basis) creeping wildrye (CWR) and tall wheatgrass (TWG) during the grazing seasons of 2007 and 2008. Data are least squaremeans±standard error of the mean (SEM).
Experiment 1 (2007) Experiment 2 (2008)
CWR TWG SEM Foragea F*timea CWR TWG SEM Foragea F*timea
Samples (n) 14 16 – – – 60 66 – – –
Ash, g/kg 68.6 102.3 5.84 b 0.01 0.20 74.6 84.5 3.8 0.09 0.07Ca, g/kg 3.12 3.12 0.01 0.98 0.16 2.29 2.15 0.16 0.53 0.45P, g/kg 1.21 1.45 0.05 b 0.01 0.88 1.20 1.09 0.08 0.31 0.33K, g/kg 17.4 13.0 1.14 0.02 0.20 21.4 11.0 0.71 b 0.01 b 0.01Mg, g/kg 1.10 1.52 0.05 b 0.01 0.29 0.92 0.97 0.05 0.47 0.75S, g/kg 2.40 5.02 0.41 b 0.01 0.35 2.39 2.88 0.16 0.06 0.30Na, g/kg 2.48 15.1 2.54 b 0.01 0.13 – – – – –
Cl, g/kg 9.64 19.1 2.34 0.02 0.12 – – – – –
B, mg/kg 185 480 67 b 0.01 0.38 337 558 42 b 0.01 b 0.01NO3 N, mg/kgb 80.7 181.6 39.2 0.08 0.25 247 143 17 b 0.01 –
Zn, mg/kg 30.6 19.1 0.41 b 0.01 0.92 22.9 13.8 1.06 b 0.01 b 0.01Mn, mg/kg 34.2 38.6 2.64 0.26 0.23 36.8 36.6 2.15 0.95 0.68Fe, mg/kg 3078 262 13 0.03 0.26 279 279 18 0.97 0.02Cu, mg/kg 6.76 5.51 0.22 b 0.01 0.19 6.65 4.12 0.35 b 0.01 b 0.01Se, mg/kg 3.68 4.05 0.26 0.34 0.38 2.82 3.97 0.19 b 0.01 b 0.02Mo, mg/kg 1.15 3.56 0.36 b 0.01 0.27 – – – – –
a pValues for the effects of forage and the interaction of forage by time; “–,” not applicable or not determined.b NO3-N, nitrate nitrogen.
0.0
0.2
0.4
0.6
0.8
1.0
-50 200
Blo
od S
e (m
g/L
)
Days in experimental pastures
1.0
1.2
1.4
g/L
)
2007
150100500
49S.O. Juchem et al. / Science of the Total Environment 419 (2012) 44–53
did increase (pb0.05) from the beginning to the end of grazing season(2.4 versus 3.2±0.21 mg/kg dry weight).
3.2. Blood, tissue composition and animal performance
Upon entering the pastures in 2007, Se concentrations weresimilar (pN0.60) in blood (0.15 versus 0.16±0.039 mg/g wet weight;Fig. 1) and liver (0.40 versus 0.37±0.044 mg/g) for CWR and TWGgrazed heifers. Likewise in 2008, initial Se concentrations in blood(0.095 mg/g; Fig. 1), liver (0.23 mg/g; Fig. 2), and muscle (0.06 mg/g;Fig. 3) tissues were similar (pN0.70) for CWR and TWG grazed heifers.
Accumulation of Se in blood occurred quickly in both years. In 2008,after only 20 days of grazing, Se concentrations in whole bloodincreased more than three fold in heifers grazing TWG and almosttwofold inheifers grazingCWR, as compared to blood Se25 daysprior tograzing (Fig. 1). About 50 days after grazing, the Se concentration inwhole blood was higher (pb0.01) for heifers grazing TWG forages inboth the 2007 (0.67 versus 0.48±0.040 mg/g) and 2008 (0.73 versus0.37±0.024 mg/g) years. In 2007, after 190 days of grazing, theconcentration of Se in whole blood was similar (pN0.10) betweenheifers that grazed TWG and CWR forages (0.94 versus 0.87±0.042 mg/g); whereas in 2008, after 165 days of grazing, the Seconcentration was considerably higher for TWG than CWR-grazedheifers (1.2 versus 0.8±0.024 mg/g).
Accumulation of Se in liver and muscle showed a pattern that wassimilar to that which occurred for whole blood. In these tissues, there
Table 3CMetabolizable energy (ME) and selected chemical compounds (dry weight basis) inforages during Experiment 2 (2008) according to time of grazing. Data are least squaremeans±standard error of the mean (SEM).
Early grazing Late grazing
CWR TWG SEM CWR TWG SEM F*timec
ME, MJ/kg DM 5.8b 6.8a 0.13 6.2 6.5 0.13 b 0.01CP, g/kg 93.2 94.1 6.0 87.3A 63.5B 6.0 b 0.01K, g/kg 2.3a 1.4b 0.08 2.0a 0.8b 0.08 b 0.01B, mg/kg 242 363 48 433b 754a 47 b 0.01Zn, mg/kg 21.3a 15.8b 1.18 24.6a 11.7b 1.16 b 0.01Fe, mg/kg 239 186 24 320 371 22 b 0.03Cu, mg/kg 6.7 5.0 0.37 6.6 3.2 0.37 b 0.01Se, mg/kg 2.4b 4.0a 0.22 3.2B 4.0A 0.21 b 0.02
A, Bpb0.05; a,bpb0.01.c F*time, p values for the interaction of forage by time.
was an increase in Se concentration with increased exposure time ofanimals to high Se forages. Concentrations of Se in wet liver tissuewereone- to threefold higher than concentrations in blood at the end ofgrazing. Heifers that grazed CWR had almost twice as much Se in liver
0.0
0.2
0.4
0.6
0.8
Blo
od S
e (m
Days in experimental pastures
2008
-50 200150100500
Fig. 1. Changes over time in concentrations of Se (mg/l) inwhole blood of heifers that grazedcreeping wildrye (CWR; solid line) or tall wheatgrass (TWG; dashed line) in 2007 or 2008.Heifers that grazed TWGhad higher concentrations of Se inwhole blood at 55 days, but lowerat 135 days after grazing, than did CWR heifers in 2007 (forage by day interaction; pb0.01).During thegrazing seasonof2008, heifers grazingTWGhadconsistentlyhigher (pb0.01)Se inwhole blood throughout the grazingperiod thanCWRheifers. Pooled SEMare0.03 and0.01 in2007 and2008, respectively. Data are least squaremeans±standard error of themean (SEM).

0.0
0.8
1.6
2.4
3.2
4.0
4.8
-40 190
Liv
er S
e (m
g/kg
)
Days in the experimental pastures
0.0
0.6
1.2
1.8
2.4
3.0
3.6
-50 200
Liv
er S
e (m
g/kg
)
Days in the experimental pastures
2007
2008
150100500
Fig. 2. Concentrations of Se (mg/kg wet weight) in liver tissue from heifers that grazedcreepingwildrye(CWR; solid lines) or tallwheatgrass (TWG;dashed lines) in 2007 (bars) or2008 (lines). Concentrations of Se in liver were higher for heifers grazing CWR in 2007(pb0.01; forage effect), but not in 2008. Heifers that grazed TWG in2008 accumulatedmoreSe in liver during the grazing period than CWR heifers (pb0.01; forage by day interaction),even though liver Se concentrationswere similar at 25 days before grazing. Pooled SEM are0.11 and 0.064 in 2007 and 2008, respectively. Data are least squaremeans±standard errorof the mean (SEM).
0.1
0.3
0.5
0.7
0.9
0
10
20
30
40
-40
Seru
m C
u (
mg/
L)
Wet
live
r C
u (
mg/
kg)
Days in experimental pastures16012080400
Fig. 4. Concentrations of Cu in liver tissue (mg/kgwetweight;▲) andblood serum(mg/l;●),respectively, fromheifers that grazedcreepingwildrye (CWR; solid)or tallwheatgrass (TWG;dashed) in Experiment 2 (2008). Heifers that grazed TWG had lower Cu concentrations inserum at 165 days of grazing (pb0.01) and in liver tissue at 90 and 165 days of grazing(pb0.01). Pooled SEM are 2.6 and 0.04 in liver and serum, respectively. Data are least squaremeans±standard error of the mean (SEM).
50 S.O. Juchem et al. / Science of the Total Environment 419 (2012) 44–53
tissue in 2007 after 190 days of grazing than did those of TWG-grazedheifers (Fig. 2). The opposite occurred in 2008, when heifers grazingTWG had higher concentrations of Se in the liver at 91 and 165 days ofgrazing as compared to heifers grazing CWR. Despite the large increasein Se concentrations in blood and liver during 2007 and 2008, none ofthe 40 heifers demonstrated clinical signs of Se toxicity, such asdeformed hooves, alopecia (loss of hair), diarrhea or sudden death.
0.0
0.2
0.4
0.6
0.8
1.0
-50 0 50 100 150 200
Mus
cle
Se (
mg/
kg)
Days in experimental pastures
Fig. 3. Concentration of Se (mg/kgwet weight) inmuscle tissue from heifers that grazedcreeping wildrye (CWR; solid) or tall wheatgrass (TWG; dashed) in Experiment 2(2008). Incorporation of Se into muscle occurred faster in heifers grazing TWG, whichresulted in higher concentrations of Se in muscle at 91 and 165 days of grazing (forageby day interaction; pb0.01; Pooled SEM=0.02). Muscle biopsies were not performed in2007. Data are least square means±standard error of the mean (SEM).
Histopathological examination of 17 liver samples collected in 2007 at190 days of grazing revealed no relevant histological alterations in 12samples, whereas 4 liver samples showedminor and focal infiltration ofmononuclear inflammatory cells.
In 2008, grazing TWG resulted in higher (pb0.01) incorporation of Seintoheifermuscle tissue thandidgrazingCWR(Fig. 3), anoutcomesimilarto that observed for blood and liver. Muscle tissue had a larger relativechange in Se concentration as compared to blood, with Se concentrationsincreased by 17 and 9 fold after heifers had grazed TWG or CWR pasturesfor 165 days, respectively. Other traceminerals in serumdifferedbetweenTWGandCWRheifers, particularlyCu (Fig. 4),MgandNa (Table4), and insome cases, these differences were time dependent. Heifers that grazedTWG had lower levels o Cu (10.7 versus 25.4±0.04 mg/kg; pb0.01) inliver, higher levels o Zn (57.9 versus 35.0±2.5 mg/kg; pb0.01), whereasthe concentration of Mn (2.6 versus 2.4±0.10 mg/kg; p=0.2) and Fe(97.5 versus 96.3±6.1 mg/kg; p=0.9) were similar for heifers thatgrazed CWR or TWG pastures, respectively.
Mean body weight before grazing was similar in the TWG and CWRheifer groups in 2007 (181.4 versus 195.0±12.62 kg) and 2008 (264.7versus 270.6±9.02 kg), respectively (pN0.10). In 2007, heifers grazingTWG gained more weight than did heifers grazing CWR (0.59 versus0.27±0.040 kg/days; pb0.01). However during 2008, body weightgains were low for both groups and did not differ (p=0.62) betweenheifers grazing TWG or CWR (0.27 versus 0.36 kg/days; Fig. 5).
4. Discussion
4.1. Forage composition
Chemical composition of forages is dependent on their geneticbackground, growth stage, fertilization and the soil and irrigationwater chemistry in their environment. TWG and CWR are tolerant tosalinity and therefore have an advantage of performing well in salinesoils as compared to more salt-sensitive forages such as alfalfa(Robinson et al., 2004; Suyama et al., 2007a; Semple et al., 2008) andtypically, their nutritional value is not greatly affected by salinity(Suyama et al., 2007a). Indeed, the effects of salinity on yield, qualityand chemical composition observed in earlier studies, suggest theseforages are good candidates for production systems utilizing salinewater or soils.
Themineral contentof theTWGandCWR foragewas reflectiveof thesoil conditions in which they were grown, in particular saline soils
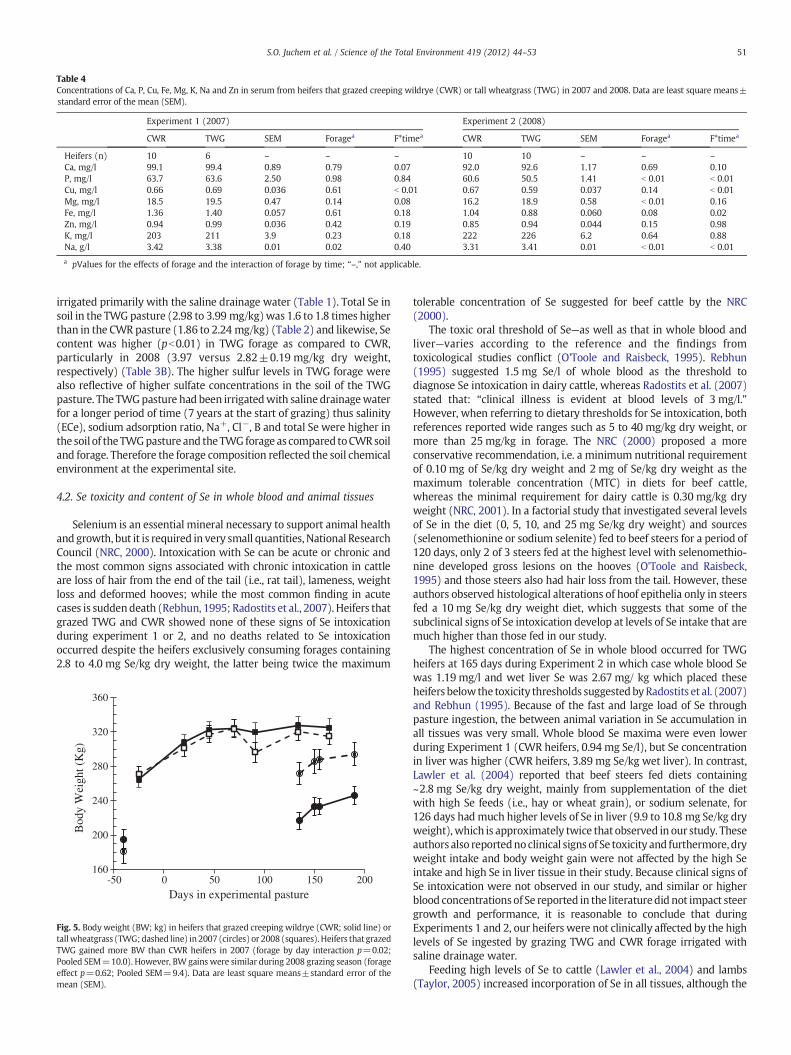
Table 4Concentrations of Ca, P, Cu, Fe, Mg, K, Na and Zn in serum from heifers that grazed creeping wildrye (CWR) or tall wheatgrass (TWG) in 2007 and 2008. Data are least square means±standard error of the mean (SEM).
Experiment 1 (2007) Experiment 2 (2008)
CWR TWG SEM Foragea F*timea CWR TWG SEM Foragea F*timea
Heifers (n) 10 6 – – – 10 10 – – –
Ca, mg/l 99.1 99.4 0.89 0.79 0.07 92.0 92.6 1.17 0.69 0.10P, mg/l 63.7 63.6 2.50 0.98 0.84 60.6 50.5 1.41 b 0.01 b 0.01Cu, mg/l 0.66 0.69 0.036 0.61 b 0.01 0.67 0.59 0.037 0.14 b 0.01Mg, mg/l 18.5 19.5 0.47 0.14 0.08 16.2 18.9 0.58 b 0.01 0.16Fe, mg/l 1.36 1.40 0.057 0.61 0.18 1.04 0.88 0.060 0.08 0.02Zn, mg/l 0.94 0.99 0.036 0.42 0.19 0.85 0.94 0.044 0.15 0.98K, mg/l 203 211 3.9 0.23 0.18 222 226 6.2 0.64 0.88Na, g/l 3.42 3.38 0.01 0.02 0.40 3.31 3.41 0.01 b 0.01 b 0.01
a pValues for the effects of forage and the interaction of forage by time; “–,” not applicable.
51S.O. Juchem et al. / Science of the Total Environment 419 (2012) 44–53
irrigated primarily with the saline drainage water (Table 1). Total Se insoil in the TWGpasture (2.98 to 3.99 mg/kg)was 1.6 to 1.8 times higherthan in the CWR pasture (1.86 to 2.24 mg/kg) (Table 2) and likewise, Secontent was higher (pb0.01) in TWG forage as compared to CWR,particularly in 2008 (3.97 versus 2.82±0.19 mg/kg dry weight,respectively) (Table 3B). The higher sulfur levels in TWG forage werealso reflective of higher sulfate concentrations in the soil of the TWGpasture. The TWGpasture had been irrigatedwith saline drainagewaterfor a longer period of time (7 years at the start of grazing) thus salinity(ECe), sodium adsorption ratio, Na+, Cl−, B and total Se were higher inthe soil of theTWGpastureand theTWG forage as compared toCWRsoiland forage. Therefore the forage composition reflected the soil chemicalenvironment at the experimental site.
4.2. Se toxicity and content of Se in whole blood and animal tissues
Selenium is an essential mineral necessary to support animal healthand growth, but it is required in very small quantities, National ResearchCouncil (NRC, 2000). Intoxication with Se can be acute or chronic andthe most common signs associated with chronic intoxication in cattleare loss of hair from the end of the tail (i.e., rat tail), lameness, weightloss and deformed hooves; while the most common finding in acutecases is suddendeath (Rebhun, 1995; Radostits et al., 2007). Heifers thatgrazed TWG and CWR showed none of these signs of Se intoxicationduring experiment 1 or 2, and no deaths related to Se intoxicationoccurred despite the heifers exclusively consuming forages containing2.8 to 4.0 mg Se/kg dry weight, the latter being twice the maximum
160
200
240
280
320
360
-50 200
Bod
y W
eigh
t (K
g)
Days in experimental pasture150100500
Fig. 5. Body weight (BW; kg) in heifers that grazed creeping wildrye (CWR; solid line) ortallwheatgrass (TWG;dashed line) in2007 (circles) or 2008 (squares).Heifers that grazedTWG gained more BW than CWR heifers in 2007 (forage by day interaction p=0.02;Pooled SEM=10.0). However, BW gains were similar during 2008 grazing season (forageeffect p=0.62; Pooled SEM=9.4). Data are least square means±standard error of themean (SEM).
tolerable concentration of Se suggested for beef cattle by the NRC(2000).
The toxic oral threshold of Se—as well as that in whole blood andliver—varies according to the reference and the findings fromtoxicological studies conflict (O'Toole and Raisbeck, 1995). Rebhun(1995) suggested 1.5 mg Se/l of whole blood as the threshold todiagnose Se intoxication in dairy cattle, whereas Radostits et al. (2007)stated that: “clinical illness is evident at blood levels of 3 mg/l.”However, when referring to dietary thresholds for Se intoxication, bothreferences reported wide ranges such as 5 to 40 mg/kg dry weight, ormore than 25mg/kg in forage. The NRC (2000) proposed a moreconservative recommendation, i.e. a minimum nutritional requirementof 0.10 mg of Se/kg dry weight and 2 mg of Se/kg dry weight as themaximum tolerable concentration (MTC) in diets for beef cattle,whereas the minimal requirement for dairy cattle is 0.30 mg/kg dryweight (NRC, 2001). In a factorial study that investigated several levelsof Se in the diet (0, 5, 10, and 25 mg Se/kg dry weight) and sources(selenomethionine or sodium selenite) fed to beef steers for a period of120 days, only 2 of 3 steers fed at the highest level with selenomethio-nine developed gross lesions on the hooves (O'Toole and Raisbeck,1995) and those steers also had hair loss from the tail. However, theseauthors observed histological alterations of hoof epithelia only in steersfed a 10 mg Se/kg dry weight diet, which suggests that some of thesubclinical signs of Se intoxication develop at levels of Se intake that aremuch higher than those fed in our study.
The highest concentration of Se in whole blood occurred for TWGheifers at 165 days during Experiment 2 in which case whole blood Sewas 1.19 mg/l and wet liver Se was 2.67 mg/ kg which placed theseheifers belowthe toxicity thresholds suggestedbyRadostits et al. (2007)and Rebhun (1995). Because of the fast and large load of Se throughpasture ingestion, the between animal variation in Se accumulation inall tissues was very small. Whole blood Se maxima were even lowerduring Experiment 1 (CWR heifers, 0.94 mg Se/l), but Se concentrationin liver was higher (CWR heifers, 3.89 mg Se/kg wet liver). In contrast,Lawler et al. (2004) reported that beef steers fed diets containing~2.8 mg Se/kg dry weight, mainly from supplementation of the dietwith high Se feeds (i.e., hay or wheat grain), or sodium selenate, for126 days hadmuch higher levels of Se in liver (9.9 to 10.8 mg Se/kg dryweight),which is approximately twice that observed in our study. Theseauthors also reportednoclinical signs of Se toxicity and furthermore, dryweight intake and body weight gain were not affected by the high Seintake and high Se in liver tissue in their study. Because clinical signs ofSe intoxication were not observed in our study, and similar or higherblood concentrationsof Se reported in the literaturedid not impact steergrowth and performance, it is reasonable to conclude that duringExperiments 1 and 2, our heifers were not clinically affected by the highlevels of Se ingested by grazing TWG and CWR forage irrigated withsaline drainage water.
Feeding high levels of Se to cattle (Lawler et al., 2004) and lambs(Taylor, 2005) increased incorporation of Se in all tissues, although the

52 S.O. Juchem et al. / Science of the Total Environment 419 (2012) 44–53
rate of incorporation varied between organs, and it was dependent onthe time of exposure and molecular form of Se (Lawler et al., 2004). Inthe study by Taylor,wether lambs fed a diet containing 2.9 mg Se/kg dryweight as organic Se for 56 days had higher concentrations of Se inkidney, liver, spleen, muscle, duodenum, heart, lungs and wool thanlambs fed the control diet (i.e., 0.2 mg Se/kg dry weight). Taylor (2005)reported that Se concentration in the muscle increased 6 fold, ascompared to 3 fold in the liver, due in part to the higher initialconcentration in the liver (~9 mg Se/kg liver) as compared to muscle(~3.5 mg Se/kg liver). In our Experiment 1 and 2, Se incorporation hadsimilar features; primarily a rapid increase in Se levels in the blood,particularly noticeable in Experiment 2, followed by substantialincreases in liver and muscle Se content.
Heifers that grazed TWG in 2007 had similar (p=0.30) Seconcentrations in blood at 190 days as those which grazed CWR (0.87versus 0.94±0.042 mg/kg dry weight); however in 2008, the TWGheifers had higher (pb0.05) levels of Se in blood (Fig. 1), liver (Fig. 2)andmuscle (Fig. 3) throughout the 165 days grazing period. In 2007, theheifers grazing TWG had higher blood Se during the early grazingseason, yet at the end of grazing (i.e., 190 days) Se concentrations intheir liver tissue were much lower than those of the CWR heifers (2.1versus 3.9±0.181 mgSe/kg liverwet tissue). Foragewas in short supplyin the TWG pasture at the end of the 2007 grazing season. Reducedintake of forage by the TWGheifers may have promptedmobilization ofSe from the liver during the last months of grazing thus depleting liverSe with less impact on blood Se, as the blood pool receives inputs fromboth the liver and digestive tract.
4.3. Mineral deficiency and animal weight gain
Forages grown in soils irrigated with saline DW can be highlyunbalanced in micro-minerals which can impact cattle mineral re-quirements. Grattan et al. (2004b) described the potential detrimentaleffects of feeding such forages to cattle without appropriate mineralsupplementation,, such as the risk for hypomagnesaemia due to highlevels of K, and Cu deficiency resulting from high levels of Mo in theforage. Even though Mg concentrations in TWG and CWR forages weremarginal (NRC, 2000) during Experiment 1 and 2 (i.e., 0.92 to1.52 mg/kg), the K concentrations were not high (NRC, 2000) beingbelow 21.5 mg/kg dry weight which probably explains the absence ofany occurrences of grass tetany in either Experiment 1 or 2.Concentrations of Ca, P, Zn, K and Na in blood serum were withinexpected physiological ranges for healthy cattle (Radostits et al., 2007)in both of our experiments. Different than observed for Se, the betweenanimal variation in micro-mineral concentration in serum was muchlarger, which most likely is related to the low concentration of mostmicro-minerals in these forages.
The nutritional requirements of Cu can be variable, e.g. 4 to 15 mg/kgdiet dry weight of forage, because of interactions with other mineralssuch as Mo, Mg and S (NRC, 2000). Mo levels lower than 2 mg/kg dryweight and sulfur lower than 2500 mg/kg dry weight should notinterfere with Cu absorption (NRC, 2000). Cu concentrations in ourforages were consistently marginal during both experiments, and wereparticularly low at the end of the 2008 grazing season for TWG, whichexposed this group of heifers to Cu deficiency, but not those grazingCWR. In Experiment 1, supplementation of Cu through a slow releasingbolus appeared to alleviate Cudepletionduring the grazingperiod giventhat CWR and TWG heifers finished the grazing season with similar(p=0.61) Cu levels in serum (0.66 versus 0.69±0.036 mg/l).
According toWikse et al. (1992), levels of Cu in serum between 0.2and 0.4 mg/l, or liver concentrations from 0.5 to 10 mg Cu/kg wetweight can reduce body weight gains. Indeed, Cu concentrations inthe livers of our TWG heifers were low at 165 days of grazing in 2008,averaging 1.14 mg/kg, and 6 of 10 TWG heifers had Cu levels belowthe minimum detectable level of 1 mg/kg.
Ward and Spears (1997) found that feeding a silage based dietcontaining 5.2 mg/kg dry weight of Cu and 1.16 mg/kg Mo for 196 dayswas sufficient to maintain adequate levels of Cu in the serum (0.9 mg/lCu). The addition of 5 mg sodium molybdate/kg of diet dry weightreduced Cu concentrations in serum to 0.2 mg/l and liver to 7.5 mg/kgdry weight after 196 days of feeding; however, body weight gains werenot reduced. Hansen et al. (2009) reported that when growing calveswere supplemented with Mg (i.e., 500 mg/kg dry weight) and Mo(2 mg/kg dryweight) to induce a Cudeficiency, bodyweight gainsweresimilar to a Cu-sufficient group (i.e., 120 mg Cu/kg liver dry weight) upto 239 days of feeding. Reduced body weight gains occurring just afterthis period suggested to these authors that chronic Cu deficiency couldin fact, impact body weight gain.
In experiments 1 and 2 of our study, Se concentrations increased inall tissues, including blood, more than any other mineral measured inboth CWR and TWG heifers. The literature, however, has no indicationsthat these levels of Se in blood and liver depress voluntary intake orbody weight gain (Lawler et al., 2004; Taylor, 2005).
According to theNRC recommendations for beef cattle (2000), a dietcontaining71 to98 mgcrudeprotein/kgdryweight and 500 to 600 g/kgtotal digestible nutrients (equivalent to 7.4 to 8.8 MJ metabolizableenergy/kg dryweight) would support daily body weight gains of 300 to600 g/days, respectively. As the crude protein level was considerablyabove animal requirements (but not necessarily the estimated energycontent of forages) during Experiment 1 and bodyweight gains for TWGheifers of 0.59 kg/dayswere in close agreementwith estimates based onNRC (2000) equations, it is likely that the heifers had an intake slightlyhigher than predicted by NRC (2000). Heifers grazing CWR had lowerbody weight gains (0.27 kg/days) than TWG heifers in 2007, probablydue to the lowermetabolizable energy content of CWR (i.e., 6.65 MJ /kgdry weight) because the crude protein content was definitely not thegrowth-limiting nutrient in Experiment 1. The chemical composition ofthe forages in Experiment 2wasquite different between CWRand TWG,particularly because of the strong effect of time on crude proteincontent. However, the lower nutritive character (metabolizable energy)of CWR persisted, albeit at a smaller magnitude. During Experiment 2,body weight increased in both TWG and CWR heifers up to 91 days ofgrazingwhen it stabilizedwhich coincidedwith the onset of suboptimalcrude protein content of the forages (Table 3C), particularly TWG, alongwith low levels of Cu in serum and liver.
It is important to recognize the unavoidable confounding of low Culevels and low crude protein content of forages; however, based on Culevels in our animal tissues, a Cu deficiency could only havecompromised body weight gains later in the grazing period. Due tosufficient crudeprotein levels in CWR,but a lowmetabolizable energy, itis likely that the low body weight gains in Experiment 2 were, in largepart, due to an insufficient nutrient content of the forages rather than amicro-mineral deficiency and/or imbalance.
It would be a very simplistic interpretation to state that Cusupplementation, as done in Experiment 1, would be sufficient toaccommodate the micro-mineral imbalances observed in these foragesthat were irrigated with saline drainage water high in selenium. Themicro-mineral composition of these forages is a consequence of themineral profile of the soil and the drainage water, which can be highlyvariable. Micro-mineral supplementation based on a recent chemicalanalysis of the forages tobegrazed is therefore strongly recommended ifanimal health and performance are to be optimized.
4.4. Implications for human health
Possible benefits of utilizing areas that are naturally high in Se toproduce Se-enriched beef have been suggested (Hintze et al., 2001;Lawler et al., 2004). Meat products, particularly beef and poultry,comprise one of the main sources of Se in the diets of U.S. adults (Cottonet al., 2004). The typical content of Se in fresh beef ranges from 200 to250 μg/kg on a wet basis (Hintze et al., 2001). The USA recommended

53S.O. Juchem et al. / Science of the Total Environment 419 (2012) 44–53
dietary allowance (RDA) for Se of 70 and 50 μg of daily Se intake for adultmen and women, respectively, suggests that an intake of 100 g/day ofbeefwouldprovide36% to50%of theRDAof Se. Consumptionof the sameamount of semitendinosus muscle from Se-enriched beef from our CWRand TWG grazed heifers (i.e., 0.63 versus 0.87 mg Se/kg wet muscle)heifers would provide about 90% to 125% of the RDA of an adult man,which makes Se-enriched beef a promising source of Se in human diets.
5. Conclusions
Our TWG and CWR forage containing up to 4 mg Se/kg dry weightdid not cause beef heifers to develop signs of Se toxicity. It is thereforeunlikely that exposing non-pregnant, non-breeding cattle to these highSe forages for a grazing season of 6 to 7 months would result in deathdue to Se intoxication. Potential micro-mineral imbalances in foragesgrown in soils irrigatedwith these saline drainagewaters are likely to beamore relevant concern for animal health and performance than is theirhigh Se content. Therefore, cattle grazing these Se-enriched foragesshould receive macro- and micro-mineral supplementation during thegrazing period to optimize their performance and minimize the risk ofundesirable metabolic conditions, particularly hypomagnesaemia andCu deficiency. Although drainage water can provide high levels of N togrowing forages, application of supplemental sources of N should beconsidered if needed tomaintain desirable levels of crude protein in theforage so as to sustain adequate plant biomass yield, as well as bodyweight gains of the cattle. In addition, such a production system createsan opportunity for farmers to produce “value-added” beef that containshigher levels of Se, while creating an economic opportunity to utilizesaline soils and/or saline drainage waters that are not suitable for thegrowth of higher value, salt-sensitive crops.
Acknowledgements
The authors are very thankful to John Diener and the staff from RedRock Ranch, Five Points, CA (USA) for providing the heifers, pastures andlogistical support for conducting this study. We appreciate the inputprovided by Dr. John Maas (University of California Veterinary MedicineExtension) forperforming liver andmusclebiopsies. Researchwas fundedby the Proposition 204 Agricultural Drainage Program (agreement#4600007357) administrated by the California Department of WaterResources and the California State University Agricultural ResearchInitiative (CSU-ARI, grant #07-1-001-13).
References
AOAC. Official methods of analysis of AOAC International. 17th ed. Arlington: AOACInternational; 2000.
Carlson RM, Cabrera RI, Paul JL, Quick J, Evans RY. Rapid direct determination ofammonium and nitrate in soil and plant tissue extracts. Commun Soil Sci Plant Anal1990;21:1519–29.
Cotton PA, Subar AF, Friday JE, Cook A. Dietary sources of nutrients among US adults,1994 to 1996. J Am Diet Assoc 2004;104:921–30.
Department ofWater Resources (DWR). San Joaquin District. San Joaquin Valley drainageimplementation program 2000. Fresno (CA: The Department; 2003. Sept. 89 p.
DePeters EJ, German JB, Taylor SJ, Essex ST, Perez-Monti H. Fatty acid and triglyceridecomposition of milk fat from lactating Holstein cows in response to supplementalcanola oil. J Dairy Sci 2001;84:929–36.
Environmental Protection Agency (EPA-USA). Methods for the determination of metalsin environmental samples: Supplement I (600/R-94/111). Cincinnati: Environ-mental Monitoring Systems Laboratory Office of Research and Development; 1994.
Grattan SR, Grieve CM, Poss JA, Robinson PH, Suarez DL, Benes SE. Evaluation of salttolerant forages for sequential water re-use systems. I. Biomass production. AgricWater Manage 2004a;70:109–20.
Grattan SR, Grieve CM, Poss JA, Robinson PH, Suarez DL, Benes SE. Evaluation of salttolerant forages for sequential re-use systems. III. Implications for ruminantmineral nutrition. Agric Water Manage 2004b;70:137–50.
Hansen SL, Ashwell MS, Legleiter LR, Fry RS, Lloyd KE, Spears JW. The addition of highmanganese to a copper-deficient diet further depresses copper status and growthof cattle. Brit J Nut 2009;101:1068–78.
Hintze KJ, Lardy GP, Marchello MJ, Finley JW. Areas with high concentrations ofselenium in the soil and forage produce beef with enhanced concentrations ofselenium. J Agric Food Chem 2001;49:1062–7.
Jacobsen, T., Basinal, L. (Eds.), 2004. Managing agricultural irrigation drainage water: alandowner’smanual. AGuide forDeveloping IntegratedOn-farmDrainageManagement(IFDM) Systems. Grant 319H. California State Water Resources Control Board, HudsonOrth Communications, Fresno, CA, USA.
Johnson CM, Ulrich A. Analytical methods for use in plant analysis. Berkeley(CA:University of California Agricultural Experiment Station; 1959.. Bulletin 766.
Lawler TL, Taylor JB, Finley JW, Caton JS. Effect of supranutritional and organicallybound selenium on performance, carcass characteristics, and selenium distributionin finishing beef steers. J Anim Sci 2004;82:1488–93.
Letey J, Williams CF, Alemi M. Salinity, drainage and selenium problems in the WesternSan Joaquin Valley of California. Irr Drain Syst 2002;16:253–9.
Martin TD,Martin ER,McKeeGD, Lobring L, PickeringQ,HorningW.Determinationofmetalsin fish by inductively coupled plasma atomic emission spectrometry, Revision 1.3.Washington: US. Environmental Protection Agency, Office of Research and Develop-ment, Environmental Monitoring and Support Laboratory; 1987. Method 200.11.
Melton LA, Tracy ML, Moller G. Screening trace elements and electrolytes in serum byinductively-coupled plasma emission spectrometry. Clin. Chemistry 1990;36:247–50.
Menke KH, Steingass H. Estimation of the energetic feed value obtained from chemicalanalysis and in vitro gas production using rumen fluid. Anim Res Dev 1988;28:7–55.
Meyer GA, Keliher PN. An overview of analysis by inductively coupled plasma-atomicemission spectrometry. In: Montaser A, Golightly DW, editors. Inductively coupledplasmas in analytical atomic spectrometry. New York: VCH Publishers Inc.; 1992.p. 473–505.
National Research Council (NRC). Nutrient requirements of beef cattle. 7th ed.Washington D.C: National Academy of Science; 2000. 248 p.
National Research Council (NRC). Nutrient requirements of dairy cattle. 7th ed.Washington D.C: National Academy of Science; 2001. 381 p.
Ohlendorf HM, Roger L, HothemRL, Bunck CB,Marois KC. Bio-accumulation of selenium inbirds at Kesterson Reservoir, California. Arch Environ Contam Toxicol 1990;19:495–507.
Ohlendorf HM, Hoffman DJ, Saiki MK, Aldrich TW. Embryonic mortality andabnormalities of aquatic birds: apparent impacts of selenium from irrigationdrain water. Sci Total Environ 1986;52:49–63.
O'Toole D, Raisbeck MF. Pathology of experimentally-induced, chronic selenosis (alkalidisease) in yearling cattle. J Vet Diagn Invest 1995;7:364–73.
Palmquist DL, Jenkins TC. Challenges with fats and fatty acid methods. J Dairy Sci2003;81:3250–4.
Rebhun WC. Diseases of dairy cattle, media. Williams & Wilkins; 1995.Radostits OM, Gay CC, Hinchcliff KW, Constable PD. Veterinary medicine: a textbook of the
diseases of cattle, horses, sheep, pigs and goats. 10th ed. New York: Saunders Elsevier;2007.
Reuter DJ, Robinson JB, Peverill KI, Price GH. Guidelines for collecting, handling andanalyzing plant materials. In: Reuter DJ, Robinson JB, editors. Plant analysis aninterpretation manual. Melbourne: Inkata Press; 1986. p. 20–35.
Robertson JB, Van Soest PJ. The detergent system of analysis and its application tohuman foods. In: James WPT, Theander O, editors. The analysis of dietary fiber infoods. New York: Marcel Dekker; 1981. p. 123–42.
Robinson PH, Grattan SR, Getachew G, Grieve CM, Poss JA, Suarez DL, Benes SE. Biomassaccumulation and potential nutritive value of some forages irrigated with saline-sodic drainage water. Anim Feed Sci Technol 2004;111:175–89.
Sah RN, Miller RO. Spontaneous reaction for acid dissolution of biological tissues inclosed vessels. Anal Chem 1992;64:230–3.
SAS Institute Inc.. SAS/STAT® 9.2. User's Guide: The Mixed Procedure. Cary (NC: SASInst. Inc; 2009.
Semple WS, Dowling PM, Koen TB. Tall wheatgrass (Thinopyrum ponticum) andpuccinellia (Puccinellia ciliata) may not be the answer for all saline sites: a casestudy from the CentralWestern Slopes of New SouthWales. Aust J Agr Res 2008;59:814–23.
Suyama H, Benes SE, Robinson PH, Grattan SR, Grieve CM, Getachew G. Forage yield andquality under irrigation with saline-sodic drainage water: Greenhouse evaluation.Agric Water Manage 2007a;88:159–72.
Suyama H, Benes SE, Robinson PH, Getachew G, Grattan SR, Grieve CM. Productivity andquality of forages under long-term irrigation with saline-sodic drainage water onthe Westside San Joaquin Valley. Anim Feed Sci Technol 2007b;135:329–45.
Taylor JB. Time-dependent influence of supranutritional organically bound selenium onselenium accumulation in growing wether lambs. J Anim Sci 2005;83:1186–93.
Tracy ML, Moeller G. Continuous flow vapor generation for inductively coupled argonplasma spectrometric analysis. Part 1: selenium. J Assoc Off Anal Chem 1990;73:404–10.
University of California Davis Analytical Laboratory. UC Davis Analytical LaboratoryQualityManual: agricultural and environmental testing; 2010. Oct. [cited 2011May18, 18 p.]. Available from: http://anlab.ucdavis.edu/docs/qual-manual.pdf.
Van Soest PJ, Robertson JB, Lewis BA. Methods for dietary fiber, neutral detergent fiberand non-starch polysaccharides in relation to animal nutrition. J Dairy Sci 1991;74:3583–97.
Vendramini JMB, Sollenberger LE, Dubeux Jr JCB, Interrante SM, Stewart Jr RL,Arthington JD. Sward management effects on forage component responses in aproduction system for early weaned calves. Agron J 2008;100:1781–6.
Ward JD, Spears JW. Long-term effects of consumption of low-copper diets with orwithout supplemental molybdenum on copper status, performance, and carcasscharacteristics of cattle. J Anim Sci 1997;75:3057–65.
Wikse SE, Herd D, Field R, Holland P. Diagnosis of copper deficiency in cattle. J Am VetMed Assoc 1992;200:1625–9.