determining the key question and project scope · the flow of a slide deck contrasts with the flow...
TRANSCRIPT

Powerful Use of PowerPoint
Dr. Paul N. Friga
Slides available at www.paulfriga.com
April 16, 2013

Powerful Use of PowerPoint| Dr. Paul Friga
Our session today
2
The Stage
The Approach
The Resources
Powerful Use of PowerPoint| Dr. Paul Friga
Our session today
3
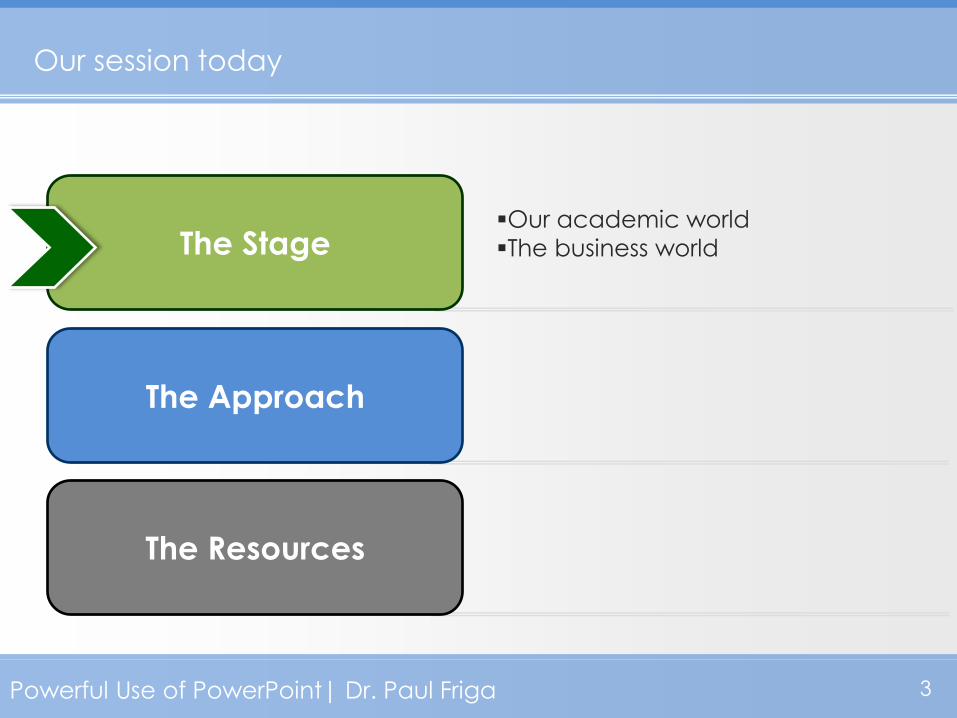
The Stage
The Approach
The Resources
Our academic world
The business world
Powerful Use of PowerPoint| Dr. Paul Friga
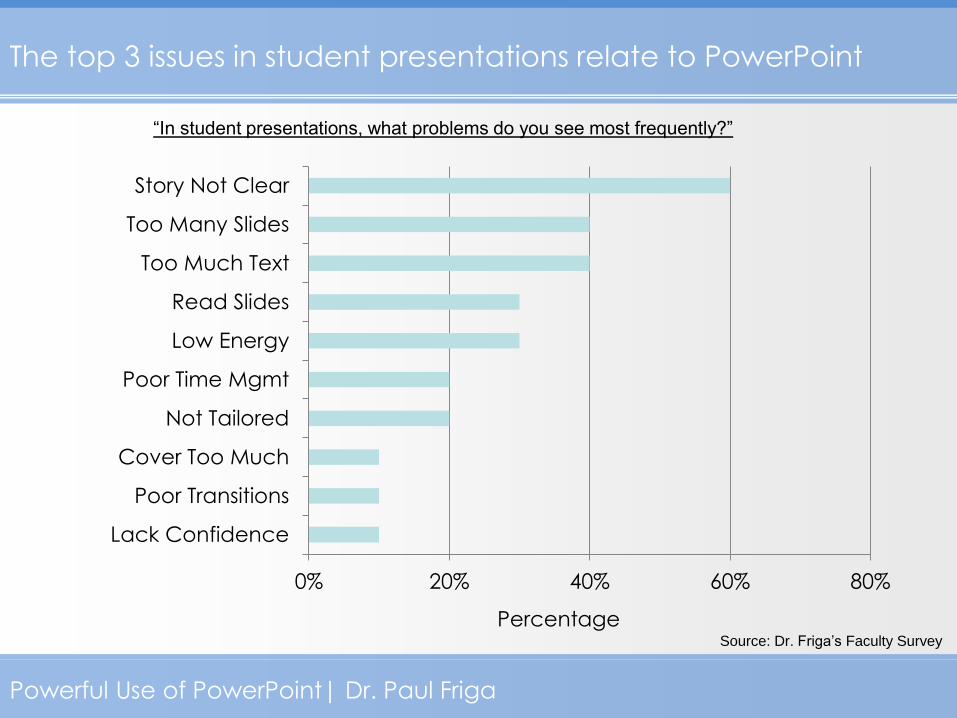
The top 3 issues in student presentations relate to PowerPoint
0% 20% 40% 60% 80%
Lack Confidence
Poor Transitions
Cover Too Much
Not Tailored
Poor Time Mgmt
Low Energy
Read Slides
Too Much Text
Too Many Slides
Story Not Clear
Percentage Source: Dr. Friga’s Faculty Survey
“In student presentations, what problems do you see most frequently?”
Powerful Use of PowerPoint| Dr. Paul Friga
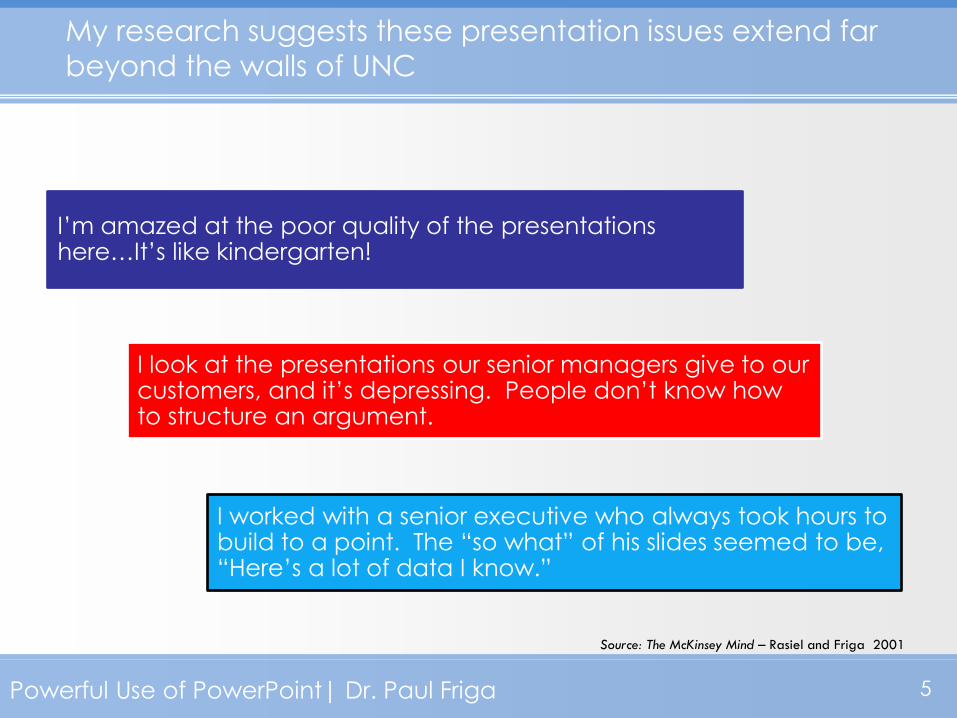
My research suggests these presentation issues extend far
beyond the walls of UNC
I’m amazed at the poor quality of the presentations here…It’s like kindergarten!
I look at the presentations our senior managers give to our customers, and it’s depressing. People don’t know how to structure an argument.
I worked with a senior executive who always took hours to build to a point. The “so what” of his slides seemed to be, “Here’s a lot of data I know.”
Source: The McKinsey Mind – Rasiel and Friga 2001
5

Powerful Use of PowerPoint| Dr. Paul Friga
Our session today
6
The Stage
The Approach
The Resources
Tailoring to the audience/purpose
Implementing the pyramid principle
Powerful Use of PowerPoint| Dr. Paul Friga
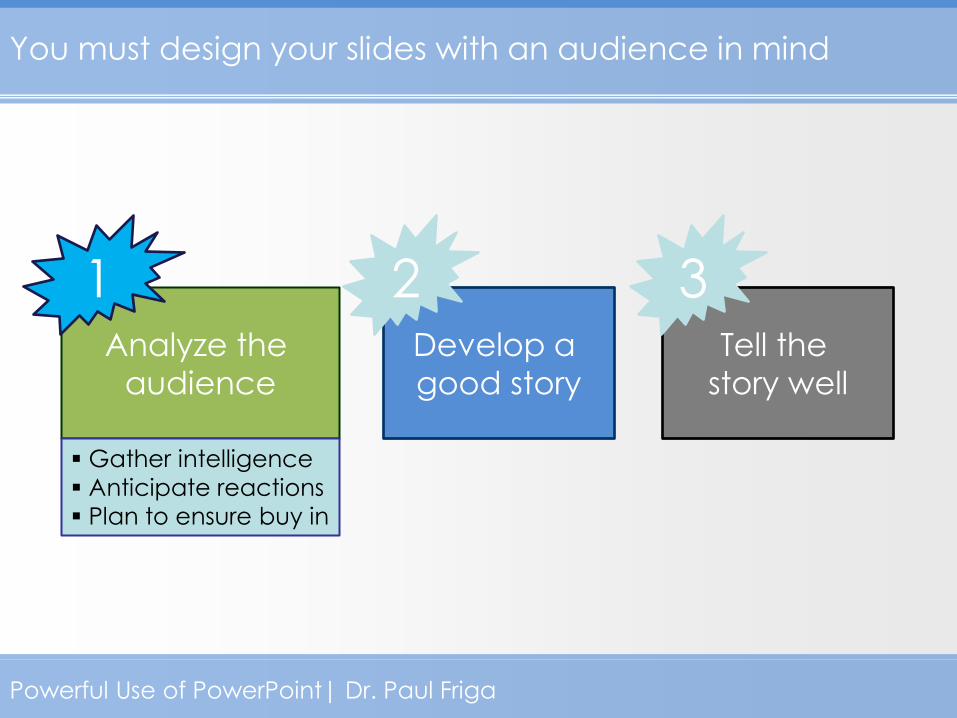
You must design your slides with an audience in mind
Analyze the
audience
1 Develop a
good story
2 Tell the
story well
3
Gather intelligence
Anticipate reactions
Plan to ensure buy in
Powerful Use of PowerPoint| Dr. Paul Friga
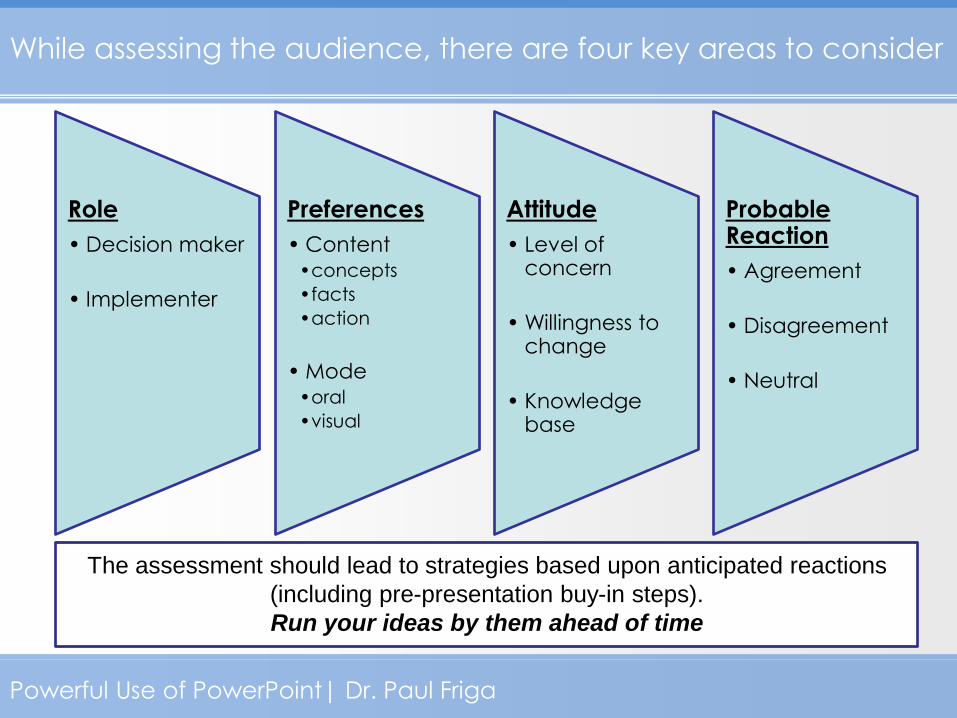
While assessing the audience, there are four key areas to consider
Role
• Decision maker
• Implementer
Preferences
• Content •concepts
•facts
•action
• Mode •oral
•visual
Attitude
• Level of concern
• Willingness to change
• Knowledge base
Probable Reaction
• Agreement
• Disagreement
• Neutral
The assessment should lead to strategies based upon anticipated reactions
(including pre-presentation buy-in steps).
Run your ideas by them ahead of time
Powerful Use of PowerPoint| Dr. Paul Friga
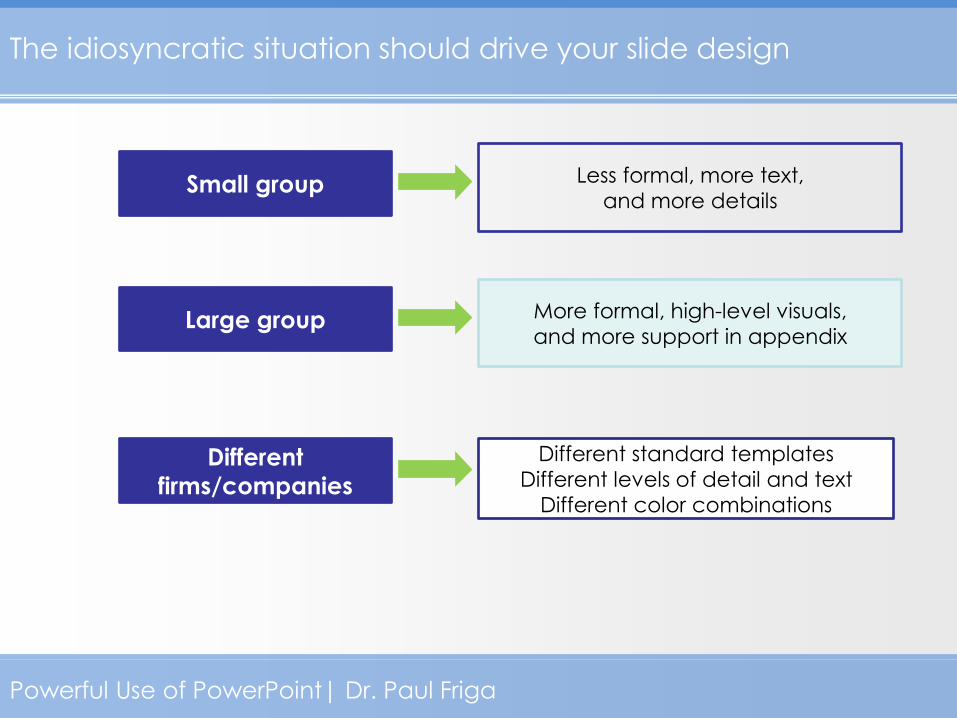
The idiosyncratic situation should drive your slide design
Small group
Large group
Different
firms/companies
Less formal, more text,
and more details
More formal, high-level visuals,
and more support in appendix
Different standard templates
Different levels of detail and text
Different color combinations

Powerful Use of PowerPoint| Dr. Paul Friga
Use the pyramid principle throughout your slide deck
Analyze the
audience
Develop a
good story
1 Tell the
story well
3
Think pyramid
Focus on end product
Ask “so what?”
2

Powerful Use of PowerPoint| Dr. Paul Friga
The Pyramid Principle can lend clarity to everyday situations as
well as to PowerPoint deck design
Mort –
John Collins telephoned to say that he can’t make the meeting at 9:00. Hal Johnson says he doesn’t mind making it later, or even tomorrow, but not before 10:30, and Don Clifford’s secretary says that Clifford won’t return from Frankfurt until tomorrow, late. The conference room is booked tomorrow, but free Thursday. Thursday at 11:00 looks to be a good time. Is that okay with you?
JC – not today
HJ – tomorrow after 10:30
DC-not before Thursday
Room not tomorrow
Room OK Thursday Is Thursday OK with you?
Co
nfu
sin
g M
ess
ag
e
Have you ever written or received a message like this?

Powerful Use of PowerPoint| Dr. Paul Friga
Mort –
Could we reschedule today’s 9:00 meeting to Thursday at
11:00? This would be more convenient for Collins and
Johnson, and would permit Clifford to be present. It is also the only other time this week that the conference room is
free.
More convenient for JC & HJ Permits DC to attend Room free
Cle
are
r M
ess
ag
e
Starting with a governing thought and using buckets is the magic
Does this sound better?
Reschedule for 9:00 on Thursday

Powerful Use of PowerPoint| Dr. Paul Friga
The flow of a slide deck contrasts with the flow of analysis
Preliminary
Hypothesis
Recommendations
The problem-solving process:
The presentation process:
Data Conclusions Recommendations
Conclusions Data
So
what?
The McKinsey Mind – Rasiel and Friga 2001
Powerful Use of PowerPoint| Dr. Paul Friga
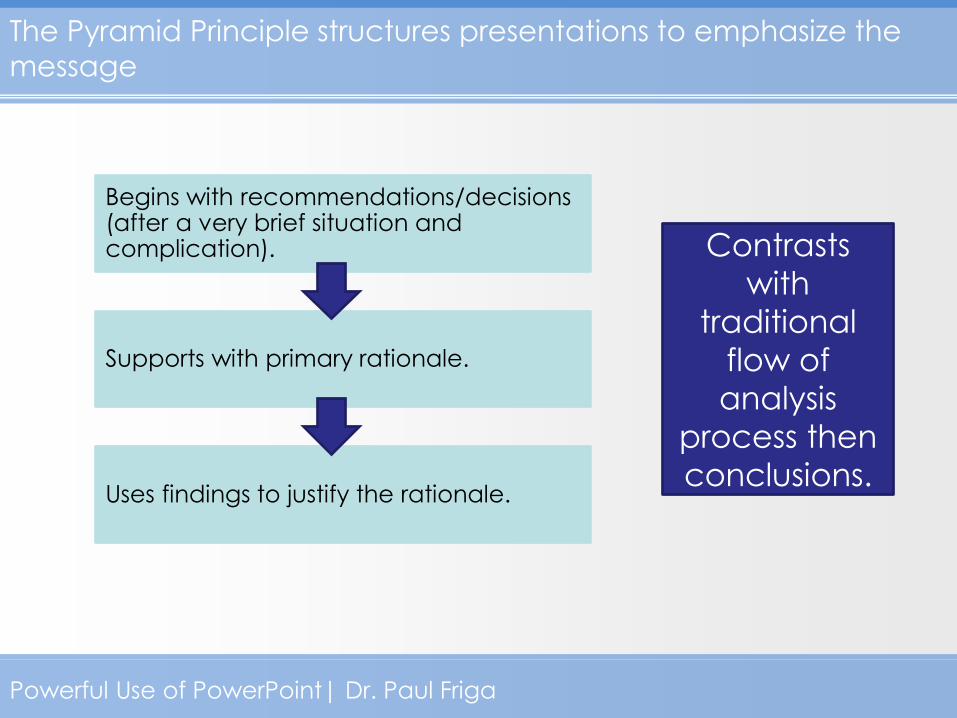
The Pyramid Principle structures presentations to emphasize the
message
Supports with primary rationale.
Uses findings to justify the rationale.
Begins with recommendations/decisions (after a very brief situation and complication). Contrasts
with
traditional
flow of
analysis
process then
conclusions.
Powerful Use of PowerPoint| Dr. Paul Friga
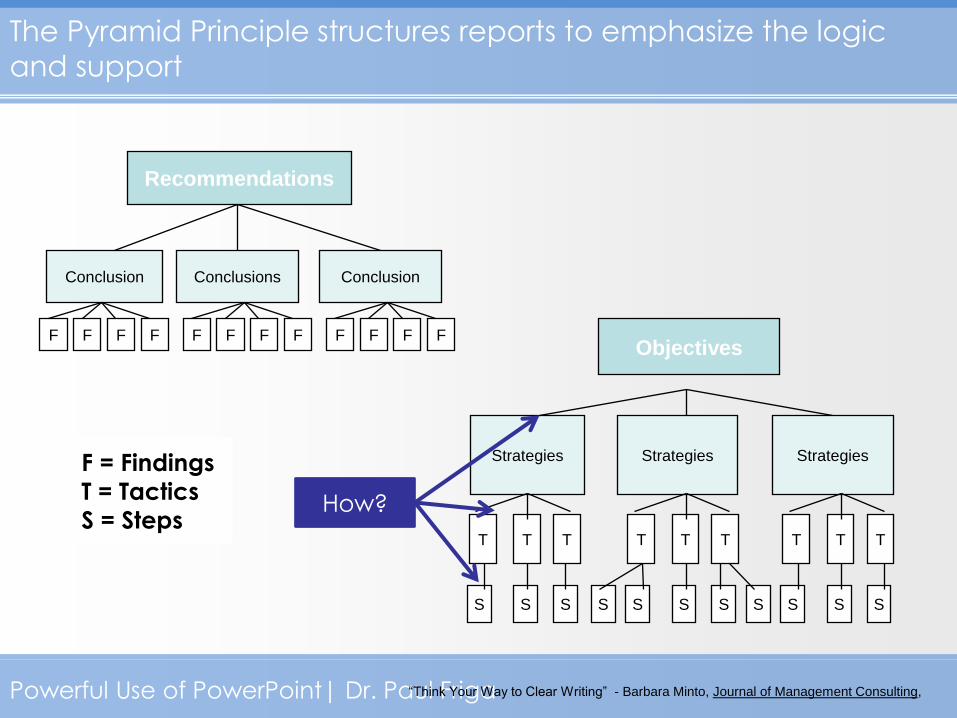
The Pyramid Principle structures reports to emphasize the logic
and support
Recommendations
Conclusion Conclusions Conclusion
F F F F F F F F F F F F
“Think Your Way to Clear Writing” - Barbara Minto, Journal of Management Consulting,
Objectives
Strategies Strategies Strategies
T T T
S S S S S
T T T
S S S
T T T
S S S
F = Findings
T = Tactics
S = Steps How?
Powerful Use of PowerPoint| Dr. Paul Friga
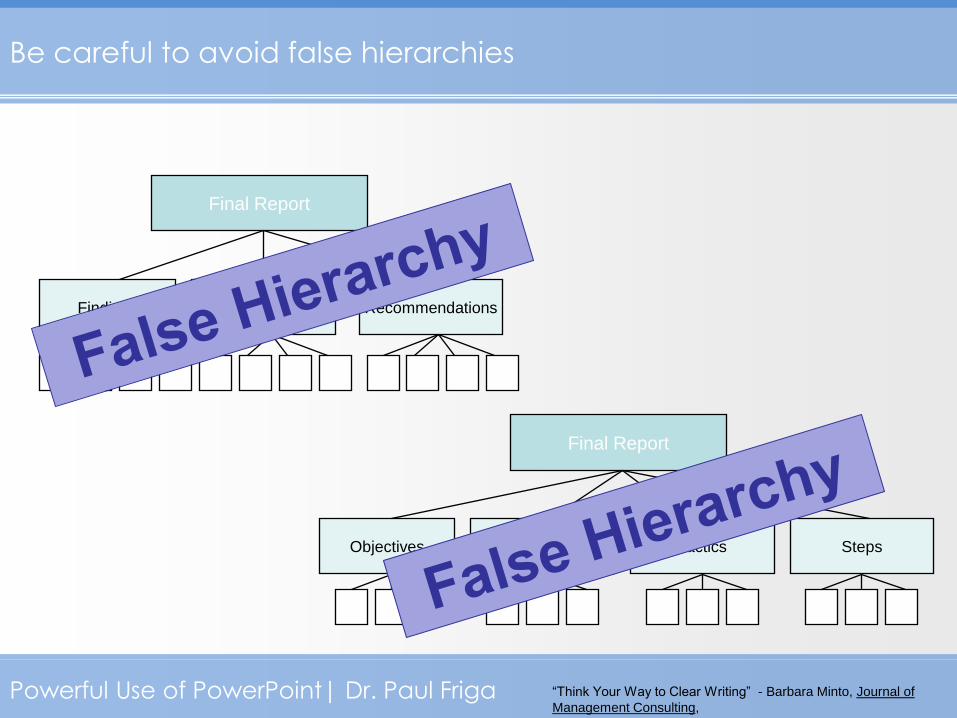
Be careful to avoid false hierarchies
Final Report
Recommendations Conclusions Findings
Final Report
Tactics Strategies Objectives Steps
“Think Your Way to Clear Writing” - Barbara Minto, Journal of
Management Consulting,
Powerful Use of PowerPoint| Dr. Paul Friga
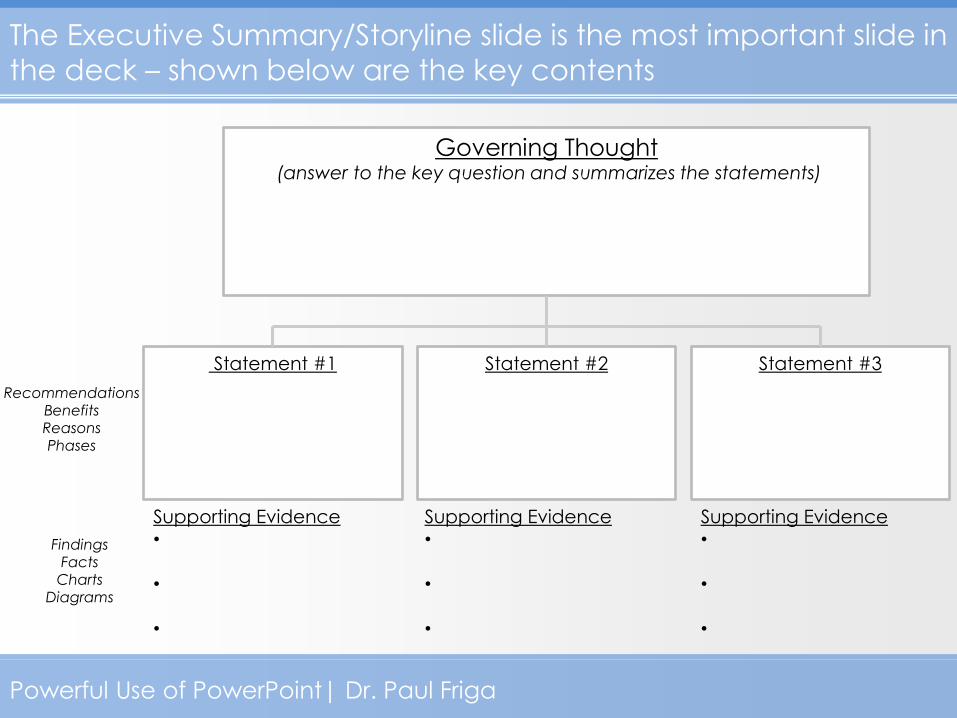
The Executive Summary/Storyline slide is the most important slide in
the deck – shown below are the key contents
Governing Thought (answer to the key question and summarizes the statements)
Statement #1
Statement #2
Statement #3
Recommendations Benefits Reasons Phases
Supporting Evidence •
•
•
Supporting Evidence •
•
•
Supporting Evidence •
•
•
Findings Facts
Charts Diagrams

Conclusion
Objective. Maintain growth and leadership in innovation.
Overview Summary
Recommendations.
Think differently. Increase R&D investment to
drive innovation.
Bring it on. Strengthen product and
service offerings
Team B1: Brent Garber | Vivek Kumar | Liang Guo | Anne Stoehr | Hsin-Tso Yang
Go uncharted. Expand in emerging
international markets
Job-less? How to maintain innovation
without Steve Jobs.
Stiff competition. How to face increased
competition in a hot market
Play nice. Managing strained
relationships with partners
Risks to success.
Bottom line. Innovation + New Products and Services + New Markets equals…
iTunes + iPod New Markets Innovation
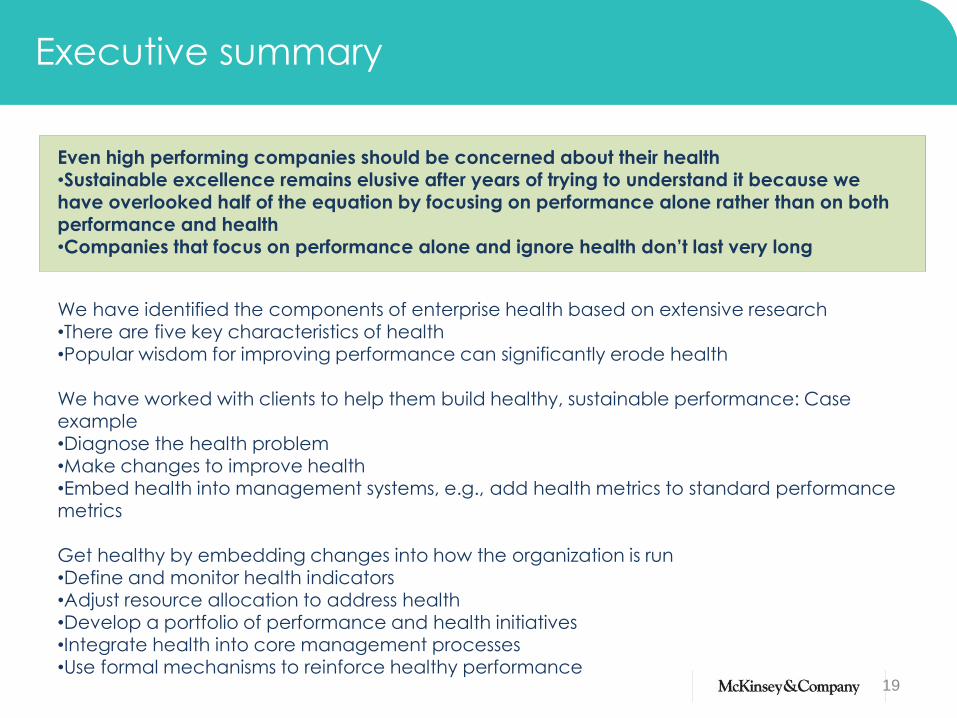
Executive summary
Even high performing companies should be concerned about their health •Sustainable excellence remains elusive after years of trying to understand it because we have overlooked half of the equation by focusing on performance alone rather than on both
performance and health •Companies that focus on performance alone and ignore health don’t last very long
We have identified the components of enterprise health based on extensive research •There are five key characteristics of health
•Popular wisdom for improving performance can significantly erode health
We have worked with clients to help them build healthy, sustainable performance: Case example •Diagnose the health problem •Make changes to improve health
•Embed health into management systems, e.g., add health metrics to standard performance metrics
Get healthy by embedding changes into how the organization is run •Define and monitor health indicators •Adjust resource allocation to address health
•Develop a portfolio of performance and health initiatives •Integrate health into core management processes •Use formal mechanisms to reinforce healthy performance
19

Recommendation & Conclusion
Target can effectively defend itself against Walmart’s encroachment on its core customers by making changes
that enable it to better meet their grocery shopping needs.
1. Remodel existing Target stores.
2. Increase the number of Super Target stores.
3. Expand grocery offerings, focusing on private label organic groceries.
20
1.8 Billion expected profit over 5 years $

Executive Summary
Objective: Continuing growth in the face of competition
0.00%
1.00%
2.00%
3.00%
4.00%
5.00%
6.00%
7.00%
8.00%
0
10000
20000
30000
40000
50000
60000
70000
2004 2005 2006 2007 2008
Revenues in millions
Profit Margins
Problem Recommendations
I. Increase average store sales.
1. Hypermarkets: Expand plans for growth.
2. Private label: Offer more private labels in consumables.
II. Pursue strategic geographic expansion.
3. Urban markets: More aggressively expand.
4. Canada: Expand into Canada.
21
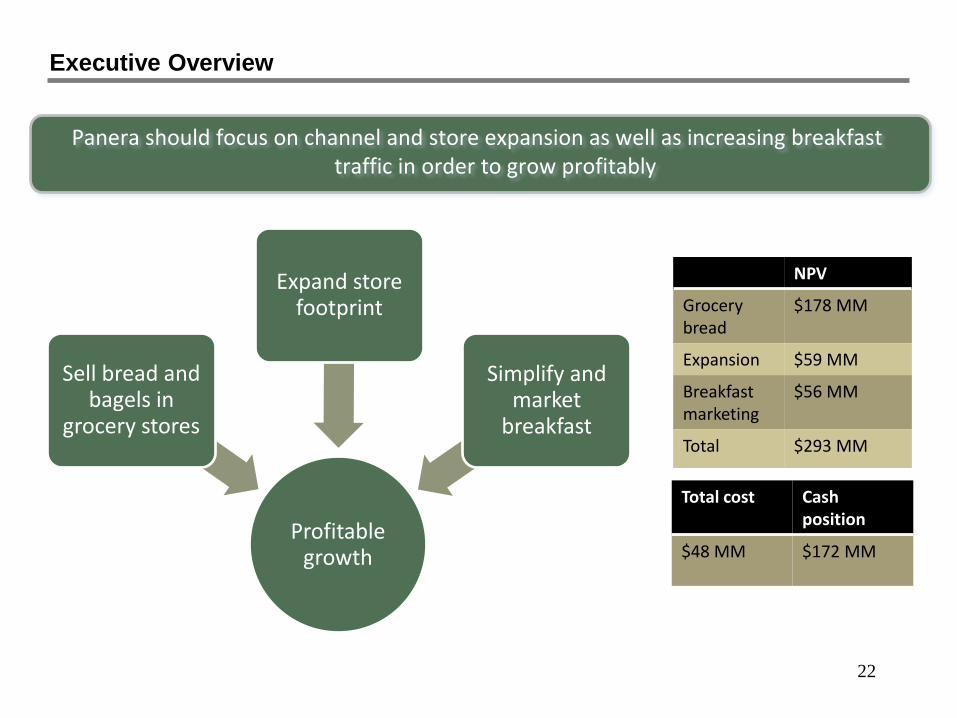
22
Panera should focus on channel and store expansion as well as increasing breakfast traffic in order to grow profitably
Profitable growth
Sell bread and bagels in
grocery stores
Expand store footprint
Simplify and market
breakfast
NPV
Grocery bread
$178 MM
Expansion $59 MM
Breakfast marketing
$56 MM
Total $293 MM
Total cost Cash position
$48 MM $172 MM
Executive Summary Executive Overview

BBBY should not enter Europe
The market growth rate and size
present challenges
Competition is
fierce
• No market gap
• Intense same
and cross-
format
competition
• IKEA is well
established in
Europe
No strong competitive advantage
• No brand
awareness
• No operational
advantages
The market growth rate and size
present challenges
23
• In Western
Europe, little or
no growth
• In Eastern
Europe, market
is small

Bed Bath & Beyond (BBBY) should enter the European Market within next 5 years to maintain its sustainable growth
Overall NPV of European Expansion is $260M
Assess BBBY’s potential for moving into European Market
OBJECTIVE
SUPPORT
CONCLUSION
24
1
2
The European market is more attractive than the U.S. market for growth
BBBY has the capabilities to enter the European Market
3 Expanding into Europe provides positive financial benefits

25
Amazon should leverage its core competencies of aggregator and low price provider in the e-book market
The total project NPV is $1.7B over the long term
How can Amazon best capitalize on eBooks in the long term?
Exit hardware market
(NPV - $650M)
Increase Software Capabilities
(NPV - $400M)
Target key growth areas in eBook market
(NPV - $618M)

Research Strategize
Diversify e-book revenue and expand the Amazon e-book community
Sell Advertising in e-books
Create the Kindle Kommunity
Convert e-books to e-pub format
Sell the Kindle in other retail channels
Increase the value of each e-book sold
Increase e-book sales to Kindle users
Sell e-books to all e-reader users
Increase number of people reading e-books
Objectives Recommended Actions Financial Impacts
(NPV)
$516M
$143M
$160M
$470M

- 27 - 6.0
_M
BA
Case C
om
petitio
n 2
009_P
resenta
tion T
em
pla
te_
20
09
10
02.p
pt
We recommend that Starbucks pursue three separate opportunities that leverage its
current brand equity and focus on its core business
Go Forward Strategy
Streamline Store
Operations
Revitalize Food Sales
Pursue International
Growth
Get Back to Basics
Financial Impact Key Consideration
Increase in Shareholder
Value
Streamline Store
Operations
$97M -$280M
Revitalise Food Sales $150M- $350M
Expansion Internationally $220M-$270M
Starbucks core business of coffee specialty
retail comprises the major of its revenue
Margins are greatest on ‘non licensee’
opportunities
Investors have punished Starbucks for
margin erosion despite almost double digit
sales growth in 2008
Starbucks is facing increased competition on
core business operations
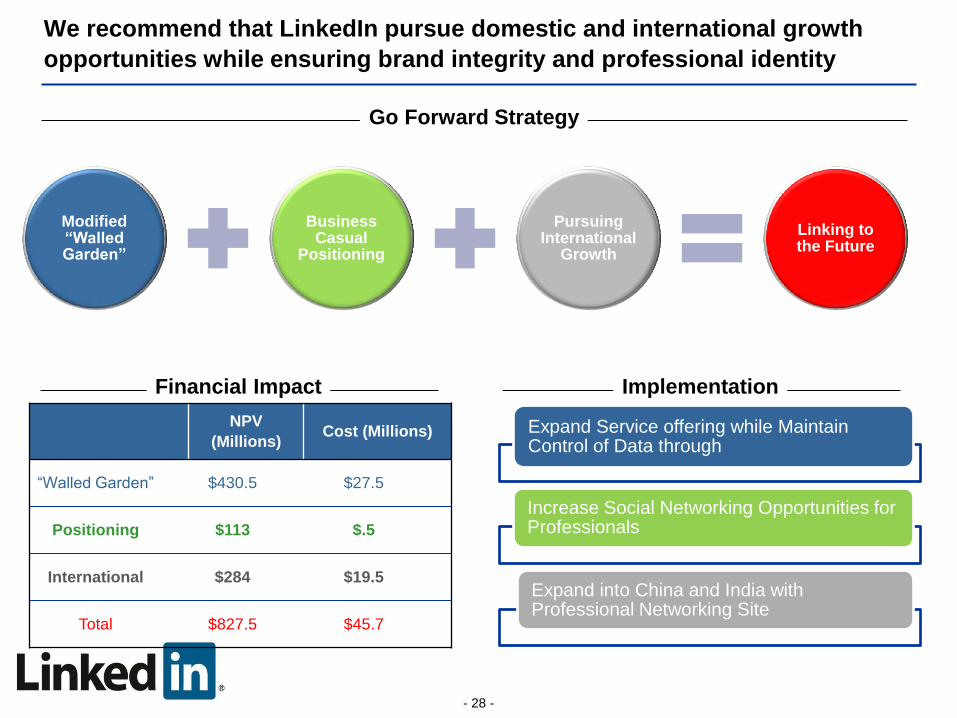
We recommend that LinkedIn pursue domestic and international growth
opportunities while ensuring brand integrity and professional identity
Go Forward Strategy
Modified “Walled Garden”
Business Casual
Positioning
Pursuing International
Growth
Linking to the Future
Expand Service offering while Maintain Control of Data through
Increase Social Networking Opportunities for Professionals
Expand into China and India with Professional Networking Site
- 28 -
Financial Impact Implementation
NPV
(Millions) Cost (Millions)
“Walled Garden” $430.5 $27.5
Positioning $113 $.5
International $284 $19.5
Total $827.5 $45.7
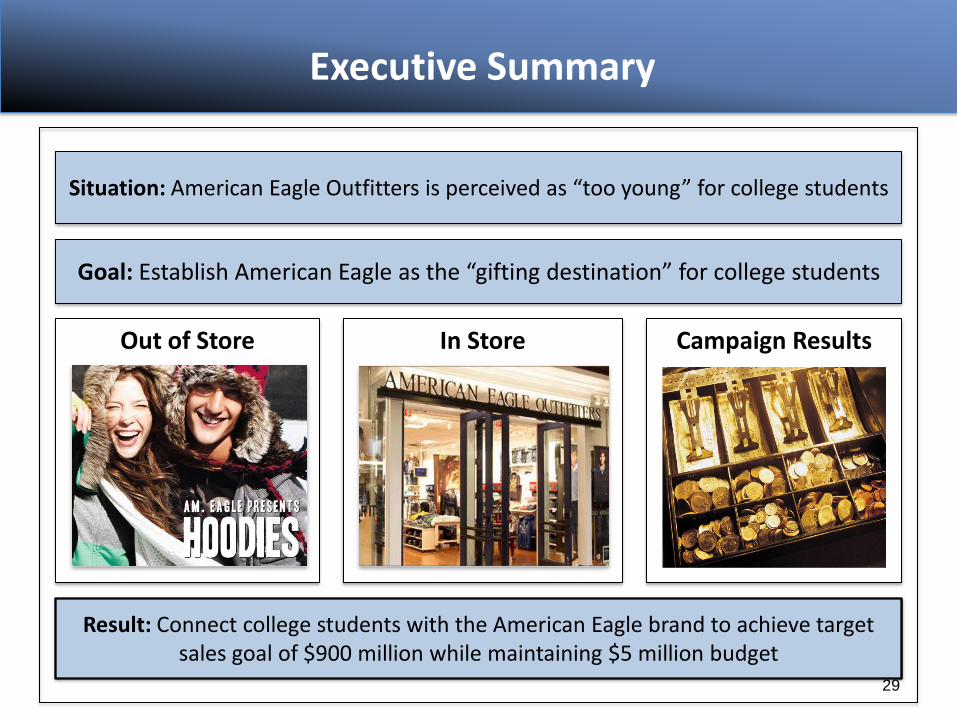
Out of Store In Store Campaign Results
Situation: American Eagle Outfitters is perceived as “too young” for college students
Result: Connect college students with the American Eagle brand to achieve target sales goal of $900 million while maintaining $5 million budget
Executive Summary
Goal: Establish American Eagle as the “gifting destination” for college students
29

Business Model Organization Risk Mitigation Awareness Infrastructure Financial Impact Schedule 30
Executing the Acme business model requires a focused and
comprehensive implementation plan
The Acme business model is centered on:
Utilizing a low cost structure
Managing the customer ownership experience
Fostering key partnerships
Phase 1:
Establish
Organization
Phase 3:
Build Physical
Infrastructure
Phase 4:
Create
Awareness
Phase 2:
Formulate
Partnerships
The aggressive implementation strategy will enable Acme to:
Begin selling the customer experience in Year 3
Realize an NPV of $900M
• Create Strategic
Leadership
Team
• Suppliers
• Service Providers
• Insurance
• Assembly Plants
• Retail Dealers
• IT Infrastructure
• Teaser Ads
• Messaging
• Roving Dealers
Strategy implementation involves a four phased approach:
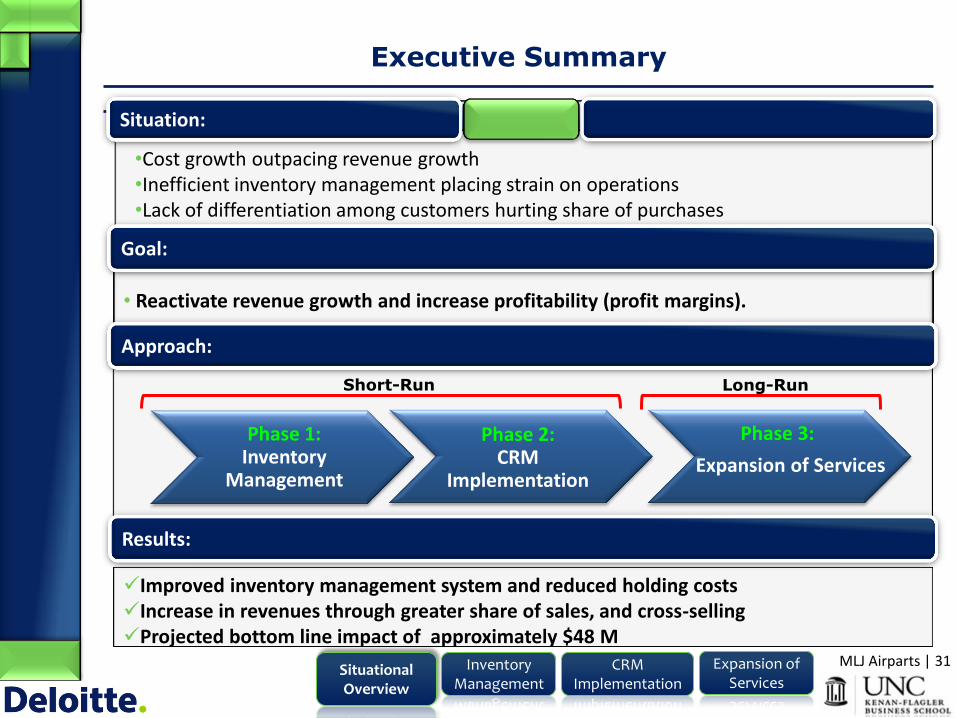
MLJ Airparts | 31 Inventory Management
CRM Implementation
Expansion of Services
Situational Overview
Executive Summary
•Cost growth outpacing revenue growth •Inefficient inventory management placing strain on operations •Lack of differentiation among customers hurting share of purchases •Jkl
Situation:
Long-Run Short-Run
Phase 2: CRM
Implementation
Phase 3:
Expansion of Services
Phase 1: Inventory
Management
• Reactivate revenue growth and increase profitability (profit margins).
Approach:
Improved inventory management system and reduced holding costs Increase in revenues through greater share of sales, and cross-selling Projected bottom line impact of approximately $48 M
Results:
Goal:
32
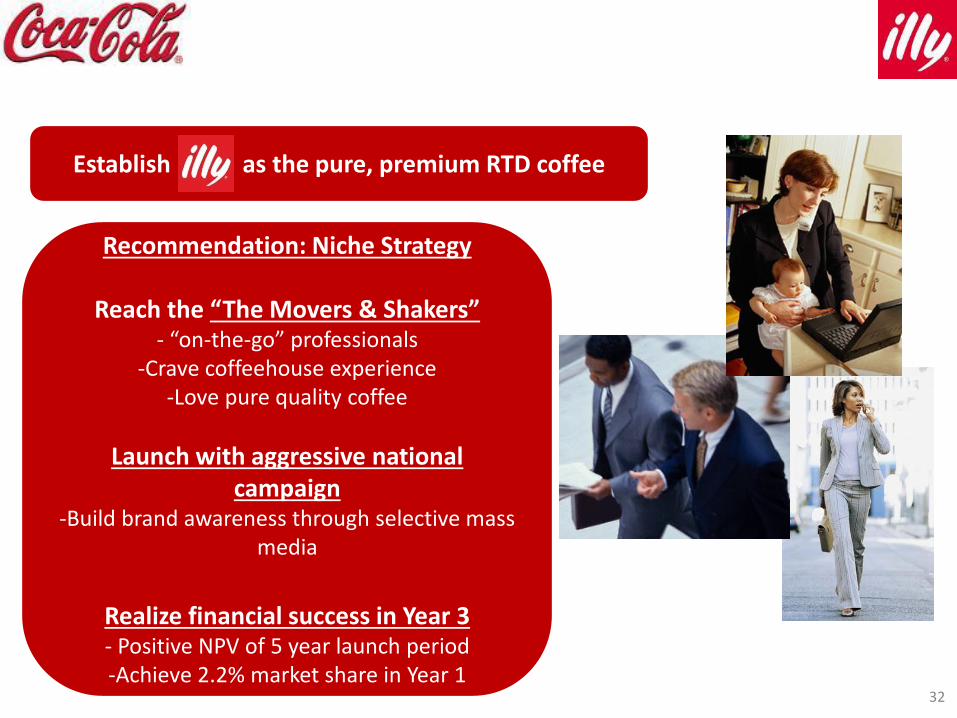
Recommendation: Niche Strategy
Reach the “The Movers & Shakers” - “on-the-go” professionals
-Crave coffeehouse experience -Love pure quality coffee
Launch with aggressive national campaign
-Build brand awareness through selective mass media
Realize financial success in Year 3 - Positive NPV of 5 year launch period -Achieve 2.2% market share in Year 1
Establish as the pure, premium RTD coffee

Leverage Panera’s brand equity to invest in three customer expansion projects to grow profitably
33
Financial Impact Go Forward Strategy
Strategically Expand Store
Locations
Enter New Distribution
Channel
Introduce New Menu Items
Note: 2009 Revenue: $1.3B, Profits: $86M
Panera Profitable Growth Strategy (8 yr Operating Income NPV in millions)
$310
$265
$59
6
3
4
Strategically Expand Store
Locations
Introduce New Menu
Items
Enter New Distribution
Channel
Total Customer Expansion
Implementation of these projects will generate an 8 year NPV of $634 M

Powerful Use of PowerPoint| Dr. Paul Friga
Lucy to Shirley – “A”
Dear Shirley,
Remember last Saturday afternoon when I was playing in the park with my boyfriend and you came over, and he told me that when my back was turned, you kissed him? And also, on Sunday when you came to my house and my Mom made you a tuna fish salad for lunch and you said: “Yech! That’s the worst salad I ever ate!”? And yesterday, when my cat brushed against your leg, you kicked her and threatened to sic your dog “Monster” on her? Well, for all of these reasons, I hate you, and I no longer want to be your friend.
Lucy
Source: Gene Zelazny,. Say It with Presentations.
34

Powerful Use of PowerPoint| Dr. Paul Friga
Lucy to Shirley – “B”
Dear Shirley,
I HATE you. Here are my reasons:
1. You stole my boyfriend.
2. You insulted my mother.
3. You scared my cat.
Source: Gene Zelazny,. Say It with Presentations.
35

Powerful Use of PowerPoint| Dr. Paul Friga
You should be able to understand an entire presentation by the
headlines
36
Powerful Use of PowerPoint| Dr. Paul Friga
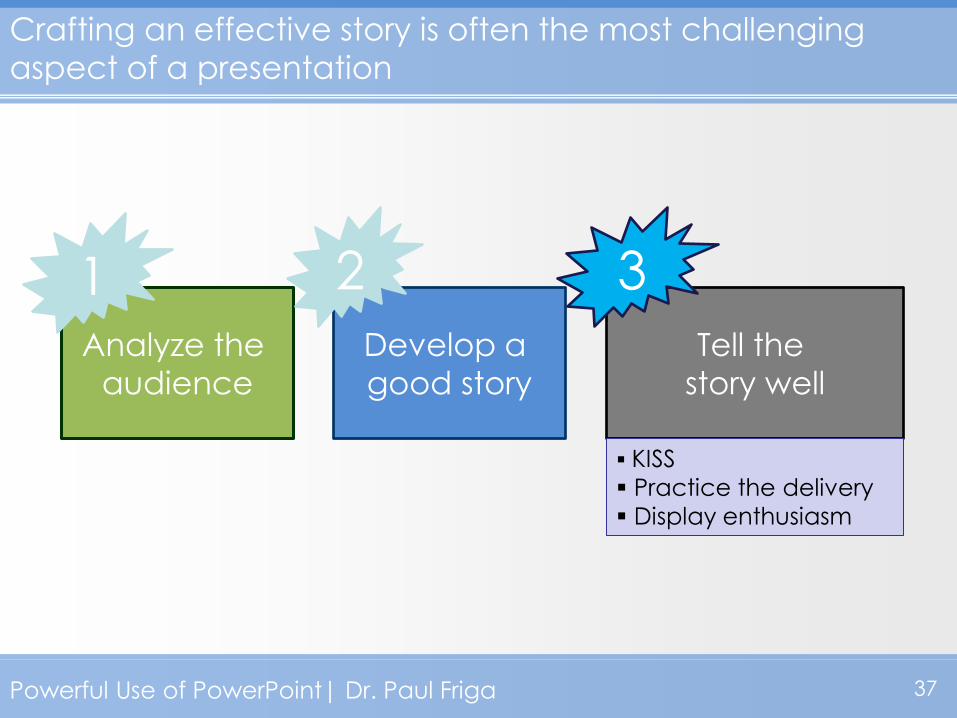
Crafting an effective story is often the most challenging
aspect of a presentation
Analyze the
audience
Develop a
good story
1 Tell the
story well
2
KISS
Practice the delivery
Display enthusiasm
3
37
Powerful Use of PowerPoint| Dr. Paul Friga
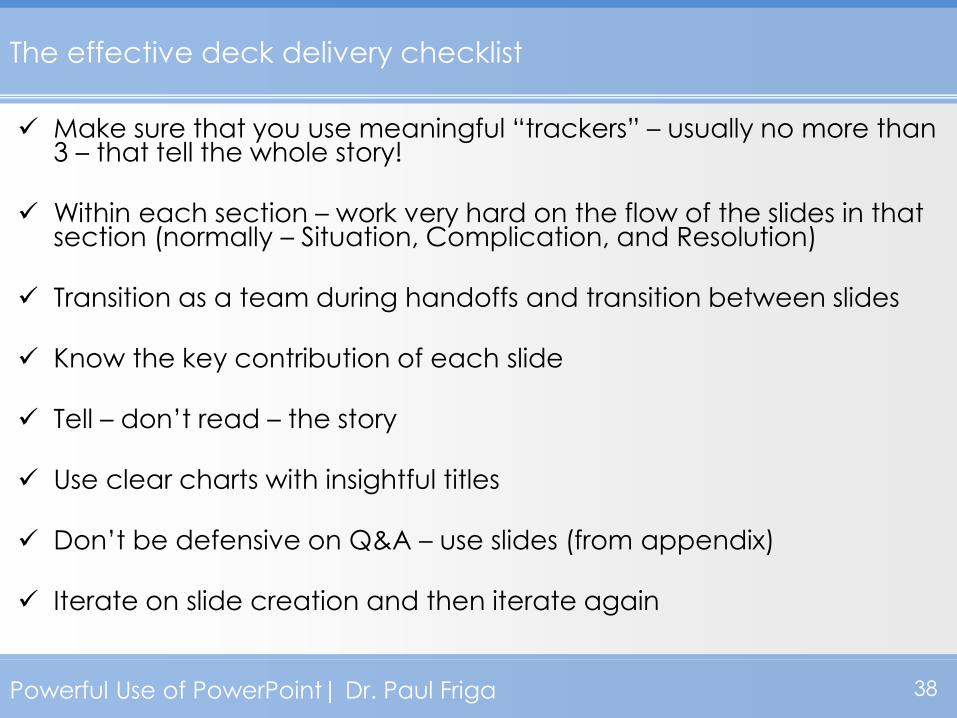
The effective deck delivery checklist
Make sure that you use meaningful “trackers” – usually no more than 3 – that tell the whole story!
Within each section – work very hard on the flow of the slides in that
section (normally – Situation, Complication, and Resolution)
Transition as a team during handoffs and transition between slides
Know the key contribution of each slide
Tell – don’t read – the story
Use clear charts with insightful titles
Don’t be defensive on Q&A – use slides (from appendix)
Iterate on slide creation and then iterate again
38

39
THE MARKET IS GROWING RAPIDLY
Total Market Revenue
US$ billions
4.2
Source: XYZ research report; estimate for 2004 from ABC report
5.3
6.2
6.9
7.3 7.5
CAGR= 12%
1999 2000 2001 2002 2003 2004
Title = the “so what”
Graph name
Units
Source
Any other units specified
Less is more … only show essential information
T E M A F O U C S
SYNTHESIZE: Final Sample Slide
TEMPLATES
39

Powerful Use of PowerPoint| Dr. Paul Friga
Our session today
At UNC Kenan-Flagler
Beyond our “walls”
40
The Stage
The Approach
The Resources
Powerful Use of PowerPoint| Dr. Paul Friga
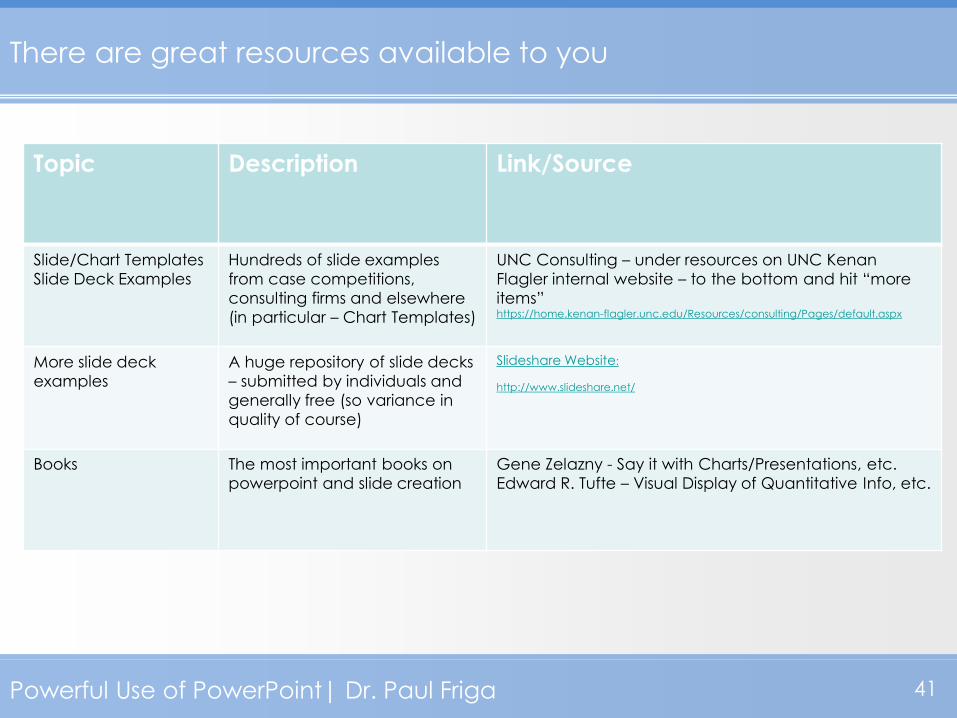
There are great resources available to you
Topic Description Link/Source
Slide/Chart Templates
Slide Deck Examples
Hundreds of slide examples
from case competitions,
consulting firms and elsewhere
(in particular – Chart Templates)
UNC Consulting – under resources on UNC Kenan
Flagler internal website – to the bottom and hit “more
items” https://home.kenan-flagler.unc.edu/Resources/consulting/Pages/default.aspx
More slide deck
examples
A huge repository of slide decks
– submitted by individuals and
generally free (so variance in
quality of course)
Slideshare Website:
http://www.slideshare.net/
Books The most important books on
powerpoint and slide creation
Gene Zelazny - Say it with Charts/Presentations, etc.
Edward R. Tufte – Visual Display of Quantitative Info, etc.
41

Chart Types
• What follows are the most common types of charts used by
consultants
• These slides are actually in powerpoint and can be used as templates
(they are from the TEAM FOCUS slide deck)
• We highly recommend securing other resources from the UNC
Consulting sharepoint site (especially Chart Templates-Monitor)
• It is perfectly fine to borrow these slides and templates for use in
future presentations
42
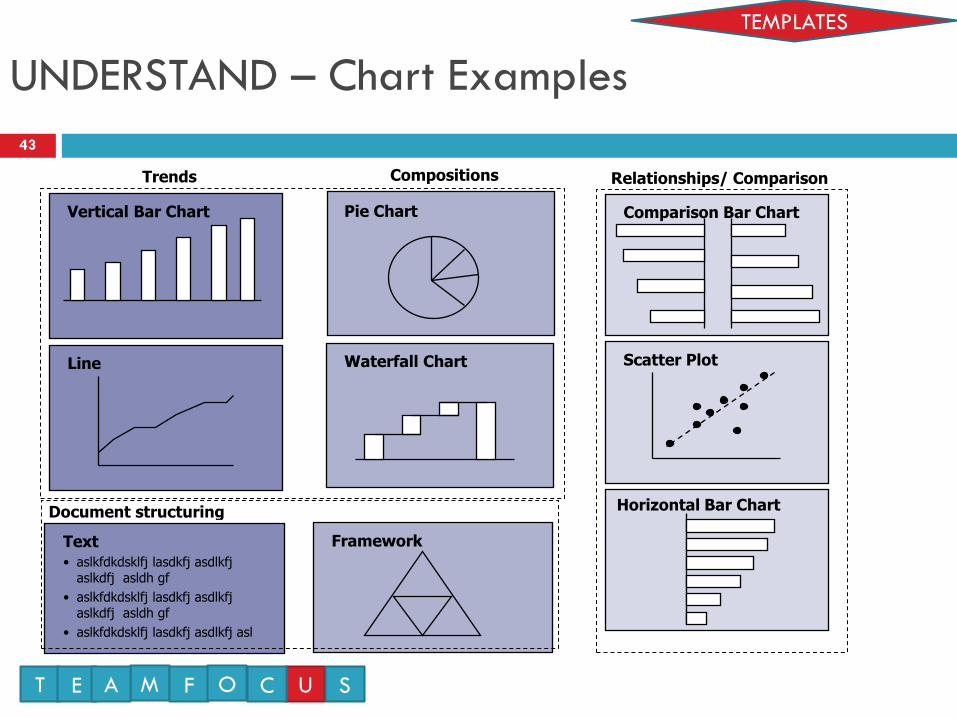
UNDERSTAND – Chart Examples
Vertical Bar Chart
Line
Trends
Waterfall Chart
Pie Chart
Compositions
Document structuring
Text
• aslkfdkdsklfj lasdkfj asdlkfj aslkdfj asldh gf
• aslkfdkdsklfj lasdkfj asdlkfj aslkdfj asldh gf
• aslkfdkdsklfj lasdkfj asdlkfj asl
Framework
Horizontal Bar Chart
Comparison Bar Chart
Scatter Plot
Relationships/ Comparison
T E M A F O U C S
TEMPLATES
43
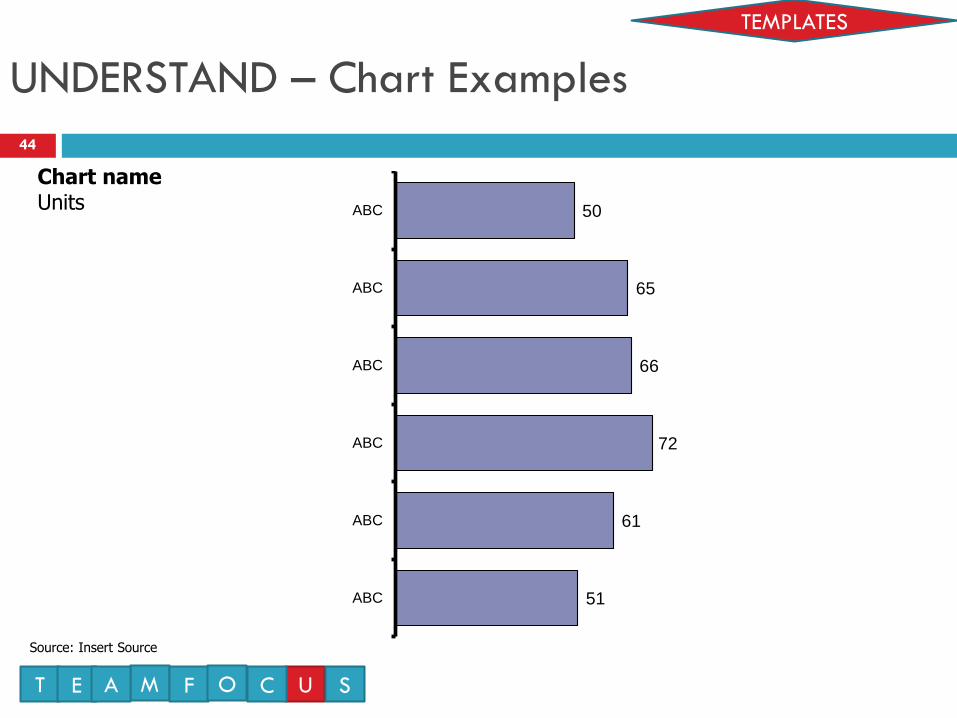
51
61
72
66
65
50
ABC
ABC
ABC
ABC
ABC
ABC
Chart name Units
TEMPLATES
T E M A F O U C S
Source: Insert Source
44
UNDERSTAND – Chart Examples

20.1
9.2
5.7
65.0 ABC
Chart name Units
DEF
GHI
JKL
100% = 84,586
TEMPLATES
T E M A F O U C S
Source: Insert Source
45
UNDERSTAND – Chart Examples
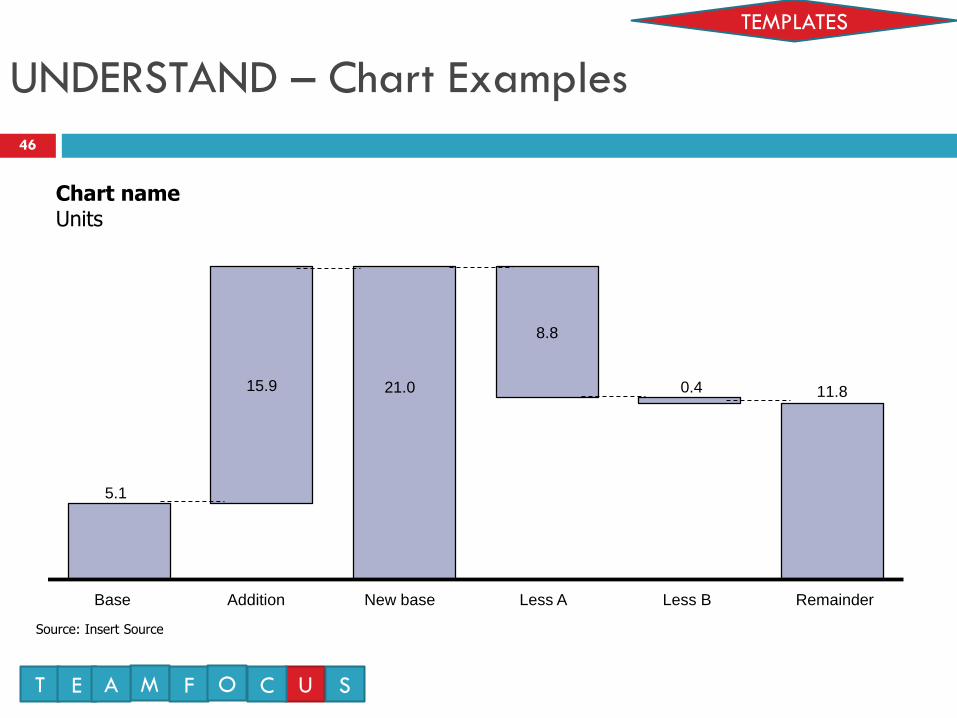
5.1
15.9 21.0
8.8
0.4 11.8
Chart name Units
Base Addition New base Less A Less B Remainder
TEMPLATES
T E M A F O U C S
Source: Insert Source
46
UNDERSTAND – Chart Examples
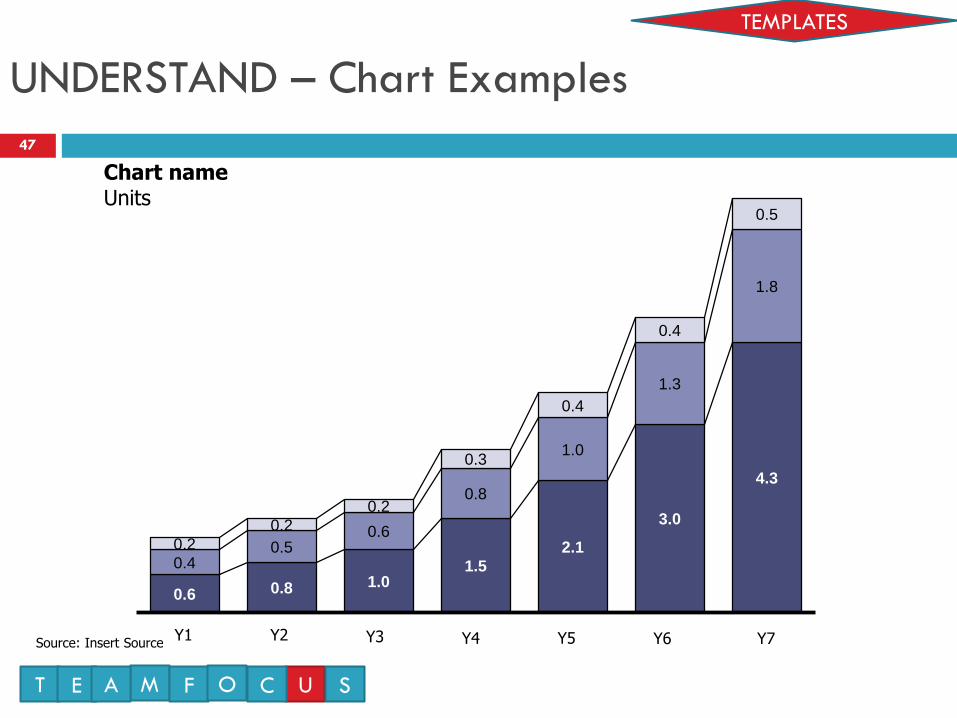
0.6 0.8 1.0 1.5
2.1
3.0
4.3
0.4 0.5
0.6
0.8
1.0
1.3
1.8
0.2
0.2
0.2
0.3
0.4
0.4
0.5
Y1 Y2 Y3 Y4 Y5 Y6 Y7
Chart name Units
TEMPLATES
T E M A F O U C S
Source: Insert Source
47
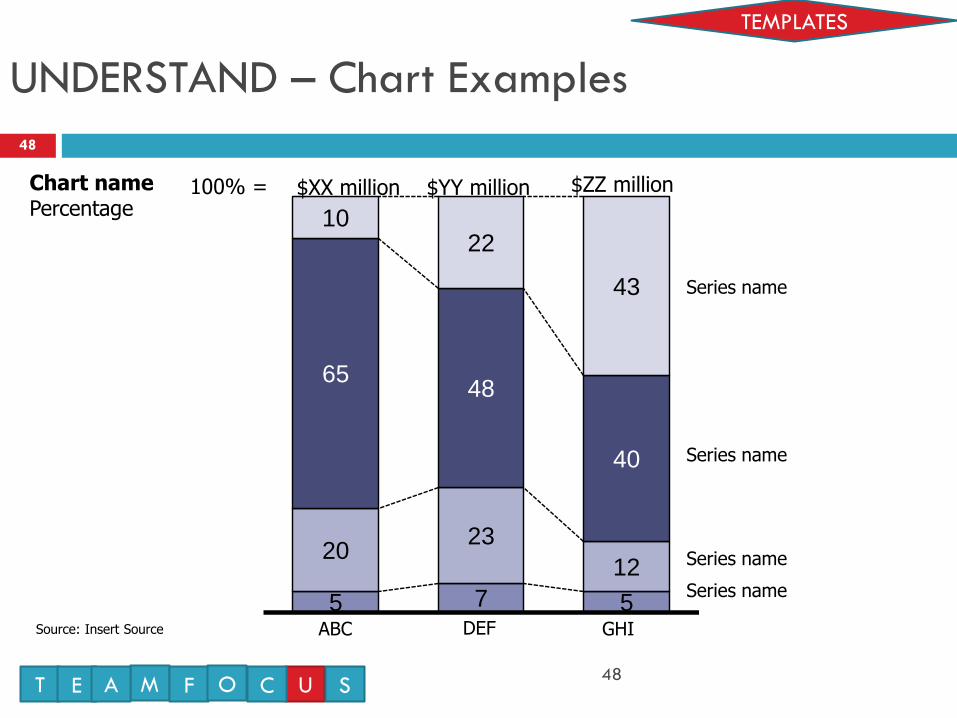
UNDERSTAND – Chart Examples
48
100% =
Series name
5 7 5
20 23
12
65 48
40
10 22
43
Series name
Series name
Series name
$XX million $YY million $ZZ million Chart name Percentage
DEF ABC GHI
TEMPLATES
T E M A F O U C S
Source: Insert Source
48
UNDERSTAND – Chart Examples
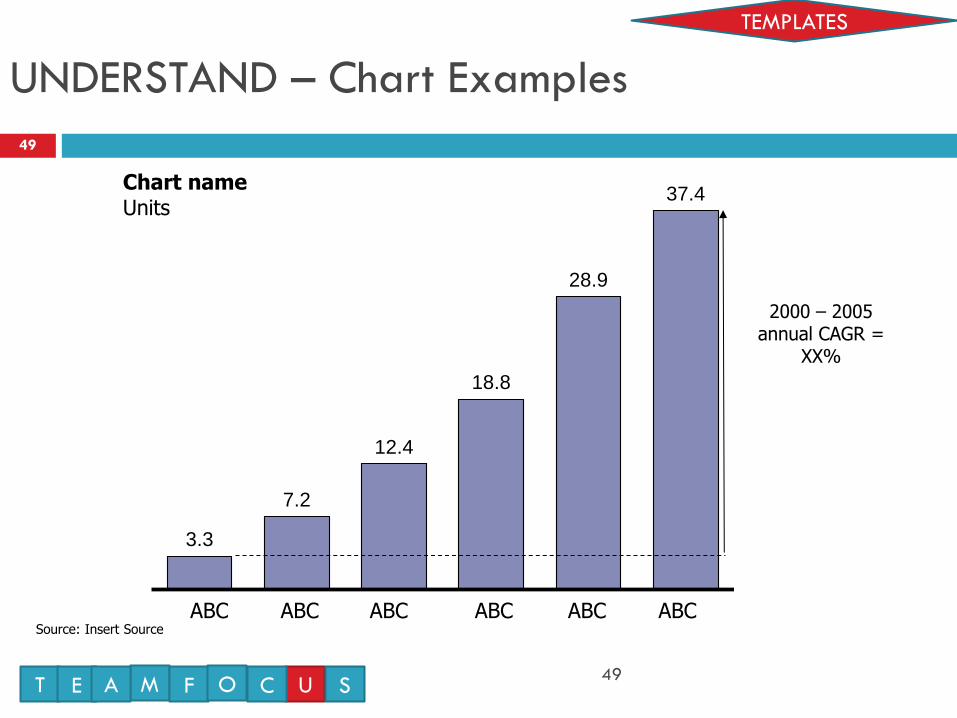
49
3.3
7.2
12.4
18.8
28.9
37.4
ABC ABC ABC ABC ABC
2000 – 2005 annual CAGR =
XX%
ABC
Chart name Units
TEMPLATES
T E M A F O U C S
Source: Insert Source
49
UNDERSTAND – Chart Examples

0.5
1.1
1.9
2.8
4.2
5.0
0.4
0.9
1.4
2.0
2.5
4.2
[ENTER CONCLUSION/ “SO WHAT” HERE
ABC ABC ABC ABC ABC ABC
Chart name Units
[SERIES 1]
[SERIES 2]
Source: The McKinsey Engagement by Paul N. Friga
TEMPLATES
T E M A F O U C S
Source: Insert Source
50
UNDERSTAND – Chart Examples
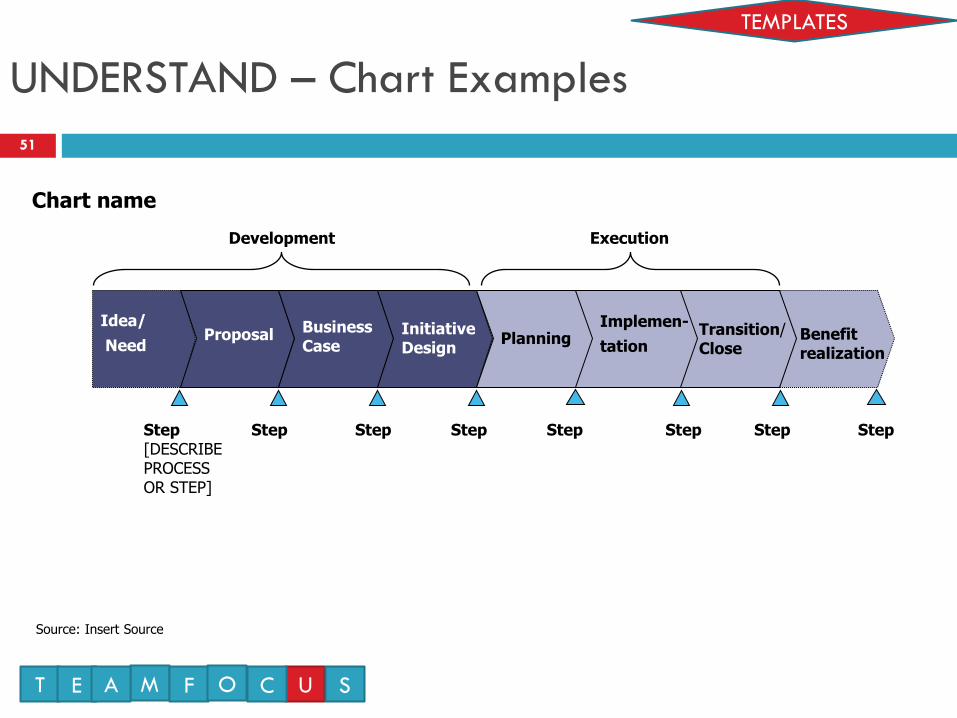
Chart name
Benefit realization
Idea/
Need
Proposal
Business Case
Initiative Design
Planning Transition/ Close
Step [DESCRIBE PROCESS OR STEP]
Execution
Implemen-
tation
Development
Step Step Step Step Step Step Step
Source: The McKinsey Engagement by Paul N. Friga
TEMPLATES
T E M A F O U C S
Source: Insert Source
51
UNDERSTAND – Chart Examples

52
Governing
thought
(answer)
Key line
(proof)
Support
(facts)
What
would
have to
be true?
What
would
have to
be true?
Use structured logic
Try to stay MECE
Look from the decision-
maker’s perspective
SYNTHESIZE: Storyline Logic
T E M A F O U C S
TEMPLATES
52

53
THE MARKET IS GROWING RAPIDLY
Total Market Revenue
US$ billions
4.2
Source: XYZ research report; estimate for 2004 from ABC report
5.3
6.2
6.9
7.3 7.5
CAGR= 12%
1999 2000 2001 2002 2003 2004
Title = the “so what”
Graph name
Units
Source
Any other units specified
Less is more … only show essential information
T E M A F O U C S
SYNTHESIZE: Final Sample Slide
TEMPLATES
53
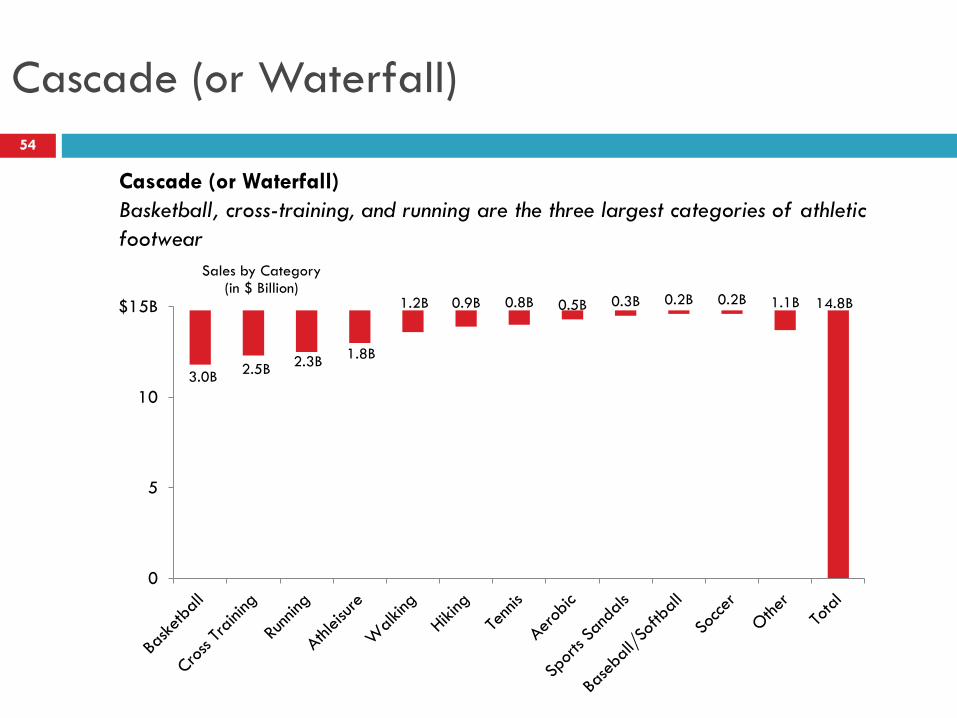
Cascade (or Waterfall)
54
3.0B 2.5B
2.3B 1.8B
1.2B 0.9B 0.8B 0.5B 0.3B 0.2B 0.2B 1.1B 14.8B
0
5
10
$15B
Sales by Category (in $ Billion)
Cascade (or Waterfall)
Basketball, cross-training, and running are the three largest categories of athletic
footwear
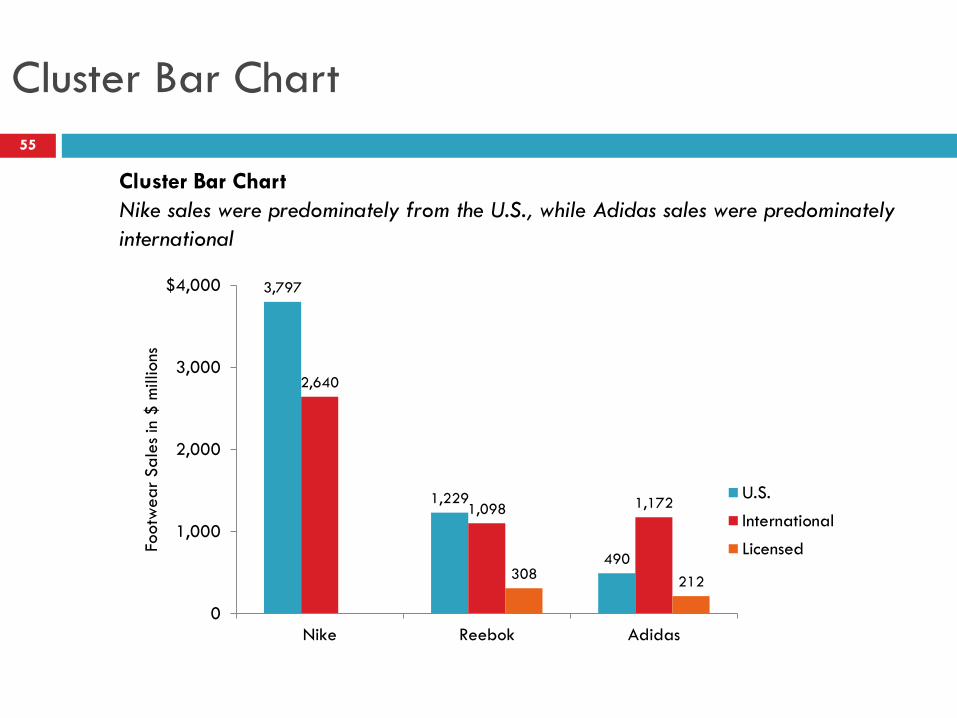
Cluster Bar Chart
55
Cluster Bar Chart
Nike sales were predominately from the U.S., while Adidas sales were predominately
international
3,797
1,229
490
2,640
1,098 1,172
308 212
0
1,000
2,000
3,000
$4,000
Nike Reebok Adidas
Footw
ear
Sa
les
in $
millions
U.S.
International
Licensed

Stacked Bar Chart
56
Nike, 3,261 Nike, 3,797
Reebok, 1,193
Reebok, 1,229 Adidas, 390
Adidas, 490 Fila, 555
Fila, 488 Converse, 194
Converse, 285 Others, 1,622
Others, 1,785
0
2,000
4,000
6,000
8,000
$10,000
1996 1997
Footw
ear
Sa
les
in $
million
CAGR
12%
10%
47%
-12%
26%
3%
16%
$7,215
$8,074
Stacked Bar Chart
Fila sales decreased significantly, while converse sales increased by almost 50%

Horizontal Cluster Bar Chart
57
Stacked Bar Chart
Fila sales decreased significantly, while converse sales increased by almost 50%
165
407
1,172
1,098
2,640
285
488
490
1,229
3,797
0 1,000 2,000 3,000 $4,000
Converse
Fila
Adidas
Reebok
Nike
Footwear sales in $ millions
U.S.
International

100% Stacked Bar Chart
58
100% Stacked Bar Chart
Nike dominates U.S. branded athletic footwear market
Nike 47%
Reebok 15%
Adidas 6%
Fila 6%
Converse 4% New Balance 3%
Airwalk 2%
Keds 2%
Footjoy 2% Others 11%
0%
20%
40%
60%
80%
100%
1997
$8,074
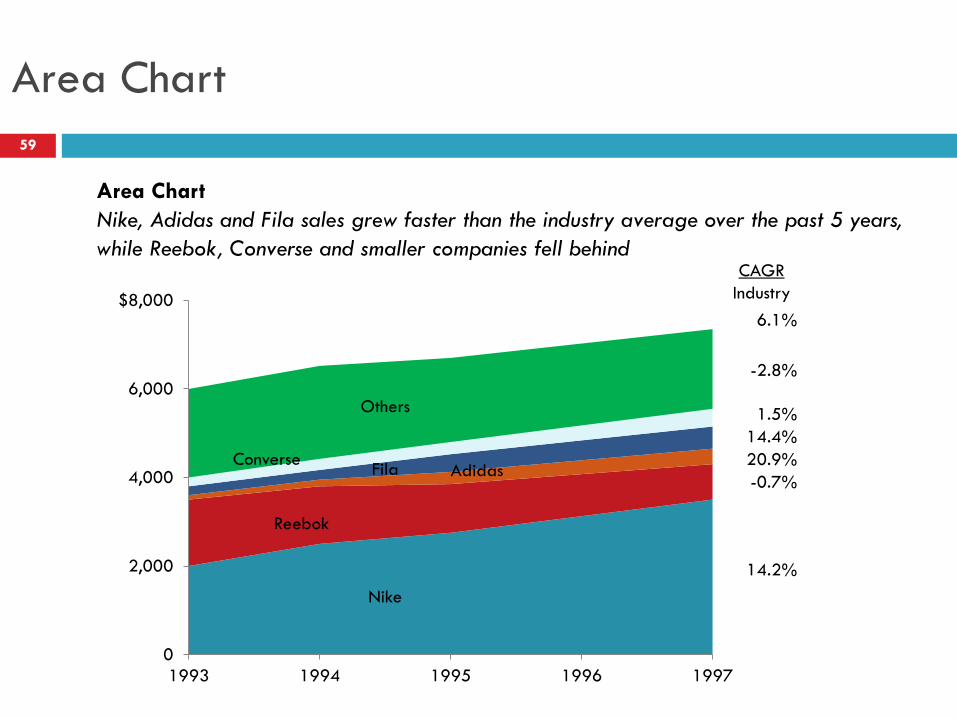
Area Chart
59
Area Chart
Nike, Adidas and Fila sales grew faster than the industry average over the past 5 years,
while Reebok, Converse and smaller companies fell behind
Nike
Reebok
Adidas Fila Converse
Others
0
2,000
4,000
6,000
$8,000
1993 1994 1995 1996 1997
CAGR
Industry
6.1%
-2.8%
1.5%
14.4%
20.9%
-0.7%
14.2%
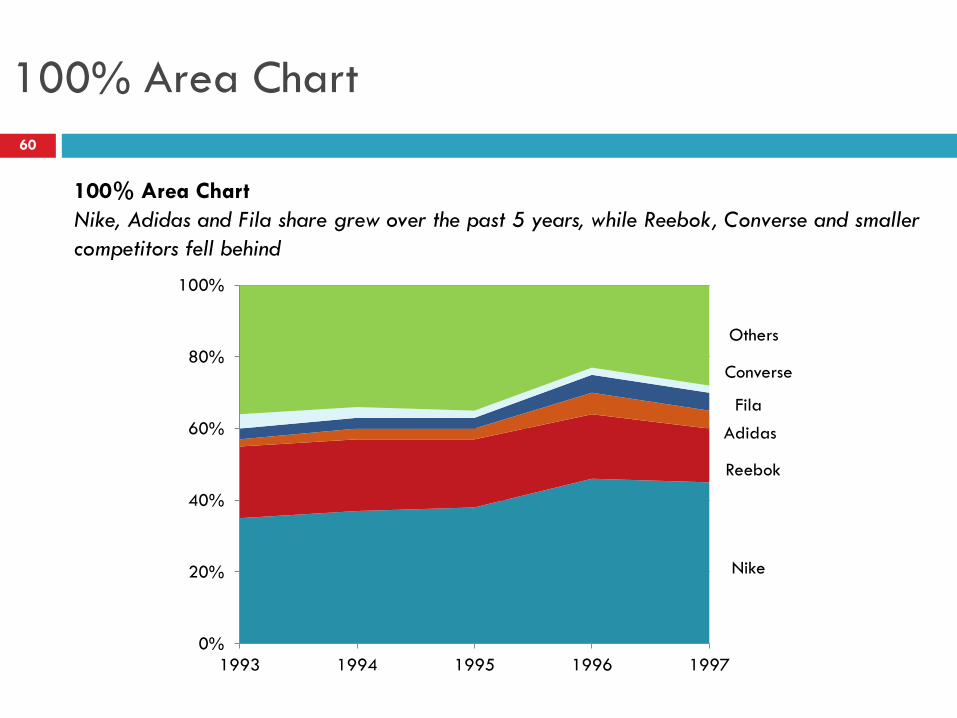
100% Area Chart
60
100% Area Chart
Nike, Adidas and Fila share grew over the past 5 years, while Reebok, Converse and smaller
competitors fell behind
Nike
Reebok
Adidas
Fila
Converse
Others
0%
20%
40%
60%
80%
100%
1993 1994 1995 1996 1997

Stacked Bar Line Chart
61
Stacked Bar Line Chart
Nike’s sales have increased significantly with a greater reliance on non-U.S. markets. Net
income growth has not kept pace with sales growth.
U.S
. Eu
rop
e Asia
Pacific
Americas
287 329 365 299 400 553 796 400 451 579 590
0
2,000
4,000
6,000
8,000
$10,000
Net Income
($ million)
Sales & Net Income in $ Million
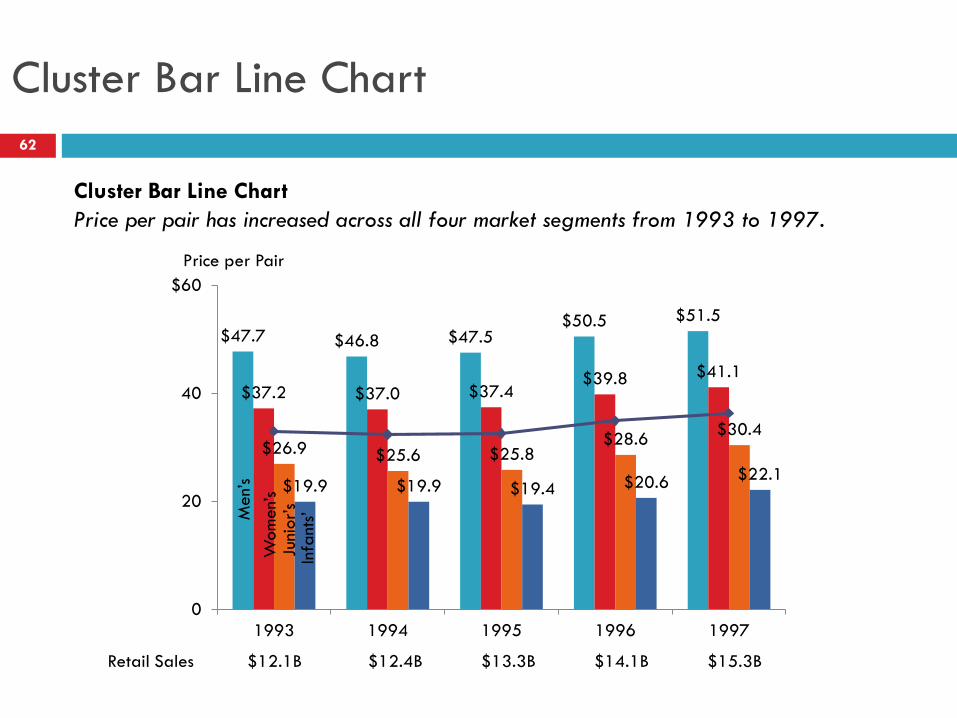
Cluster Bar Line Chart
62
Cluster Bar Line Chart
Price per pair has increased across all four market segments from 1993 to 1997.
$47.7 $46.8 $47.5 $50.5 $51.5
$37.2 $37.0 $37.4 $39.8 $41.1
$26.9 $25.6 $25.8 $28.6
$30.4
$19.9 $19.9 $19.4 $20.6 $22.1
0
20
40
$60
1993 1994 1995 1996 1997
Price per Pair
Retail Sales $12.1B $12.4B $13.3B $14.1B $15.3B
Men’
s
Wom
en’
s Ju
nior’s
Infa
nts’
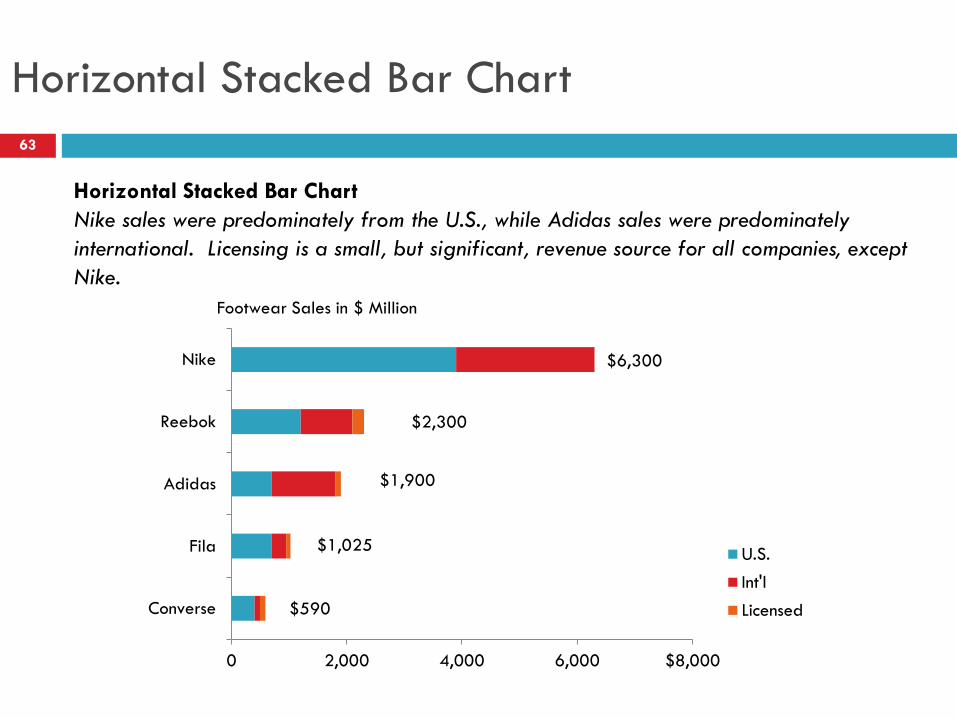
Horizontal Stacked Bar Chart
63
Horizontal Stacked Bar Chart
Nike sales were predominately from the U.S., while Adidas sales were predominately
international. Licensing is a small, but significant, revenue source for all companies, except
Nike.
$590
$1,025
$1,900
$2,300
0 2,000 4,000 6,000 $8,000
Converse
Fila
Adidas
Reebok
Nike
U.S.
Int'l
Licensed
$6,300
Footwear Sales in $ Million

Line Chart
64
Line Chart
Nike overtook Reebok in sales in 1989 and has grown rapidly.
0
1,000
2,000
3,000
$4,000
1988 1989 1990 1991 1992 1993 1994 1995 1996 1997
Nike
Reebok
Footwear Sales in $ Million
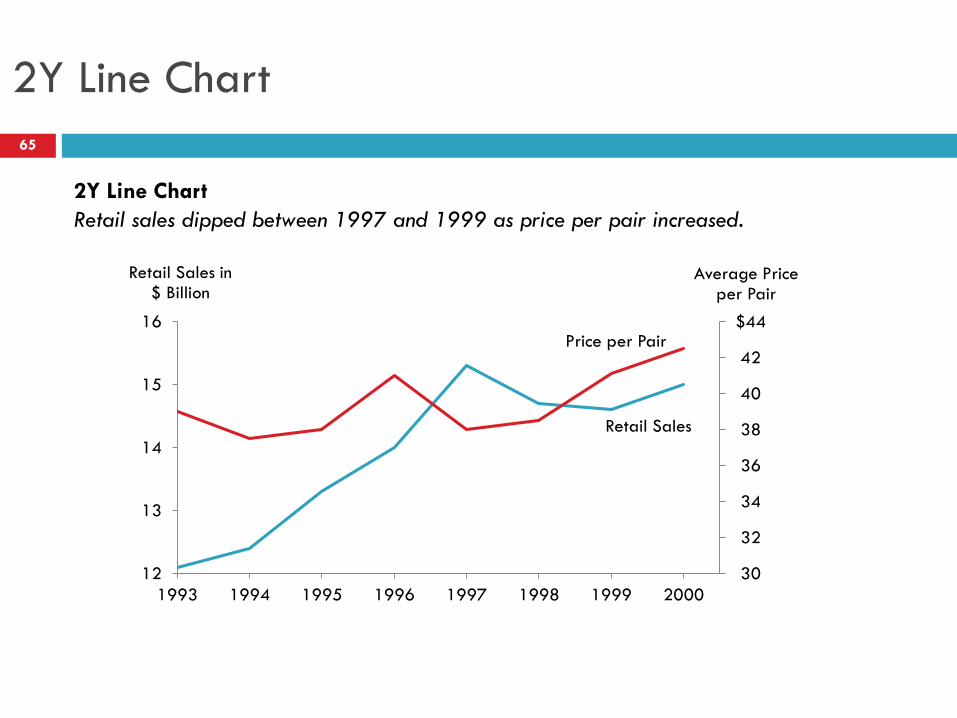
2Y Line Chart
65
2Y Line Chart
Retail sales dipped between 1997 and 1999 as price per pair increased.
Retail Sales
Price per Pair
30
32
34
36
38
40
42
$44
12
13
14
15
16
1993 1994 1995 1996 1997 1998 1999 2000
Average Price per Pair
Retail Sales in $ Billion
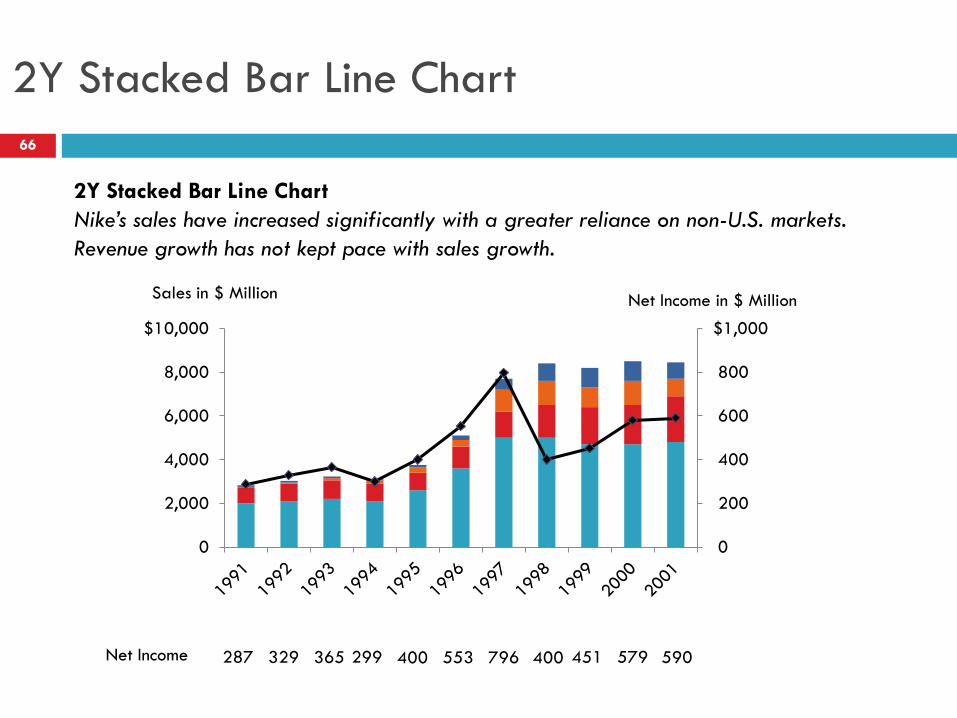
2Y Stacked Bar Line Chart
66
2Y Stacked Bar Line Chart
Nike’s sales have increased significantly with a greater reliance on non-U.S. markets.
Revenue growth has not kept pace with sales growth.
287 329 365 299 400 553 796 400 451 579 590
0
200
400
600
800
$1,000
0
2,000
4,000
6,000
8,000
$10,000
Sales in $ Million Net Income in $ Million
Net Income

2Y Cluster Bar Line Chart
67
2Y Cluster Bar Line Chart
Retail sales dipped between 1997 and 1999 as price per pair increased.g
12.1B 12.4B 13.3B
14.1B 15.3B 14.7B 14.5B 15.1B
0
10
20
30
40
$50
0
5
10
15
20
$25
1993 1994 1995 1996 1997 1998 1999 2000
Retail Sales in $ Billion Average Price per Pair Reta
il S
ale
s

Pie Chart
68
Pie Chart
Nike dominates U.S. branded athletic footwear market.
Nike 3,797
Reebok 1,229
Adidas 490
Fila 488
Converse 285
New Balance 265
Airwalk 180
Keds 180
ASICS 130
Footjoy 122
Others 908

69
X-Y Linear Bubble Chart
X-Y Linear Bubble Chart
Nike experienced strong growth in the U.S. and overseas, while Fila experienced
international growth and lower U.S. sales.
-20%
0%
20%
40%
-20% 0% 20% 40%
Nike Fila
Reebok
Adidas
New
Balance
Converse
ASICS
U.S. Sales Growth
International Sales Growth
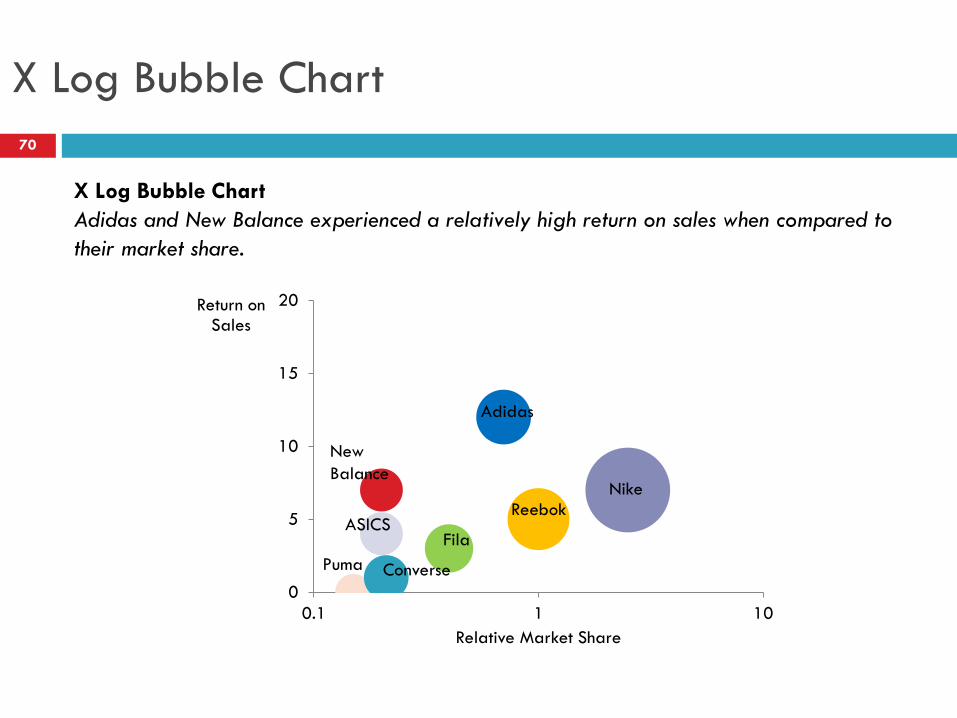
X Log Bubble Chart
70
X Log Bubble Chart
Adidas and New Balance experienced a relatively high return on sales when compared to
their market share.
0
5
10
15
20
0.1 1 10
Return on Sales
Relative Market Share
Nike
Reebok
Adidas
Fila
New
Balance
ASICS
Converse Puma
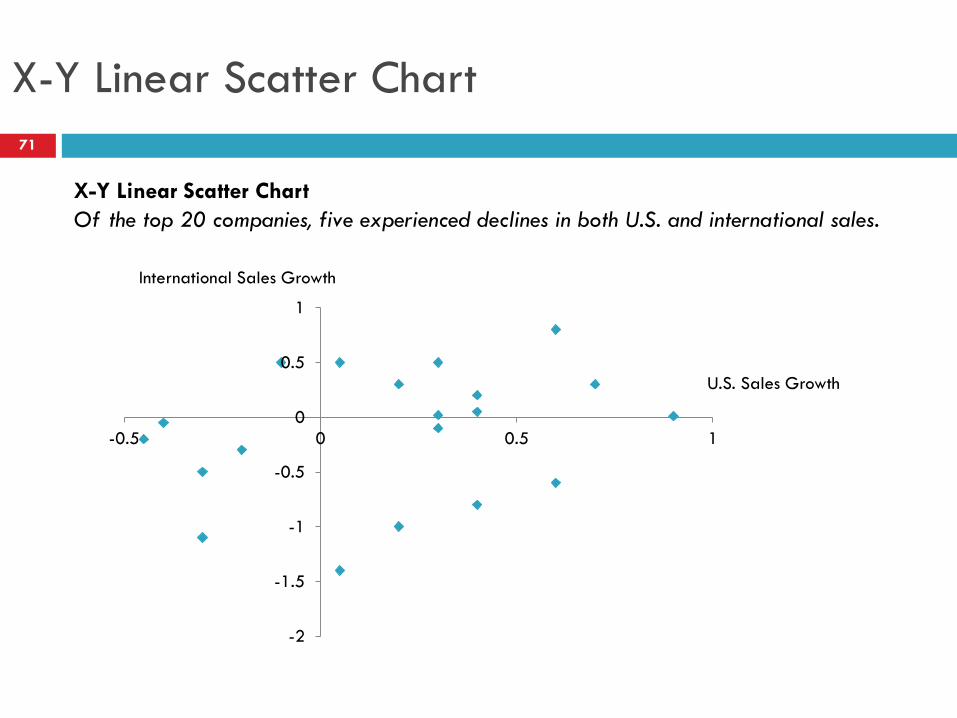
X-Y Linear Scatter Chart
71
X-Y Linear Scatter Chart
Of the top 20 companies, five experienced declines in both U.S. and international sales.
-2
-1.5
-1
-0.5
0
0.5
1
-0.5 0 0.5 1
U.S. Sales Growth
International Sales Growth

Gantt Chart
72
0 7 14 21 28
Ship Date
Deploy
Design
Website
Fix Defects
Test Build
Create Build
Second Iteration
Fix Defects
Test Build
Create Build
First Iteration
QA Product
January
Gantt Chart
Product release project plan.
Tasks
Value Chain
73
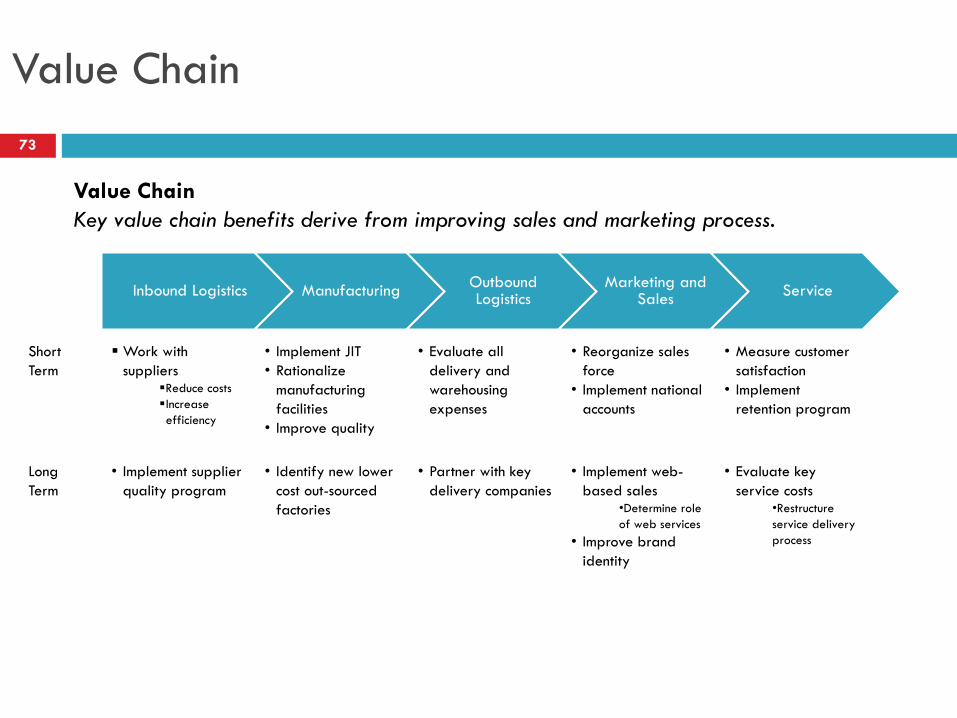
Value Chain
Key value chain benefits derive from improving sales and marketing process.
Inbound Logistics Manufacturing Outbound Logistics
Marketing and Sales
Service
Short
Term
Work with
suppliers Reduce costs
Increase
efficiency
• Implement JIT
• Rationalize
manufacturing
facilities
• Improve quality
• Evaluate all
delivery and
warehousing
expenses
• Reorganize sales
force
• Implement national
accounts
• Measure customer
satisfaction
• Implement
retention program
Long
Term
• Implement supplier
quality program
• Identify new lower
cost out-sourced
factories
• Partner with key
delivery companies
• Implement web-
based sales •Determine role
of web services
• Improve brand
identity
• Evaluate key
service costs •Restructure
service delivery
process

Stoplight Chart
74
Stoplight Chart
Nike is in the strongest competitive position; Converse is in the weakest.
Nike Reebok New Balance Converse
Relationship with
customers
Relationships
with suppliers
Cost
Financial
Strength
Manufacturing
Technology
Information
Technology