determining the importance of an independent variable - deep blue
TRANSCRIPT
SOCIAL SCIENCE RESEARCH, 3, 95-107 (1974)
Determining the Importance of an Independent Variable: A Path Analytic Solution
MICHAEL S. LEWIS-BECK1
University of Michigan, Ann Arbor, Michigan
Various methods have been proposed for evaluating the importance of an independent variable in determining a given dependent variable. This paper suggests that the analysis of direct and indirect effects in a recursive causal model can provide a more satisfactory evaluation than the ordinary correlation and regression techniques commonly used. The interpretation of an independent variable’s impact derived from a path model is generally more adequate because it is able to take into account the operation of indirect effects and spuriousness. To demonstrate this contention, data gathered by the author to explain organizational innovation are presented.
In the literature concerning the partitioning of variance, there has been a continued debate over how to determine the “importance” of a particular independent variable for explaining a given phenomenon.2 Provided the necessary conditions are met, the technique of decomposing simple bivariate correlations in terms of the paths in a recursive causal model appears to offer a solution to this controversy. I wish to present a causal model I developed to explain organizational innovation, decompose the relationships in the model, and suggest how the importance of each of the independent variables for innovation can be evaluated.
A RECURSIVE MODEL OF ORGANIZATIONAL INNOVATION
The model diagrammed in Fig. 1 was constructed to explain innovation in organizations of Third World nations. 3 Decentralization of influence,
1I would like especially to thank Lawrence B. Mohr, Dept. of Political Science, University of Michigan, for his valuable contributions to the development of this paper. I wish also to mention that the research reported here was financed by a National Science Foundation Doctoral Dissertation Research Grant.
2For different perspectives on this controversy, see Darlington (1968); Duncan (1970); Gordon (1968); Hoffman (1962); Linn and Werts (1968); Ward (1969); Werts (1968); Werts and Linn (1969).
3The data for the model were collected by the author in Peru, 1971-1972; interviews were carried out with 543 hospital professionals in a national probability sample of 32 hospitals. The material gathered in these interviews was used to construct indicators of the organizational variables in the model.
95
Copyright @ 1974 by Academic Press, Inc. All rights of reproduction in any form reserved.

96 MICHAEL S. LEWIS-BECK
Fig. 1. Recursive Model of Organizational Innovation.
resources, cooperation, and rewards structure are held to be the direct and indirect causes of innovation. Since my prime purpose is to explicate the utility of a methodological technique, I will not elaborate on the formulation of the model; however, lengthy discussions of the data and theory can be found elsewhere.4
In the model the Y’s are endogenous, representing the variables to be explained. The exogenous X’s stand for variables that are not explained by the model and, more specifically, are assumed uncorrelated with the error terms in the model. The two-headed arrow connecting the exogenous variables signifies an unanalyzed relationship. It is assumed that the endogenous variables will not be completely determined by the variables in the system, and for this reason there will be error in estimating them. These error terms are indicated by the e’s.
The relationships in the model may be expressed mathematically in a system of simultaneous linear equations. Since only the Y variables are to be explained, the following set of equations emerges:
4For a substantive discussion of the data and the model, see “Organizational Innovation in a Third World Nation,” forthcoming; or, see “Organization Innovation in a Third World Nation.” the doctoral dissertation of the author.

IMPORTANCE OF AN INDEPENDENT VARIABLE 97
Y3 = P3 1x1 + P32X2 + P3e3e3.
Y4 =P41X1 +P42X2 +p43Y3 +he4e4.
Y5 =P51X* +P52X2 +P53Y3 +P54Y4 +P5ese5.
(1)
(2)
(3)
The p’s are path coefficients, and represent the dependence of Y on the particular variable with which p is associated. Due to the assumption that each variable is measured about its mean, there is no constant term in the equations (Blalock, 1969, 49).
Note that certain of the variables in the system are absent from each equation. This omission is commonly made by sociologists and political scientists. Economists, on the other hand, generally prefer to include every variable in each equation. These equations are usually presented in matrix form; however, they are offered below in scalar form for illustrative purposes (Christ, 1966, 298-343; Johnston, 1972, 341-372; Wonnacott and Wonnacott, 1970, 343-356):
p31X1 +pJ2X2 t IY3 t OY4 t OY, =e3. (4)
r-341X1 +p42X2 +p43Y3 + lY4 + Or5 =e4. (5)
P51X1 +p52X2 +p53Y3 +p54Y4 + lY5 =e5. (6)
This econometric mode of presentation makes quite clear the simultaneous nature of the system of equations, for it shows that each variable is a candidate for inclusion in each equation. Whether or not a variable is included in a particular equation depends upon the hypothesis of the investigator. In Eq. (4), for example, the coefficients indicate the hypothesis that Xi and X, are directly related to Y,, and that Y, and Y5 are not. Postulating that certain variables have zero coefficients, i.e., are not related to the particular Y, is justified on the ground of prior knowledge or reasonable assumption. These hypotheses about the coefficients of the variables in each equation, the supposed linearity of the relationships, plus the previously mentioned assump- tion that the exogenous variables are uncorrelated with the error terms, serve to specify the model. Unless the model is misspecified it reflects a structure in the real world. Given that identification conditions are met, the task becomes one of estimating these structural parameters through techniques which generate numerical values for the coefficients in the model (Johnston, 1972, 349-352).
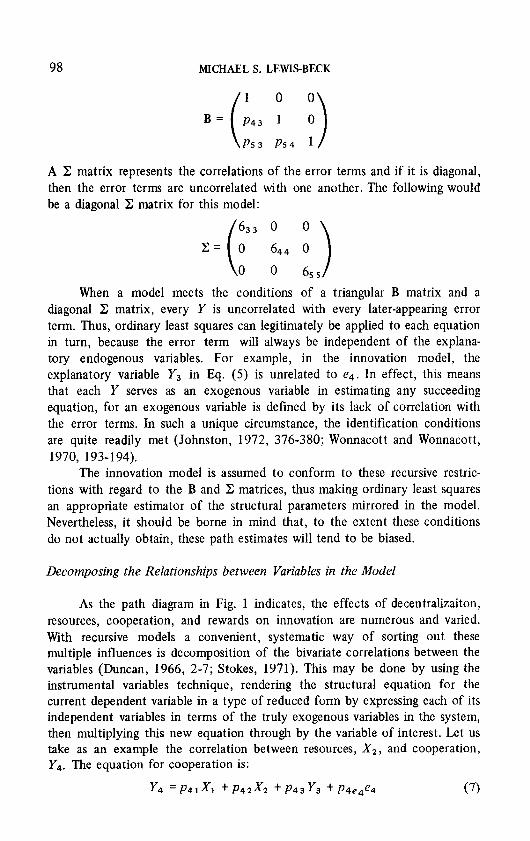
Because the innovation model is held to be recursive, rather than general, it is subject to the special requirements of a triangular B matrix and a diagonal L: matrix in order to be identifiable (Christ, 1966, 454-455; Johnston, 1972, 377; Wonnacott and Wonnacott, 1970, 193). The B matrix consists of the endogenous variable coefficients, and is triangular for the eouations of this model:
98 MICHAELS.LEWIS-BECK
A Z matrix represents the correlations of the error terms and if it is diagonal, then the error terms are uncorrelated with one another. The following would be a diagonal 2 matrix for this model:
When a model meets the conditions of a triangular B matrix and a diagonal Z matrix, every Y is uncorrelated with every later-appearing error term. Thus, ordinary least squares can legitimately be applied to each equation in turn, because the error term will always be independent of the explana- tory endogenous variables. For example, in the innovation model, the explanatory variable Y3 in Eq. (5) is unrelated to e4. In effect, this means that each Y serves as an exogenous variable in estimating any succeeding equation, for an exogenous variable is defined by its lack of correlation with the error terms. In such a unique circumstance, the identification conditions are quite readily met (Johnston, 1972, 376-380; Wonnacott and Wonnacott, 1970, 193-194).
The innovation model is assumed to conform to these recursive restric- tions with regard to the B and Z matrices, thus making ordinary least squares an appropriate estimator of the structural parameters mirrored in the model. Nevertheless, it should be borne in mind that, to the extent these conditions do not actually obtain, these path estimates will tend to be biased.
Decomposing the Relationships between Variables in the Model
As the path diagram in Fig. 1 indicates, the effects of decentralizaiton, resources, cooperation, and rewards on innovation are numerous and varied. With recursive models a convenient, systematic way of sorting out these multiple influences is decomposition of the bivariate correlations between the variables (Duncan, 1966, 2-7; Stokes, 1971). This may be done by using the instrumental variables technique, rendering the structural equation for the current dependent variable in a type of reduced form by expressing each of its independent variables in terms of the truly exogenous variables in the system, then multiplying this new equation through by the variable of interest. Let us take as an example the correlation between resources, X2, and cooperation, Y4. The equation for cooperation is:
Y4 = ~41x1 + ~42x2 +p43Y3 +P4e4e4 (7)

IMPORTANCE OF AN INDEPENDENT VARIABLE 99
The right-hand side of the equation contains an endogenous variable, Ys, so it is not reduced. Therefore, Ya must be substituted for in order to put it in a reduced-type form:
Y4 =p41Xl +P42X2 fP43hlXl +p3d2 +P3e3e3) +P4e4e4. (8)
Now, multiplying the equation through by X2:
x2y4 = P4IXIXZ +p42x22 +P43P31xlx2 +p43p3d2* +
P43P3e3e3X2 + P4e4e4X2. (9)
Taking expectations, and considering the variables to be in standard form:
~(x*y4)=P41~(x*x2)+P42~(~*)+P43P31~(xIx2)+
P43P32E(X22) + P43P3e3E(e3X2) +P4e4E(e4&), (10)
where
E(X,Y4)=r,,,E(X,X,)=r,,,E(~,)=1,E(e3X,)=E(e4X,)=0.
The equation becomes:
r24 =P42 + P43P32 + P41r12 + P43P31y12
- Direct Indirect
\ * / Unanalyzed effects due to
Effect Effect Association of exogenous variables
(DE) (IE) (v)
= .65 + (-.25) t (- .04) = .36 DE+IE +U
(11)
Decomposing the correlation between resources, X2, and cooperation, Y4, reveals that the relationship is built up of the direct path from resources, p42, the indirect path from resources via rewards, p43p32, and the un- analyzed effects on cooperation due to the association of resources and decentralization, p4 1 YI 2 + p43p3 1 rl 2. An examination of these influences shows that the relationship between resources and cooperation is a result almost entirely of the direct and indirect effects of resources on cooperation, p42 t pa3p3 2 = .40, for the unanalyzed effects are negligible.
Here is seen very clearly the importance of selecting exogenous variables that have a minimal, hopefully nonexistent, association with one another. For example, the greater the correlation between decentralization, Xr, and re- sources, X2, the exogenous variables in the model, the more entangled the relationship between resources, X2, and cooperation, Y4. The difficulty is that the form of the relationship between the exogenous variables is simply not

100 MICHAEL S. LEWtS-BECK .
Fig. 2. Spuriousness Caused by an Fig. 3. Possible Hidden Indirect Ef- Exogenous Variable. feet from an Exogenous Variable.
known. Perhaps Xr is actually directly influencing X2 as well as Y,, rendering the apparent relationship between resources and cooperation at least partially spurious. This condition of spuriousness is diagrammed in Fig. 2. Or, it could be that X, is really a cause of X1, as illustrated in Fig. 3. If this second case is true, then resources have an indirect effect on cooperation that is being neglected. Overlooking this additional indirect effect in the model would underrate the importance of resources in determining cooperation.
Unfortunately, given the model, there is no way of telling which of these diagrams mirrors the structure of relations in the real world. The only information available is the unanalyzed correlation coefficient between the two variables. If this correlation of exogenous variables were great, then the effects of resources on cooperation would be left largely entangled, and the model could say little about the nature of the relationship between them.
Therefore, assuming that more than one truly exogenous variable is used in constructing a model, the goal should be to select those with minimal intercorrelation, otherwise it becomes difficult to evaluate the impact of an exogenous variable on the endogenous variables in the system. In the model at hand, no significant correlation among the exogenous variables actually exists, which means that there are minimally entangled effects, and relationships between any independent and dependent variable can be almost completely specified in terms of direct and/or indirect effects.
Decomposition of the Relationships bemeen the Independent Variables and Innovation
Having dealt with the problem of correlated exogenous variables, the multiple effects on innovation can now be more satisfactorily considered. Because the correlation of the exogenous variables is so small, rr a = - .09, the decomposition technique allows the relationship between innovation and any other variable to be understood almost completely in terms of direct and indirect effects in the model.
IMPORTANCE OF AN INDEPENDENT VARIABLE 101
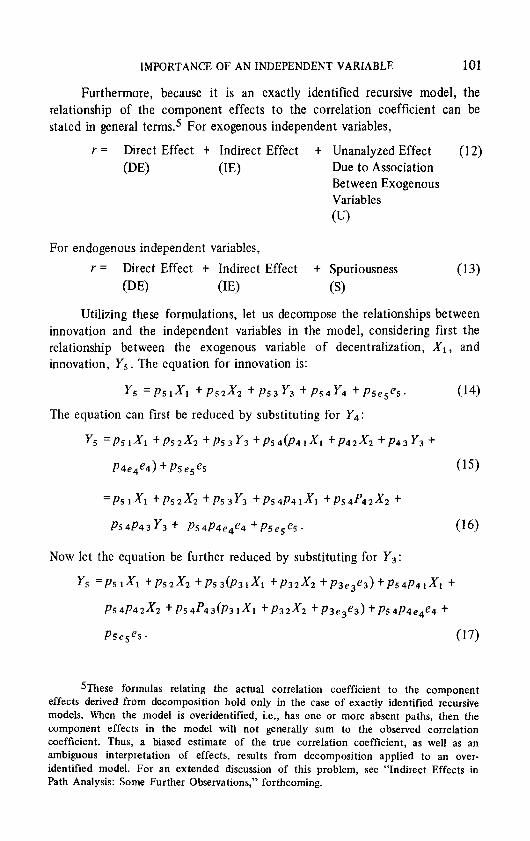
Furthermore, because it is an exactly identified recursive model, the relationship of the component effects to the correlation coefficient can be stated in general terms.5 For exogenous independent variables,
I = Direct Effect + Indirect Effect t Unanalyzed Effect (12) (DE) GE) Due to Association
Between Exogenous Variables
W)
For endogenous independent variables,
T = Direct Effect + Indirect Effect t Spuriousness (13) (DE) (IV (S)
Utilizing these formulations, let us decompose the relationships between innovation and the independent variables in the model, considering first the relationship between the exogenous variable of decentralization, X1, and innovation, Ys. The equation for innovation is:
y5 =Pslxl +Pszxz +p53y3 +P54Y4 +P5e5e5. (14)
The equation can first be reduced by substituting for Y,:
y5 ‘P51X* +p52x2 +P53Y3 +p54034*x, tp42x2 +p43y3 +
=PS,xl +p52x2 +P53y3 +p54p41xl +p54p42x2 +
P54P43 Y3 + P54P4e4e4 +P5e5e5.
Now let the equation be further reduced by substituting for Y,:
(16)
Y5 =P51X* +p52x2 +P53(P31xl +p32x2 +P3e3e3)+P54P4J1 +
P54P42x2 tPS4p43(P31x1 +P32x2 tP3e3e3)+P54P4e4e4 t
he+. (17)
SThese formulas relating the actual correlation coefficient to the component effects derived from decomposition hold only in the case of exactly identified recursive models. When the model is overidentified, i.e., has one or more absent paths, then the component effects in the model will not generally sum to the observed correlation coefticient. Thus, a biased estimate of the true correlation coefficient, as well as an ambiguous interpretation of effects, results from decomposition applied to an over- identified model. For an extended discussion of this problem, see “Indirect Effects in Path Analysis: Some Further Observations,” forthcoming.

102 MICHAEL S. LEWIS-BECK
Multiplying the equation through by X1:
XlY5 =PSI~~ +~52X2Xl+~53~31~1 +p53p32X2Xl +p53p3e3e3Xl +
PWPJ? + PS4P42XZXl + P54P43P3J21 + P54P43P32XZXl +
~54p43p3~~e3Xl +p~4p4~~e4Xl +Ps~~~JI. (18)
Take expectations, where
E(XlY,)=~l,,E(X21)=1,~(X2Xl)= rl 2, E(e,X, ) = E(e4Xl ) = E(e, X1 ) = 0.
The equation then becomes:
I 15 = P51 fP53P31 +P54P43P31 +Ps4P41 + - \ 1 /
Direct Effect (DE) Indirect Effect (IE)
~52r12 +p53p32r12+p54p42r12 +p54p431332rl2. (19)
Unanalyzed effects due of exogenous variables(U)
= .53 t .Ol - .06 = .48 (20)
(DE) (IQ WI
A look at these paths from decentralization reveals that it exerts a sizable direct effect on innovation, p5 1. Moreover, decentralization has contrasting indirect effects through rewards, pg 3p3 r t p5 4p43p3 r = -.06, and coopera- tion, P54P4 1 = .07, which result in a negligible net indirect effect. The net impact of the unanalyzed effects is also shown to be slight.
Decomposing the correlation between resources and innovation in the same manner as above, one sees that the indirect effects of resources greatly strengthen their weighty direct impact on innovation levels:
125 = P52 + P54P42 + P53P32 + p54p43p32 +
6 7
P51r12 + p53p3lr12 + P54P4lrl2 + p54p43p3lr12 (21)
T
r 2s = s.5 + .25 - .05 = .75 (22) (DE) (W (U>
Resources have a robust direct path to innovation, ps 2. However, the presence of ample resources has a major influence on innovation over and above simply providing the necessary money and materials. Greater resources also generate
IMPORTANCE OF AN INDEPENDENT VARIABLE 103
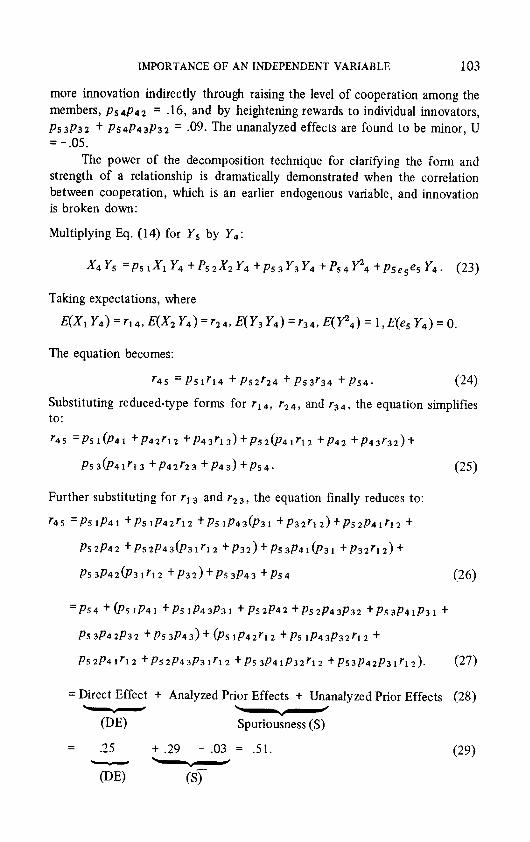
more innovation indirectly through raising the level of cooperation among the members, p54p42 = .16, and by heightening rewards to individual innovators, ps3p32 + p54p43p32 = .09. The unanalyzed effects are found to be minor, U = -.05.
The power of the decomposition technique for cIarifying the form and strength of a relationship is dramatically demonstrated when the correlation between cooperation, which is an earlier endogenous variable, and innovation is broken down:
Multiplying Eq. (14) for Y, by Y, :
Jf4Y5 =Ps,X, Y, tf’szXzY4 +Ps3YsY4 +Ps4p4 +P5e5~s Y4. (23)
The equation becomes:
p45 = PSly14 + P52r24 + P53r34 + PS4. (24)
Substituting reduced-type forms for 1-14, 124, and r34, the equation simplifies to:
p53(P41r13 +p42r23 +P43)+p54. (25)
Further substituting for t-1 3 and r2 3, the equation finally reduces to:
r45 =P51P41 +hlp42rl2 +P51P43@31 +p32r12)+p52p41r12 +
P52P42 tpS2p43(P31r12 tp32)tp53p41k31 +P32rl2)+
P53p426331r12 +p32)+P53p43 +ps4 (26)
=p54+h,p41 +PslP43P31 +Ps2P42+P52P43P32 +p53p41p31+
P53P42P32 tp53p43)t(P51p42r12 tPSlP43p32r12 +
P52p4lrl2 +p52p43p31r12 +p53p41p32r12 +p53p42p31r12). (27)
= Direct Effect t Analyzed Prior Effects t Unanalyzed Prior Effects (28) \_ / \ / Y
(DE) Spuriousness (S)
= .25 + .29 - .03 = .51. v
(29)
(DE) (S)

104 MICHAEL S. LEWIS-BECK
The investigator, simply glancing at a bivariate correlation of .51, might suppose that cooperation is highly important in determining innovation. However, according to the model this supposition is in error, for much of this positive association is due to the earlier common influences of resources, decentralization, and rewards. These earlier common influences are of two similar types: (1) the unanalyzed, but nonetheless prior, effect of exogenous variables Xi and X2, e.g., p51~42rl2, and; (2) the analyzed effect of prior variables Xi, X2, and Y5, e.g., p5 i p4 1. These prior influences mean much of the apparent relationship between cooperation and innovation observed in the bivariate correlation, r45 = .51, is actually spurious, a product of the mutual effects of prior variables in the causal system. Removing this spuriousness and looking only at the true influence of cooperation, one recognizes that it is not as great as might initially be imagined:
r45 - S = .51 - .26 = .25. (30)
This .25 represents the actual effect of cooperation on innovation, according to the model.
In decomposing the relationship between the endogenous variable of re- wards and innovation, one again observes that it can be misleading to judge a relationship on the basis of a simple correlation:
135 = P53 + P54P43 + . I \ ” /
Direct Effect (DE) Indirect Effect (IE)
P5 lP31 + P52P32 + P54P4 IP31 + P54P42P32 +
Analyzed Prior Effects (APE)
P5lP32rl2 +p52p31r12 +p54p41p32r12 +p54p42p31r12 \ / (31)
Unanalyzed Prior Effects (UPE)
= .38 - .I6 t .11 - .Ol = .32. (32) (APE) WE) \ / ”
(DE) (IE) Spuriousness (S)
When one removes the spuriousness in the relationship brought about by prior common influences, the influence of rewards on innovation is less than the bivariate correlation suggests:
r - S = .32 - .lO = .22. (33)
The true influence of rewards is made up strictly of its direct and indirect effects on innovation. The direct effect of rewards is moderately strong, p53 =

IMPORTANCE OF AN INDEPENDENT VARIABLE 105
.38. This notable immediate impact, however, is offset to a large degree by the negative effect that rewards exerts via cooperation, ps 4p4 s = - .16.
Determining the Total Effect of an Independent Variable
It is difficult to interpret the total effect of one variable on another if there are large unanalyzed effects or absent paths in the model, for in these circumstances important influences may be unknown or unaccounted for. However, because the innovation model is exactly identified and has a minimal correlation between exogenous variables, the impact of an independ- ent variable can be accurately explained almost entirely in terms of direct and indirect effects operating in a causal system. In this situation, one can talk meaningfully of the “total effect” of an independent variable. The total effect (TE) of a variable on another variable is equal to the sum of its direct effect (DE) plus its indirect effect (IE) (Duncan, 1966, 7; Land, 1969, 16):
TE = DE + IE. (34)
In the innovation model, the relationship of a total effect coefficient to a correlation coefficient is unambiguous and can be formulated in general terms. For an exogenous variable, i.e., Xi or X2, in the system:
r = TE t U, (35)
where U represents the unanalyzed effects from the association of the variable with another exogenous variable.
Here the importance of a small correlation between exogenous variables becomes obvious, for if y12 = 0, then I = TE. As it is, the total effect coefficients of both decentralization and resources with innovation are very close to the respective correlation coefficients. Thus, in these cases, TR = r.
With regard to total effects of the endogenous Y3 and Y4, the general formula relating them to the correlation coefficient is:
r = TE t S,
where S refers to spuriousness and stands for the effects, analyzed and unanalyzed, of common prior influences in the system. Thus, for both Ya and Y,, total effect is allowed the straightforward interpretation of the correlation coefficient with the spuriousness in the association removed, TE = r - S.
The Importance of the Independent Variables According to the Total Effect Coefficients and other Measures
Using the total effect coefficients to measure the relative importance of the independent variables in terms of impact on organizational innovation, the following ordering is derived:

106 MICHAELSLEWIS-BECK
T&s = DEZ5 t IEaa = 55 + .25 = .80 (resources). (37)
TE,, =DEr5 +IE,, = 53 + .Ol = .54 (decentralization). (38)
TE45 = DE45 = .25 (cooperation). (39)
TESS = DE3a + IE35 = .38 - .16 = .22 (rewards). (40)
An analysis of the total effects of these variables indicates that resources are by far the most important factor determining an organization’s innovation level. Although clearly not as important as resources, decentralization also emerges as a powerful influence. Decentralization is followed at a distance by cooperation. Somewhat surprisingly, rewards are exposed as the least inffuen- tial of all the variables, having relatively little overall impact on innovation. Contrast this assessment of the variables with one based on the beta coefficients in a multiple regression equation, which are represented by the direct effects in the model:
/315 = .55 (resources). (41)
Pas = .53 (decentralization). (42)
035 = .38 (rewards). (43)
045 = .25 (cooperation). (44)
According to the beta coefficients, resources and decentralization are of virtually identical importance for innovation. These variables are followed fairly closely by rewards, which appear rather important here because their negative indirect effects are ignored. Since these negative influences suggested in the model are not considered, rewards misleadingly appears to play a larger role in organizational change than cooperation.
The difference in evaluation of the variables is even more dramatic when the total effects are compared with those suggested by the simple bivariate correlation coefficients:
r2 5 = .75 (resources). (45)
r4 5 = .5 1 (cooperation). (46)
r15 = .48 (decentralization). (47)
r35 = .32 (rewards). (48)
In this correlation ordering, resources are obviously dominant, which agrees with the judgement based on total effects. However, this ranking leads to a misinterpretation of the place of decentralization in the innovation process. Contrary to what the total effect coefficients suggest, decentralization
IMPORTANCE OF AN INDEPENDENT VARIABLE 107
here appears less important even than cooperation, and only somewhat more influential than rewards, which have the least impact of all.
The above demonstration should make clear the advantage of path analytic techniques, properly employed, over regression and correlation methods of evaluating the relative importance of an independent variable in its relationship with a particular dependent variable. The latter methods are not satisfactory because in representing a relationship they fail to take into account the operation of indirect or spurious effects, which are explicitly portrayed in a correctly constructed recursive causal model.
REFERENCES
Blalock, H. M. (1969), Theory Construction: From Verbal to Mathematical Formulations, Prentice-Hall, New Jersey.
Christ, C. (1966), Econometric Models and Methods, Wiley, New York. Darlington, R. (1968), “Multiple regression in phychological research and practice,”
Psychological Bulletin 69, 161-182. Duncan, 0. D. (1966), “Path analysis: sociological examples,” American Journal of
Sociology 72, 1-16. Duncan, 0. D. (1970), “Partials, partitions, and paths.” In Sociological Methodology
1970 (E. Borgatta and G. Bohrnstedt, Eds.), pp. 38-47. Jossey-Bass, San Francisco. Gordon, R. A. (1968) “Issues in multiple regression,” The American Journal of
Sociology 73, 592-616. Hoffman, P. J. (1962), “Assessment of the independent contributions of predictors,”
Psychological Bulletin 59, 77-80. Johnston, J. (1972), Econometric Methods, McGraw-Hill, New York. Land, K. C. (1969), “Principles of path analysis.” Zn Sociological Methodology 1969 (E.
F. Borgatta, Ed), pp. 3-37. Jossey-Bass, San Francisco. Lewis-Beck, M. S. (1973a), “Indirect effects in path analysis: some further observations,”
not published. Lewis-Beck, M. S. (1973b), “Organizational Innovation in a Third World Nation,” not
published. Lewis-Beck, M. S. (1973c), Organizational Innovation in a Third World Nation, unpub
lished doctoral dissertation. Linn, R. L., Werts, C. E. (1968), “Assumptions in making inferences from part
correlations, partial correlations, and partial regression coefficients,” Psychological Bulletin 72, 307-310.
Stokes, D. (1971), “Compound paths in political analysis.” Zrt Mathematical Applications in Political Science V (J. F. Herndon and J. L. Bernd, Eds.), pp. 70-92, University Press of Virginia, Virginia.
Ward, J. (1969), “Partitioning of variance and contribution or importance of a variable: a visit to a graduate seminar,” American Educational Research Journal 6, 467-474.
Werts, C. (1968), “The partitioning of variance in school effects studies,” American Educational Research Journal 5, 311-317.
Werts, C. and Linn, R. L. (1969), “Analyzing school effects: how to use the same data to support different hypotheses,” American Educational Research Journal 6, 439-447.
Wonnacott, R. J. and Wonnacott, T. H. (1970), Econometrics, Wiley, New York.