determining the ecological footprint of ... that the ecological footprint of energy in the...
TRANSCRIPT

Ebadi et al.: Ecological footprints of vehicles
- 439 -
APPLIED ECOLOGY AND ENVIRONMENTAL RESEARCH 14(3):439-450.
http://www.aloki.hu ● ISSN 1589 1623 (Print) ● ISSN 1785 0037 (Online)
DOI: http://dx.doi.org/10.15666/aeer/1403_439450
2016, ALÖKI Kft., Budapest, Hungary
DETERMINING THE ECOLOGICAL FOOTPRINT OF VEHICLES
IN TEHRAN, IRAN
EBADI, A.1 ‒ MOHARRAM NEJAD, N.
1* ‒ RAHNAMAEE, M. T.
2 ‒ MOTESADI ZARANDI, S.
3
1Department of Environment, Science and Research Branch, Islamic Azad University, Tehran,
Iran
2Department of Geography, University of Tehran, Tehran, Iran
3Department of Health and Environment, Shahid Beheshti University, Tehran, Iran
*Corresponding author e-mail: [email protected], [email protected]
(Received 10th Mar 2016; accepted 23
rd Apr 2016)
Abstract. Inefficient transport system in big cities such as Tehran causes major environmental problems
like increasing fuel consumption, which results in the loss of large amounts of non-renewable natural
resources. Increased fuel consumption in Tehran is mainly due to lack of an integrated and efficient
transport system, which is one of the main causes of the decline in the country's environmental resources.
The aim of this paper is to estimate the ecological footprint of energy in the transportation system within
city of Tehran and also estimate the ecological footprint for each of the vehicles per passenger. Finally,
some suggestions for improving the sustainability of the transportation system in Tehran will be made. To
achieve this goal, the amount of fuel consumption in the transportation sector within city of Tehran was
prepared and, based on the carbon release from any type of fuels, energy footprint in 2012 was estimated.
Also, fuel consumption per passenger of vehicles was calculated and the ecological footprint per passenger for any type of vehicles was calculated using the ecological footprint model. The results
showed that the ecological footprint of energy in the transportation sector in Tehran was 4,384,777.5 gha
in 2012, while the total forest land in city of Tehran was equal to 7670.5 ha. So, this ecological deficit
showed an unsustainable transport system in Tehran. The results also demonstrated that the subway
system, with 0.002 m2 per passenger, had minimum ecological footprint and private cars with 1.612
m2per passenger had the highest ecological footprint. This means that each passenger of a private vehicle
has footprints equal to 806 times of a subway passenger.
Keywords: ecological footprint, transportation, Tehran, energy footprint, fuel consumption
Introduction
In recent decades, the rapid increase in the human population with increasing
humanitarian needs has imposed heavy pressures on the limited resources of the earth.
Increasing the human population and, consequently, increasing urbanization and city
expansion demand more features and needs than the past. In these conditions, lack of
proper planning in the development of the infrastructure of the city puts the
sustainability of town and environment at risk. One of the main problems of cities is
transportation system and, in city of Tehran, problems resulting from this sector can be
clearly noticed (Faryadi and Samadpoor, 2010). Population growth of Tehran increases
daily urban trips. Rise of daily trips has environmental consequences such as increasing
fuel consumption, loss of national natural resources, and air pollution, reducing quality
of urban environment, and ultimately, threatening health and welfare of citizens. Now,
due to the effects of transportation and heavy traffic in Tehran, it is essential to
comprehensively assess environmental quality and provide suitable transport methods to
reduce the harmful effects. For this purpose, the ecological footprint can be used as a

Ebadi et al.: Ecological footprints of vehicles
- 440 -
APPLIED ECOLOGY AND ENVIRONMENTAL RESEARCH 14(3):439-450.
http://www.aloki.hu ● ISSN 1589 1623 (Print) ● ISSN 1785 0037 (Online)
DOI: http://dx.doi.org/10.15666/aeer/1403_439450
2016, ALÖKI Kft., Budapest, Hungary
quantitative and comprehensive method for determining the quality of urban
environment. The concept of the ecological footprint, for the first time, was introduced
by William Rees and Mathis Wackernagel in 1996 at University of British Columbia,
Canada. The ecological footprint reflects the amount of consumption or demand for
natural goods and services. Ecological footprint is equivalent to the amount of land or
water surface, which provides the consumption needs of the community or absorbs the
produced waste by them. In other words, the ecological footprint reflects the effects that
societies put on the nature due to their life style (Peters and Schouten, 2010). Innovation
of ecological footprint method is that, unlike traditional methods, environmental impact
assessment is not entirely qualitative and, in this method, there is a factual basis for
decision-making, which makes the amount of consumption to the "earth" (Sarayiand
Zarei, 2009). Therefore, in the ecological footprint method, evaluation and comparison
of the consumption amount of environmental resources have been used in cities and
urban neighborhoods (Samadpoor and Faryadi, 2008).
Review of Literature
In recent years, ecological footprint has been used as a tool for assessing the urban
and environmental resources, in different countries. Including, Philip Woods in 2004,
calculated amount of ecological footprint for the north shores of Sydney (Woods, 2005).
Mark Anielski and Jeffrey Wilson in 2005 calculated ecological footprint of Canada
and its various cities including Vancouver, Calgary, Edmonton and other cities and then
compared with the ecological footprint of other countries. (Wilson and Anielski, 2005).
Footprint of transportation in the United States of America, Considering all kinds of
vehicles ranging from private cars and trucks, motorcycles and buses, rail and air
transport and passenger boats, and regarding this point that how much CO2 is released
to atmosphere for consuming per KWH of each fuel, was estimated at 1.94 global
hectares (McIntyre et al., 2007).
In Great Britain in 2003, with regard to the water, air and rail transport , metro,
buses, cars, motorbikes and scooters, and regarding infrastructures, ecological
footprint of transportation of 0.67 Global hectares was calculated (Barret and
Simmons, 2003).
Footprint of transportation in the city of Adelaide in Australia with regard to the
use of private vehicles like cars and trucks, motorcycles, buses, rail and air
transport and passenger boats was calculated as 0.66 Global hectares per capita
(Agrawal et al., 2006).
In the city of Kermanshah in western Iran, considering the amount of diesel and
gasoline consumption by public and private vehicles such as buses, minibuses and cars
and motorcycles, the ecological footprint of transportation was estimated at 0.32
hectares (Gharakhluo et al., 2013).
In this study, we used the ecological footprint model to calculate the energy
footprint in the transportation sector in city of Tehran. Also, we calculated the energy
footprint of each of the vehicles per passenger and, finally, based on the results,
recommendations were made for improving the sustainability of the transportation
system in Tehran.

Ebadi et al.: Ecological footprints of vehicles
- 441 -
APPLIED ECOLOGY AND ENVIRONMENTAL RESEARCH 14(3):439-450.
http://www.aloki.hu ● ISSN 1589 1623 (Print) ● ISSN 1785 0037 (Online)
DOI: http://dx.doi.org/10.15666/aeer/1403_439450
2016, ALÖKI Kft., Budapest, Hungary
Materials and Methods
Studied area
The studied area waa city of Tehran, the capital city of Islamic Republic of Iran
(Fig. 1) and calculations were done based on data related to 2012 (the latest available
data). Tehran's population in 2012 was equal to 8.25 million people. In 2012, area of
Tehran was equal to 751 km2 and population density was 112 persons per hectare
(Transport and traffic studies Company of Tehran, 2012).
Figure 1. Studied area, Tehran (Tehran Municipality, 2012)
In Tehran, along with demographic changes, the transportation situation has changed
as well. Changes in the city's population and transport indices, over the period 2010 to
2013, are shown in Table 1.
Table 1. Changes in the city's population and transport indices over the period 2010 to 2013.
Year 2010 2011 2012 2013
Population (million) 8.1 8.15 8.25 8.6
Number of daily travel (million) 16.6 17 17.4 17.7
Per capita car ownership 0.25 0.36 0.37 0.38
Use of public transport rate (percent) 50.6 54.7 56 56.1
Petrol consumption (million liters) 3577 3538 3641 3736
Diesel consumption (million liters) 950 1093 1337 1411
CNG consumption (million cubic meters) 485 485
(Source: Transportation and Traffic Studies Company of Tehran, 2012)
Transportation and movement in Tehran are done using various vehicles such as
buses, minibuses, taxis, subway, private cars, etc. The total number of daily trips in

Ebadi et al.: Ecological footprints of vehicles
- 442 -
APPLIED ECOLOGY AND ENVIRONMENTAL RESEARCH 14(3):439-450.
http://www.aloki.hu ● ISSN 1589 1623 (Print) ● ISSN 1785 0037 (Online)
DOI: http://dx.doi.org/10.15666/aeer/1403_439450
2016, ALÖKI Kft., Budapest, Hungary
Tehran in 2012 was equal to 17.4 million daily travel. Distribution of daily trips and the
share of each of the vehicles in passenger transportation in Tehran are shown in Table 2.
Table 2. Distribution of daily trips in Tehran in 2012
System Type of
vehicle
Total daily trips Movement
Coefficient
Daily movement
Count (million)
Percentage Count (million)
Percentage
Private Motorcycle 1.044 6 1 1.044 4.7
Private car 6.8556 39.4 1 6.8556 30.95
Public
Subway 2.2272 12.8 1.5 3.3408 15
Bus 3.0798 17.7 1.5 4.6197 20.85
Minibus 0.174 1 1.8 0.261 1.3
Semipublic Taxi 4.0194 23.1 1.6 6.0291 27.2
Total 17.4 100 22.1505 100
(Source: Transportation and Traffic Studies Company of Tehran, 2012)
Also, types of fuels used in the transport sector in Tehran and the amount of each are
provided in Table 3.
Table 3. Fuel consumption in the transport sector in Tehran in 2012
Fuel type Annual consumption
CNG (cft) 17118
Diesel (gallons) 461868
Petrol (gallons) 353208464
Electricity (GW) 370.9
(Source: Transportation and Traffic Studies Company of Tehran, 2012)
Analysis Method
Estimating ecological footprint of energy in the transport sector
To calculate the ecological footprint of energy (land area required to absorb or
sequester CO2 emitted from burning fossil fuels used in urban transport), the footprint of
each fuel is regarded separately because of the differences in the rate of CO2 emissions
per volume unit of each fuel (Ebadi et al, 2015; Shayesteh et al, 2014). In addition to the
fuel consumed by vehicles traveling along a network, energy consumed in the process
of network construction and annual road maintenance must be also reflected in the total
transportation network footprint (Chi and Stone, 2005). Wackernagel and Rees (1996)
estimated indirect carbon emissions for road construction and maintenance as equivalent
to 45% of the total annual fuel consumed for vehicle travel (Shayesteh et al, 2014). To
estimate the energy footprint, the amount of carbon emissions in the construction and
maintenance of networks should be also added to the carbon produced by all types of
vehicles (Zamba and Hadjibros, 2007). This estimate is multiplied by a carbon
equivalence factor to estimate the area of forestland required to absorb the CO2 emitted
from fuel consumption in the studied area (Wiedmann and Lenzen, 2007). The
equivalence factor for energy footprint is 1.26 (Ewing et al, 2010).

Ebadi et al.: Ecological footprints of vehicles
- 443 -
APPLIED ECOLOGY AND ENVIRONMENTAL RESEARCH 14(3):439-450.
http://www.aloki.hu ● ISSN 1589 1623 (Print) ● ISSN 1785 0037 (Online)
DOI: http://dx.doi.org/10.15666/aeer/1403_439450
2016, ALÖKI Kft., Budapest, Hungary
Footprint is calculated for each of the used fossil fuels and electricity in transport
network as follows:
I. Diesel
Diesel fuel will produce approximately 138700 BTU per gallon which finally
releases 19.95 ton of carbon per billion BTU (Pezzetta and Drossman, 2005) and each
hectare of forestland would absorb 1.8 ton of carbon. So, the ecological footprints of
diesel fuel are estimated using Equation 1:
(Eq. 1)
EF (d) = Diesel EF
YC = Yearly consumption (gallon)
II. Petrol
Petrol would produce approximately 125000 BTU per gallon which finally releases
19.35 ton of carbon per billion BTU (Pezzetta and Drossman, 2005) and each hectare of
forestland would absorb 1.8 ton of carbon. So, the ecological footprints of petrol p are
estimated using Equation 2:
(Eq. 2)
EF (g) = Petrol EF
YC = Yearly consumption (gallon)
III. CNG
Per cubic foot of CNG, there is an amount of 0.0532 kg CO2 (Climate Leaders -
EPA, USA, 2012). Each hectare of forestland would absorb 1.8 ton of carbon. So, the
ecological footprints of CNG are estimated using Equation 3:
(Eq. 3)
EF (CNG) = CNG EF
YC = Yearly consumption (cft)
IV. Electricity
To calculate CO2 emissions from electricity consumption, we must first determine
the KJ amount in a certain amount of kWh. Then, the amount of coal used to produce kJ
electricity consumption should be calculated (amount of coal needed to produce 20 kJ

Ebadi et al.: Ecological footprints of vehicles
- 444 -
APPLIED ECOLOGY AND ENVIRONMENTAL RESEARCH 14(3):439-450.
http://www.aloki.hu ● ISSN 1589 1623 (Print) ● ISSN 1785 0037 (Online)
DOI: http://dx.doi.org/10.15666/aeer/1403_439450
2016, ALÖKI Kft., Budapest, Hungary
of electricity, equal to 1 g). Finally, admitting the fact that there is 85% carbon in coal,
it is possible to estimate the released CO2 (Gharakhluo et al, 2013).
Estimating per capita ecological footprint of each vehicle
In this study, the ecological footprint methods used in Colorado College (Pezzetta
and Drossman, 2005) were modified and adapted to carry out the study. Thus, according
to the daily consumption of fuels, the number of daily trips and number of people
displaced ecological footprint of vehicles were estimate in m2. The amount of fuel
consumption per vehicle for transporting a passenger is used to calculate the ecological
footprint of each vehicles (Table 4).
Table 4. Amount of fuel consumed to transport a passenger-kilometer by a variety of vehicles
Description Private Public and semipublic
Car Motorcycle Taxi Minibus Bus
Amount of fuel consumed to
transport a passenger-kilometer(liter)
0.097 0.046 0.083 0.025 0.011
(Source: Transportation and Traffic Studies Company of Tehran, 2012)
Also, based on data obtained from Transportation and Traffic Studies Company of
Tehran, distance traveled per trip for a variety of motor vehicles is 4.7 km and, for the
subway, it is 12 km.
Therefore, footprint is calculated for each of the vehicles in transport network as
follows:
i. Given that several movements take place on each trip, the number of daily trips for
each vehicle is multiplied in movement coefficient to obtain the number of
movements (Table 2), therefore:
(Eq. 4)
A = Share of a passenger of all daily trips
B = Number of daily trips done by each vehicle
C = Number of daily movement done by each vehicle
ii. Now, with regard to the amount of distance traveled by each vehicle per trip, the
distance traveled by each passenger per day is calculated according to the following
formula:
(Eq. 5)
D = Distance traveled by each passenger per day
A = Share of a passenger of all daily trips
iii. Amount of fuel consumption per passenger per kilometer is calculated according to
the following formula:
(Eq. 6)

Ebadi et al.: Ecological footprints of vehicles
- 445 -
APPLIED ECOLOGY AND ENVIRONMENTAL RESEARCH 14(3):439-450.
http://www.aloki.hu ● ISSN 1589 1623 (Print) ● ISSN 1785 0037 (Online)
DOI: http://dx.doi.org/10.15666/aeer/1403_439450
2016, ALÖKI Kft., Budapest, Hungary
G = Fuel consumption per passenger per kilometer
D = Distance traveled by each passenger per day
H = Fuel consumption for movement of a passenger with a variety of vehicles
iv. Finally, per capita ecological footprint is calculated for each vehicle.
The methodology of this study is shown in the Diagram 1.
Diagram 1. The method of calculating the ecological footprint of energy in urban transport
system

Ebadi et al.: Ecological footprints of vehicles
- 446 -
APPLIED ECOLOGY AND ENVIRONMENTAL RESEARCH 14(3):439-450.
http://www.aloki.hu ● ISSN 1589 1623 (Print) ● ISSN 1785 0037 (Online)
DOI: http://dx.doi.org/10.15666/aeer/1403_439450
2016, ALÖKI Kft., Budapest, Hungary
Results
Total ecological footprint of energy
To calculate the energy footprint in the transport sector, the ecological footprint was
calculated for each type of fuels and then they were combined. Then energy footprint
for road construction and maintenance (45% of the carbon released from the
consumption of all fuels) was also added.
Ecological footprint of each type of fuel used in transportation sector and energy
footprint is provided in Table 5 and Figure 1.
Table 5. Ecological footprint of each type of fuels used in transportation sector in Tehran in
2012
Type
of fuel
Petrol Diesel CNG Electricity Fuel used in
construction and
maintenance of
roads
Total
1628581.122 684145.476 624011 126507.6 1321532.3 4384777.5
Figure 1. Ecological footprint of each type of fuels used in transportation sector in Tehran in 2012
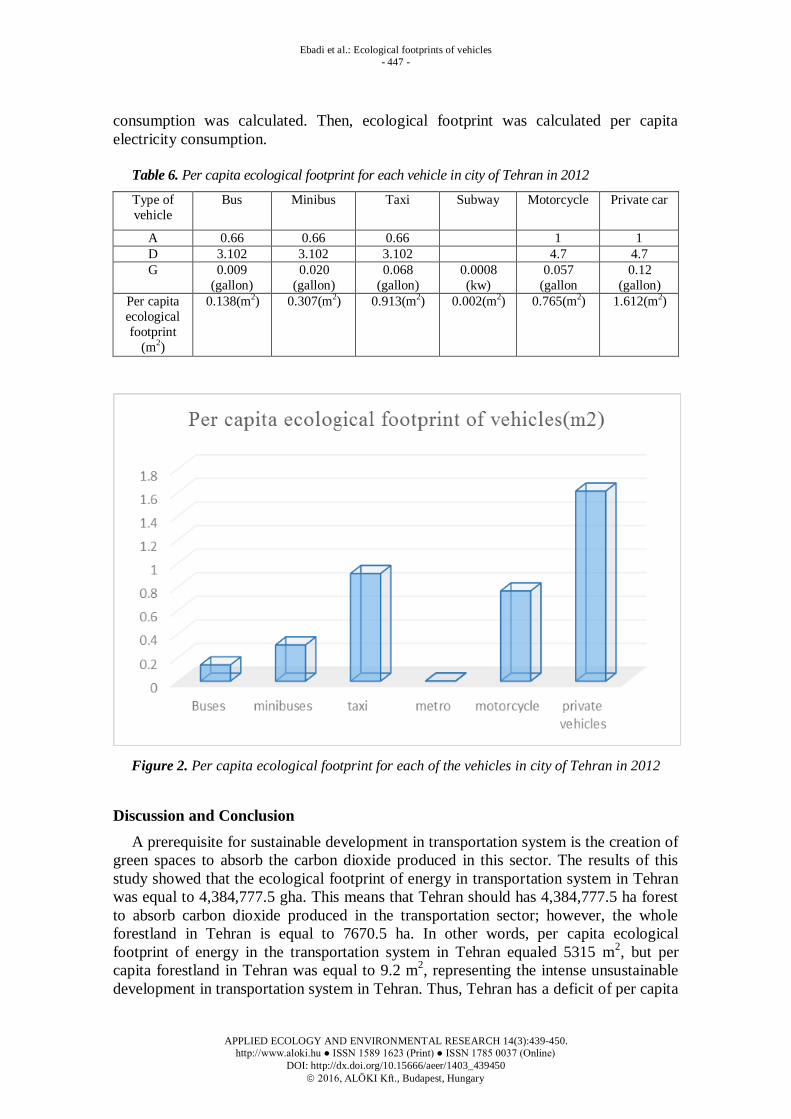
Ecological footprint of energy of each vehicle per passenger
Ecological footprint of energy per passenger to each of the vehicles is provided in
Table 6 and Figure 2. It should be noted that the type of fuel consumed by buses and
minibuses is diesel and that of taxis, motorcycles, and private cars is petrol. Also, in this
section, to calculate the per capita ecological footprint subway, annual electricity
consumption was divided by the number of annual movements and per capita annual
Ebadi et al.: Ecological footprints of vehicles
- 447 -
APPLIED ECOLOGY AND ENVIRONMENTAL RESEARCH 14(3):439-450.
http://www.aloki.hu ● ISSN 1589 1623 (Print) ● ISSN 1785 0037 (Online)
DOI: http://dx.doi.org/10.15666/aeer/1403_439450
2016, ALÖKI Kft., Budapest, Hungary
consumption was calculated. Then, ecological footprint was calculated per capita
electricity consumption.
Table 6. Per capita ecological footprint for each vehicle in city of Tehran in 2012
Type of
vehicle
Bus Minibus Taxi Subway Motorcycle Private car
A 0.66 0.66 0.66 1 1
D 3.102 3.102 3.102 4.7 4.7
G 0.009
(gallon)
0.020
(gallon)
0.068
(gallon)
0.0008
(kw)
0.057
(gallon
0.12
(gallon)
Per capita
ecological
footprint
(m2)
0.138(m2) 0.307(m2) 0.913(m2) 0.002(m2) 0.765(m2) 1.612(m2)
Figure 2. Per capita ecological footprint for each of the vehicles in city of Tehran in 2012
Discussion and Conclusion
A prerequisite for sustainable development in transportation system is the creation of
green spaces to absorb the carbon dioxide produced in this sector. The results of this
study showed that the ecological footprint of energy in transportation system in Tehran
was equal to 4,384,777.5 gha. This means that Tehran should has 4,384,777.5 ha forest
to absorb carbon dioxide produced in the transportation sector; however, the whole
forestland in Tehran is equal to 7670.5 ha. In other words, per capita ecological
footprint of energy in the transportation system in Tehran equaled 5315 m2, but per
capita forestland in Tehran was equal to 9.2 m2, representing the intense unsustainable
development in transportation system in Tehran. Thus, Tehran has a deficit of per capita

Ebadi et al.: Ecological footprints of vehicles
- 448 -
APPLIED ECOLOGY AND ENVIRONMENTAL RESEARCH 14(3):439-450.
http://www.aloki.hu ● ISSN 1589 1623 (Print) ● ISSN 1785 0037 (Online)
DOI: http://dx.doi.org/10.15666/aeer/1403_439450
2016, ALÖKI Kft., Budapest, Hungary
forestland required to absorb CO2 emissions from transportation sector with the value of
5305.8 m2 and could not absorb and isolate the released CO2 in transportation sector. On
the other hand, Tehran area equal to 751 square kilometers and forestland needed to
absorb carbon dioxide released in the transportation sector is 58 times the size of
Tehran. This estimation is comparable to other findings like the corresponding
estimation for Oslo which is about 22.5 (Aall and Norland, 2002) and estimation for
Isphahan which is about 18 (Shayesteh et al, 2014). Therefore, this pollution will
disperse in Tehran and the surrounding areas, which causes many environmental
problems.
Also, according to the results, it can be concluded that use of the subway system has
minimum damaging effects on environmental resources and use of private cars has the
most damaging effects on environmental resources. In other words, in the subway
system for the movement of a passenger, 0.0008 kW electricity will be used and, to
provide this amount of electricity, 0.002 m2 natural resources (land) is required.
However, when using a private car, for every passenger, 0.12 (gallon) of fuel (petrol) is
used and, to supply this amount of petrol, 1.612 m2 natural resources (land) is required.
As a result, use of a private car results in the faster loss of environmental resources.
With a look at the results, we can conclude that, if environmental degradation (erosion
of resources caused by fuel consumption) caused by a subway passenger is assumed
equal to 1 unit, so environmental degradation caused by any one passenger of buses,
minibuses, taxis, motorcycles, and private cars will be equal to 69, 185, 456, 382, and
806 unit, respectively.
In a same study, in the city of Urmia in Iran, also private cars had the highest
ecological footprint (Habibi et al, 2013) and the results of these two studies support
each other.
Based on the above discussion, planning to increase sustainability in transportation
sector in Tehran should be a priority for policy-makers.
Suggestions
1) Reducing the use of private cars by applying techniques such as increasing fuel
prices, parking cost, area and odd-even traffic control schemes, and expanding
culture and education at all levels
2) Increasing satisfactions with using public transportation by techniques such as
improving internal and external conditions of the public transport system, reduced
latency, reduced waiting time, increased speed and regularity of movement, and
creation of special lines by adopting new management practices
3) Using natural gas instead of gasoline and use of hybrid vehicles to optimize fuel
consumption
4) Reducing gasoline consumption by gas consuming appliances
5) Restoring and improving urban transport fleet to cope with urban pollution
6) Replacing old cars with a suitable schedule
7) Reducing demand for urban trips with the expansion of the Internet, IT technology,
and electronic systems

Ebadi et al.: Ecological footprints of vehicles
- 449 -
APPLIED ECOLOGY AND ENVIRONMENTAL RESEARCH 14(3):439-450.
http://www.aloki.hu ● ISSN 1589 1623 (Print) ● ISSN 1785 0037 (Online)
DOI: http://dx.doi.org/10.15666/aeer/1403_439450
2016, ALÖKI Kft., Budapest, Hungary
REFERENCES
[1] Aall, C., Norland, T.I. (2002): The Ecological Footprint of the City of Oslo. - Centre for
Development and the Environment & University of Oslo.
[2] Agrawal, M., Boland, J., Filar, J. (2006): The Ecological Footprint of Adelaide City. -
Center for industrial and applied mathematics institute of sustainable systems and
technologies, University of South Australia Mawson Lakes, 26 p.
[3] Barrett, J., Simmons, C. (2003): An Ecological Footprint of the UK: Providing a Tool to
Measure the Sustainability of Local Authorities. - Stockholm Environment Institute –
York, 81p.
[4] Chi, G., Stone, B. (2005): Sustainable Transport Planning: Estimating the Ecological
Footprint of Vehicle Travel in Future Years. - J. Urban Planning and Development 131: 170-180.
[5] Climate Leaders - EPA, USA. (2012): Cross-Sector Guidance: Direct Emissions from
Mobile Combustion Source. Retrieved January 10, 2012, from Center for Corporate Climate, https://www.epa.gov/climateleadership/center-corporate-climate-leadership-
greenhouse-gas-inventory-guidance#Cross-Sector
[6] Ebadi, A., Moharram Nejad, N., Rahnamaee, M., Zarandi, S. (2015): Evaluating
Sustainable Transportation of Tehran Applying Ecological Footprint Model. – Journal of Pure and Applied Microbiology 9: 495-504.
[7] Ewing, B.D., Moore, S., Goldfinger, A., Oursler, A., Reed, A., Wackernagel, M. (2010):
The Ecological Footprint Atlas 2010. - Oakland: Global Footprint Network, 113p. [8] Faryadi, S.H., Samadpoor, P. (2010): Determining the optimal fit using a variety of
transportation methods to reduce the ecological footprint in Tehran. - Journal of
Environmental Studies 54: 97-108. (In Persian). [9] Gharakhluo, M., Hataminejad, H., Baghvand, M., Yalve, M. (2013): Urban Sustainable
Development Assessment with Regard to Footprint Ecological Method (Case Study:
Kermanshah City). – Journal of Human Geography Research Quarterly 45(2):105-120.
(In Persian). [10] Habibi, K., Rahimi, A., Abdi, M.H. (2013): Evaluation the ecological foot print of urban
transportation as a novel approach to sustainable transport planning, Case Study: Urmia. -
Journal of Planning Geographic Space 5: 99-116.
[11] McIntyre, S., Peters, H.M., Christensen, M., Emmi, P., Martinson, W., Mielke, M.,
Senbel, M., Stark, D. (2007): The Ecological Footprint of Utah: A Sustainability
Indicators Project of the Utah Population and Environment Coalition. - Utah Vital Signs:
Salt Lake City, UT, USA, p. 59.
[12] Peters, P., Schouten, F. (2010): Reducing the Ecological Footprint of Inbound Tourism
and Transport to Amsterdam. – Journal of Sustainable Tourism 14: 141-156.
[13] Pezzetta, W.E., Drossman, H. (2005): The Ecological Footprint of the Colorado College:
An examination of sustainability; http://www.coloradocollege.edu/sustainability/ EcoFootprint.pdf.
[14] Samadpoor, P., Faryadi, S.H. (2008): Determination of the ecological footprint in high
density areas of cities (Case Study: Elahiyeh Region of Tehran) - Journal of Environmental Studies 45: 63-72. (In Persian).
[15] Sarayi, M.H., Zarei, F. (2009): Ecological footprint (EF) as an indicator of social
sustainability. - Journal of Environmental Studies 50: 15-26. (In Persian). [16] Shayesteh, K., Melhosseini-Darani, K., Ildoromi, A. (2014): Estimating the Ecological
Footprint of Transportation in the City of Isphahan (Iran). – Journal of Current World
Environment 9(3): 760-767.
[17] Transport and traffic studies Company of Tehran (2012). Selection of Statistics and Information urban transport of Tehran. - Press of Tehran Municipality, Tehran.

Ebadi et al.: Ecological footprints of vehicles
- 450 -
APPLIED ECOLOGY AND ENVIRONMENTAL RESEARCH 14(3):439-450.
http://www.aloki.hu ● ISSN 1589 1623 (Print) ● ISSN 1785 0037 (Online)
DOI: http://dx.doi.org/10.15666/aeer/1403_439450
2016, ALÖKI Kft., Budapest, Hungary
[18] Wackernagel, M., Rees, W. (1996): Urban Ecological Footprints: why cities cannot be
sustainable-and why they are a key to sustainability. – Journal of Environmental Impact
Assessment Review 16: 223-248. [19] Wiedmann, T., Lenzen, M. (2007): On the Conversion between Local and Global
Hectares in Ecological Footprint Analysis. – Journal of Ecological Economics 60: 673-
677.
[20] Wilson, J., Anielski, M., (2005): Ecological Footprints of Canadian Municipalities and Regions. - Federation of Canadian Municipalities.
[21] Woods, P. (2005): Ecological Footprint: North Sydney. Discussion paper. - The
University of South Wales and Coastal Council Group Partnership Program.
[22] Zamba, A., Hadjibros, K. (2007): Estimating the Ecological Footprint of Vehicles in the City of Athens. - Proceeding of the 10th International Conference on Environmental
Science and Technology Kos Island, Greece 5-7 September 2007. 8p.