determining soil shear strength parameters from...
TRANSCRIPT

Scientia Iranica A (2013) 20(5), 1349{1360
Sharif University of TechnologyScientia Iranica
Transactions A: Civil Engineeringwww.scientiairanica.com
Determining soil shear strength parameters from CPTand CPTu data
H. Motaghedi and A. Eslami�
Deptartment of Civil Engineering, Amirkabir University of Technology, Tehran, P.O. Box 15875-4413, Iran.
Received 17 April 2012; received in revised form 23 January 2013; accepted 9 March 2013
KEYWORDSE�ective shearingstrength parameters;Cohesion;Internal friction angle;Sleeve friction;CPT and CPTu;In situ tests.
Abstract. Determining the soil shear strength parameters, i.e. cohesion (C), internalfriction angle (�) is done by means of laboratory tests and the in situ testing data. Thecone penetration tests, CPT and CPTU, are not only quick and economical, but alsorepeatable and show continuous records of soil parameters with depth. The commonapproaches for shearing strength parameters determination from CPT data are on thebasis of bearing capacity and cavity expansion theories. In this study, di�erent methodsof soil shear strength parameters determination from CPT and CPTu results, qc, fs andu, were reviewed and investigated. A new method is proposed for C, � prediction on thebasis of all quantities, qc, u and fs, from CPTu considering bearing capacity mechanism offailure. One advantage of this method is improved accuracy in the case of erroneous databy using all three outputs of CPTu. The proposed, current and experimental test results ofan information bank including 32 CPT and CPTu results were assessed in �ve sites. Thecomparison of predicted and measured C and � angle values indicates good consistencyand low scatter for the proposed method. This can be led to more accurate and applicablecontinuous soil parameters in optimized geotechnical design.c 2013 Sharif University of Technology. All rights reserved.
1. Introduction
There are many drawbacks in application of laboratorytests in geotechnical practices such as limitations insample size, disparity of results and problems asso-ciated with sample preparation, transportation andmaintenance. Therefore, in situ testing has becomemore common and a�ordable in geotechnical engineer-ing. On the other hand, in situ tests have shortcomingssuch as lack of control on stress paths, drainageconditions and involvement of �eld complexities. Thus,each of these procedures has their own merits anddisadvantages, and their results can be used in geotech-nical engineering as a means of complementary consid-erations [1].
*. Corresponding author.E-mail addresses: ms h [email protected] (H.Motaghedi) and [email protected] (A. Eslami)
The CPTu test is a popular repeatable in situtest that obtains a continuous vertical pro�le of soil,and can be used in soft to medium deposits. Thistest enables the capability of providing continuouspro�le of qc (cone tip resistance), fs (sleeve friction)and u (pore pressure parameter) in every inch ofthe subsoil depths [2]. Soil pro�le and geotechnicalcharacteristics of soil layers are also well determinedby means of this information [3]. Di�erent researcherssuch as Muromachi 1972 [4], Robertson and Cam-panella 1988 [5], and Chen and Juang 1996 [6] havestudied the determination of shear strength param-eters from CPT data. However, only Su has beendetermined in �ne grained soils, or � in non-cohesivesoils.
This treatment tends to determine soil strengthparameters, using all available CPTu test output dataincluding qc, fs and u. To this end, two maintheories have been implemented for the estimation of

1350 H. Motaghedi and A. Eslami/Scientia Iranica, Transactions A: Civil Engineering 20 (2013) 1349{1360
C and �; bearing capacity [7] and cavity expansion [8]approaches.
The available bearing capacities are in base andsleeve of the penetrometer, and failure parameters arein tip qc and shaft fs. These parameters are correlatedto the values of soil shearing strength parameters.Obviously, lab tests for determining C and � anglesmust be proportionate to the shearing mechanism inpenetrometer sleeve and tip parts as well.
2. Review of methods for determining shearstrength parameters from CPT and CPTu
Researchers presented di�erent methods in order todetermine the e�ective shear strength parameters in�ne and coarse grained soils, which have been brie yreviewed in the following.
Muromachi (1972) [4] assumed the slip surface asa logarithmic spiral during the cone penetration, andproposed the following equation for non-cohesive soils:
qc = 3=2p0 cos':�e2� tan' � 1
�; (1)
where p0 is e�ective surcharge stress.Trial and error is required to determine the angle
of internal friction. This equation estimates internalfriction angle to the nearest degree.
Meyerhof (1974) [9] presented the following equa-tion for internal friction angle in cohesionless soils:
� = tan�1�
qc0:5Nq
�; (2)
where qc is measured cone resistance, and Nq is bearingcapacity factor.
Schmertmann (1978) [10] studied sandy soils be-havior and suggested a correlation between � andrelative density, that is (see Figure 1):
� = 28� + 0:15Dr; (3)
where Dr is relative density.Mitchell and Durgunoglu (1983) [11] investigated
the relation between � and qc from CPT, regardingbearing capacity failure. They proposed a relationamong �, qc and e�ective overburden stress as illus-trated in Figure 2, based on bearing capacity the-ory. The basic equation of bearing capacity can beexpressed as follows:
qult = CNc + �qNq + 0:5 BN ; (4)
where:
B = Penetrometer diameter (35.7 mm);Nc; Nq; N = Bearing capacity factors;qult = Ultimate bearing capacity;
Figure 1. Cone tip resistance changes with verticale�ective stress graphic [10].
Figure 2. Friction angle changes and cone tip resistance[11].
�q = E�ective stress in depth z.
Since Mitchell and Durgunoglu's study [11] on granularsoils, the cohesion term has been neglected, qult isthen equal to qc, which causes the soil to fail as thepenetrometer moves down. Bearing capacity factors

H. Motaghedi and A. Eslami/Scientia Iranica, Transactions A: Civil Engineering 20 (2013) 1349{1360 1351
are dependent on friction angle, therefore, � can bewritten as a function of qc.
Robertson et al. [5,12-14] focused on sandy soils indrained conditions, and presented Eq. (5) to determinethe internal friction angle as follows:
� = tan�1�0:1 + 0:38 log
�qc�0v0
��; (5)
where �0vo is e�ective vertical stress (e�ective overbur-den stress).
Also, Figure 3 presents the di�erent recommendedmethods for determination of Nq, as a function of �angle, which is applied commonly in pile design.
Senneset et al. (1988) [15] stipulated that incoarse grained soils, pore pressure is negligible duringcone penetration. They presented the following corre-lation based on the cone tip resistance:
qc =�(Nq � 1)
��0v0 +
c0tan�0
��+ �v0; (6)
where Nq is bearing capacity factor, �0 and c0 aree�ective shearing strength parameters, and �vo is totalvertical stress (total overburden stress).
While the penetrometer penetrates coarse grainedsoils, the soil structure distorts, and without soilcohesion, the above equation is corrected as the form
Figure 3. Recommended methods for Nq by � [8].
of Eq. (7):
Nq =�qc � �v0
�0v0
�+ 1: (7)
By calculating the quantity of Nq in Eq. (7), frictionangle value can be obtained by Figure 4.
Kulhawy and Mayne (2003) [16] considered thebearing capacity theory and investigated 24 types ofsands, and proposed:
� = 17:6 + 11 log
qcp
100�0v
!: (8)
The general equation indicating the logical relationbetween cone tip resistance, qc, and shearing stressin undrained conditions, using basic bearing capacityequations, can be expressed as:
qult = SuNc + �q: (9)
By substituting qult with qc and �q by �v0, and realizingNk instead of Nc, Su can be determined as follows:
Su =qc � �v0
Nk; (10)
where:Su = Undrained shear strength;Nk = A coe�cient; 10 < Nk < 15 for Nc
(Normaly Consolidated) soils.
For expanding the relation between qc and Su, itis necessary to determine Nk. Thus, values of Su and
Figure 4. Nq changes on the basis of � and angle � [15].

1352 H. Motaghedi and A. Eslami/Scientia Iranica, Transactions A: Civil Engineering 20 (2013) 1349{1360
qc obtained from in situ tests such as CPT and VST(vane shear test) can be e�ective. Whereas, the CPTresults, dependenent on VST, are the disadvantages ofthis method.
Senneset et al. (1982) [17] suggested the followingrelation for soils with low permeability, i.e. clays andsilts, which produce excess pore pressure.
qn = (Nq � 1):(�0v0 + a)�Nu�uT ; (11)
where:
qn = qt � �0vo = net resistance of cone tip;�uT = additional pore pressure in cone tip;Nu = bearing capacity factor, Nu = 6 tan�0(1 +tan�0);a = ratio between shoulder area (cone base) unaf-fected by the pore water pressure to total shoulderarea.
The foregoing statements imply that availablepredictive relations are mostly based on � or Su,and focus on bearing capacity theory. Furthermore,there is almost no study in the literature, consideringcombination of � and C, concurrently.
3. Analytical modeling for failure mechanismaround penetrometer tip
In shallow foundations, bearing capacity is a�ectedby soil nature and expansion of failure zones. Ex-pansion of failure surface depends on three importantfactors; dimensions, relative foundation depth and soilgeotechnical parameters. Meyerhof (1983) [18] postu-lated failure mechanism as spiral logarithms, using theloading test results. Hence, the assumed logarithmicspiral curve is a function of the internal friction angle(soil type) and the penetrometer area. The necessaryrelative depth for shear stress mobilization in totalfailure surface is the critical depth. In other words,the minimum penetration is equal to critical depth forpreparing the maximum resistance for penetrometerbase. For low penetration depths, in proporation tothe critical value, the linear reduction of resistance inpenetrometer-base resistance was considered. De Beer(1963) [19] indicated that displacement piles placedin bearing layers have an equal unit resistance of thepenetrometer tip. Similarity between penetrometerand pile performances caused some researchers, suchas Meyerhof (1974) [9], to assign spiral logarithm tothe mechanism of the penetrometer base; so this curveis the function of soil type, diameter and penetrationdepth of a penetrometer. This mode of failure is totalshearing. Failure surface reaches the penetrometer'ssleeve. As a result, for failure surface, logarithm curveradius is determined by Eq. (12):
r = r0e� tan(�); (12)
where:� : Angle between radii in each point of
failure surface;r : Logarithmic spiral radius;� : Angle between failure zone's radius
and normal line to logarithmic spiral(assumed to be equal to penetrometerdiameter);
r0 : Logarithmic spiral radius for � = 0 (r0is equal to penetrometer's diameter).
Eslami and Fellenius (1997) [20] stated that toobtain the height of failure zone on the penetrometer,the angle of � is equal to 180 degrees; subsequently,Eq. (12) changes to:
rc = be� tan(�): (13)
The distance for the deepest point of the failure surface,y, which is under the tip of penetrometer, is calculatedby the following equations:
y = r cos � = be� tan � cos �; (14)
dyd�
= 0) � = �: (15)
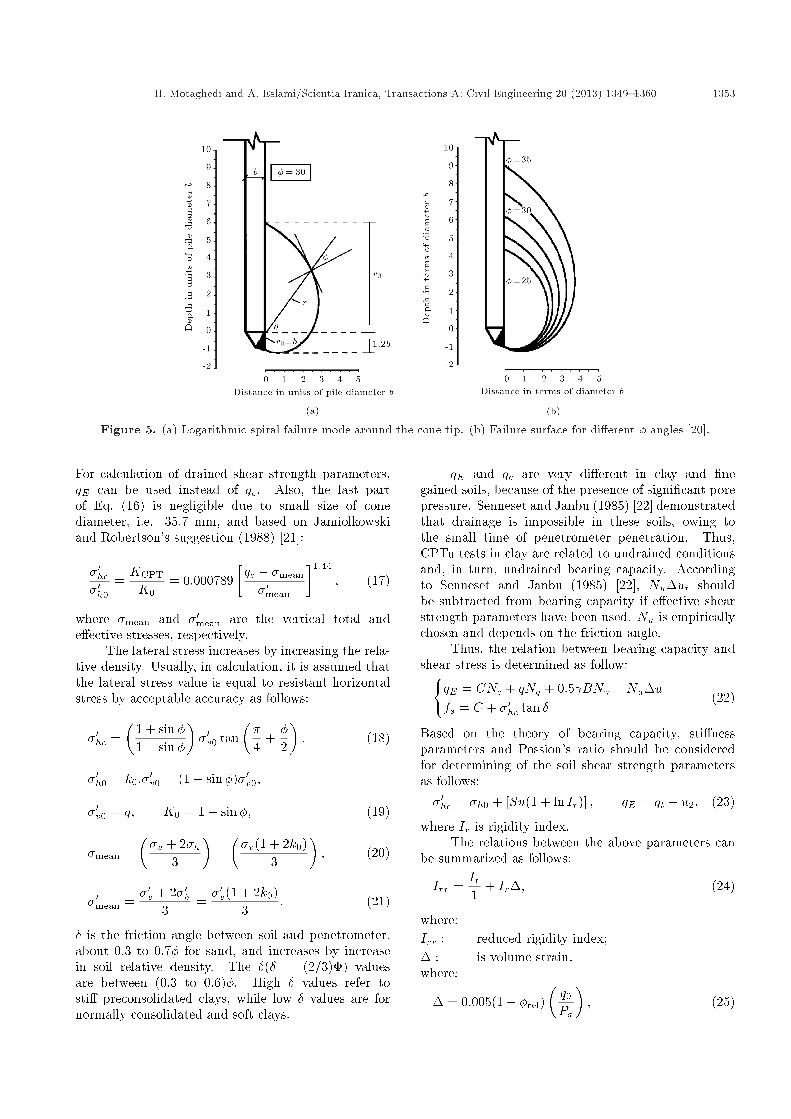
The failure surface calculated by Eq. (15) for internalfriction angles of 25 to 40 is illustrated in Figure 5(a).Overall, a penetrometer penetrates soil layers withinternal friction angle of 25 to 35 degrees much easier.In some types of soil, the height of failure zone is in 4bto 9b, and the failure depth is between 1:1b to 1:5b andthe maximum horizontal width in failure zone is 2b to5b (b is penetrometer's diameter).
For � = 30 and � = 180, rc is equal to 6b and thetotal height of the failure zone is about 7:5b.
This research is based on simultaneous combi-nation and analysis of bearing capacity theory andshearing stress equation while failure. Furthermore,in bearing capacity theory, e�ective bearing capacity(qE= \e�ective" cone resistance) is used instead oftotal bearing capacity (qt), and shearing stress isattributed to sleeve resistance (fs), so all outputs ofCPT and CPTu (qc, fs and u) are used.
4. Proposed approach
The method under consideration is predicated on thehypothesis that soil shear strength parameters, C and�, can be calculated by the information resulted fromCPT and CPTu, qt (qE = qt � u2), fs and u, as:(
qult = qE = CNc + �qNq + 0:5 BN fs = C + �0hc tan �
(16)
H. Motaghedi and A. Eslami/Scientia Iranica, Transactions A: Civil Engineering 20 (2013) 1349{1360 1353
Figure 5. (a) Logarithmic spiral failure mode around the cone tip. (b) Failure surface for di�erent � angles [20].
For calculation of drained shear strength parameters,qE can be used instead of qc. Also, the last partof Eq. (16) is negligible due to small size of conediameter, i.e. 35.7 mm, and based on Jamiolkowskiand Robertson's suggestion (1988) [21]:
�0hc�0h0
=KCPT
K0= 0:000789
�qc � �mean
�0mean
�1:44
; (17)
where �mean and �0mean are the vertical total ande�ective stresses, respectively.
The lateral stress increases by increasing the rela-tive density. Usually, in calculation, it is assumed thatthe lateral stress value is equal to resistant horizontalstress by acceptable accuracy as follows:
�0hc =�
1 + sin�1� sin�
��0v0 tan
��4
+�2
�; (18)
�0h0 = k0:�0v0 = (1� sin�)�0v0;
�0v0 = q; K0 = 1� sin�; (19)
�mean =��v + 2�h
3
�=��v(1 + 2k0)
3
�; (20)
�0mean =�0v + 2�0h
3=�0v(1 + 2k0)
3: (21)
� is the friction angle between soil and penetrometer,about 0.3 to 0:7� for sand, and increases by increasein soil relative density. The �(� = (2=3)�) valuesare between (0.3 to 0.6)�. High � values refer tosti� preconsolidated clays, while low � values are fornormally consolidated and soft clays.
qE and qc are very di�erent in clay and �negained soils, because of the presence of signi�cant porepressure. Senneset and Janbu (1985) [22] demonstratedthat drainage is impossible in these soils, owing tothe small time of penetrometer penetration. Thus,CPTu tests in clay are related to undrained conditionsand, in turn, undrained bearing capacity. Accordingto Senneset and Janbu (1985) [22], Nu�ut shouldbe subtracted from bearing capacity if e�ective shearstrength parameters have been used. Nu is empiricallychosen and depends on the friction angle.
Thus, the relation between bearing capacity andshear stress is determined as follow:(
qE = CNc + �qNq + 0:5 BN �Nu�ufs = C + �0hc tan �
(22)
Based on the theory of bearing capacity, sti�nessparameters and Possion's ratio should be consideredfor determining of the soil shear strength parametersas follows:�0hc = �h0 + [Su(1 + ln Ir)] ; qE = qt � u2; (23)
where Ir is rigidity index.The relations between the above parameters can
be summarized as follows:
Irr =Ir1
+ Ir�; (24)
where:Irr : reduced rigidity index;� : is volume strain.where:
� = 0:005(1� �rel)�q0
Pa
�; (25)
1354 H. Motaghedi and A. Eslami/Scientia Iranica, Transactions A: Civil Engineering 20 (2013) 1349{1360
and:
�rel =�� 2545� 25
; (26)
where �rel is relative friction angle.
Ir =Ed
2(1 + 2#d)�q0tan �; (27)
where:Ed : Drained elastic modulus;#d : Drained Possion's ratio, #d =
0:1 + 0:3�rel;�q0 : E�ective vertical stress;� : The angle between the radius and r0
in log spiral failure surface.
Studies on Nu reveal that this factor can beestimated from the following relation [22]:
Nu = 6 tan�0(1 + tan�0): (28)
Therefore, in two equations, based on qc, fs and u data,all soils are attributed for C and � calculations:(
fs = C + �0hc: tan� 2
3��
qE = Nc:C + �q:Nq + 0:5 BN �Nu�U(29)
Nq = tan2�
45 +�2
�e� tan�;
Nc = (Nq � 1) cot�; N = 2(Nq + 1) tan�: (30)
By replacing Nq, N and Nc, based on � angle, thefollowings can be derived:
Nq:C: cot�+ �qNq + BNq tan�+ B tan�
= Nu�U + qE ; (31)
tan2�
45 +�2
�e� tan�[C: tan�+ �q + B tan�]
+ B tan� = Nu�U + qE ; (32)�(C + B) tan2
��4
+�2
�e� tan� + B
�tan�
+ �q�tan2��4
+�2
�e� tan�=Nu�U � qE : (33)
This set of nonlinear equations cannot be solved byusing regular methods, such as Newton-Ro�son orTaylor expansion. So, it is necessary to use commonlyused software.
In this case, Maple [23], version 14, was chosen tosolve the problem.
C+0:000789(1� sin�)�0v0tan
�23��
264qc � ��v0�2�h03
���0v0�2�0h03
� 3751:44
= fs; (34a)
�tan2
��4
+�2
�e� tan� � 1
�C cot�
+ �q: tan2��
4+�2
�e� tan�
+ B�tan2
��4
+�2
�e� tan� + 1
�tan�
= qE +Nu�U: (34b)
5. Geotechnical records
A database of CPT and CPTu results were compiledand analyzed to verify accuracy of the proposed ap-proach in comparison to other existing relations for Cand � predictions. Laboratory and in situ test resultsfrom the following case histories are gathered:
Site No. 1: Evanston, IL site [24];
Site No. 2: Vancouver, BC site [25];
Site No. 3: Savannah site [26];
Site No. 4: Babolsar located in Southern Caspian Sea,North of Iran [27];
Site No. 5: Fereidoonkenar Harbour located in South-ern Caspian Sea, North of Iran [28].
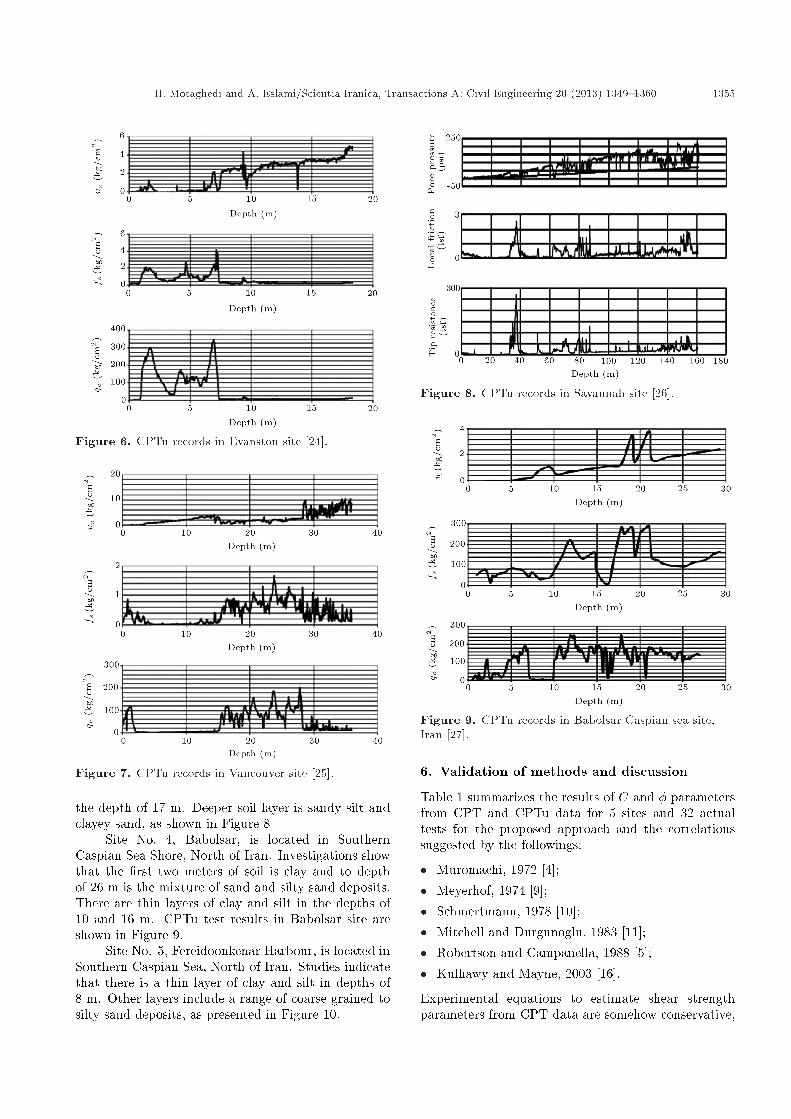
Site No. 1 is located in North Western Univer-sity, Evanston, Illinois, USA [24]. CPTu data wereobtained in a soil pro�le consisting of 7 m of sand,deposited on normally consolidated silty clay. Thepiezometer was attached to the cone face (u1) and notbehind the shoulder (u2= pore pressure measured atcone shoulder). The method of converting the porepressure measurement to the u2-value presented byFinno (1989) [24] has been accepted here. CPTu datain Evanston site is shown in Figure 6.
Site No. 2 is along the shore of Fraser River,Vancouver, British Columbia, Canada. There is a 20meters thick mixed soil pro�le of deltaic deposits ofclay, silt and sand. In Figure 7, CPTu test results areillustrated.
Site No. 3, Savannah in the U.S. soil deposits,consists of clay till to the depth of 12 m, a thin layer(2 m) of silty sand, and then the clay layer extended to
H. Motaghedi and A. Eslami/Scientia Iranica, Transactions A: Civil Engineering 20 (2013) 1349{1360 1355
Figure 6. CPTu records in Evanston site [24].
Figure 7. CPTu records in Vancouver site [25].
the depth of 17 m. Deeper soil layer is sandy silt andclayey sand, as shown in Figure 8.
Site No. 4, Babolsar, is located in SouthernCaspian Sea Shore, North of Iran. Investigations showthat the �rst two meters of soil is clay and to depthof 26 m is the mixture of sand and silty sand deposits.There are thin layers of clay and silt in the depths of10 and 16 m. CPTu test results in Babolsar site areshown in Figure 9.
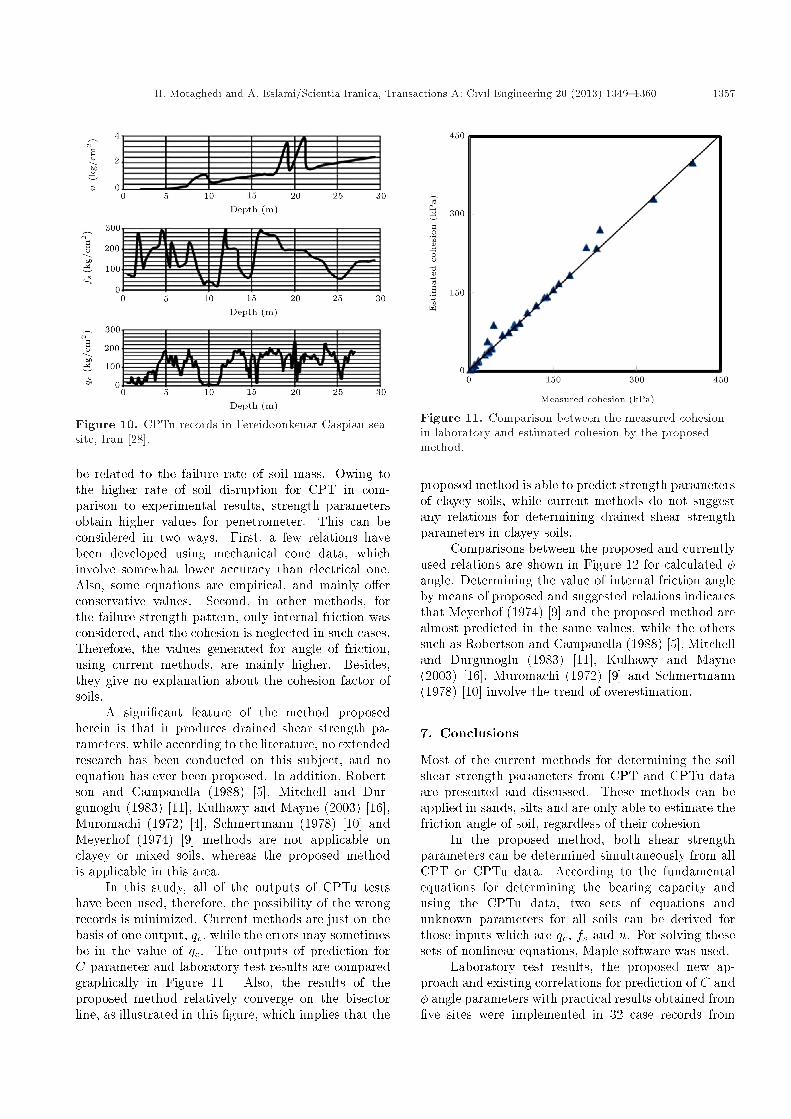
Site No. 5, Fereidoonkenar Harbour, is located inSouthern Caspian Sea, North of Iran. Studies indicatethat there is a thin layer of clay and silt in depths of8 m. Other layers include a range of coarse grained tosilty sand deposits, as presented in Figure 10.
Figure 8. CPTu records in Savannah site [26].
Figure 9. CPTu records in Babolsar Caspian sea site,Iran [27].
6. Validation of methods and discussion
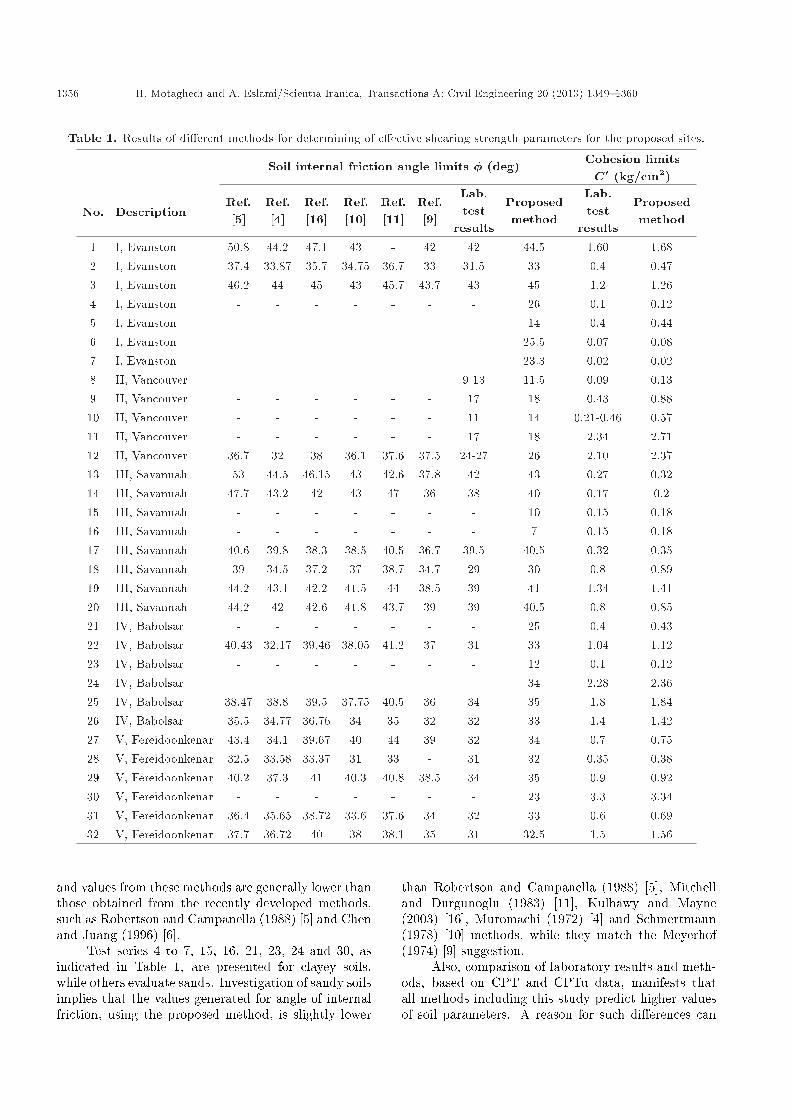
Table 1 summarizes the results of C and � parametersfrom CPT and CPTu data for 5 sites and 32 actualtests for the proposed approach and the correlationssuggested by the followings:
� Muromachi, 1972 [4];� Meyerhof, 1974 [9];� Schmertmann, 1978 [10];� Mitchell and Durgunoglu, 1983 [11];� Robertson and Campanella, 1988 [5];� Kulhawy and Mayne, 2003 [16].
Experimental equations to estimate shear strengthparameters from CPT data are somehow conservative,
1356 H. Motaghedi and A. Eslami/Scientia Iranica, Transactions A: Civil Engineering 20 (2013) 1349{1360
Table 1. Results of di�erent methods for determining of e�ective shearing strength parameters for the proposed sites.
No. Description
Soil internal friction angle limits � (deg) Cohesion limitsC0 (kg/cm2)
Ref.[5]
Ref.[4]
Ref.[16]
Ref.[10]
Ref.[11]
Ref.[9]
Lab.test
results
Proposedmethod
Lab.test
results
Proposedmethod
1 I, Evanston 50.8 44.2 47.1 43 - 42 42 44.5 1.60 1.682 I, Evanston 37.4 33.87 35.7 34.75 36.7 33 31.5 33 0.4 0.473 I, Evanston 46.2 44 45 43 45.7 43.7 43 45 1.2 1.264 I, Evanston - - - - - - - 26 0.1 0.125 I, Evanston - - - - - - - 14 0.4 0.446 I, Evanston - - - - - - - 25.5 0.07 0.087 I, Evanston - - - - - - - 23.3 0.02 0.028 II, Vancouver - - - - - - 9-13 11.5 0.09 0.139 II, Vancouver - - - - - - 17 18 0.43 0.8810 II, Vancouver - - - - - - 11 14 0.21-0.46 0.5711 II, Vancouver - - - - - - 17 18 2.34 2.7112 II, Vancouver 36.7 32 38 36.1 37.6 37.5 24-27 26 2.10 2.3713 III, Savannah 53 44.5 46.15 43 42.6 37.8 42 43 0.27 0.3214 III, Savannah 47.7 43.2 42 43 47 36 38 40 0.17 0.215 III, Savannah - - - - - - - 10 0.15 0.1816 III, Savannah - - - - - - - 7 0.15 0.1817 III, Savannah 40.6 39.8 38.3 38.5 40.5 36.7 39.5 40.5 0.32 0.3518 III, Savannah 39 34.5 37.2 37 38.7 34.7 29 30 0.8 0.8919 III, Savannah 44.2 43.1 42.2 41.5 44 38.5 39 41 1.34 1.4120 III, Savannah 44.2 42 42.6 41.8 43.7 39 39 40.5 0.8 0.8521 IV, Babolsar - - - - - - - 25 0.4 0.4322 IV, Babolsar 40.43 32.17 39.46 38.05 41.2 37 31 33 1.04 1.1223 IV, Babolsar - - - - - - - 12 0.1 0.1224 IV, Babolsar - - - - - - - 34 2.28 2.3625 IV, Babolsar 38.47 38.8 39.5 37.75 40.5 36 34 35 1.8 1.8426 IV, Babolsar 35.5 34.77 36.76 34 35 32 32 33 1.4 1.4227 V, Fereidoonkenar 43.4 34.1 39.67 40 44 39 32 34 0.7 0.7528 V, Fereidoonkenar 32.5 33.58 33.37 31 33 - 31 32 0.35 0.3829 V, Fereidoonkenar 40.2 37.3 41 40.3 40.8 38.5 34 35 0.9 0.9230 V, Fereidoonkenar - - - - - - - 23 3.3 3.3431 V, Fereidoonkenar 36.4 35.65 38.72 33.6 37.6 34 32 33 0.6 0.6932 V, Fereidoonkenar 37.7 36.72 40 38 38.1 35 31 32.5 1.5 1.56
and values from these methods are generally lower thanthose obtained from the recently developed methods,such as Robertson and Campanella (1988) [5] and Chenand Juang (1996) [6].
Test series 4 to 7, 15, 16, 21, 23, 24 and 30, asindicated in Table 1, are presented for clayey soils,while others evaluate sands. Investigation of sandy soilsimplies that the values generated for angle of internalfriction, using the proposed method, is slightly lower
than Robertson and Campanella (1988) [5], Mitchelland Durgunoglu (1983) [11], Kulhawy and Mayne(2003) [16], Muromachi (1972) [4] and Schmertmann(1978) [10] methods, while they match the Meyerhof(1974) [9] suggestion.
Also, comparison of laboratory results and meth-ods, based on CPT and CPTu data, manifests thatall methods including this study predict higher valuesof soil parameters. A reason for such di�erences can
H. Motaghedi and A. Eslami/Scientia Iranica, Transactions A: Civil Engineering 20 (2013) 1349{1360 1357
Figure 10. CPTu records in Fereidoonkenar Caspian seasite, Iran [28].
be related to the failure rate of soil mass. Owing tothe higher rate of soil disruption for CPT in com-parison to experimental results, strength parametersobtain higher values for penetrometer. This can beconsidered in two ways. First, a few relations havebeen developed using mechanical cone data, whichinvolve somewhat lower accuracy than electrical one.Also, some equations are empirical, and mainly o�erconservative values. Second, in other methods, forthe failure strength pattern, only internal friction wasconsidered, and the cohesion is neglected in such cases.Therefore, the values generated for angle of friction,using current methods, are mainly higher. Besides,they give no explanation about the cohesion factor ofsoils.
A signi�cant feature of the method proposedherein is that it produces drained shear strength pa-rameters, while according to the literature, no extendedresearch has been conducted on this subject, and noequation has ever been proposed. In addition, Robert-son and Campanella (1988) [5], Mitchell and Dur-gunoglu (1983) [11], Kulhawy and Mayne (2003) [16],Muromachi (1972) [4], Schmertmann (1978) [10] andMeyerhof (1974) [9] methods are not applicable onclayey or mixed soils, whereas the proposed methodis applicable in this area.
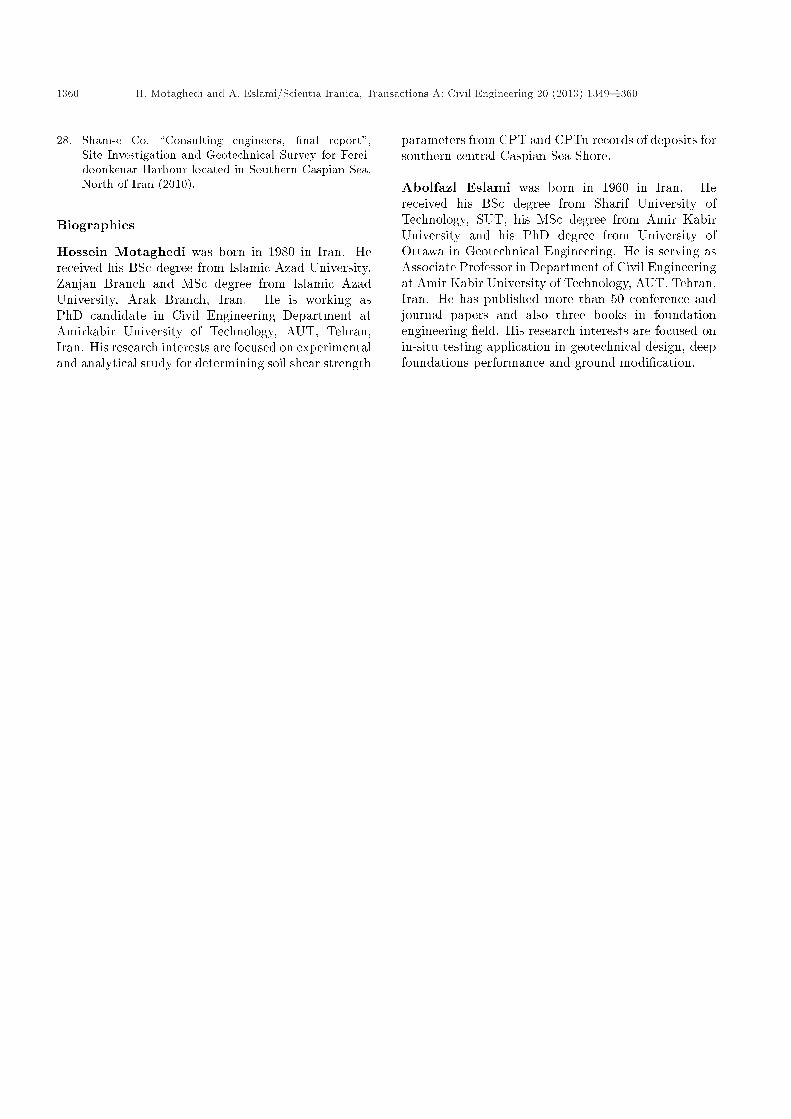
In this study, all of the outputs of CPTu testshave been used, therefore, the possibility of the wrongrecords is minimized. Current methods are just on thebasis of one output, qc, while the errors may sometimesbe in the value of qc. The outputs of prediction forC parameter and laboratory test results are comparedgraphically in Figure 11. Also, the results of theproposed method relatively converge on the bisectorline, as illustrated in this �gure, which implies that the
Figure 11. Comparison between the measured cohesionin laboratory and estimated cohesion by the proposedmethod.
proposed method is able to predict strength parametersof clayey soils, while current methods do not suggestany relations for determining drained shear strengthparameters in clayey soils.
Comparisons between the proposed and currentlyused relations are shown in Figure 12 for calculated �angle. Determining the value of internal friction angleby means of proposed and suggested relations indicatesthat Meyerhof (1974) [9] and the proposed method arealmost predicted in the same values, while the otherssuch as Robertson and Campanella (1988) [5], Mitchelland Durgunoglu (1983) [11], Kulhawy and Mayne(2003) [16], Muromachi (1972) [9] and Schmertmann(1978) [10] involve the trend of overestimation.
7. Conclusions
Most of the current methods for determining the soilshear strength parameters from CPT and CPTu dataare presented and discussed. These methods can beapplied in sands, silts and are only able to estimate thefriction angle of soil, regardless of their cohesion.
In the proposed method, both shear strengthparameters can be determined simultaneously from allCPT or CPTu data. According to the fundamentalequations for determining the bearing capacity andusing the CPTu data, two sets of equations andunknown parameters for all soils can be derived forthose inputs which are qc, fs and u. For solving thesesets of nonlinear equations, Maple software was used.
Laboratory test results, the proposed new ap-proach and existing correlations for prediction of C and� angle parameters with practical results obtained from�ve sites were implemented in 32 case records from

1358 H. Motaghedi and A. Eslami/Scientia Iranica, Transactions A: Civil Engineering 20 (2013) 1349{1360
Figure 12. Comparison between estimated and measured values for friction angle.
the same sites. The results indicate that the proposedmethod and existing relations �t well together. Thisnew method led to improved accuracy by eliminatingincorrect registration records due to the simultaneousapplication of three quantity output including qc, fsand u from CPT or CPTu data.
The predicted C and � values by the proposedapproach in comparison to the measured results fromlaboratory tests show more consistency than the cur-rently used equations suggested by researchers suchas Robertson and Campanella (1988) [5], Mitchelland Durgunoglu (1983) [11], Kulhawy and Mayne(2003) [16], Muromachi (1972) [4], Schmertmann(1978) [10] and Meyerhof (1974) [9]. In fact, in
these methods, cohesive parameters have not beenconsidered in bearing capacity equation. Hence, itcauses the failure loads be attributed to second partof equation, that is the function of internal frictionangle. Therefore, the internal friction angle, which isobtained by current methods, is almost higher thanthe measured ones. Moreover, these methods do notconsider the mixed soils in which cohesion parameter ispartly important as a component of shearing resistance.This shortcoming is covered and compensated by theproposed method. Due to good consistency and lessscatter for the soil parameters from the proposed ap-proach, it can be considered in optimized geotechnicaldesign and practice.

H. Motaghedi and A. Eslami/Scientia Iranica, Transactions A: Civil Engineering 20 (2013) 1349{1360 1359
References
1. Robertson, P.K. \CPT interpretation - a uni�ed ap-proach", Canadian Geotechnical Journal, 49(11), pp.1337-1355 (2009).
2. Eslami, A. and Fellenius, B.H. \CPT and CPTudata for soil pro�le interpretation: review of methodsand a proposed new approach", Iranian Journal ofScience & Technology, Transaction B, 28(B1), pp. 69-86, University of Ottawa, Canada, 236 p (2004).
3. Mayne P.W., Peuchen, J. and Bouwmeester, D. \Es-timation of soil unit weight from CPT", Proc., 2ndInternational Symp. on Cone Penetration Testing,CPT'10, Huntington Beach, CA (2010).
4. Muromachi, T. \Experimental study on application ofstatic cone penetrometer to subsurface investigationof weak cohsive soils", Railway Technical Research,Japanese National Railway, pp. 285-291 (1972).
5. Robertson, P.K. and Campanella, R.G. \Guidelines forgeotechnical design using CPT and CPTu", Universityof British Columbia, Vancouver, Department of CivilEngineering, Soil Mechanics Series 120 (1988).
6. Chen, J.W. and Juang, C.H. \Determination ofdrained friction angle of sands from CPT", Journal ofGeotechnical Engineering, 122(5), pp. 374-380 (1996).
7. Janbu, N. and Senneset, K. \E�ective stress interpre-tation of in situ static penetration tests", Proceedingsof the European Symposium on Penetration Testing,ESOPT, Stockholm, 2.2, pp. 81-93 (1974).
8. Vesic, A.S. \Expansion of cavities in in�nite soilmass", Journal of the Soil Mechanics and FoundationsDivision, ASCE, pp. 265-290 (1972).
9. Meyerhof, G.G. \Penetration testing outside Europe",General Report at the European Symposium on Pen-etration Testing, ESOPT, Stockholm, 2.1, pp. 40-8,Balkema Pub., Rotterdam (1974).
10. Schmertmann, J.H. \Guidelines for cone penetrationtest, performance and design", US Federal HighwayAdministration, Washington, DC, Report FHWA TS-78-209 (1978).
11. Mitchell, J.K. and Durgunoglu, H.T. \Cone resis-tance as measure of sand strength", Journal of theGeotechnical Engineering Division, ASCE, 104(GT7),pp. 995-1012 (1983).
12. Robertson, P.K., Sully, J.P., Woeller, D.J., Lunne, T.,Powell, J.J.M. and Gillespie, D.G. \Estimating coe�-cient of consolidation from piezocone tests", CanadianGeotechnical Journal, 29(4), pp. 551-7 (1992).
13. Robertson, P.K., Woeller, D.J. and Finno, W.D.L.\Seismic cone penetration test for evaluating liq-uefaction potential under cyclic loading", CanadianGeotechnical Journal, 29(4), pp. 685-95 (1992).
14. Robertson, P.K., Campanella, R.G., Gillespie, D. andGrieg, J. \Use of piezometer cone data", Proceedings ofAmerican Society of Civil Engineers, ASCE, In-Situ 86Specialty Conference, June 23-25, Geotechnical SpecialPublication GSP No.6, pp. 1263-1280 (1986).
15. Senneset, K., Sandven, R. and Janbu, N. \Interpreta-tion of piezocone tests in cohesive soils", Proceedings ofthe International Symposium on Penetration Testing,ISOPT-1, 2-2, Orlando, 2, Rotterdam, pp. 939-953,Balkema Pub. (1988).
16. Kulhawy, F.H. and Mayne, P.H. \Manual on esti-mating soil properties for foundation design", ElectricPower Research Institute, EPRI (2003).
17. Senneset, K., Janbu, N. and Savano, G. \Strength anddeformation parameters from cone penetration tests",Proceeding of the Second Eouropean Symposium onPenetration Testing, Amsterdam, May 24-27, pp. 863-870 (1982).
18. Meyerhof, G.G. \Scale e�ects of pile capacity", Jour-nal of the Geotechnical Engineering Division, ASCE,108(GT3), pp. 195-228 (1983).
19. De Beer, E.E. \The scale e�ect in the transpositionof the results of deep sounding tests on the ultimatebearing capacity of piles and caisson foundations",Geotechnique, 8(1), pp. 39-75 (1963).
20. Eslami, A. and Fellenius, B.H. \Pile capacity by directCPT and CPTu methods applied to 102 case histories",Canadian Geotechnical Journal, 34(6), pp. 880-898(1997).
21. Jamiolkowski, M. and Robertson, P.K. \Closing ad-dress: future trends for penetration testing", Geotech-nology Conference Penetration Testing in UK, Birm-ingham, pp 321-342 (1988).
22. Senneset, K. and Janbu, N. \Shear strength param-eters obtained from static cone penetration tests.Strength testing of marine sediments; Laboratory andin situ measurement", Symposium, San Diego, 1984,ASTM Special Technical Publication, STP 883, pp.41-54 (1985).
23. Maple. Maplesoft, A Division of Waterloo Maple Inc,1981-2010.
24. Finno, R.J. \Subsurface conditions and pile instal-lation data", American Society of Civil Engineers,Proceeding of Symposium on Predicted and ObservedBehavior of Piles, (1-74). Evanston, June 30, ASCEGeotechnical Special Publication, GSP23 (1989).
25. Campanella, R.G., Robertson, P.K. and Gillespie, D.\Cone penetration testing in deltaic soils", CanadianGeotechnical Journal, 20(1), pp. 23-35 (1983).
26. NCHRP \Synthesis of highway practise 368: Measur-ing in situ mechanical properties of pavement subgradesoils", Transportation Research Board, National Re-search Council, Washington, D.C., 73 (2007).
27. Jalali, J. \Geotechnical study of Babolsar located insouthern Caspian sea, north of Iran by CPT", BabolSoil Mechanic Lab (2010).
1360 H. Motaghedi and A. Eslami/Scientia Iranica, Transactions A: Civil Engineering 20 (2013) 1349{1360
28. Sham-e Co. \Consulting engineers, �nal report",Site Investigation and Geotechnical Survey for Ferei-doonkenar Harbour located in Southern Caspian Sea,North of Iran (2010).
Biographies
Hossein Motaghedi was born in 1980 in Iran. Hereceived his BSc degree from Islamic Azad University,Zanjan Branch and MSc degree from Islamic AzadUniversity, Arak Branch, Iran. He is working asPhD candidate in Civil Engineering Department atAmirkabir University of Technology, AUT, Tehran,Iran. His research interests are focused on experimentaland analytical study for determining soil shear strength
parameters from CPT and CPTu records of deposits forsouthern central Caspian Sea Shore.
Abolfazl Eslami was born in 1960 in Iran. Hereceived his BSc degree from Sharif University ofTechnology, SUT, his MSc degree from Amir KabirUniversity and his PhD degree from University ofOttawa in Geotechnical Engineering. He is serving asAssociate Professor in Department of Civil Engineeringat Amir Kabir University of Technology, AUT, Tehran,Iran. He has published more than 50 conference andjournal papers and also three books in foundationengineering �eld. His research interests are focused onin-situ testing application in geotechnical design, deepfoundations performance and ground modi�cation.