determining appropriate retentions san diego rims monthly meeting november 17, 2011 brian mercer,...
TRANSCRIPT

Determining Appropriate RetentionsSan Diego RIMS Monthly MeetingNovember 17, 2011
Brian Mercer, Principal

Copyright 2007, Integro USA Inc.
2
Agenda
Today we explore two ways to think about setting deductibles:
1. Benchmarking against similar organizations
2. Analytic approach to matching deductibles to your organization’s risk tolerance

Copyright 2007, Integro USA Inc.
3
Benchmarking
Copyright 2007, Integro USA Inc.
4
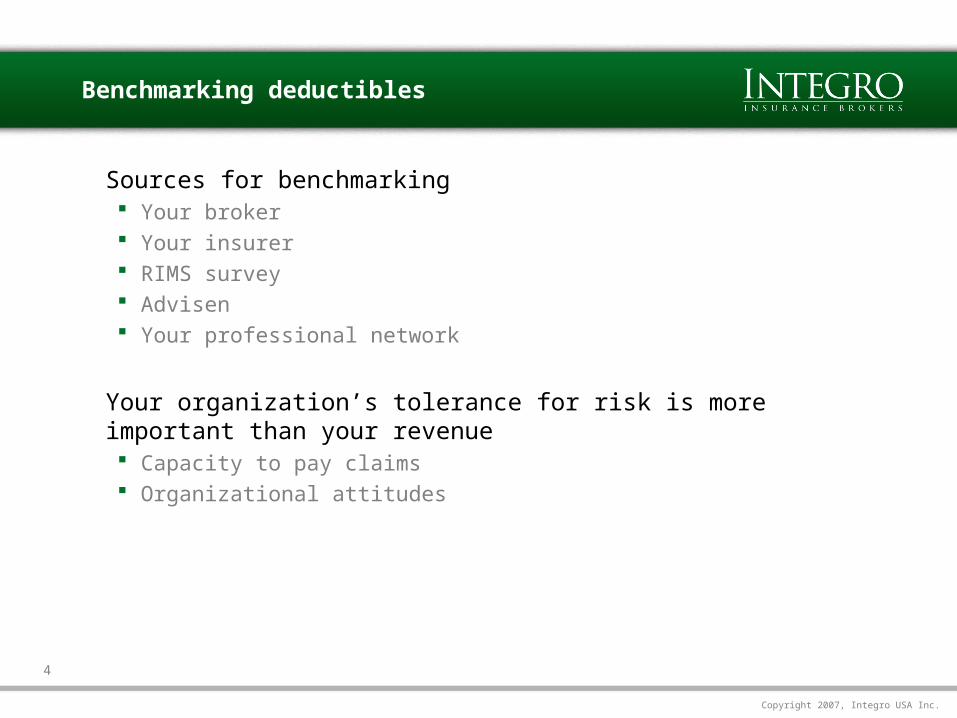
Benchmarking deductibles
Sources for benchmarking Your broker Your insurer RIMS survey Advisen Your professional network
Your organization’s tolerance for risk is more important than your revenue Capacity to pay claims Organizational attitudes

Copyright 2007, Integro USA Inc.
5
Analytic Approach

Copyright 2007, Integro USA Inc.
6
What Factors Drive the Retention Decision?
Market Price
Risk Tolerance
Expected Losses
Volatility
Collateral
Interest Rates
Tax Rates
Cost of Capital
Payment Patterns

Copyright 2007, Integro USA Inc.
7
Risk Tolerance

Copyright 2007, Integro USA Inc.
8
Determining a peer group: CareFusion

Copyright 2007, Integro USA Inc.
9
Determining a peer group: CareFusion

Copyright 2007, Integro USA Inc.
10
Determining a peer group: CareFusion
Other Category 13s
Health Care REIT
Agilent
Best Buy
DirectTV
Nordstrom
Time Warner
Humana

Copyright 2007, Integro USA Inc.
11
Benchmarking D&O Deductibles
25M 25M
0.0M
2.5M
5.0M
7.5M
10.0M
1 2 3 4 5 6 7 8 9 10 11 12 13 14 15 16 17 18 19 20
Risk Tolerance Category
Securities Retention
Non Securities Retention

Copyright 2007, Integro USA Inc.
12
Simplified Risk Tolerance Approach

Copyright 2007, Integro USA Inc.
13
Perception of Risk Tolerance by Role
Source: IBM Institute for Business Value
CFO
CEO
Source: IBM Institute for Business Value
Adventuresome VisionariesImage Makers
Operational LeadersDaily Operators

Copyright 2007, Integro USA Inc.
14
Perception of Risk Tolerance by Role
Source: IBM Institute for Business Value
CFO
CEO
Sales
Source: IBM Institute for Business Value
Adventuresome VisionariesImage Makers
Operational LeadersDaily Operators

Copyright 2007, Integro USA Inc.
15
Perception of Risk Tolerance by Role
Source: IBM Institute for Business Value
CFO
CEO
Sales
Marketing
Source: IBM Institute for Business Value
Line Executive
Adventuresome VisionariesImage Makers
Operational LeadersDaily Operators

Copyright 2007, Integro USA Inc.
16
Perception of Risk Tolerance by Role
Source: IBM Institute for Business Value
CFO
CEO
COO
Sales
Marketing
CIO
Source: IBM Institute for Business Value
Line Executive
Adventuresome VisionariesImage Makers
Operational LeadersDaily Operators

Copyright 2007, Integro USA Inc.
17
Perception of Risk Tolerance by Role
Source: IBM Institute for Business Value
CFO
CEO
COO
Sales
Internal Audit
Marketing
CIO
Source: IBM Institute for Business Value
CRO
Line Executive
Adventuresome VisionariesImage Makers
Operational LeadersDaily Operators

Copyright 2007, Integro USA Inc.
18
Perception of Risk Tolerance by Role
Source: IBM Institute for Business Value
CFO
CEO
COO
Sales
Internal Audit
Marketing
Risk Manager
CIO
Source: IBM Institute for Business Value
CRO
Line Executive
Adventuresome VisionariesImage Makers
Operational LeadersDaily Operators

Copyright 2007, Integro USA Inc.
19
Considering the Downside
Source: IBM Institute for Business Value
Risk Manager
Source: IBM Institute for Business Value
Risk managers are among the most risk-averse professionals in the organization, because the focus is on the downside of risk Brokers Consultants Insurers Career concerns

Copyright 2007, Integro USA Inc.
20
Expected Losses and Volatility

Copyright 2007, Integro USA Inc.
21
Expected Losses and Volatility

Copyright 2007, Integro USA Inc.
22
Expected Losses and Volatility

Copyright 2007, Integro USA Inc.
23
Thinking about the likelihood of rare events
Back of the envelope ways to calculate the likelihood of events:Example 1: Imagine a rare event, such as a permanent disability, which
happens only once every 5 years The odds of this happening 3 times in a year is 0.8%
Type this into Excel =(1/5)^3
Example 2: Imagine a more common event that happens about four times per
year on average, such as a car accident The odds of this happening 10 or more times in a year is 2.9%
Type this into Excel =POISSON(4,10,TRUE)

Copyright 2007, Integro USA Inc.
24
Thinking about the likelihood of rare events
Using Insurance Pricing TablesExample 3: Imagine you have a good
handle on the typical number of large WC accidents that occur per year– In a typical year you have
2 large WC claims resulting in $100k or greater in damages
You can use an insurer table to determine the likelihood of a very bad claim, resulting in $250k in payments
Type this into Excel =2/276*50
You should expect .36 claims to exceed $250K (about 1 every three years)

Copyright 2007, Integro USA Inc.
25
Principles of setting deductibles
Set deductibles in line with your organization’s risk tolerance.
Set deductibles at high levels, but not so high that a claim
would impact your future earnings beyond the cost of the claim
itself
Prevent “microphone” risk
Consider the total cost of risk transfer:
– Premium
– Retained claims
– Cost of providing collateral

Copyright 2007, Integro USA Inc.
26
Summary
Both benchmarking and analytics are helpful ways to determine appropriate deductibles. To ensure that your choice of deductible is defensible, you should systematically consider: The price of alternative deductibles The odds that you’ll have a large claim What similar sized (and shaped) companies are doing