determination of the far-infrared cosmic ... of the far-infrared cosmic background using cobe dirbe...
TRANSCRIPT
DETERMINATION OF THE FAR-INFRARED COSMIC BACKGROUNDUSING COBE DIRBE AND WHAM DATA
N. Odegard,1R. G. Arendt,
2E. Dwek,
3L. M. Haffner,
4M. G. Hauser,
5and R. J. Reynolds
4
Received 2006 August 10; accepted 2007 May 22
ABSTRACT
Determination of the cosmic infrared background (CIB) at far-infrared wavelengths using COBE DIRBE data islimited by the accuracy to which foreground interplanetary and Galactic dust emission can be modeled and sub-tracted. Most previous determinations of the far-infrared CIB were based on the detection of residual isotropic emis-sion in skymaps fromwhich the emission from interplanetary dust and the neutral interstellar mediumwere removed.In this paper we use the Wisconsin H�Mapper (WHAM) Northern Sky Survey as a tracer of the ionized medium toexamine the effect of this foreground component on determination of the CIB. We decompose DIRBE far-infrareddata for five high Galactic latitude regions into H iY and H�-correlated components and a residual component. We findthe H�-correlated component to be consistent with zero for each region, yielding CIB results that are essentially thesame as those previously derived by the COBE DIRBE team: �I�(nW m�2 sr�1) < 75,<32, =25 � 8, and =13 � 3at 60, 100, 140, and 240 �m, respectively (upper limits are 2 �). For comparison, the estimated integrated light fromgalaxies based on Spitzer 160 �m source counts is 13:7 � 1:7 and 10:7 � 1:4 nW m�2 sr�1 at 140 and 240 �m, re-spectively.We derive upper limits on the 100 �memissivity of the ionizedmedium that are typically about 40% of the100 �m emissivity of the neutral atomic medium. If H� is not a reliable tracer of far-infrared emission, we show thatour analysis would underestimate the emissivity of the ionized medium and could slightly overestimate the CIB.
Subject headinggs: cosmology: observations — diffuse radiation — Galaxy: general — infrared: ISM —ISM: general
Online material: color figure
1. INTRODUCTION
The diffuse cosmic infrared background (CIB) consists of thecumulative energy releases in the universe that have been eitherredshifted, or absorbed and reradiated by dust, into the infrared(IR) wavelength region. The CIB therefore provides importantconstraints on the rates of nuclear and gravitational energy release,as well as more exotic forms of energy release, over the historyof the universe. Over the past few years, analyses of data ob-tained with the Diffuse Infrared Background Experiment (DIRBE)and the Far Infrared Absolute Spectrophotometer (FIRAS) onboard the Cosmic Background Explorer (COBE ) satellite haveprovided the first measurements of the cosmic background inthe far-infrared to submillimeter wavelength region (Puget et al.1996; Schlegel et al. 1998; Fixsen et al. 1998; Hauser et al. 1998;Lagache et al. 1999, 2000). Detailed descriptions of the COBEinstruments and the COBE mission are given by Boggess et al.(1992), Silverberg et al. (1993), Mather et al. (1993), Hauser et al.(1997), and Brodd et al. (1997). Recent reviews covering the his-tory of the quest for the CIB, the current detections and limitson its spectrum, and the astrophysical implications are given byHauser & Dwek (2001), Kashlinsky (2005), and Lagache et al.(2005).
The far-infrared CIB measurements are limited by the accu-racy to which foreground interplanetary and Galactic emission
can be modeled and subtracted from the COBE data. Emissionfrom interplanetary dust is the dominant foreground below about100 �m, and emission from interstellar dust is the dominant oneat longer wavelengths.
Different models with different degrees of complexity havebeen used to remove the interplanetary dust ( IPD) emission fromthe COBE maps. Puget et al. (1996) and Schlegel et al. (1998)relied only on the spatial characteristics of the IPD emission andsubtracted a scaled template based on the DIRBE 25�m skymap.The detections reported by Hauser et al. (1998) and Fixsen et al.(1998) used the IPD model of Kelsall et al. (1998), which was fitto the time variation of the DIRBE data caused by the motion ofthe earth through the interplanetary dust cloud. The uncertainty inthe zero level of the emission predicted by this model makes amajor contribution to the uncertainty of the related CIB measure-ments. Wright (1998) and Gorjian et al. (2000) modeled the IPDusing a method similar to that of Kelsall et al., with an added con-straint that the residual 25 �m intensity after zodiacal light sub-traction be zero at high Galactic latitudes.
Removal of the emission from interstellar dust requires an in-terstellar medium (ISM) template that has a well-defined zerolevel and correlates well with the spatial variation of IR emissionin the COBE maps. Before the completion of the Wisconsin H�Mapper (WHAM) survey, observations of Galactic H i emissionprovided the best ISM template for this purpose (Puget et al.1996;Schlegel et al. 1998; Hauser et al. 1998). For example, the COBEDIRBE team (Hauser et al. 1998) determined correlations of IR in-tensity with Galactic H i column density for selected regions athigh Galactic latitude and high ecliptic latitude, using data inthe DIRBE 100, 140, and 240 �m bands. For each region andeach wavelength band, the H iYcorrelated component of the in-frared emission was subtracted from the data. Careful error an-alysis, including estimates of systematic error in subtraction of
A
1 ADNET Systems, Inc., Rockville, MD; and NASA Goddard Space FlightCenter, Code 665, Greenbelt, MD 20771; [email protected].
2 Science Systems andApplications, Inc., Lanham,MD; andNASAGoddardSpace Flight Center, Code 665, Greenbelt, MD 20771.
3 NASA Goddard Space Flight Center, Code 665, Greenbelt, MD 20771.4 Astronomy Department, University of Wisconsin, Madison, WI 53706.5 Space Telescope Science Institute, 3700 San Martin Drive, Baltimore MD,
21218.
11
The Astrophysical Journal, 667:11Y25, 2007 September 20
# 2007. The American Astronomical Society. All rights reserved. Printed in U.S.A.

the interplanetary andGalactic foregrounds, showed that themeanresidual intensity was significantly (more than 3 �) greater thanzero at all three wavelengths. The residual intensity passed testsfor isotropy at 140 and 240�m, so detection of theCIBwas claimedat these wavelengths.
This method of subtracting Galactic foreground emission issubject to error if the ratio of Galactic foreground emission toGalactic H i column density varies over the region studied. Suchvariation could occur if there is emission from dust associatedwith molecular or ionized gas, and this emission is not entirelycorrelated with H i column density. Based on the FUSE H2 ab-sorption line study of Gillmon et al. (2006) and Gillmon & Shull(2006), H2 column density is expected to be negligible comparedto H i column density over a large fraction of the high-latitude sky,and to account for 1%Y30% of total H column density for cirrusfeatures brighter than 1.5Y3MJy sr�1 in the temperature-corrected100 �m map of Schlegel et al. (1998). Most far-infrared CIB de-terminations have used restrictions on Galactic latitude, H i col-umn density, and/or far-infrared color to exclude lines of sight thatmay contain significant emission from dust associated with mo-lecular gas. On the other hand, the warm ionized medium (WIM)is known to be prevalent at high Galactic latitudes. Available dataindicate that H ii column density is on average about one-third ofH i column density (Reynolds 1991a), and correlation studiesusing H� as a tracer suggest that a significant fraction of the H ii isnot spatially correlatedwith H i (e.g., Reynolds et al. 1995; Arendtet al. 1998; Lagache et al. 2000). The ionized gas is expected to besubject to approximately the same interstellar radiation field as theneutral gas, and the depletion study of Howk & Savage (1999)shows that the dust-to-gasmass ratio in theWIMmay be similar tothat in the warm neutral medium. Thus, the infrared emissivity perH nucleus may be similar in the ionized and diffuse H i phases ofthe ISM, and infrared emission from the ionized phasemay have asignificant effect on any CIB determination that is solely based oncorrelation with an H i template.
The paucity of tracers of the ionized gas at high latitudes pre-cluded any definitivemeasurement of the amount of IR emissionfrom dust in this gas phase. Nevertheless, several methods wereused to estimate and subtract its contribution to the foregroundISM emission: (1) Puget et al. (1996) and Lagache et al. (1999)identified the H ii emission component with a spatially varyingcomponent obtained after subtraction of an H iYcorrelated fore-ground component from COBE FIRAS data. This residual com-ponent exhibited a csc jbj dependence (Boulanger et al. 1996),consistent with that expected from a plane-parallel layer of ion-ized gas. (2) Fixsen et al. (1998) usedmaps of H i column densityand [C ii] 158�m line emission as templates tomodel the IR emis-sion from the neutral and ionized gas phases. They found thatessentially none of the high-latitude emission observed by FIRAScorrelated with the [C ii] template, and their final CIB spectrumwas more than 2 times greater than the H ii emission subtractedCIB spectrum of Puget et al. (1996) at k < 240 �m. (3) Arendtet al. (1998) derived an upper limit to the 100 �m emissivityper H nucleus in the ionized medium from a correlation analysisof H�, H i, and DIRBE maps for a 10� ; 12� region centered atl ¼ 144�, b ¼ �21�. The derived 3 � upper limit was equal to3/4 of the 100 �memissivity per H nucleus for the neutral atomicgas in the same region. Assuming this limit is valid for theLockman Hole region, they used available H� and pulsar dis-persion measure data for the Lockman Hole to place an upperlimit of 4 nW m�2 sr�1 on the possible contribution of the ion-ized gas phase to the 100 �m foreground emission. This wasscaled to obtain upper limits of 5 and 2 nWm�2 sr�1 at 140 and240 �m, respectively, assuming the spectrum of emission from
the ionized phase has the same shape as that of the neutral atomicphase. These upper limits are comparable to the overall uncer-tainties in the CIB determinations. Theywere noted as possible er-rors by Hauser et al. (1998) but were not included in their quotedCIB uncertainties. If they had been included, their reported240 �m CIB value would still be a 3 � detection.The WHAM Northern Sky Survey provided the first H�map
sensitive enough to trace the ionized gas phase of the ISM at highGalactic latitude (Haffner et al. 2003). Lagache et al. (2000) usedpreliminaryWHAM survey data to decompose the 100Y1000�mDIRBE and FIRAS data at high latitude into H�-correlated, H iYcorrelated, and isotropic components. The regions studied coverabout 2% of the sky in the range 25� < jbj < 50�. They found asignificant H�-correlated component with a dust temperature of17.2 K, very similar to that of the H iYcorrelated component. As-suming a constant electron density of 0.08 cm�3 and an electrontemperature of 8000K for the ionized gas, they derived an infraredemissivity per H nucleus for this phase that is similar to that ofthe neutral phase. TheCIB spectrum they determined from analysisof the FIRAS data is consistent with that of Fixsen et al. (1998).The mean residual intensities they found at 100, 140, and 240 �mfrom analysis of the DIRBE data are consistent with the resultsof Hauser et al. (1998), although their uncertainties are larger.The agreement between these latest CIB determinations is en-
couraging, but the disagreement between the Arendt et al. (1998)and Lagache et al. (2000) results for the 100 �m emissivity of theionized medium is a matter of concern. In this paper, we addressthe possible effects of the ionized medium on the Hauser et al.(1998) CIB results by including an H�-correlated foregroundcomponent in an analysis that is otherwise similar to the DIRBEteam analysis. Wemake use of H� data from theWHAMNorth-ern Sky Survey. The paper is organized as follows. In x 2 wedescribe the data sets and sky areas used in the analysis. The de-composition method is described in x 3. From the decompo-sitions we derive the emissivity per H nucleus for the H i and H ii
phases of the ISM as well as the residual emission for the differ-ent DIRBE bands. In x 4 we present these results and comparethem with results of previous studies. In x 5 we discuss the emis-sivity results, and we discuss possible systematic errors if H�is not a reliable tracer of far-infrared emission. Our results andconclusions are summarized in x 6.
2. DATA SETS
The regions of the sky analyzed in this paper are shown inFigure 1. Three of them were previously analyzed by Hauseret al. (1998) and Arendt et al. (1998): the Lockman Hole (LH),a 300 deg2 region around the position of lowest H i columndensity at l ¼ 152
�, b ¼ þ52
�; an 8
� ; 9� region centered onthe north ecliptic pole (NEP) at l ¼ 96�, b ¼ þ30�; and theDIRBE high-quality B north (HQBN) region at b > þ60� and� > þ45
�. These regions were originally selected because they
were expected to have relatively weak Galactic and interplanet-ary dust foregrounds, and because good-quality H i observa-tions were available for them. The DIRBE high-quality B southregion is not included in our analysis because it is below thedeclination limit of the WHAM Northern Sky Survey. In addi-tion, we analyze the second quadrant region previously studiedby Lagache et al. (2000) and a new region in the first quadrant at30�< l< 80�, 30�< b< 41�. We refer to these as the Q2 re-gion and Q1 region, respectively. The Q2 region was originallyselected because preliminary WHAM H� data were availablefor it. The Q1 region was selected because it is comparable tothe Q2 region in Galactic latitude, it is at ecliptic latitude greaterthan 30
�, it has no molecular clouds detected in the CO survey of
ODEGARD ET AL.12 Vol. 667
Hartmann et al. (1998), and it has no cold infrared excess featuresthat are characteristic of molecular clouds in the 100 �m infraredexcess map of Reach et al. (1998).
The data sets used in our analysis are listed in Table 1. We useDIRBE 60, 100, 140, and 240 �m mission-averaged sky mapsfrom which the interplanetary foreground emission has beensubtracted using the model of Kelsall et al. (1998). ForegroundGalactic stellar emission is negligible at these wavelengths(Hauser et al. 1998; Arendt et al. 1998) and has not been sub-tracted from the data.
We use H i 21 cm line data integrated over a velocity range thatincludes all significantGalactic emission, converted toH i columndensity N(H i) assuming that the line emission is optically thin.The H i data for the LH and NEP regions are from Snowden et al.(1994) and Elvis et al. (1994), and were corrected for stray radia-tion using the AT&T Bell Laboratories H i survey (Stark et al.1992). Estimated 1 � uncertainties in N(H i) for these regionsrange from0:5 ; 1019 to 1:0 ; 1019 cm�2. TheH i data that we usefor the other regions are from the Leiden-Dwingeloo H i survey(Hartmann & Burton 1997), which has also been corrected forstray radiation (Hartmann et al. 1996).We adopt a 1 � uncertaintyof 1:25 ; 1019 cm�2 for each position in these regions. This is theuncertainty of the stray radiation correction that was estimated byHartmann et al. (1996) for a reference position in the LockmanHole region.
We use H� total intensity data from theWHAMNorthern SkySurvey (Haffner et al. 2003), which covers the sky north of de-clination �30
�. The WHAM instrument has a 1
�diameter field
of view, and the survey was made on a regular Galactic coor-dinate grid with pointings separated by 0:98�/cos b in l and0.85� in b. The spectrum for each pointing was integrated over�80 km s�1 < vLSR < 80 km s�1 to obtain total H� intensity.For the regions we study, systematic errors associated withremoval of geocoronal and atmospheric emission lines from thespectra can be greater than statistical measurement uncertain-ties. These errors can vary from night to night, and sometimescause �7
� ; 7� ‘‘blocks’’ of data taken on particular nights tobe noticeably offset in mean intensity relative to their surround-ings. We applied offset corrections to affected blocks in theHQBN, LH, and Q2 regions to remove discontinuities in H�intensity at the block boundaries. For the HQBN and Q2 re-gions, most blocks appeared to be unaffected and these wereassumed to set the zero level of the data. For the HQBN region,an offset of 0.15 R was added to the data in the areas (102�<l< 117�, 65�< b< 71�), (60�< l < 90�, 65�< b< 71�), and(l > 117
�, 60
� < b < 65�). For the Q2 region, an offset of 0.3 R
was added in (129� < l < 136:6�, 41� < b < 47
�) and an off-
set of 0.4 Rwas added in (136� < l < 157�, 47� < b < 51�). Forthe Lockman Hole, the offset corrections are somewhat uncer-tain and subjective since many blocks appear to be affected, byvarying amounts. Offset corrections ranged from �0.5 to 0.1 R,and the zero level is determined by the WHAM observationsof Hausen et al. (2002) for two positions in the region. Ourdecomposition results for the Lockman Hole are consistent withthose for the other regions, and omitting this region from ouranalysis does not change our derived CIB results significantly.
TABLE 1
Data Sets
Data Set Resolution
Velocity Integration
(km s�1) Reference
DIRBE zodiacal light subtracted mission average maps............ 0.7� . . . Hauser et al. (1997)
Leiden-Dwingeloo H i survey ..................................................... 0.6� �450 < vLSR < 400 Hartmann & Burton (1997)
Lockman Hole H i map............................................................... 210 �150 < vLSR < 100 Snowden et al. (1994)
NEP H i map ............................................................................... 210 �150 < vLSR < 150 Elvis et al. (1994)
WHAM H� sky survey............................................................... 1.0� �80 < vLSR < 80 Haffner et al. (2003)
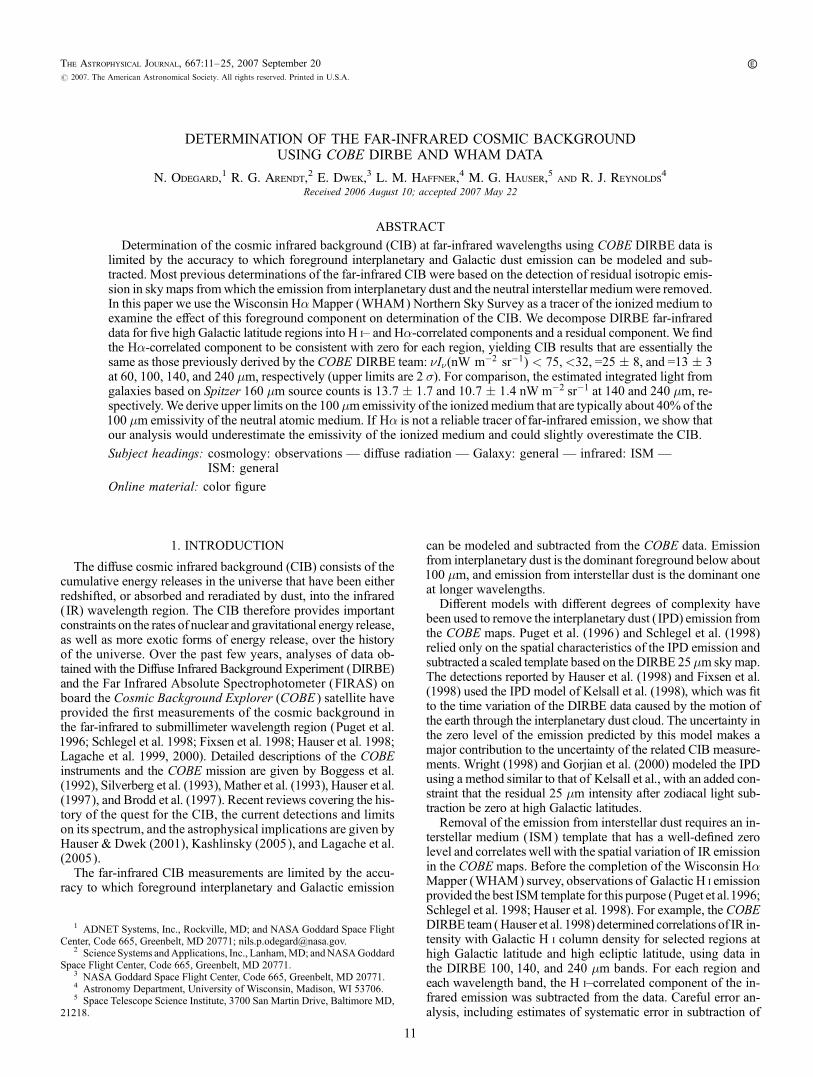
Fig. 1.—Location of the regions analyzed on aGalactic coordinateMollweide projection centered at l ¼ 0�. The LockmanHole (LH) region is the regionmapped inH i
by Snowden et al. (1994). The north ecliptic pole (NEP) region is the region mapped in H i by Elvis et al. (1994). The DIRBE high-quality B north (HQBN) region isdefined as the region at Galactic latitude b >þ60� and ecliptic latitude � > þ45�. The first quadrant (Q1) region is defined by 30�< l < 80�, 30�< b< 41�. The secondquadrant (Q2) region is a region previously studied by Lagache et al. (2000). [See the electronic edition of the Journal for a color version of this figure.]
DETERMINING CIB WITH COBE DIRBE AND WHAM 13No. 1, 2007

We adopt a 1 � uncertainty of 0.06 R for the velocity-integrated,offset-corrected H� intensity at each WHAM pointing. This isnear the low end of the range of rms H� dispersion measuredwithin observing blocks at high Galactic latitudes. The disper-sion tends to increase with increasing mean H� intensity or de-creasing latitude, presumably due to increasing rms dispersion inGalactic emission. With the adopted uncertainty, the mean H�signal-to-noise ratio is 4, 8, 18, 18, and 31 for the LH, HQBN,Q1, Q2, and NEP regions, respectively.
The DIRBE data and Leiden H i data were interpolated to theWHAM pointing positions for our analysis. The angular resolu-tion of the Elvis et al. and Snowden et al. H i data is much betterthan that of the other data sets, so these data were averaged overtheWHAMfield of view at eachWHAM pointing position. Pos-sible contamination by stellar H� absorption was handled eitherby excluding positions with stars brighter than V ¼ 6:5 or byexcluding positions with H� intensity significantly lower thantheir surroundings. These two methods were compared for theLH and NEP regions, and found to give consistent results. Somepositions with a discrete source detected in the DIRBE data (theplanetary nebulae NGC 6543 and galaxies NGC 3079, 3310,3556, 3690, and 4102) were excluded from our analysis. Theplanetary nebula NGC 6210 appears as a bright point source inthe WHAM data (Reynolds et al. 2005) and was also excluded.
Maps of the 100 �m intensity, H i column density, and H�intensity are shown for the Q1 region in Figure 2, and correlationplots are shown for this region in Figure 3. These figures showthat the correlation between �I�(100 �m) and N(H i) is tighterthan that between �I�(100 �m) and I(H�) or that between I(H�)andN(H i). Similar trends are seen for the other regions analyzedin this paper and for the region around l ¼ 144
�, b ¼ �21
�stud-
ied previously (Reynolds et al. 1995; Arendt et al. 1998).
3. ANALYSIS
3.1. Decomposition of the Infrared Emission
The method of analysis follows that used by Arendt et al.(1998) and is similar to that used by Lagache et al. (2000). Foreach DIRBE wavelength band (60, 100, 140, and 240 �m), theinfrared intensity distribution within a given region is decom-posed into a component that is correlated with H i column density,a component that is correlated with H� intensity, and an isotropiccomponent. This is done by making a least-squares fit of the form
�I� kð Þ ¼ A1N H ið Þ þ B1I H�ð Þ þ C1; ð1Þ
where I�(k) is the infrared intensity after interplanetary fore-ground subtraction and A1, B1, and C1 are fit parameters; A1 isthe mean infrared emissivity per H atom for dust in the neutralatomic gas phase, B1 is a measure of the mean infrared emissiv-ity of dust in the ionized gas phase, and the intercept C1 is themean residual infrared intensity. For comparison, a second de-composition is performed in which an H�-correlated compo-nent is not included, by making a fit of the form
�I� kð Þ ¼ A2N H ið Þ þ C2: ð2Þ
Comparison of the derived C1 andC2 values gives the error in theGalactic foreground subtraction if the H�-correlated componentis neglected.
Decomposition of an infrared intensity distribution into threecomponents as in equation (1) will be successful if the spatialdistributions of N(H i) and I(H�) differ significantly from each
other and also differ significantly from an isotropic distribution.These conditions are met for each of the regions studied here.This is illustrated for the Q1 region by Figures 2 and 3. Themethod of analysis also assumes that H� intensity is a good tracerof far-infrared emission from the ionized medium. In x 5, we dis-cuss possible errors in our results if this is not the case. Extinc-tion of the H� emission is another potential source of error, but itseffect is negligible for our regions with the data selection criteriadescribed below. We made fits to the 100 �m data for each regionwith and without a correction to I(H�) for extinction, and differ-ences in the results were insignificant.Wemade the worst-case as-sumption of pure foreground extinction. With the optical depth atH� calculated as � ¼ 0:04½N(H i) (1020 cm�2)�1�, the extinctioncorrection was at most 1.22.The fits are made using an iterative procedure that minimizes
the�2 calculated using measurement uncertainties in the indepen-dent and dependent variables (Press et al. 1992, p. 660). Uncer-tainties in the fit parameters are determined from the 68% jointconfidence region in parameter space, using the method of Bard(1974). For each of the regions except for HQBN, data at the
Fig. 2.—Images of the Q1 region in (a) DIRBE 100 �m intensity after sub-traction of the interplanetary dust emission model, (b) H i column density fromthe Leiden-Dwingeloo survey, (c) H� intensity from the WHAM Northern SkySurvey, and (d ) 100 �m intensity as in (a) but with the component that is cor-related with H i column density subtracted. The distributions of H i and H� differfrom each other and differ from an isotropic distribution, so the infrared data canbe decomposed into a sum of the three distributions. No correlation is seenbetween H� and the residual 100 �m emission in (d ), consistent with the lowvalue of the H� coefficient B1 obtained from our analysis. Possibly the 100 �memissivity of the ionized medium is low and the intensity variations in (d ) are notrelated to the ionized medium, or H� is not a good tracer of the 100 �m emis-sion from this medium. The image display ranges, from black to white, are 20Y170 nW m�2 sr�1 for (a), (0.4Y6.3) ; 1020 atoms cm�2 for (b), 0.5Y1.6 R for(c), and�25 to 50 nWm�2 sr�1 for (d ). The black contour in (b) shows theN(H i)cut of 3 ; 1020 atoms cm�2 used in the analysis, as described in x 3.1.
ODEGARD ET AL.14 Vol. 667
highest H i column densities are excluded from the fitting, as de-scribed by Arendt et al. (1998) for the LH and NEP regions. The�I�(100 �m)YN(H i) relation deviates from linearity in these re-gions, with excess 100 �m emission relative to N(H i) at thehighest H i column densities. This type of relation has been foundpreviously for isolated cirrus clouds and for large regions of thesky at highGalactic latitude, and the excess 100�memission hasbeen attributed to emission from dust associated with moleculargas or to nonnegligible optical depth in the 21 cm line (e.g., Deul& Burton 1993; Reach et al. 1994; Boulanger et al. 1996). Forthe Lockman Hole, it is consistent with detections of CO lineemission toward some 100 �m brightness peaks (Heiles et al.1988; Stacy et al. 1991; Reach et al. 1994).We exclude data aboveH i column densities where the �I�(100 �m)YN(H i) relation be-gins to deviate from linearity (see Fig. 8 ofArendt et al. 1998). Thecut is made at N (H i) ¼ 1:5 ; 1020, 5:0 ; 1020, 3:0 ; 1020, and3:0 ; 1020 cm�2 for the LH, NEP, Q1, and Q2 regions, respec-tively. Measurement uncertainties are much larger for the DIRBE140 and 240 �m bands than for the 60 and 100 �m bands, so lessstringent N(H i) limits were adopted for the LH and NEP fits inthese bands, 2:0 ; 1020 cm�2 for the LH and 6:0 ; 1020 cm�2 forthe NEP. With these cuts, the area of the sky used in the 100 �manalysis is 420, 170, 35, 180, and 380 deg2 for the HQBN, LH,NEP, Q1, and Q2 regions, respectively.
3.2. Limits on Emission from Dust in H2
Our analysis does not allow for possible far-IR emission frommolecular gas that is not correlated with H i. This emission isexpected to be negligible for the WHAM pointings that pass theN(H i) cuts. Gillmon et al. (2006) and Gillmon & Shull (2006)
reported results from a FUSE survey of H2 absorption linestoward 45 active galactic nuclei at jbj> 20
�. They compared
their derived values of the molecular fraction, f (H2) ¼ 2N (H2)/½N (H i)þ 2N (H2)�, with values of temperature-corrected 100�mintensityDT from the map of Schlegel et al. (1998). (The quantityDT is proportional to Galactic dust column density.) The transitionfrom low molecular fractions characteristic of optically thinclouds to high values characteristic of H2 self-shielded clouds wasfound to occur over the range 1:5 MJy sr�1 < DT < 3 MJy sr�1,with f (H2) varying between 10�6 and 10�1 in this DT range,f (H2) less than 10�3 at lowerDT values, and f (H2) between 10
�2
and 0.3 at higher DT values. Except for the NEP region, most ofthe WHAM pointings used in our analysis [after the N(H i) cutshave been applied] have DT less than 1.5 MJy sr�1, so f (H2) isexpected to be generally less than 10�3 and the uncertainty inderived CIB results due to neglect of this component is negligible.For each region except the NEP, we estimate that dust associatedwith H2 contributes less than 0.04, 0.05, and 0.02 nWm�2 sr�1 at100, 140, and 240 �m, respectively. This assumes that N(H2) isconstant within a region, 2N (H2) < 10�3 mean N (H i)½ �, and IRemissivity per H nucleus in the H2 phase is given by the slope ofthe IRYN(H i) relation. For the NEP, most of the WHAM point-ings that are used have DT in the transition range from 1.5 to3.0 MJy sr�1, so f (H2) values as large as 0.1 are possible. How-ever, we find no evidence for significant IR emission from H2
associated dust. The mean residual infrared intensities C1 fromour analysis of the NEP region are consistent with the valuesfound for the other regions, and the 100 �mYN(H i) relation forthe NEP is linear with small scatter over the range of N(H i) usedin our analysis (see Figs. 7 and 8 of Arendt et al. 1998). Excluding
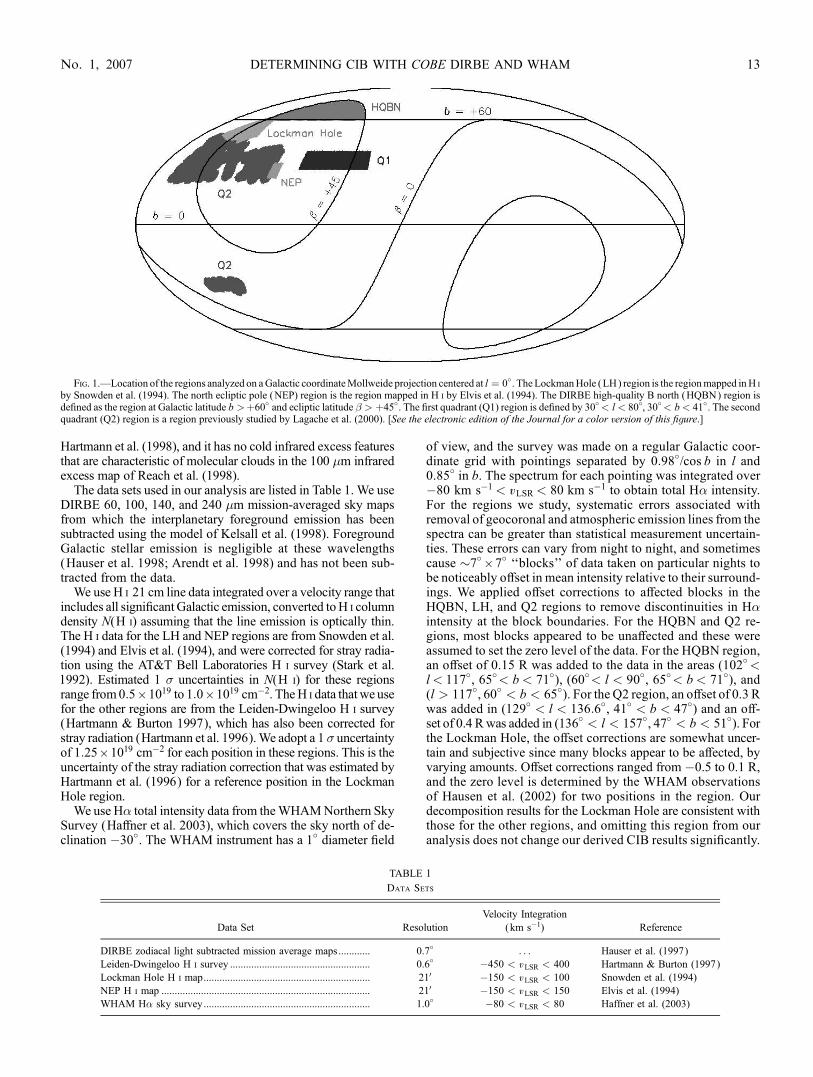
Fig. 3.—Correlation plots for Q1 region positions used in our analysis, below an N(H i) cut at 3 ; 1020 atoms cm�2. The correlation between 100 �m intensity and H i
column density in (a) is tighter than that between 100�m intensity andH� intensity in (b) or that betweenH� intensity andH i column density in (c). No correlation is seenbetween H� intensity and residual 100 �m intensity after subtraction of the H iYcorrelated component in (d ). The cross plotted in the lower right of each panel shows thetypical statistical measurement uncertainty (�1 �) for each quantity.
DETERMINING CIB WITH COBE DIRBE AND WHAM 15No. 1, 2007
the NEP region from our analysis would not change our derivedCIB results significantly.
3.3. Test against Previous Results
As a check of our analysis method and software, we performedfits of the form of equation (1) using data previously analyzed byLagache et al. (2000) for the Q2 region. Lagache et al. performedfits of this form for 122 positions in the region using DIRBE datawith interplanetary foreground subtracted, Leiden-DwingelooH i data, and preliminary WHAM data, all smoothed to the �7�
resolution of the COBE FIRAS. They kindly provided us withthe data. We performed fits as described above, except to be con-sistent with the Lagache et al. analysis, only measurement uncer-tainties for the dependent variable (the infrared intensity) wereused in the calculation of �2. Table 2 gives a comparison of ourresults and the Lagache et al. results. The two analyses give thesame values for the fit parameters, but the values for the fit pa-rameter uncertainties do not agree. Our uncertainties for A1 andB1 are larger than those given by Lagache et al. because our un-certainty calculation allows for uncertainty due to coupling be-tween the parameters. (The uncertainty quoted forC1 by Lagacheet al. is not a statistical uncertainty from the fitting, but was deter-mined from the distribution of residual intensity values, so com-parison with our uncertainty value for C1 is not meaningful.) Weconclude from this test that differences between our results in x 4and those of Lagache et al. are not the result of software errors.
4. RESULTS
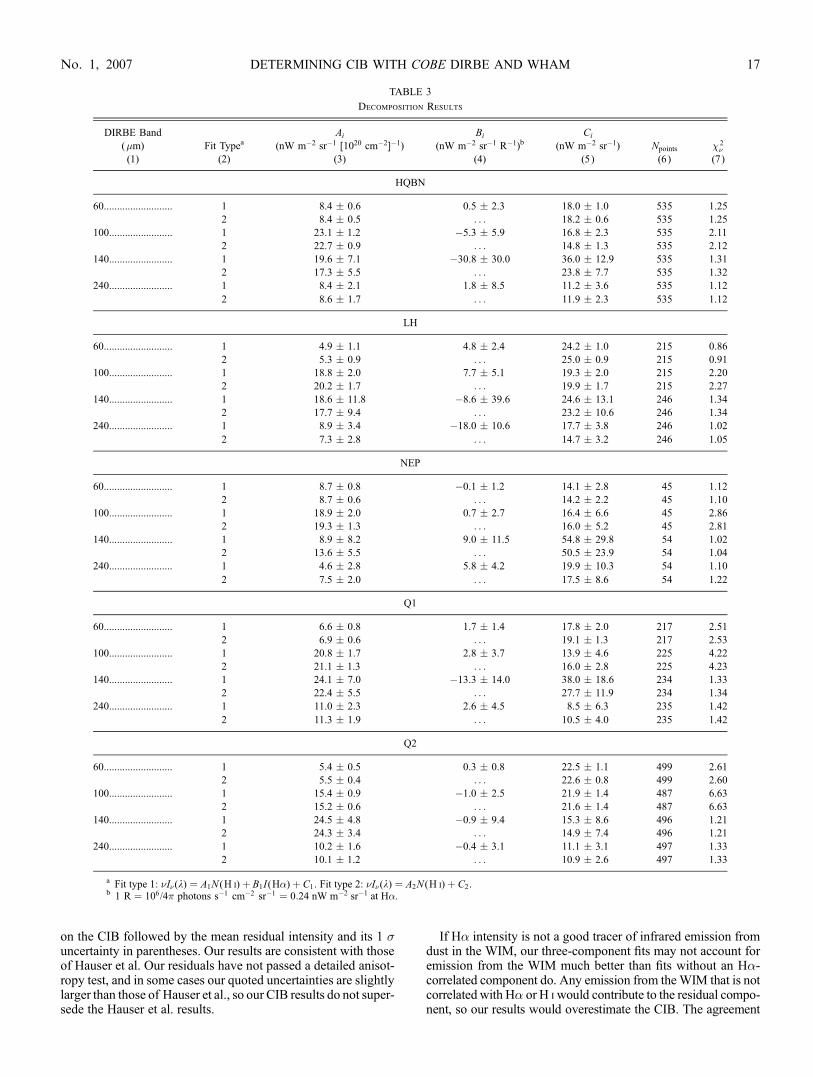
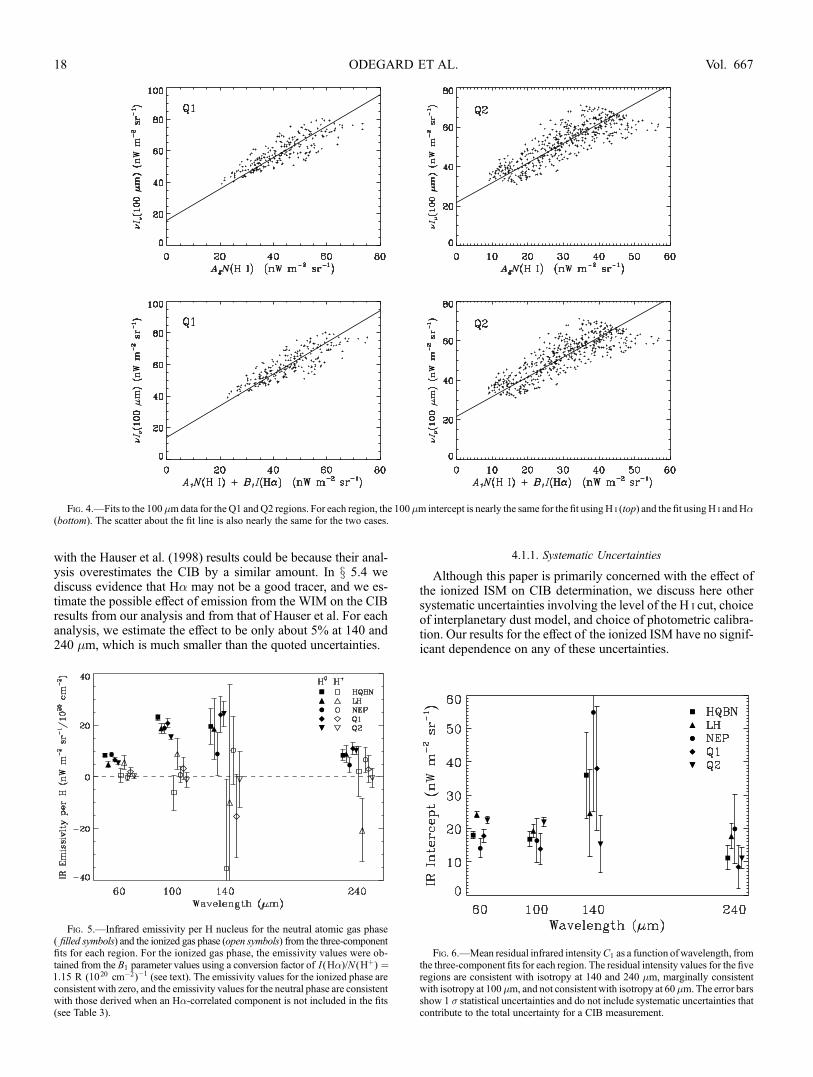
Parameters fromour fits for the five regions are listed in Table 3.PositionswithH i column density greater that the cuts described inx 3.1 were excluded from the fitting. For each region and eachwavelength, the first row gives results from the three-component fit(eq. [1]) and the second row gives results from the two-componentfit (eq. [2]). The uncertainties listed are statistical uncertainties fromthe 68% joint confidence region in parameter space; the C1 andC2 uncertainties do not include systematic uncertainties that needto be included in determining the total uncertainty for a CIB mea-surement. Column (6) of the table lists the number of indepen-dent WHAM pointings used for each fit. Sample correlation plotsshowing the fits to the 100 �m data for the Q1 and Q2 regions areshown in Figure 4, and parameters from the three-component fitsfor each region are plotted as a function ofwavelength in Figures 5and 6.
For all regions in all wavelength bands analyzed, we find thatthe mean residual intensity is nearly the same whether an H�-correlated component is included in the fitting or not (the C1 andC2 values are in close agreement), and the quality of the fit isnearly the same in the two cases. In addition, we do not detect sig-
nificant H�-correlated infrared emission; the B1 values are con-sistent with zerowithin the uncertainties, and theA1 andA2 valuesare nearly the same. The lack of H�-correlated 100 �m emissionis illustrated for the Q1 region in Figures 2 and 3. No correlationis seen between the H� map in Figure 2c and the map in Fig-ure 2d of residual 100 �m emission after subtraction of H iYcorrelated 100 �m emission. This is also shown by the correlationplot in Figure 3d.
4.1. Residual Intensities and CIB Measurements
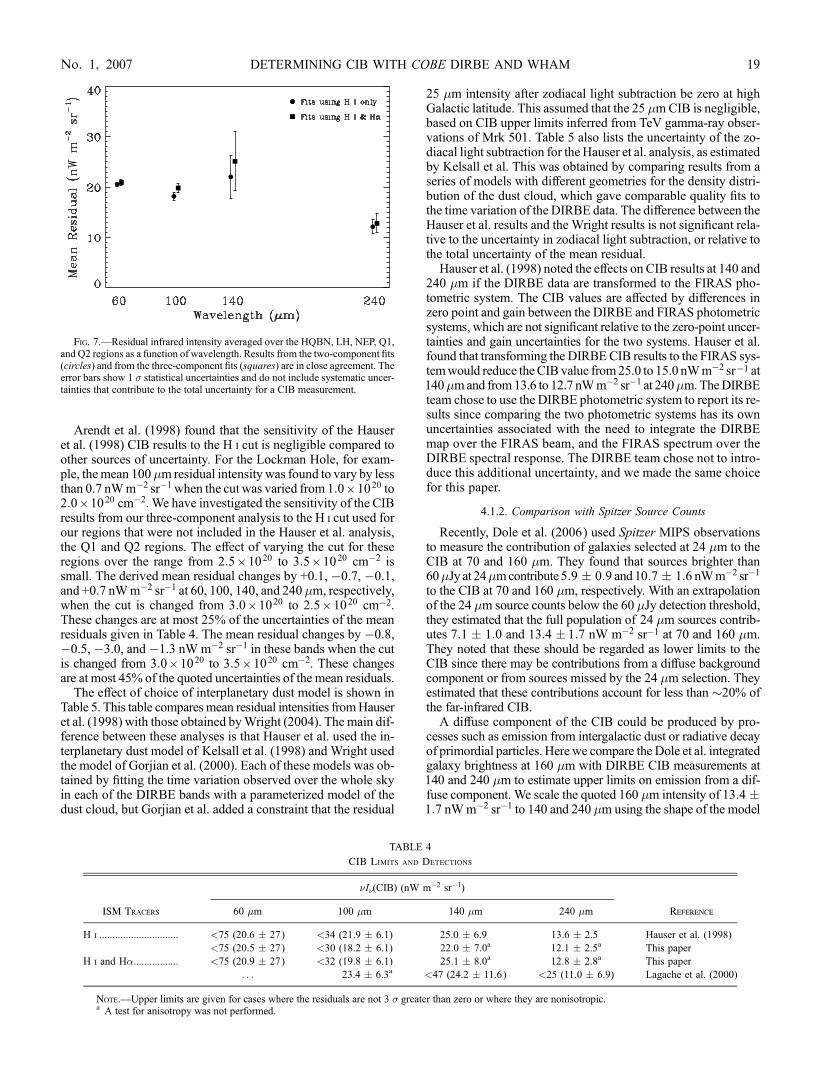
Figure 7 shows the residual intensity averaged over the fiveregions as a function of wavelength for each fit type; the C1 andC2 values were each averaged over the regions using weightingby 1/�2. The weighted-average residual intensities for the dif-ferent fit types agree within 1 � statistical uncertainties at allwavelengths, and the agreement is within 2 nW m�2 sr�1 at 60,100, and 240 �m.We conclude that addition of an H�-correlatedcomponent in modeling the foreground emission at high Galac-tic latitude has negligible effect on derived CIB results.To assess whether the weighted-average values for the residual
emission can be identified as CIB measurements, we calculatedthe total uncertainty for these values following themethod used byHauser et al. (1998). The total uncertainty was calculated as thequadrature sum of the statistical uncertainty, interplanetary fore-ground subtraction uncertainty, and DIRBE detector offset uncer-tainty. Magnitudes of the latter two uncertainties were taken fromTable 6 of Arendt et al. (1998). (DIRBE gain uncertainty is notincluded because it has the samemultiplicative effect on the meanresidual and its total uncertainty, and so does not affect the signal-to-noise ratio. This uncertainty is 10%Y14% for the DIRBE bandsused here.) Based on these total uncertainties, the mean residualemission is more than 3 � greater than zero at 140 and 240 �m forboth the two-component fits and the three-component fits, and at100 �m for the three-component fits. The residual intensity valuesfor the five different regions (Table 3 and Fig. 6) are consistentwith isotropy at 140 and 240�m (the values are compatiblewithintheir 1 � uncertainties). We have not performed detailed anisot-ropy tests on themaps of residual intensity fromour analysis, suchas the tests performed by Hauser et al. (1998). However, basedon the reduced �2 values in Table 3, significant anisotropy ispresent in the Q1 and Q2 regions at 60 �m and in all five re-gions at 100 �m.Table 4 lists the upper limits and detections of the CIB at 60,
100, 140, and 240 �m from Hauser et al. (1998), from our two-component and three-component fits, and from Lagache et al.(2000). For cases where the mean residual intensity does not ex-ceed zero by greater than 3 � or the residual intensity distributionhas been shown to be anisotropic, the table lists a 2 � upper limit
TABLE 2
Test of Analysis for Q2 Region
Wavelength
(�m)
A1a
(nW m�2 sr�1 [1020 cm�2]�1)
B1
(nW m�2 sr�1 R�1)bC1
(nW m�2 sr�1) Reference
100........................ 14.9 � 0.1 14.0 � 0.4 23.4 � 6.3 Lagache et al. (2000)
14.9 � 1.1 14.0 � 3.0 23.4 � 3.8 This paper
140........................ 20.0 � 0.6 23.4 � 1.9 24.3 � 11.6 Lagache et al. (2000)
20.0 � 2.0 23.4 � 5.9 24.3 � 7.9 This paper
240........................ 9.6 � 0.3 12.7 � 0.8 11.0 � 6.9 Lagache et al. (2000)
9.6 � 1.3 12.7 � 3.8 11.0 � 5.1 This paper
a Parameter values from fits of the form �I�(k) ¼ A1N (H i)þ B1I(H�)þ C1.b 1 R ¼ 106/4� photons s�1 cm�2 sr�1 ¼ 0:24 nW m�2 sr�1 at H�.
ODEGARD ET AL.16 Vol. 667
on the CIB followed by the mean residual intensity and its 1 �uncertainty in parentheses. Our results are consistent with thoseof Hauser et al. Our residuals have not passed a detailed anisot-ropy test, and in some cases our quoted uncertainties are slightlylarger than those of Hauser et al., so our CIB results do not super-sede the Hauser et al. results.
If H� intensity is not a good tracer of infrared emission fromdust in the WIM, our three-component fits may not account foremission from the WIM much better than fits without an H�-correlated component do. Any emission from theWIM that is notcorrelated with H� or H iwould contribute to the residual compo-nent, so our results would overestimate the CIB. The agreement
TABLE 3
Decomposition Results
DIRBE Band
(�m)
(1)
Fit Typea
(2)
Ai
(nW m�2 sr�1 [1020 cm�2]�1)
(3)
Bi
(nW m�2 sr�1 R�1)b
(4)
Ci
(nW m�2 sr�1)
(5)
Npoints
(6)
�2�
(7)
HQBN
60.......................... 1 8.4 � 0.6 0.5 � 2.3 18.0 � 1.0 535 1.25
2 8.4 � 0.5 . . . 18.2 � 0.6 535 1.25
100........................ 1 23.1 � 1.2 �5.3 � 5.9 16.8 � 2.3 535 2.11
2 22.7 � 0.9 . . . 14.8 � 1.3 535 2.12
140........................ 1 19.6 � 7.1 �30.8 � 30.0 36.0 � 12.9 535 1.31
2 17.3 � 5.5 . . . 23.8 � 7.7 535 1.32
240........................ 1 8.4 � 2.1 1.8 � 8.5 11.2 � 3.6 535 1.12
2 8.6 � 1.7 . . . 11.9 � 2.3 535 1.12
LH
60.......................... 1 4.9 � 1.1 4.8 � 2.4 24.2 � 1.0 215 0.86
2 5.3 � 0.9 . . . 25.0 � 0.9 215 0.91
100........................ 1 18.8 � 2.0 7.7 � 5.1 19.3 � 2.0 215 2.20
2 20.2 � 1.7 . . . 19.9 � 1.7 215 2.27
140........................ 1 18.6 � 11.8 �8.6 � 39.6 24.6 � 13.1 246 1.34
2 17.7 � 9.4 . . . 23.2 � 10.6 246 1.34
240........................ 1 8.9 � 3.4 �18.0 � 10.6 17.7 � 3.8 246 1.02
2 7.3 � 2.8 . . . 14.7 � 3.2 246 1.05
NEP
60.......................... 1 8.7 � 0.8 �0.1 � 1.2 14.1 � 2.8 45 1.12
2 8.7 � 0.6 . . . 14.2 � 2.2 45 1.10
100........................ 1 18.9 � 2.0 0.7 � 2.7 16.4 � 6.6 45 2.86
2 19.3 � 1.3 . . . 16.0 � 5.2 45 2.81
140........................ 1 8.9 � 8.2 9.0 � 11.5 54.8 � 29.8 54 1.02
2 13.6 � 5.5 . . . 50.5 � 23.9 54 1.04
240........................ 1 4.6 � 2.8 5.8 � 4.2 19.9 � 10.3 54 1.10
2 7.5 � 2.0 . . . 17.5 � 8.6 54 1.22
Q1
60.......................... 1 6.6 � 0.8 1.7 � 1.4 17.8 � 2.0 217 2.51
2 6.9 � 0.6 . . . 19.1 � 1.3 217 2.53
100........................ 1 20.8 � 1.7 2.8 � 3.7 13.9 � 4.6 225 4.22
2 21.1 � 1.3 . . . 16.0 � 2.8 225 4.23
140........................ 1 24.1 � 7.0 �13.3 � 14.0 38.0 � 18.6 234 1.33
2 22.4 � 5.5 . . . 27.7 � 11.9 234 1.34
240........................ 1 11.0 � 2.3 2.6 � 4.5 8.5 � 6.3 235 1.42
2 11.3 � 1.9 . . . 10.5 � 4.0 235 1.42
Q2
60.......................... 1 5.4 � 0.5 0.3 � 0.8 22.5 � 1.1 499 2.61
2 5.5 � 0.4 . . . 22.6 � 0.8 499 2.60
100........................ 1 15.4 � 0.9 �1.0 � 2.5 21.9 � 1.4 487 6.63
2 15.2 � 0.6 . . . 21.6 � 1.4 487 6.63
140........................ 1 24.5 � 4.8 �0.9 � 9.4 15.3 � 8.6 496 1.21
2 24.3 � 3.4 . . . 14.9 � 7.4 496 1.21
240........................ 1 10.2 � 1.6 �0.4 � 3.1 11.1 � 3.1 497 1.33
2 10.1 � 1.2 . . . 10.9 � 2.6 497 1.33
a Fit type 1: �I�(k) ¼ A1N (H i)þ B1I(H�)þ C1. Fit type 2: �I�(k) ¼ A2N (H i)þ C2.b 1 R ¼ 106/4� photons s�1 cm�2 sr�1 ¼ 0:24 nW m�2 sr�1 at H�.
DETERMINING CIB WITH COBE DIRBE AND WHAM 17No. 1, 2007
with the Hauser et al. (1998) results could be because their anal-ysis overestimates the CIB by a similar amount. In x 5.4 wediscuss evidence that H� may not be a good tracer, and we es-timate the possible effect of emission from the WIM on the CIBresults from our analysis and from that of Hauser et al. For eachanalysis, we estimate the effect to be only about 5% at 140 and240 �m, which is much smaller than the quoted uncertainties.
4.1.1. Systematic Uncertainties
Although this paper is primarily concerned with the effect ofthe ionized ISM on CIB determination, we discuss here othersystematic uncertainties involving the level of the H i cut, choiceof interplanetary dust model, and choice of photometric calibra-tion. Our results for the effect of the ionized ISM have no signif-icant dependence on any of these uncertainties.
Fig. 4.—Fits to the 100�mdata for the Q1 andQ2 regions. For each region, the 100�m intercept is nearly the same for the fit usingH i (top) and the fit usingH i andH�(bottom). The scatter about the fit line is also nearly the same for the two cases.
Fig. 5.—Infrared emissivity per H nucleus for the neutral atomic gas phase( filled symbols) and the ionized gas phase (open symbols) from the three-componentfits for each region. For the ionized gas phase, the emissivity values were ob-tained from the B1 parameter values using a conversion factor of I (H�)/N (Hþ) ¼1:15 R (1020 cm�2)�1 (see text). The emissivity values for the ionized phase areconsistent with zero, and the emissivity values for the neutral phase are consistentwith those derived when an H�-correlated component is not included in the fits(see Table 3).
Fig. 6.—Mean residual infrared intensityC1 as a function ofwavelength, fromthe three-component fits for each region. The residual intensity values for the fiveregions are consistent with isotropy at 140 and 240 �m, marginally consistentwith isotropy at 100�m, and not consistent with isotropy at 60�m. The error barsshow 1 � statistical uncertainties and do not include systematic uncertainties thatcontribute to the total uncertainty for a CIB measurement.
ODEGARD ET AL.18 Vol. 667
Arendt et al. (1998) found that the sensitivity of the Hauseret al. (1998) CIB results to the H i cut is negligible compared toother sources of uncertainty. For the Lockman Hole, for exam-ple, themean 100�m residual intensity was found to vary by lessthan 0.7 nWm�2 sr�1 when the cut was varied from 1:0 ; 1020 to2:0 ; 1020 cm�2. We have investigated the sensitivity of the CIBresults from our three-component analysis to the H i cut used forour regions that were not included in the Hauser et al. analysis,the Q1 and Q2 regions. The effect of varying the cut for theseregions over the range from 2:5 ; 1020 to 3:5 ; 1020 cm�2 issmall. The derived mean residual changes by +0.1, �0.7, �0.1,and +0.7 nWm�2 sr�1 at 60, 100, 140, and 240 �m, respectively,when the cut is changed from 3:0 ; 1020 to 2:5 ; 1020 cm�2.These changes are at most 25% of the uncertainties of the meanresiduals given in Table 4. The mean residual changes by �0.8,�0.5,�3.0, and�1.3 nW m�2 sr�1 in these bands when the cutis changed from 3:0 ; 1020 to 3:5 ; 1020 cm�2. These changesare at most 45% of the quoted uncertainties of the mean residuals.
The effect of choice of interplanetary dust model is shown inTable 5. This table compares mean residual intensities fromHauseret al. (1998) with those obtained byWright (2004). The main dif-ference between these analyses is that Hauser et al. used the in-terplanetary dust model of Kelsall et al. (1998) and Wright usedthe model of Gorjian et al. (2000). Each of these models was ob-tained by fitting the time variation observed over the whole skyin each of the DIRBE bands with a parameterized model of thedust cloud, but Gorjian et al. added a constraint that the residual
25 �m intensity after zodiacal light subtraction be zero at highGalactic latitude. This assumed that the 25 �mCIB is negligible,based on CIB upper limits inferred from TeV gamma-ray obser-vations of Mrk 501. Table 5 also lists the uncertainty of the zo-diacal light subtraction for the Hauser et al. analysis, as estimatedby Kelsall et al. This was obtained by comparing results from aseries of models with different geometries for the density distri-bution of the dust cloud, which gave comparable quality fits tothe time variation of the DIRBE data. The difference between theHauser et al. results and the Wright results is not significant rela-tive to the uncertainty in zodiacal light subtraction, or relative tothe total uncertainty of the mean residual.
Hauser et al. (1998) noted the effects on CIB results at 140 and240 �m if the DIRBE data are transformed to the FIRAS pho-tometric system. The CIB values are affected by differences inzero point and gain between the DIRBE and FIRAS photometricsystems, which are not significant relative to the zero-point uncer-tainties and gain uncertainties for the two systems. Hauser et al.found that transforming the DIRBE CIB results to the FIRAS sys-temwould reduce the CIB value from25.0 to 15.0 nWm�2 sr�1 at140�mand from13.6 to 12.7 nWm�2 sr�1 at 240�m.TheDIRBEteam chose to use the DIRBE photometric system to report its re-sults since comparing the two photometric systems has its ownuncertainties associated with the need to integrate the DIRBEmap over the FIRAS beam, and the FIRAS spectrum over theDIRBE spectral response. The DIRBE team chose not to intro-duce this additional uncertainty, and we made the same choicefor this paper.
4.1.2. Comparison with Spitzer Source Counts
Recently, Dole et al. (2006) used Spitzer MIPS observationsto measure the contribution of galaxies selected at 24 �m to theCIB at 70 and 160 �m. They found that sources brighter than60�Jy at 24�mcontribute 5:9 � 0:9 and10:7 � 1:6 nWm�2 sr�1
to the CIB at 70 and 160 �m, respectively. With an extrapolationof the 24 �m source counts below the 60 �Jy detection threshold,they estimated that the full population of 24 �m sources contrib-utes 7:1 � 1:0 and 13:4 � 1:7 nW m�2 sr�1 at 70 and 160 �m.They noted that these should be regarded as lower limits to theCIB since there may be contributions from a diffuse backgroundcomponent or from sources missed by the 24 �m selection. Theyestimated that these contributions account for less than �20% ofthe far-infrared CIB.
A diffuse component of the CIB could be produced by pro-cesses such as emission from intergalactic dust or radiative decayof primordial particles. Here we compare the Dole et al. integratedgalaxy brightness at 160 �m with DIRBE CIB measurements at140 and 240 �m to estimate upper limits on emission from a dif-fuse component. We scale the quoted 160 �m intensity of 13:4 �1:7 nWm�2 sr�1 to 140 and 240 �m using the shape of the model
Fig. 7.—Residual infrared intensity averaged over the HQBN, LH, NEP, Q1,and Q2 regions as a function of wavelength. Results from the two-component fits(circles) and from the three-component fits (squares) are in close agreement. Theerror bars show 1 � statistical uncertainties and do not include systematic uncer-tainties that contribute to the total uncertainty for a CIB measurement.
TABLE 4
CIB Limits and Detections
�I�(CIB) (nW m�2 sr�1)
ISM Tracers 60 �m 100 �m 140 �m 240 �m Reference
H i .............................. <75 (20.6 � 27) <34 (21.9 � 6.1) 25.0 � 6.9 13.6 � 2.5 Hauser et al. (1998)
<75 (20.5 � 27) <30 (18.2 � 6.1) 22.0 � 7.0a 12.1 � 2.5a This paper
H i and H�................. <75 (20.9 � 27) <32 (19.8 � 6.1) 25.1 � 8.0a 12.8 � 2.8a This paper
. . . 23.4 � 6.3a <47 (24.2 � 11.6) <25 (11.0 � 6.9) Lagache et al. (2000)
Note.—Upper limits are given for cases where the residuals are not 3 � greater than zero or where they are nonisotropic.a A test for anisotropy was not performed.
DETERMINING CIB WITH COBE DIRBE AND WHAM 19No. 1, 2007

spectral energy distribution from Figure 13 of Dole et al., which isbased on the Lagache et al. (2004) galaxy evolution model. Thisspectrum is also used to apply color corrections so the intensities canbe compared with the quoted DIRBE CIB values, which assume aspectral shape of �I� ¼ constant over theDIRBE bandpass.We ob-tain integrated galaxy intensity values of 13:7 � 1:7 nW m�2 sr�1
at 140 �m and 10:7 � 1:4 nW m�2 sr�1 at 240 �m. The uncer-tainties here do not include any uncertainty in the shape of theadopted spectral energy distribution. Table 6 compares thesevalues with the DIRBE CIB results and with DIRBE CIB re-sults transformed to the FIRAS photometric system (Hauser et al.1998). The table lists values for the fractional contribution of theintegrated galaxy brightness to theCIB and the difference betweenthe CIB and the integrated galaxy brightness. Using the CIB re-sults on the DIRBE photometric system yields 2 � upper limitsfor a diffuse CIB component of 26 nW m�2 sr�1 at 140 �m and8.5 nW m�2 sr�1 at 240 �m.
4.2. Infrared Emissivity of the Ionized Medium
Infrared emissivity results from our three-component fits areshown as a function of wavelength in Figure 5. The derived val-ues of emissivity per H atom for the neutral atomic gas phase,(H0), are comparable to previous determinations from high-latitude IRYH i correlation studies (e.g., Dwek et al. 1997; Reachet al. 1998). The values of emissivity per H+ ion for the ionizedphase, (H+), were obtained from the B1 values in Table 3 usinga conversion factor of I(H�)/N (Hþ) ¼ 1:15 R (1020 cm�2)�1.This is the mean ratio of H� intensity to pulsar dispersion mea-sure found by Reynolds (1991b) for four high-latitude lines ofsight toward pulsars at z > 4 kpc. It corresponds to an effectiveelectron density, neA �
Rn2e ds/
Rne ds, of 0.08 cm
�3 for an elec-tron temperature of 8000 K and no extinction. The I(H�)/N(H+)ratio ranges from 0.75 to 1.9 R (1020 cm�2)�1 for the lines of sightstudied by Reynolds, so the uncertainty in the conversion factor is
large. The value adopted here is the same as that used by Lagacheet al. (2000). Figure 5 shows that the derived values of (H+) areconsistent with zero for all regions at all wavelengths. We havechecked the dependence of derived 100 �m (H+) values on theH i cut and find that they do not change significantly when the cutis varied by �30%.Our derived values of (H+) at 100�mare compared with pre-
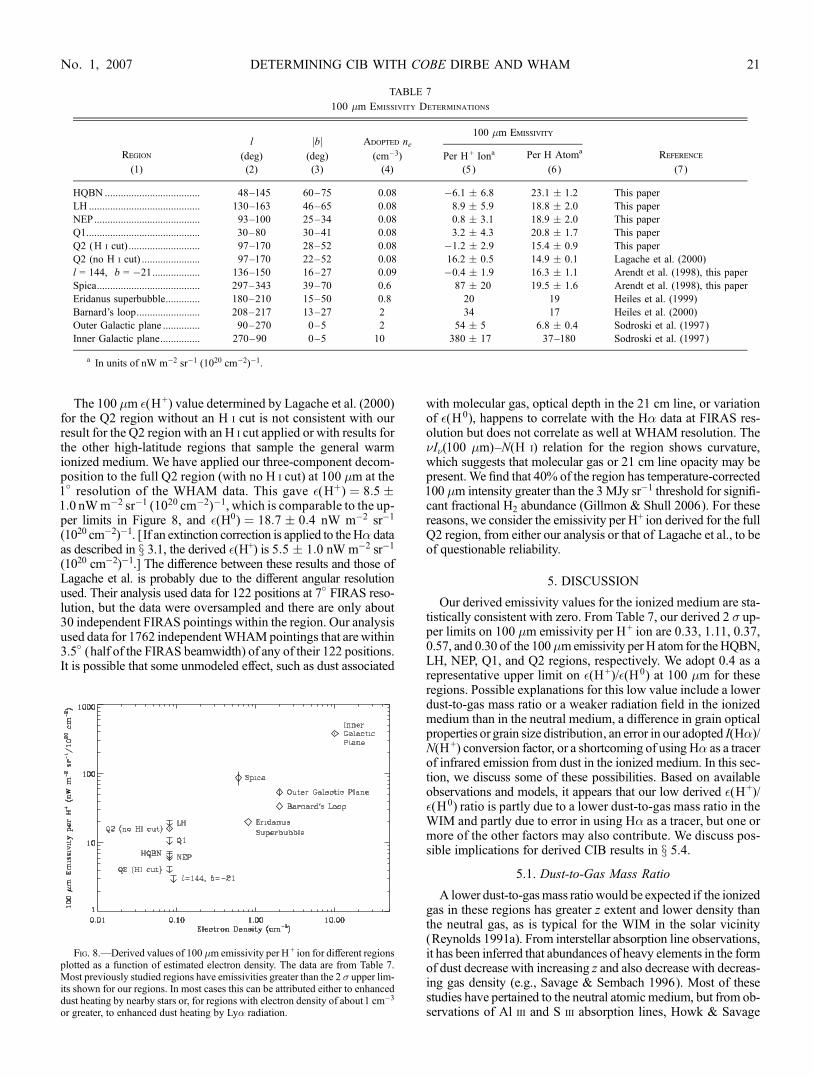
vious results for other regions of the sky in Table 7. All of the re-sults listed are from analyses similar to that used here, with eitherH� intensity or centimeter wavelength radio continuum intensityused as the tracer of the ionized gas. Column (4) lists the electrondensity adopted in each study for calculating the conversion fromH� or radio continuum intensity to N(H+). Uncertainty in thisconversion may be as large as a factor of 2 or more for some re-gions, but it is not included in the uncertainty listed for (H+).The emissivity values are shown plotted as a function of electrondensity in Figure 8. The 2 � upper limits for our regions are com-parable to that obtained by Arendt et al. (1998) for the 10
� ; 12�
region at l ¼ 144�, b ¼ �21�. For the other previously studiedregions, 100 �m emission was detected from the ionized gascomponent, and the derived (H+) is greater than or equal to the100 �m (H0). This can be explained if the dust-to-gas mass ratiois the same in the ionized and neutral atomic components, withcases of enhanced emissivity in the ionized component causedby Ly� heating (for the Barnard’s loop region; Heiles et al. 2000)or a local source of heating (for the Spica region; Boulanger et al.1995; Zagury et al. 1998), or both (for the Galactic plane regions;Sodroski et al. 1997). With the exception of the Q2 region, theionized gas in these regions is not representative of the generalwarm ionized medium observed at high latitudes. The electrondensity is an order of magnitude greater, and the ionized gas ismuch closer to the Galactic midplane (z < 100 pc, compared to anexponential z scale height of about 900 pc for the warm ionizedmedium; Reynolds 1993).
TABLE 5
Effect of Interplanetary Dust Model on CIB Determination
�I� (nW m�2 sr�1)
Quantity 60 �m 100 �m 140 �m 240 �m
Hauser et al. (1998) mean residuala.......................... 20.6 � 27 21.9 � 6.1 25.0 � 6.9 13.6 � 2.5
Wright (2004) mean residualb ................................... �8 � 14 12.5 � 5 22 � 7 13 � 2.5
Residual difference (row 1� row 2)......................... 28.6 9.4 3 0.6
Zodiacal light subtraction uncertainty c ..................... 26.7 6.0 2.3 0.5
a Based on the IPD model of Kelsall et al. (1998).b Based on the IPD model of Gorjian et al. (2000).c 1 � uncertainty in zodiacal light subtraction for the Hauser et al. analysis, from Kelsall et al. (1998).
TABLE 6
Comparison of Integrated Galaxy Brightness and CIB Measurements
Quantity 140 �m 240 �m
Integrated galaxy brightnessa,b ................................................................ 13.7 � 1.7 10.7 � 1.4
DIRBE CIBa,c .......................................................................................... 25.0 � 6.9 13.6 � 2.5
DIRBE CIB transformed to FIRAS scalea,c............................................ 15.0 � 5.9 12.7 � 1.6
Integrated galaxy brightness/CIB (DIRBE scale)................................... 0.55 � 0.17 0.79 � 0.18
Integrated galaxy brightness/CIB (FIRAS scale) ................................... 0.91 � 0.37 0.84 � 0.15
CIB (DIRBE scale) � integrated galaxy brightnessa ............................. <26 (11.3 � 7.1) <8.5 (2.9 � 2.8)
CIB (FIRAS scale) � integrated galaxy brightnessa.............................. <14 (1.3 � 6.1) <6.2 (2.0 � 2.1)
a �I� in units of nW m�2 sr�1.b Dole et al. (2006) 160 �m result from Spitzer MIPS observations, scaled to DIRBE wavelengths.c From Hauser et al. (1998).
ODEGARD ET AL.20 Vol. 667
The 100 �m (H+) value determined by Lagache et al. (2000)for the Q2 region without an H i cut is not consistent with ourresult for the Q2 region with an H i cut applied or with results forthe other high-latitude regions that sample the general warmionized medium. We have applied our three-component decom-position to the full Q2 region (with no H i cut) at 100 �m at the1�resolution of the WHAM data. This gave (Hþ) ¼ 8:5 �
1:0 nWm�2 sr�1 (1020 cm�2)�1, which is comparable to the up-per limits in Figure 8, and (H0) ¼ 18:7 � 0:4 nW m�2 sr�1
(1020 cm�2)�1. [If an extinction correction is applied to theH� dataas described in x 3.1, the derived (H+) is 5:5 � 1:0 nW m�2 sr�1
(1020 cm�2)�1.] The difference between these results and those ofLagache et al. is probably due to the different angular resolutionused. Their analysis used data for 122 positions at 7
�FIRAS reso-
lution, but the data were oversampled and there are only about30 independent FIRAS pointings within the region. Our analysisused data for 1762 independentWHAMpointings that are within3.5� (half of the FIRAS beamwidth) of any of their 122 positions.It is possible that some unmodeled effect, such as dust associated
with molecular gas, optical depth in the 21 cm line, or variationof (H0), happens to correlate with the H� data at FIRAS res-olution but does not correlate as well at WHAM resolution. The�I�(100 �m)YN(H i) relation for the region shows curvature,which suggests that molecular gas or 21 cm line opacity may bepresent.We find that 40% of the region has temperature-corrected100 �m intensity greater than the 3MJy sr�1 threshold for signifi-cant fractional H2 abundance (Gillmon & Shull 2006). For thesereasons, we consider the emissivity per H+ ion derived for the fullQ2 region, from either our analysis or that of Lagache et al., to beof questionable reliability.
5. DISCUSSION
Our derived emissivity values for the ionized medium are sta-tistically consistent with zero. From Table 7, our derived 2 � up-per limits on 100 �m emissivity per H+ ion are 0.33, 1.11, 0.37,0.57, and 0.30 of the 100�memissivity per H atom for the HQBN,LH, NEP, Q1, and Q2 regions, respectively. We adopt 0.4 as arepresentative upper limit on (H+)/(H0) at 100 �m for theseregions. Possible explanations for this low value include a lowerdust-to-gas mass ratio or a weaker radiation field in the ionizedmedium than in the neutral medium, a difference in grain opticalproperties or grain size distribution, an error in our adopted I(H�)/N(H+) conversion factor, or a shortcoming of using H� as a tracerof infrared emission from dust in the ionized medium. In this sec-tion, we discuss some of these possibilities. Based on availableobservations and models, it appears that our low derived (H+)/(H0) ratio is partly due to a lower dust-to-gas mass ratio in theWIM and partly due to error in using H� as a tracer, but one ormore of the other factors may also contribute. We discuss pos-sible implications for derived CIB results in x 5.4.
5.1. Dust-to-Gas Mass Ratio
A lower dust-to-gasmass ratiowould be expected if the ionizedgas in these regions has greater z extent and lower density thanthe neutral gas, as is typical for the WIM in the solar vicinity(Reynolds 1991a). From interstellar absorption line observations,it has been inferred that abundances of heavy elements in the formof dust decrease with increasing z and also decrease with decreas-ing gas density (e.g., Savage & Sembach 1996). Most of thesestudies have pertained to the neutral atomic medium, but from ob-servations of Al iii and S iii absorption lines, Howk & Savage
TABLE 7
100 �m Emissivity Determinations
100 �m Emissivity
Region
(1)
l
(deg)
(2)
jbj(deg)
(3)
Adopted ne
(cm�3)
(4)
Per H+ Iona
(5)
Per H Atoma
(6)
Reference
(7)
HQBN .................................... 48Y145 60Y75 0.08 �6.1 � 6.8 23.1 � 1.2 This paper
LH .......................................... 130Y163 46Y65 0.08 8.9 � 5.9 18.8 � 2.0 This paper
NEP........................................ 93Y100 25Y34 0.08 0.8 � 3.1 18.9 � 2.0 This paper
Q1........................................... 30Y80 30Y41 0.08 3.2 � 4.3 20.8 � 1.7 This paper
Q2 (H i cut) ........................... 97Y170 28Y52 0.08 �1.2 � 2.9 15.4 � 0.9 This paper
Q2 (no H i cut) ...................... 97Y170 22Y52 0.08 16.2 � 0.5 14.9 � 0.1 Lagache et al. (2000)
l = 144, b = �21.................. 136Y150 16Y27 0.09 �0.4 � 1.9 16.3 � 1.1 Arendt et al. (1998), this paper
Spica....................................... 297Y343 39Y70 0.6 87 � 20 19.5 � 1.6 Arendt et al. (1998), this paper
Eridanus superbubble............. 180Y210 15Y50 0.8 20 19 Heiles et al. (1999)
Barnard’s loop........................ 208Y217 13Y27 2 34 17 Heiles et al. (2000)
Outer Galactic plane .............. 90Y270 0Y5 2 54 � 5 6.8 � 0.4 Sodroski et al. (1997)
Inner Galactic plane............... 270Y90 0Y5 10 380 � 17 37Y180 Sodroski et al. (1997)
a In units of nW m�2 sr�1 (1020 cm�2)�1.
Fig. 8.—Derived values of 100 �m emissivity per H+ ion for different regionsplotted as a function of estimated electron density. The data are from Table 7.Most previously studied regions have emissivities greater than the 2 � upper lim-its shown for our regions. In most cases this can be attributed either to enhanceddust heating by nearby stars or, for regions with electron density of about1 cm�3
or greater, to enhanced dust heating by Ly� radiation.
DETERMINING CIB WITH COBE DIRBE AND WHAM 21No. 1, 2007

(1999) found evidence that about 60%Y70% of aluminum atomsin the WIM are in dust, compared to about 90% of Al in dust inH ii regions at low z. This result is based on observations oftwo lines of sight that sample the WIM up to z distances of 690and 2800 pc and four lines of sight through low-density (ne �0:2Y4 cm�3) H ii regions at z < 200 pc. Howk & Savage alsonoted that the dust phase Al abundance they obtained for the low-zH ii regions is comparable to previous, somewhat uncertain de-terminations for the warm neutral medium at low z. Assuming thatthis low-z dust phase Al abundance is valid for the neutral atomicmedium in the regions studied here, and that 100 �m emissivityper H nucleus varies in proportion to Al dust phase abundance,onewould expect (H+) to be about 20%Y30% lower than (H0) at100 �m. Thus, the Howk & Savage results suggest that the dif-ference in dust abundance between the neutral and ionized com-ponents is not great enough to fully explain our derived upperlimit on (H+)/(H0). To confirm this, dust phase Al abundancedeterminations for additional lines of sight through the WIMwould be of interest, as would calculations of the relation be-tween Al dust phase abundance and 100 �m emissivity for dustgrain models.
5.2. Interstellar Radiation Field
The lower 100 �m emissivity derived for the ionized mediumcould also be explained if it were subject to a weaker interstellarradiation field. Heating of dust by Ly� is expected to be negli-gible at the electron density estimated for the WIM (Spitzer1978, p. 196; Heiles et al. 2000). In addition, there are no early-type stars that are close enough to the lines of sight through ourregions to cause significant dust heating relative to that of thegeneral interstellar radiation field. Models of the spatial distri-bution of the interstellar radiation field at visual and ultravioletwavelengths predict that the mean intensity increases with in-creasing z up to about 200 pc, as light from distant stars in theGalactic disk becomes less attenuated, and then decreases withfurther increase in z due to geometrical dilution. Wakker &Boulanger (1986) used their model of the radiation field to cal-culate the expected 100 �m intensity of a diffuse cloud with amixture of silicate and graphite grains. The intensity was calcu-lated for different distances of the cloud along two high-latitudelines of sight (toward b ¼ 90�, and toward l ¼ 180�, b ¼ 60�).They found that the 100 �m intensity varies by less than �20%over the range in cloud height from z ¼ 0 to 1 kpc. Thus, it ap-pears that the radiation field does not vary enough to explain ourderived limit on (H+)/(H0), even if all the H i gas were locatednear the maximum of the radiation field and all of the H ii gaswere at z ¼ 1 kpc.
5.3. I(H�)/N (Hþ) Conversion Factor
To change our derived upper limit on (H+)/(H0) at 100 �mfrom0.4 to 1.0, the adopted I(H�)/N(H+) conversion factorwouldneed to be changed from 1.15 to 2.9 R (1020 cm�2)�1. This is sig-nificantly larger than the largest value of 1.9 R (1020 cm�2)�1 mea-sured by Reynolds (1991b) for lines of sight to four pulsars athigh z. Values obtained by Arendt et al. (1998) for an additionalfive pulsar lines of sight range from 0.8 to 1.2 R (1020 cm�2)�1.Thus, it appears that there is not an error in the adopted con-version factor value that is large enough to fully explain the lowemissivity derived for the ionized medium.
Independent evidence that supports our adopted conversionfactor comes from interstellar absorption line studies. Our adoptedvalue corresponds to an effective electron density of 0.08 cm�3.
Electron density estimates from observations of absorption linesof excited C+ toward extragalactic objects and high-z stars arecomparable to this. In the most extensive study to date, Lehneret al. (2004) presented results for 43 such lines of sight at jbj >30
�. Most of the observed absorption line components are at low
velocity. For these, they find a mean density of hnei ¼ 0:08 �0:04 cm�3 (1 � dispersion). For the Intermediate Velocity Arch,they find hnei ¼ 0:03 � 0:01 cm�3, probably lower because thegas is at higher z (�1 kpc). The derived ne values are averages overC+ regions in both thewarm ionizedmediumand thewarmneutralmedium, but Lehner et al. usedWHAMH� data to estimate that atleast 50% of the excited C+ column density originates in theWIMfor an average line of sight.
5.4. H� as a Tracer of Infrared Emission
Our derived emissivity values and CIB results are subject toerror if the WHAM H� data are not a good tracer of far-infraredemission from the WIM in the regions we study. Far-infraredintensity is proportional to dust column density, whereas H� in-tensity is proportional to the square of the ionized gas densityintegrated along the line of sight, I(H�) / T�0:92
e
Rn2e ds, where
ne is electron density and Te is electron temperature (Reynolds1992). Thus, errors would be expected in our results if the spa-tial variation of H� intensity for a region is caused more by dif-ferences in mean electron density or mean electron temperaturefor different lines of sight than by differences in ionized gascolumn density. The approximate csc jbj dependence of high-latitude WHAM data (Haffner et al. 2003) provides evidencethat H� is a reasonable tracer of N(H+) on large angular scales,but this is not necessarily true on the scales within the regionsstudied here.Haffner et al. (1999) and Reynolds et al. (1999) have found
evidence that variations in H� intensity may be largely due tovariations in electron density, based on their observations ofH�, [N ii] k6583, and [S ii] k6716 line intensities in the re-gion 123
�< l < 164�,�35�< b <�6
�and previous observations
of these lines in halos of edge-on galaxies. The [N ii]/H� and[S ii]/H� intensity ratios are observed to increase with increasingz, while the [S ii]/[N ii] ratio is nearly constant. Interpreting thevariations in [N ii]/H� as primarily due to variations in electrontemperature, Haffner et al. and Reynolds et al. inferred Te valuesranging from 6000 to 11,000 K, with temperature increasingas H� intensity decreases. They showed that this anticorrela-tion can be explained if variations in H� are largely due to var-iations in mean electron density, and a supplemental source ofgas heating is present that dominates over photoionization atlow density, causing temperature to increase with decreasingdensity. A number of possible supplemental heating mechanismshave been proposed, and Reynolds et al. estimate the heatingrate that would be needed to explain the observations for eachmechanism.If H� is not a good tracer of ionized gas column density, our
method of analysis tends to underestimate the infrared emissivityper H+ ion and overestimate the CIB. To show this, we consider asimple model in which the H� variation in a region is partly dueto variation of N(H+) and partly due to variation of effectiveelectron density neA,
I H�ð ÞI H�ð Þh i ¼
N Hþð ÞN Hþð Þh i
neA
neAh i ; ð3Þ
where hI (H�)i, hN (Hþ)i, and hneAi are averages over alllines of sight through the region. This assumes that electron
ODEGARD ET AL.22 Vol. 667

temperature is constant, and hN (Hþ)neAi ¼ hN (Hþ)ihneAi. Weadopt
N Hþð ÞN Hþð Þh i ¼
I H�ð ÞI H�ð Þh i
� �p; ð4Þ
neA
neAh i ¼I H�ð ÞI H�ð Þh i
� �1�p
; ð5Þ
where p is the fraction of the variation of log I(H�)½ � that is causedby variation of N(H+). We assume that when averaged over largeangular scales N(H+) and I(H�) are directly proportional,
N Hþð Þh i¼ I H�ð Þh ic
; ð6Þ
where c is our adopted conversion factor of 1.15 R (1020 cm�2)�1.The infrared emissivity per H nucleus is assumed to be constantwithin each gas phase, so the infrared emission from each phase isproportional to its gas column density. The infrared emission fromthe ionized phase is
�IWIM� ¼ Hþð ÞN Hþð Þ¼ Hþð Þ I H�ð Þh i1�p
I H�ð Þ p
c: ð7Þ
Assuming the distributions of N(H i) and I(H�) are uncorrelated,the H� coefficient B1 that would be obtained from our decompo-sition is the mean slope of the �IWIM
� -I(H�) relation. If the distri-bution of H� intensities is symmetric about themean, this is givenby
B1 ¼d�IWIM
�
dI H�ð Þ
����I H�ð Þ¼ I H�ð Þh i
¼ p Hþð Þc
; ð8Þ
and the emissivity per H+ ion derived from the analysis under-estimates the actual emissivity,
derived Hþð Þ ¼ cB1 ¼ p Hþð Þ: ð9Þ
Thus, our derived limit (Hþ)/(H0) < 0:4 may be consistentwith no real difference in emissivity between the ionized andneutral phases if only a small fraction of the H� variation in ourregions is caused by variation of N(H+), i.e., if p < 0:4 in thecontext of this simple model. Berkhuijsen et al. (2006) haveestimated p ¼ 0:68 � 0:04 for the high-latitude diffuse ionizedgas, using pulsar dispersion measure data and WHAM H� datatoward a sample of 157 pulsars at jbj > 5� (see their Fig. 7b).This result suggests that our low derived (H+)/(H0) is at leastpartly due to error in using H� as a tracer.
The overestimate of the CIB for our simple model is given bythe intercept of a linear fit to the �IWIM
� -I(H�) relation. To a goodapproximation, this intercept is given by
� �I�ð Þ ¼ �IWIM�
��I H�ð Þ¼ I H�ð Þh i�B1 I H�ð Þh i: ð10Þ
Using equations (6), (7), and (8), we obtain
� �I�ð Þ ¼ 1� pð Þ Hþð Þ N Hþð Þh i: ð11Þ
We have used this result to estimate the possible effect of emis-sion from the WIM that is not correlated with H� or N(H i) on
the CIB results derived from our three-component fits. We sub-tracted �(�I�) offsets from the derived residual intensities C1
for each region assuming p ¼ 0:5 � 0:5, hN (Hþ)i ¼ hI(H�)i/½1:15 R (1020 cm�2)�1�, and (Hþ) ¼ (0:5 � 0:5)(H0), usingvalues of A1 in Table 3 for (H
0). For each wavelength, we thencalculated the weighted average of the reduced residual inten-sity over the five regions, treating the �0.5 uncertainties in pand (H+)/(H0) as additional independent sources of error. Theresulting average residual intensities are 21 � 27, 17:0 � 6:3,23:5 � 8:5, and 12:0 � 2:9 nW m�2 sr�1 at 60, 100, 140, and240 �m, respectively. At 140 and 240 �m, these results are only6% lower than the results from our three-component fits.
Equation (11) is the same as the expression for the CIB over-estimate from a two-component fit (using H iwithout H�) wherep is the fraction ofN(H+) that is correlated withN(H i). Thus, wecan use the same procedure to estimate the possible effect ofemission from the WIM that is not correlated with N(H i) on theCIB results of Hauser et al. (1998). We make the same assump-tions as in the previous paragraph for p, hN (Hþ)i, and (H+).The HQBS region included in the Hauser et al. analysis is belowthe declination limit of the WHAM survey, so for this region weused data from the Southern H� Sky Survey of Gaustad et al.(2001) as processed by Finkbeiner (2003). We find that theweighted-average residual intensities from the Hauser et al.analysis would be reduced to 20:9 � 6:2, 23:6 � 7:0, and 12:9 �2:5 nW m�2 sr�1 at 100, 140, and 240 �m, respectively. Theseresults are only about 5% lower than those of Hauser et al.
The possible effect of the ionized medium is also estimatedto be small for the 125Y2000 �m CIB spectrum determined byFixsen et al. (1998) from FIRAS observations. In one of theiranalyses, Galactic emission template maps were constructed fromDIRBE 140 and 240 �m data with the Hauser et al. (1998) CIBand zodiacal light subtracted, and the CIB spectrum was obtainedby correlating FIRAS data with these templates. Our estimate of�5% for the possible error of the DIRBE CIB results also appliesto the 140 �mP kP 240 �m part of the CIB spectrum derivedfrom this analysis. At longer wavelengths, the error is expected todecrease. This is because the spectrum of emission from the ion-ized medium is expected to be similar to the spectrum of emissionfrom the H i phase, and the ratio of this spectrum to the CIB spec-trum decreaseswith increasing wavelength for k > 240 �m. Sinceall three of the Fixsen et al. analyses gave consistent results for theCIB spectrum, the possible error due to the WIM should be smallfor their average CIB spectrum from the three methods.
6. SUMMARY
We used WHAM H� data as a tracer of far-infrared emissionfrom the warm ionized phase of the ISM in an effort to determinethe intensity of this emission at high Galactic latitudes and toassess its effect on determination of the cosmic far-infrared back-ground. We studied five high-latitude regions, including regionspreviously analyzed by Hauser et al. (1998) and Lagache et al.(2000). For each region, we decomposed COBE DIRBE data at60, 100, 140, and 240 �m into a sum of an H iYcorrelated com-ponent, an H�-correlated component, and a residual component.Uncertainties in our results due to omission of an H2-correlatedcomponent are expected to be negligible, based on results of aFUSE high-latitude H2 absorption line survey. We found that theintensity of the H�-correlated component is consistent with zerowithin the uncertainties for all regions at all wavelengths. Fromthe mean intensities of the residual components, we derived es-timates of the CIB at 140 and 240 �m and upper limits to the CIBat 60 and 100 �m (Table 4). We repeated the analysis withoutincluding an H�-correlated component, and the derived CIB
DETERMINING CIB WITH COBE DIRBE AND WHAM 23No. 1, 2007

results did not change significantly. Our CIB estimates and up-per limits are similar to previous CIB determinations for whichthe far-IR emission from the ISM was traced only by H i columndensity. We conclude that addition of an H�-correlated compo-nent in modeling the ISM emission at high Galactic latitude hasnegligible effect on derived CIB results. We did not perform de-tailed anisotropy tests on the maps of residual intensity from ouranalysis, so our CIB results do not supersede the results of Hauseret al. (1998).
We derived 2 � upper limits to the 100 �m emissivity perH+ ion for the five regions that are typically about 40% of theemissivity per H atom for the neutral atomic medium. Availableevidence suggests that this low value is partly due to a lower dust-to-gas mass ratio in the ionized medium than in the neutral atomicmedium, and partly due to a shortcoming of using H� as a tracerof far-IR emission, which causes our analysis to underestimate theemissivity of the ionized medium. Other possible effects that mayplay a role include a weaker radiation field in the ionized mediumthan in the neutral medium, a difference in grain optical propertiesor grain size distribution, or an error in our adopted I(H�)/N(H+)conversion factor. [The value of 100 �m emissivity per H+ ionderived by Lagache et al. (2000) is much greater than the upperlimit we derived for their region. Our analysis differs from theirsin that (1) we exclude positions where N(H i) is greater than 3 ;1020 cm�2, where emission fromH2 associated dust or 21 cm lineopacity may be significant, and (2) we analyze data at a resolu-tion of 1� instead of 7�.]
H� observations have previously been used in this kind of anal-ysis with apparent success for ionized regions that have higherdensity and are at low z. However, for the general high-latitudeWIM, evidence from Reynolds et al. (1999) and Berkhuijsenet al. (2006) suggests that variations in H� are not entirely dueto variations in H+ column density but are also due to differences
in mean electron density for different lines of sight. Thus, H�may not be an accurate tracer of far-infrared emission from theWIM.If H� intensity is not a good tracer, any emission from the
WIM that is not correlated with H� or H i would contribute toour derived residual component for each region, so our analysiscould overestimate the CIB. The agreement with the Hauser et al.(1998) results could be because their analysis overestimates theCIB by a similar amount. We used WHAM data to estimate thepossible effect on our CIB results and on the Hauser et al. results,assuming that the mean H� intensity for each region can be usedto estimate itsmeanH+ column density. In each case, we estimatedthe effect to be only about 5% at 140 and 240 �m, which is muchsmaller than the quoted uncertainties. The possible effect of emis-sion from the WIM is also estimated to be small for the 125Y2000 �m CIB spectrum determined by Fixsen et al. (1998) fromFIRAS observations.We estimated upper limits on a possible diffuse component
of the CIB by comparing the Hauser et al. (1998) CIB resultswith the integrated galaxy brightness determined by Dole et al.(2006) from Spitzer source counts. We obtained 2 � upper lim-its on a diffuse component of 26 nW m�2 sr�1 at 140 �m and8.5 nW m�2 sr�1 at 240 �m.
We thank F. Boulanger, J. C. Howk, and G. Lagache for usefuldiscussions, and G. Lagache for providing us with data from theprevious study of the Q2 region. We thank the referee for helpfulcomments. This paper is dedicated to the memory of our friendand colleague Thomas J. Sodroski, and we acknowledge his co-ntributions in the formative stages of this work. This researchwas supported by NASA Astrophysical Data Program NRA 99-01-ADP-137.
REFERENCES
Arendt, R. G., et al. 1998, ApJ, 508, 74Bard, Y. 1974, Nonlinear Parameter Estimation (Orlando: Academic)Berkhuijsen, E. M., Mitra, D., & Muller, P. 2006, Astron. Nachr., 327, 82Boggess, N., et al. 1992, ApJ, 397, 420Boulanger, F., Abergel, A., Bernard, J.-P., Burton, W. B., Desert, F.-X., Hartmann,D., Lagache, G., & Puget, J.-L. 1996, A&A, 312, 256
Boulanger, F., Abergel, A., Bernard, J.-P., Desert, F.-X., Lagache, G., Puget, J.-L.,Burton, W. B., & Hartmann, D. 1995, in Unveiling the Cosmic Infrared Back-ground, ed. E. Dwek (Woodbury: AIP), 87
Brodd, S., Fixsen, D. J., Jensen, K. A., Mather, J. C., & Shafer, R. A. 1997,COBE Far Infrared Absolute Spectrophotometer (FIRAS) Explanatory Sup-plement (COBE Ref. Pub. 97-C; Greenbelt: NASA/GSFC), http:// lambda.gsfc.nasa.gov/product /cobe/firas_exsupv4.cfm
Deul, E. R., & Burton, W. B. 1993, in The Galactic Interstellar Medium, ed.D. Pfenniger & P. Bartholdi (Heidelberg: Springer), 79
Dole, H., et al. 2006, A&A, 451, 417Dwek, E., et al. 1997, ApJ, 475, 565Elvis, M., Lockman, F. J., & Fassnacht, C. 1994, ApJS, 95, 413Finkbeiner, D. P. 2003, ApJS, 146, 407Fixsen, D. J., Dwek, E., Mather, J. C., Bennett, C. L., & Shafer, R. A. 1998,ApJ, 508, 123
Gaustad, J. E., McCullough, P. R., Rosing, W., & Van Buren, D. 2001, PASP,113, 1326
Gillmon, K., & Shull, J. M. 2006, ApJ, 636, 908Gillmon, K., Shull, J. M., Tumlinson, J., & Danforth, C. 2006, ApJ, 636, 891Gorjian, V., Wright, E. L., & Chary, R. R. 2000, ApJ, 536, 550Haffner, L. M., Reynolds, R. J., & Tufte, S. L. 1999, ApJ, 523, 223Haffner, L. M., Reynolds, R. J., Tufte, S. L., Madsen, G. J., Jaehnig, K. P., &Percival, J. W. 2003, ApJS, 149, 405
Hartmann, D., & Burton, W. B. 1997, Atlas of Galactic Neutral Hydrogen(Cambridge: Cambridge Univ. Press)
Hartmann, D., Kalberla, P. M. W., Burton, W. B., & Mebold, U. 1996, A&AS,119, 115
Hartmann, D., Magnani, L., & Thaddeus, P. 1998, ApJ, 492, 205Hausen, N. R., Reynolds, R. J., Haffner, L.M., & Tufte, S. L. 2002, ApJ, 565, 1060
Hauser, M. G., & Dwek, E. 2001, ARA&A, 39, 249Hauser, M. G., et al. 1997, COBE Diffuse Infrared Background Experiment(DIRBE) Explanatory Supplement (COBE Ref. Pub. 95-A; Greenbelt:NASA/GSFC), http:// lambda.gsfc.nasa.gov/product /cobe/dirbe_exsup.cfm
———. 1998, ApJ, 508, 25Heiles, C., Haffner, L. M., & Reynolds, R. J. 1999, in ASP Conf. Ser. 168, NewPerspectives on the Interstellar Medium, ed. A. R. Taylor, T. L. Landecker, &G. Joncas (San Francisco: ASP), 211
Heiles, C., Haffner, L. M., Reynolds, R. J., & Tufte, S. L. 2000, ApJ, 536, 335Heiles, C., Reach, W. T., & Koo, B.-C. 1988, ApJ, 332, 313Howk, J. C., & Savage, B. D. 1999, ApJ, 517, 746Kashlinsky, A. 2005, Phys. Rep., 409, 361Kelsall, T., et al. 1998, ApJ, 508, 44Lagache, G., Abergel, A., Boulanger, F., Desert, F. X., & Puget, J.-L. 1999,A&A, 344, 322
Lagache, G., Haffner, L. M., Reynolds, R. J., & Tufte, S. L. 2000, A&A, 354,247
Lagache, G., Puget, J.-L., & Dole, H. 2005, ARA&A, 43, 727Lagache, G., et al. 2004, ApJS, 154, 112Lehner, N., Wakker, B. P., & Savage, B. D. 2004, ApJ, 615, 767Mather, J. C., Fixsen, D. J., & Shafer, R. A. 1993, Proc. SPIE, 2019, 168Press, W. H., Teukolsky, S. A., Vetterling, W. T., & Flannery, B. P. 1992,Numerical Recipes in FORTRAN (2nd ed.; Cambridge: Cambridge Univ.Press)
Puget, J.-L., et al. 1996, A&A, 308, L5Reach, W. T., Koo, B.-C., & Heiles, C. 1994, ApJ, 429, 672Reach, W. T., Wall, W. F., & Odegard, N. 1998, ApJ, 507, 507Reynolds, R. J. 1991a, in IAU Symp. 144, The Interstellar Disk-Halo Con-nection in Galaxies, ed. H. Bloemen (Dordrecht: Kluwer), 67
———. 1991b, ApJ, 372, L17———. 1992, ApJ, 392, L35———. 1993, in AIP Conf. Proc. 278, Back to the Galaxy, ed. S. S. Holt &F. Verter (New York: AIP), 156
Reynolds, R. J., Chaudhary, V., Madsen, G. J., & Haffner, L. M. 2005, AJ, 129,927
ODEGARD ET AL.24 Vol. 667
Reynolds, R. J., Haffner, L. M., & Tufte, S. L. 1999, ApJ, 525, L21Reynolds, R. J., Tufte, S. L., Kung, D. T., McCullough, P. R., & Heiles, C.1995, ApJ, 448, 715
Savage, B. D., & Sembach, K. R. 1996, ARA&A, 34, 279Schlegel, D. J., Finkbeiner, D. P., & Davis, M. 1998, ApJ, 500, 525Silverberg, R. F., Hauser, M. G., Boggess, N. W., Kelsall, T. J., Moseley, S. H.,& Murdock, T. L. 1993, Proc. SPIE, 2019, 180
Snowden, S. L., Hasinger, G., Jahoda, K., Lockman, F. J., McCammon, D., &Sanders, W. T. 1994, ApJ, 430, 601
Sodroski, T. J., Odegard, N., Arendt, R. G., Dwek, E., Weiland, J. L., Hauser,M. G., & Kelsall, T. 1997, ApJ, 480, 173
Spitzer, L. 1978, Physical Processes in the Interstellar Medium (New York:Wiley)
Stacy, J. G., Bertsch, D. L., Dame, T. M., Fichtel, C. E., Sreekumar, P., &Thaddeus, P. 1991, in Proc. 22nd Int. Cosmic Ray Conf. (Dublin), 141
Stark, A. A., Gammie, C. F., Wilson, R. W., Bally, J., Linke, R. A., Heiles, C.,& Hurwitz, M. 1992, ApJS, 79, 77
Wakker, B. P., & Boulanger, F. 1986, A&A, 170, 84Wright, E. L. 1998, ApJ, 496, 1———. 2004, NewA Rev., 48, 465Zagury, F., Jones, A., & Boulanger, F. 1998, in IAU Colloq. 166, The LocalBubble and Beyond, ed. D. Breitschwerdt, M. J. Freyberg, & J. Truemper(Berlin: Springer), 385
DETERMINING CIB WITH COBE DIRBE AND WHAM 25No. 1, 2007