determination of the drug–dna binding modes using fluorescence-based assays
TRANSCRIPT

Analytical Biochemistry 422 (2012) 66–73
Contents lists available at SciVerse ScienceDirect
Analytical Biochemistry
journal homepage: www.elsevier .com/locate /yabio
Determination of the drug–DNA binding modes using fluorescence-based assays
Alicia K. Williams, Sofia Cheliout Dasilva, Ankit Bhatta, Baibhav Rawal, Melinda Liu,Ekaterina A. Korobkova ⇑Department of Science, John Jay College of Criminal Justice, City University of New York, 445 W 59th St., NY 10019, USA
a r t i c l e i n f o
Article history:Received 2 July 2011Received in revised form 12 December 2011Accepted 29 December 2011Available online 8 January 2012
Keywords:Nucleic acidDrug–DNA interactionFluorescenceIntercalationMinor grooveTricyclic antidepressantsAntiprotozoal drug and antibioticFood colorants
0003-2697/$ - see front matter Published by Elsevierdoi:10.1016/j.ab.2011.12.041
⇑ Corresponding author. Fax: +1 212 237 8318.E-mail address: [email protected] (E.A. Ko
1 Abbreviations used: NMR, nuclear magnetic resonandiamidino-2-phenylindole; EDTA, ethylenediaminetetr
a b s t r a c t
Therapeutic drugs and environmental pollutants may exhibit high reactivity toward DNA bases and back-bone. Understanding the mechanisms of drug–DNA binding is crucial for predicting their potential geno-toxicity. We developed a fluorescence analytical method for the determination of the preferential bindingmode for drug–DNA interactions. Two nucleic acid dyes were employed in the method: TO-PRO-3 iodide(TP3) and 40 ,6-diamidino-2-phenylindole (DAPI). TP3 binds DNA by intercalation, whereas DAPI exhibitsminor groove binding. Both dyes exhibit significant fluorescence magnification on binding to DNA. Weevaluated the DNA binding constant, Kb, for each dye. We also performed fluorescence quenching exper-iments with 11 molecules of various structures and measured a C50 value for each compound. We deter-mined preferential binding modes for the aforementioned molecules and found that they bound to DNAconsistently, as indicated by other studies. The values of the likelihood of DNA intercalation were corre-lated with the partition coefficients of the molecules. In addition, we performed nuclear magnetic reso-nance (NMR) studies of the interactions with calf thymus DNA for the three molecules. The results wereconsistent with the fluorescence method described above. Thus, we conclude that the fluorescencemethod we developed provides a reliable determination of the likelihoods of the two different DNA bind-ing modes.
Published by Elsevier Inc.
Physicochemical properties of some antibiotics, antidepres-sants, and antiviral drugs favor strong interactions with macromol-ecules such as proteins, lipids, and DNA. The overlap betweenelectronic clouds of aromatic molecules and purines or pirimidinesof double-stranded DNA leads to the stacking interactions. Electro-static interactions, van der Waals contacts with the helical chains,and contacts with the edges of the base pairs result in DNA groovebinding. A number of molecules exhibit combined intercalativeand groove DNA binding mechanisms. Determination of DNA bind-ing modes of small molecules is crucial for revealing their potentialgenotoxicity. Drug–DNA binding may result in changes in geneexpression and influence cell proliferation [1,2]. Thus, understand-ing drug–DNA binding mechanisms is crucial for predicting theconsequences of these interactions in the human body. Variousstrategies have been employed for the studies of DNA bindingmodes. These include X-ray analysis [3,4], nuclear magnetic reso-nance (NMR)1 studies [5–7], ion trap mass spectrometry [8], viscom-etry [4,7,9], circular dichroism [7,10,11], optical tweezers [12], singlemolecule force spectroscopy [13], footprinting [14], and calorimetry[7].
Inc.
robkova).ce; TP3, TO-PRO-3; DAPI, 40 ,6-aacetic acid.
In the current work, we have developed a simple and inexpen-sive method for the determination of the likelihood of intercalativeand minor groove DNA binding modes of small organic molecules.This method involves nucleic acid dyes. A series of cyanine dyespossess unique properties suitable for DNA binding studies. Thesedyes have low intrinsic fluorescence, large fluorescence enhance-ment on binding to DNA, and high affinity for nucleic acids. The nu-cleic acid dyes exhibit various DNA binding modes, includingintercalation, bis-intercalation, and groove binding. Some dyesshow base selectivity, whereas other dyes bind to DNA randomly.We performed fluorescence analysis of drug–DNA binding,employing two nucleic acid fluorescein dyes: TO-PRO-3 (TP3)and 40,6-diamidino-2-phenylindole (DAPI) (Fig. 1). TP3 has beenused intensively in various biochemical and biological assays suchas nuclear counterstaining [15] and the detection of drugs and pes-ticides [16]. DAPI has proven to be a very efficient nucleic acid stainin studies of the organization of chromatin in eukaryotes [17].
In the current study, 11 molecules—netropsin, imipramine, con-go red, berenil, pyrocatechol violet, janus green B, sunset yellowFCF, tartrazine, new coccine, amaranth, and brilliant blue G—wereanalyzed in regard to DNA binding modes (Fig. 2). Netropsin is anantibiotic that also exhibits antiviral activity. Berenil is an antipro-tozoal drug and is used in the treatment of inflectional diseases(e.g., trypanosomiasis, babesiasis). Imipramine is often used forthe treatment of nocturnal enuresis in children [18] and was

Fig.1. Structures of the fluorescein nucleic acid dyes: TO-PRO-3 (TP3) and 40 ,6-diamidino-2-phenylindole (DAPI).
Fluorescence-based assays for drug–DNA binding / A.K. Williams et al. / Anal. Biochem. 422 (2012) 66–73 67
proven to be genotoxic [18,19]. Congo red and janus green B areemployed in histology as staining agents. Janus green B is also usedas an indicator of oxygen. Pyrocatechol is employed as a photomet-ric indicator for earth metals and heavy metals. New coccine, tar-trazine, and sunset yellow FCF are used as food colorants.Amaranth was previously used as a food and cosmetic colorant.It is currently considered to be a carcinogen. Brilliant blue G is usedas a protein stain in gel electrophoresis. A novel method of fluores-cence data analysis is proposed for the determination of drug–DNApreferential binding modes. The results obtained for several mole-cules were confirmed with NMR. A relationship between the struc-ture and the intercalative potency of the molecules is discussed.
Materials and methods
Chemicals and materials
Netropsin dihydrochloride from Streptomyces netropsis anddiminazene aceturate (berenil) were purchased from Sigma–Al-drich (St. Louis, MO, USA). Congo red, pyrocatechol violet, andjanus green B were purchased from MP Biomedicals (Solon, OH,USA). New coccine, amaranth, and brilliant blue G were purchasedfrom Acros Organics (Morris Plains, NJ, USA). Sunset yellow FCFwas purchased from TCI (Portland, OR, USA). Tartrazine waspurchased from Alfa Aesar (Heysham, UK). TP3 iodide 1-mM solu-tion in dimethyl sulfoxide (DMSO) and DAPI (dihydrochloride)were purchased from Invitrogen (Eugene, OR, USA). D2O (99.9%purity) was purchased from Cambridge Isotope Laboratories(Andover, MA, USA).
DNA sonication and purification
DNA sonication was performed with a Fisher Scientific model4C15 sonicator in a Tris–HCl buffer (pH 8.0) containing 10 mM Tris,1 mM ethylenediaminetetraacetic acid (EDTA), and 0.5 M NaCl. Thesonication was conducted 12 times for 30 s with 90 s waiting in be-tween the pulses. The tube was replaced on ice after each intervalof 3 pulses. After sonication, DNA was filtered, extracted with aphenol/chloroform/isoamyl alcohol (PCI) mixture, precipitatedwith ethanol and NaOAc (0.1 M), and dialyzed in an acetate buffer(pH 5.0) containing 2 mM NaOAc, 9.3 mM NaCl, and 0.1 mMNa2EDTA.
Dye–DNA titration
The measurements were performed with a Varian Cary Eclipsefluorimeter (200–900 nm, Agilent Technologies) in 4-ml plastic
cuvettes. A 3-ml solution of 1 lM of a dye was prepared in acetatebuffer (pH 5.0). Fluorescence was measured at each new aliquot ofthe sonicated calf thymus DNA solution added to the solution ofthe dye. After subtracting the value of the baseline (buffer alone),the fluorescence value, F, at kmax = 660 nm for TP3 andkmax = 461 nm for DAPI was corrected for dilutions as follows:
FðcorrÞ ¼ F � ð3000þ xÞ=3000; ð1Þ
where 3000 is a mixture volume (in microliters, ll) before the addi-tion of DNA, x is the volume of the added DNA solution (in microli-ters), and F(corr) is a corrected fluorescence value.
Fluorescence measurements corrected for dilution were ana-lyzed using a Scatchard plot as described by Healy [20]. Briefly, aquantity f was introduced, representing a fraction of TP3 or DAPIbound to DNA:
f ¼ ðFðcorrÞ � FD=ðFmaxðcorrÞ � FDÞ; ð2Þ
where FD is a fluorescence of a free dye (TP3 or DAPI) and Fmax(corr) isa maximum value of the corrected fluorescence attained at thehighest concentration of DNA.
For the final data fitting, a Scatchard equation was used:
½DNA�=f ¼ ðN=KbÞ � ð1� f Þ�1 þ N � ½Dye�; ð3Þ
where [DNA] is the concentration of calf thymus DNA [in M(bp)], Kb
is the dye–DNA binding constant, N is the number of base pairs permolecule of dye, and [Dye] is the total concentration of TP3 or DAPI.[DNA]/f was plotted against (1 � f)–1, and a linear least squaresanalysis was performed to determine the values and the errors ofthe slope and the intercept. Kb and N were derived from the slopeand the intercept, and the standard deviations were calculatedusing a formula of the standard deviation of quotient. In a TP3 Scat-chard plot, the concentration of DNA varied between 5.3 and 19 lM(bp), whereas the maximum fluorescence (Fmax in Eq. (2)) was mea-sured at [DNA] = 0.46 mM. In a DAPI Scatchard plot, the range ofDNA concentrations was 4.9 to 14 lM (bp) and the highest DNAconcentration was 0.24 mM.
The concentrations of the dyes were measured by spectrometryusing the extinction coefficients of 110,000 M–1 cm–1 at 631 nm forTP3 [21] and 27,000 M–1 cm–1 at 342 nm for DAPI [22]. DNA con-centration was measured with the extinction coefficient of12,824 M(bp)–1 cm–1 [23]. The concentrations of the experimentalmolecules were determined using the extinction coefficients of2.15 � 104 M–1 cm–1 at 296 nm for netropsin [24], 25.5 ml mg–
1 cm–1 at 250 nm for imipramine [25], 2.33 � 104 M–1 cm–1 at442 nm for pyrocatechol violet [26], 3.15 � 104 M–1 cm–1 at505 nm for congo red [26], 22,660 M–1 cm–1 at 410 nm for tartra-zine [27], 3.50 � 104 M–1 cm–1 at 650 nm (acetone) for janus greenB [26], 2.50 � 104 M–1 cm–1 at 505 nm for allura red [28],2.26 � 104 M–1 cm–1 at 520 nm for amaranth [29], 2.76 � 104 M–
1 cm–1 nm for new coccine [30], 25,100 M–1 cm–1 at 485 nm forsunset yellow [31], and 36,700 M–1 cm–1 at 370 nm for berenil [7].
Nucleic acid dye fluorescence quenching assays
A drug solution was added in 1- to 10-ll aliquots to a solutionof 20 lM sonicated calf thymus DNA and 2 lM dye in 3 ml of ace-tate buffer (pH 5.0). A fluorescence spectrum was recorded at eachaddition of the drug, and the intensity was noted at kem. The baselevel (buffer) was subtracted from each fluorescence measurementat kem. This value was then divided by the maximal fluorescence(dye and DNA only). The data were plotted against the concentra-tion of each drug, and the C50 value of each was determined. C50 isthe concentration of a drug at 50% fluorescence quenching of

Fig.2. Structures of the experimental molecules.
68 Fluorescence-based assays for drug–DNA binding / A.K. Williams et al. / Anal. Biochem. 422 (2012) 66–73
DNA-bound dye. All fluorescence measurements were performedat 25 �C.
NMR
Proton spectra were obtained on a JEOL ECX 300-MHz spec-trometer. Samples (800 ll) contained 0.5 mM imipramine,0.5 mM pyrocatechol violet, or 0.3 mM janus green B and differentamounts of sonicated calf thymus DNA in D2O. The spectra wererecorded in 5-mm NMR tubes.
Safety considerations
TP3, DAPI, and most experimental compounds are potentiallygenotoxic given that they exhibit a significant affinity to DNA. Allexperiments need to be performed while wearing gloves.
Results and discussion
Two fluorescein dyes, TP3 and DAPI (Fig. 1), were employedin the development of a fluorescence assay. TP3 is a DNA inter-
calating blue dye (Fig. 1) [21]. Interactions of TP3 with DNAwere studied previously with visible diode laser-induced detec-tion [21] and hole-burning studies [32]. When bound to double-stranded DNA, the maximum emission is observed at 661 nmand the excitation wavelength is 642 nm [33]. Free moleculeexhibits very low fluorescence; however, when bound to DNAin a molar ratio of 1:20, fluorescence signal magnifies approxi-mately 100 times (Fig. 3A, inset). DAPI is a classical minorgroove binding molecule [10,11]. It is also shown to bind spe-cifically to GC regions by intercalation [6]; however, the minorbinding to AT regions is 2 orders of magnitude stronger thanthe intercalative binding mode [10]. The fluorescence of DAPI(kex = 358 nm, kem = 461 nm) [34] increases approximately 30times when 20-fold excess (bp) of DNA is added to the solutionof the dye (Fig. 3B, inset).
Dye–DNA binding constants were determined, and fluorescencequenching experiments of the DNA-bound fluorescein dyes wereconducted with 12 experimental molecules (Fig. 2). We proposeda new method of the analysis of the fluorescence data obtainedin the two experiments that allowed us to determine preferentialDNA binding modes of the molecules.

Fig.3. Scatchard plots for nucleic acid dyes–DNA binding derived from fluorescence measurements. Black dots represent experimental data, and red lines are fitting curves.[DNA]/f is plotted versus (1 � f)–1, where [DNA] is the concentration of the sonicated calf thymus DNA (in M per base pair) and f = (F(corr) � FD)/(Fmax(corr) � FD) as defined inMaterials and methods. (A) TP3–DNA Scatchard plot. The concentration of TP3 was 0.75 lM, and the concentration of DNA on the plot varied between 5.3 and 19 lM (bp).Inset: black line, fluorescence spectrum of TP3 alone; red line, fluorescence spectrum of the solution containing 0.75 lM TP3 and 14 lM calf thymus DNA; kex = 642 nm andkem = 661 nm. (B) DAPI–DNA Scatchard plot. The concentration of DAPI was 0.75 lM, and the range of DNA concentrations on the plot was 4.9 to 14 lM (bp). Inset: black line,fluorescence spectrum of DAPI alone; red line, fluorescence spectrum of the solution containing 0.75 lM DAPI and 14 lM calf thymus DNA; kex = 358 nm and kem = 461 nm.a.u., arbitrary units. (For interpretation of the references to color in this figure legend, the reader is referred to the Web version of this article.).
Fluorescence-based assays for drug–DNA binding / A.K. Williams et al. / Anal. Biochem. 422 (2012) 66–73 69
Determination of the dye–DNA binding constants
Dye–DNA titration measurements were performed for the twodyes shown in Fig. 1. The concentration of each dye was kept con-stant, and the concentration of calf thymus DNA was varied as thefluorescence spectra were recorded (Fig. 3). Scatchard analysis wasapplied to the fluorescence data collected from the solution of TP3with DNA (Fig. 3A) and DAPI with DNA (Fig. 3B). The parameters ofthe TP3–DNA complex formation were found to be as follows:log[Kb] = 5.99 ± 0.045 and N = 6.5 ± 0.8 (based on three Scatchardplots). The characteristics of the DAPI–DNA binding were foundto be as follows: log[Kb] = 6.29 ± 0.43 and N = 7.4 ± 2.0 (based onfive Scatchard plots). Here, Kb represents the dye–DNA bindingconstants and N is the number of base pairs on DNA per one dyemolecule.
Fluorescence quenching assays
Fluorescence quenching assays were performed by adding anexperimental compound (Fig. 2) to a solution containing DNAand a dye. As the dyes exhibit essential fluorescence enhancementon DNA binding, the displacement of the dyes from DNA caused bya compound leads to fluorescence depletion. The fluorescencespectra were recorded as the aliquots of a particular compoundwere added to the solution of DNA and TP3 or DAPI. Fig. 4 showsfluorescence quenching data performed with all experimental mol-ecules. Control fluorescence measurements of the mixtures con-taining the experimental compounds with and without DNAshowed no fluorescence at the wavelengths used for DAPI andTP3. For some molecules, the addition of the small aliquots led tothe initial slight fluorescence enhancement. This effect could be ex-plained by the changes in the value of the Frank–Condon factor,which governs the intensity of the fluorescence transitions. Partialelectronic overlap among the experimental molecules, such as con-go red, sunset yellow, amaranth, and new coccine with TP3 or withTP3–DNA complex, may lead to the partial stabilization of theground state complex and an increase in the value of the Frank–Condon factor at the same wavelength because the Frank–Condonfactor is defined by the overlap of the vibrational wavefunctions inthe upper and lower electronic states of the system. The concept isillustrated in Fig. 5. The addition of the greater amounts of theaforementioned molecules led to fluorescence quenching (Fig. 4)that was due to the displacement of TP3 from the DNA helix.
Estimating a relative affinity and a binding mode
We proposed a coefficient of each drug’s relative affinity toDNA, R, which takes into account (i) how efficiently the drug dis-places the dye from DNA and (ii) how tightly the dye is bound toDNA. The relative affinity, R, was be presented as log[Kb]/C50. Wehypothesized that a drug more effectively displaces a dye thathas a similar DNA binding mechanism than a dye that has a differ-ent DNA binding mode. The ratio of the R coefficients (I/G) deter-mined with TP3 and DAPI represents contributions of the twobinding modes to the whole drug–DNA association mechanism.The values of I/G along with I% (the likelihood of the intercalativebinding mode) are summarized in Table 1.
In the case of netropsin and berenil, the values of the ratio, I/G,were found to be 0.020 and 0.31, respectively. indicating a prefer-ence for groove binding (Table 1). The ratio values, I/G, determinedfor imipramine and congo red were 1.1 and 3.3, respectively, indi-cating a preference for intercalation rather than for groove binding(Table 1). The fluorescence quenching experiments conducted withnetropsin, imipramine, congo red, and berenil are shown in Fig. 4(graphs 1, 2, 3, and 4, respectively).
The minor groove binding mode for netropsin has been provenby NMR [5] and X-ray [3] experiments. The studies showed thatthe drug does not intercalate between DNA bases, which is sup-ported by the values of the percentage binding contributions:98% for groove binding and only 2% for intercalation (Table 1).The netropsin molecule has a lot of torsional freedom that allowsthe molecule to twist and adopt a configuration of a minor groove.
Berenil is known as a minor groove binding agent, as was dem-onstrated by NMR studies [35]. However, Pilch and coworkers usedspectroscopic, calorimetric, and hydrodynamic techniques to showthat this drug also exhibits an intercalative binding mode [7]. Ourresults suggest that the intercalative binding mode of berenil con-stitutes 24% to the overall binding mechanism (Table 1). Berenilalso has some torsional freedom aiding in minor groove binding;however, the motifs combining the benzene ring with the adjacentnitrogen atoms and conjugated double bonds probably strengthenthe insertion complexes between the molecule and DNA bases.
Snyder and Arnone performed bleomycin assays in which theyshowed that imipramine enhances bleomycin-induced micronu-cleus formation [36]. Intercalation of DNA was also proven by athree-dimensional computational DNA docking model [37]. Imip-ramine exhibited 53% intercalation of the entire binding (Table 1).
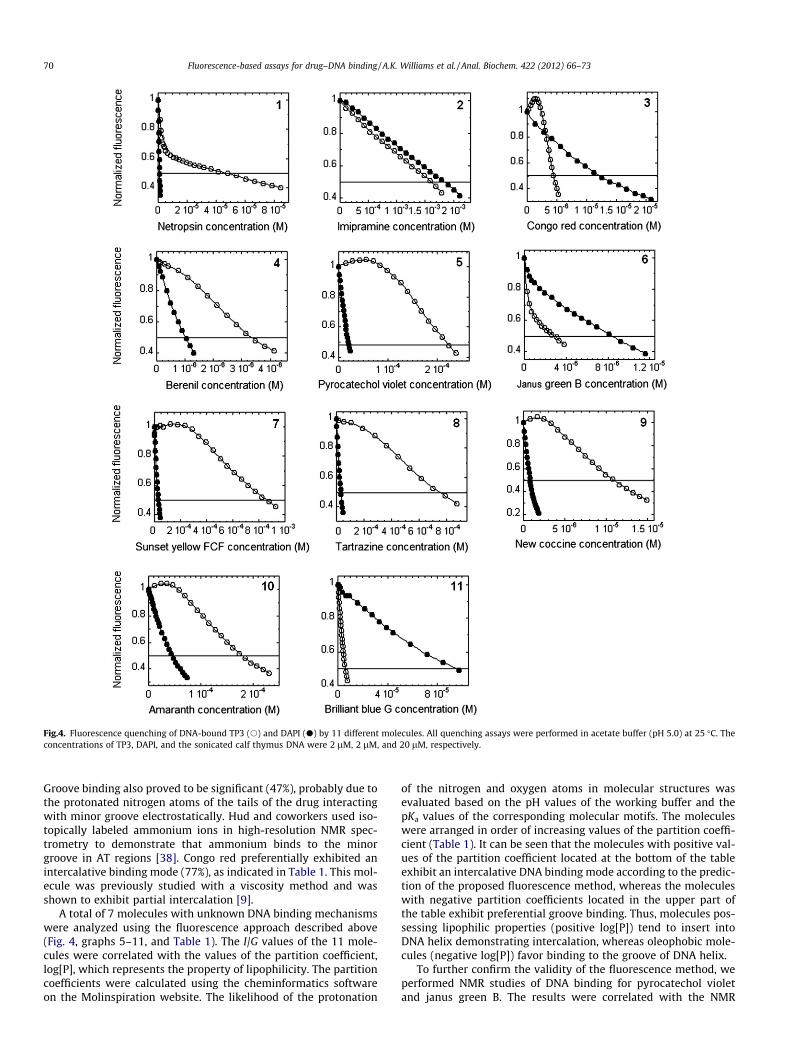
Fig.4. Fluorescence quenching of DNA-bound TP3 (s) and DAPI (d) by 11 different molecules. All quenching assays were performed in acetate buffer (pH 5.0) at 25 �C. Theconcentrations of TP3, DAPI, and the sonicated calf thymus DNA were 2 lM, 2 lM, and 20 lM, respectively.
70 Fluorescence-based assays for drug–DNA binding / A.K. Williams et al. / Anal. Biochem. 422 (2012) 66–73
Groove binding also proved to be significant (47%), probably due tothe protonated nitrogen atoms of the tails of the drug interactingwith minor groove electrostatically. Hud and coworkers used iso-topically labeled ammonium ions in high-resolution NMR spec-trometry to demonstrate that ammonium binds to the minorgroove in AT regions [38]. Congo red preferentially exhibited anintercalative binding mode (77%), as indicated in Table 1. This mol-ecule was previously studied with a viscosity method and wasshown to exhibit partial intercalation [9].
A total of 7 molecules with unknown DNA binding mechanismswere analyzed using the fluorescence approach described above(Fig. 4, graphs 5–11, and Table 1). The I/G values of the 11 mole-cules were correlated with the values of the partition coefficient,log[P], which represents the property of lipophilicity. The partitioncoefficients were calculated using the cheminformatics softwareon the Molinspiration website. The likelihood of the protonation
of the nitrogen and oxygen atoms in molecular structures wasevaluated based on the pH values of the working buffer and thepKa values of the corresponding molecular motifs. The moleculeswere arranged in order of increasing values of the partition coeffi-cient (Table 1). It can be seen that the molecules with positive val-ues of the partition coefficient located at the bottom of the tableexhibit an intercalative DNA binding mode according to the predic-tion of the proposed fluorescence method, whereas the moleculeswith negative partition coefficients located in the upper part ofthe table exhibit preferential groove binding. Thus, molecules pos-sessing lipophilic properties (positive log[P]) tend to insert intoDNA helix demonstrating intercalation, whereas oleophobic mole-cules (negative log[P]) favor binding to the groove of DNA helix.
To further confirm the validity of the fluorescence method, weperformed NMR studies of DNA binding for pyrocatechol violetand janus green B. The results were correlated with the NMR

Fig.5. Schematic presentation of TP3 displacement from DNA helix followed by fluorescence quenching and corresponding energy diagrams. A quencher is congo red,pyrocatechol violet, sunset yellow, new coccine, or amaranth (see Fig. 4). (A) TP3 in a DNA-bound state. Fluorescence is observed due to the transition between electronicstates presented by Morse potential curves. The fluorescence intensity is proportional to the overlap of vibrational wavefunctions. (B) A quenching molecule approaches aTP3–DNA complex and forms an intermediate complex, which is temporarily more stable than the original TP3–DNA complex. The ground electronic state shifts left anddown, and as a result the overlap between the vibrational functions in the excited and ground electronic states increases due to the Frank–Condon principle, leading to theincrease in fluorescence signal. (C) Further addition of the quencher leads to the displacement of TP3 from the DNA helix and fluorescence depletion.
Table 1Probabilities of intercalative DNA binding mode and partition coefficients of 11experimental molecules.
Compound name Partition coefficient (log[P]) I/G I%
Netropsin �4.741 0.020 1.9Tartrazine �1.766 0.041 4.0Amaranth �1.611 0.270 21Pyrocatechol violet �1.533 0.086 7.9Berenil �1.434 0.310 24New coccine �0.425 0.068 6.4Sunset yellow FCF �0.265 0.032 3.1
Imipramine 1.022 1.1 53Brilliant blue G 2.971 15 94Congo red 3.899 3.3 77Janus green B 4.365 2.9 74
Note: I/G = RTP3/RDAPI, where Rdye = log[Kb(dye)]/C50. C50 is the concentration of anexperimental molecule at 50% fluorescence quenching of a bound dye. The units ofC50 are mol/L (M). The percentage contribution of the intercalative mode (I%) wasdetermined as I% = [1 + (I/G)–1]–1 � 100%.
Fig.6. NMR spectra in the aromatic proton region for imipramine at 0.5 mM andimipramine with different amounts of the sonicated calf thymus DNA in D2O. Thespectra were recorded with a JEOL ECX 300-MHz spectrometer.
Fluorescence-based assays for drug–DNA binding / A.K. Williams et al. / Anal. Biochem. 422 (2012) 66–73 71
studies of imipramine–DNA binding. We measured the NMR spec-tra of the solutions containing imipramine, janus green B, or pyro-catechol violet and different molar ratios of the sonicated calfthymus DNA. Fig. 6 shows aromatic proton regions of the NMRspectra recorded from the solutions of imipramine and the differ-ent concentrations of DNA. The molar ratios of imipramine andDNA base pairs are shown in the same figure. It can be seen thatas the concentration of DNA increased, the spectra became broaderand the chemical shift changed by an increment ranging between�0.5 and �0.4 ppm. The upfield proton shift and the correspondingline’s broadening are proven to be a signature of an intercalativebinding mode [4,6]. Fig. 7 shows NMR spectra recorded from thesolution of janus green and mixtures of janus green with differentamounts of DNA. It can be seen that the lines positioned at approx-imately 6.7 and 6.1 ppm shift upfield by nearly 0.1 ppm, indicatingan intercalative binding mode. In contrast to imipramine and janus

Fig.7. NMR spectra in the aromatic proton region for janus green at 0.3 mM and janus green with different amounts of the sonicated calf thymus DNA in D2O. The spectrawere recorded with a JEOL ECX 300-MHz spectrometer.
Fig.8. NMR spectra of 0.5 mM pyrocatechol violet and pyrocatechol violet with equimolar amounts of DNA, both in D2O. The spectra were recorded with a JEOL ECX 300-MHzspectrometer in 5-mm NMR tubes.
72 Fluorescence-based assays for drug–DNA binding / A.K. Williams et al. / Anal. Biochem. 422 (2012) 66–73
green, the proton lines of the NMR spectra of pyrocatechol violetdid not shift on the addition of DNA, as shown in Fig. 8. Thus, theNMR results are in agreement with the conclusions of the fluores-cence studies that revealed an intercalative DNA binding mode forimipramine and janus green and a minor groove binding mode forpyrocatechol violet.
The analysis of the NMR spectra further validated that the fluo-rescence technique involving nucleic acid fluorescein dyes provedto be experimentally accurate in the determination of the likeli-hoods of the drug–DNA preferential binding modes. The limita-tions of the method include the following factors. First, onlymolecules that exhibit significant DNA affinity, such that 50% fluo-rescence quenching is reached at concentrations not greater thanapproximately 1 to 5 mM, can be analyzed with the proposedmethod. Second, only molecules showing no fluorescence overlap-ping with the fluorescence spectra of DNA-bound TP3 and DAPI canbe studied using this strategy. Third, various phases occurring inthe dye displacement process are not considered in the analysis.
However, the method proves to be valuable as a quick and primarytool. The approach could be applied for predicting the genotoxic af-fects of a number of environmental pollutants. On the other hand,the developed strategy may be employed in selecting moleculeswith specific DNA binding properties to treat diseases.
Moreover, the discovered method has additional promisingapplications. The majority of small molecules, interacting withDNA by attaching to a minor groove, bind preferentially to AT re-gions [39]. Some bacteria, including inflectional microorganisms,possess genomes with high AT content [40,41]. The developedmethod can be employed to select molecules exhibiting an en-hanced potential for minor groove binding. These compoundscould be used for combating infections.
Lastly, DNA binding molecules may affect gene expression, DNAreplication, and the structural design of a nucleus [1,2]. Manipulat-ing changes in these processes is crucial in the treatment of variousdiseases. DNA binding proteins such as transcription factors, poly-merases, and histones exhibit different DNA binding specificity and
Fluorescence-based assays for drug–DNA binding / A.K. Williams et al. / Anal. Biochem. 422 (2012) 66–73 73
mechanisms. Thus, a lot of proteins, including tumor suppressorsand signal transduction and transcription proteins, exhibit exclu-sive DNA minor groove binding [42,43]. An accurate design of amolecule with certain likelihoods for minor groove and intercala-tive DNA binding may lead to the development of effective meth-ods for controlling gene activity and other cellular processes.
Acknowledgments
This work was sponsored by the PRISM program at John Jay Col-lege, a John Jay College Research Assistance Grant, and a PSC-CUNYResearch Grant. The authors cordially thank Nathan Lents andNikolay Azar for technical help and Zully Santiago for her help withthe manuscript. The authors also thank John Nemeth, Karry John-ston, Mikeisha Cadougan, and Catherine Chamnankool for assistingwith laboratory work.
References
[1] P.R. Turner, W.A. Denny, The genome as a drug target: sequence specific minorgroove binding ligands, Curr. Drug Targets 1 (2000) 1–14.
[2] M. Zihlif, D.R. Catchpoole, B.W. Stewart, L.P. Wakelin, Effects of DNA minorgroove binding agents on global gene expression, Cancer Genet. Proteomics 7(2010) 323–330.
[3] M.L. Kopka, C. Yoon, D. Goodsell, P. Pjura, R.E. Dickerson, The molecular originof DNA–drug specificity in netropsin and distamycin, Proc. Natl. Acad. Sci. USA82 (1985) 1376–1380.
[4] W.D. Wilson, L. Strekowski, F.A. Tanious, R.A. Watson, J.L. Mokrosz, A.Strekowska, G.D. Webster, S. Neidle, Binding of unfused aromatic cations toDNA: the influence of molecular twist on intercalation, J. Am. Chem. Soc. 110(1988) 8292–8299.
[5] D.J. Patel, Antibiotic–DNA interactions: intermolecular nuclear Overhausereffects in the netropsin–d(C-G-C-G-A-A-T-T-C-G-C-G) complex in solution,Proc. Natl. Acad. Sci. USA 79 (1982) 6424–6428.
[6] W.D. Wilson, F.A. Tanious, H.J. Barton, R.L. Jones, L. Strekowski, D.W. Boykin,Binding of 40 ,6-diamidino-2-phenylindole (DAPI) to GC and mixed sequencesin DNA: intercalation of a classical groove-binding molecule, J. Am. Chem. Soc.111 (1989) 5008–5010.
[7] D.S. Pilch, M.A. Kirolos, X. Liu, G.E. Plum, K.J. Breslauer, Berenil [1,3-bis(40-amidinophenyl)triazene] binding to DNA duplexes and to a RNA duplex:evidence for both intercalative and minor groove binding properties,Biochemistry 34 (1995) 9962–9976.
[8] K.W. Wan, T. Shibue, M.L. Gross, Non-covalent complexes between DNA-binding drugs and double-stranded oligodeoxynucleotides: a study by ESI ion-trap mass spectrometry, J. Am. Chem. Soc. 122 (2000) 300–307.
[9] H.-Z. Pan, X.-M. Wang, H.-B. Li, Q. Yang, L.-S. Ding, Interaction mode betweencongo red–Sm(III) complex and herring sperm DNA, J. Coord. Chem. 63 (2010)4347–4357.
[10] G. Manzini, M.L. Barcellona, M. Avitabile, F. Quadrifoglio, Interaction ofdiamidino-2-phenylindole (DAPI) with natural and synthetic nucleic acids,Nucleic Acids Res. 11 (1983) 8861–8876.
[11] M. Kubista, B. Aakerman, B. Norden, Characterization of interaction betweenDNA and 40 ,6-diamidino-2-phenylindole by optical spectroscopy,Biochemistry 26 (1987) 4545–4553.
[12] T. Paramanathan, F. Westerlund, M.J. McCauley, I. Rouzina, P. Lincoln, M.C.Williams, Mechanically manipulating the DNA threading intercalation rate, J.Am. Chem. Soc. 130 (2008) 3752–3753.
[13] R. Krautbauer, L.H. Pope, T.E. Schrader, S. Allen, H.E. Gaub, Discriminatingsmall molecule DNA binding modes by single molecule force spectroscopy,FEBS Lett. 510 (2002) 154–158.
[14] H. Kostrhunova, O. Vrana, T. Suchankova, Different features of the DNA bindingmode of antitumor cis-amminedichlorido(cyclohexylamine)platinum(II)(JM118) and cisplatin in vitro, Chem. Res. Toxicol. 23 (2010) 1833–1842.
[15] K. Bink, A. Walch, A. Feuchtinger, H. Eisenmann, P. Hutzler, H. Höfler, M.Werner, TO-PRO-3 is an optimal fluorescent dye for nuclear counterstaining indual-colour FISH on paraffin sections, Histochem. Cell Biol. 115 (2001) S293–299.
[16] B. Danielsson, I. Surugiu, A. Dzgoev, M. Mecklenburg, K. Ramanathan, Opticaldetection of pesticides and drugs based on chemiluminescence–fluorescenceassays, Anal. Chim. Acta 426 (2001) 227–234.
[17] D. Zink, N. Sadoni, E. Stelzer, Visualizing chromatin and chromosomes in livingcells, Methods 29 (2003) 42–50.
[18] R. Dungaros, T. Turkbay, I. Surer, F. Gok, M. Denli, V. Baltaci, DNA damage inchildren treated with imipramine for primary nocturnal enuresis, Pediatr. Int.44 (2002) 617–621.
[19] E.A. Korobkova, W. Ng, A. Vethatratnam, A.K. Williams, M. Nizamova, N. Azar,In vitro studies of DNA damage caused by tricyclic antidepressants: a role ofperoxidase in side effects of the drugs, Chem. Res. Toxicol. 23 (2010) 1497–1503.
[20] E.F. Healy, Quantitative determination of DNA–ligand binding usingfluorescence spectroscopy, J. Chem. Educ. 84 (2007) 1304–1307.
[21] S. Rampal, M.-S. Liu, F.-T.A. Chen, Characterization of TO-PRO-3 as anintercalator for double-stranded DNA analysis with red diode laser-inducedfluorescence detection, J. Chromatogr. A 781 (1997) 357–365.
[22] J. Kapuscinski, B. Skoczylas, Simple and rapid fluorimetric method for DNAmicroassay, Anal. Biochem. 83 (1977) 252–257.
[23] D. Suh, J.B. Chaires, Criteria for the mode of binding of DNA binding agents,Bioorg. Med. Chem. 3 (1995) 723–728.
[24] H.P. Spielmann, P.A. Fagan, T.M. Bregant, R.D. Little, D.E. Wemmer, The bindingmodes of a rationally designed photoactivated DNA nuclease determined byNMR, Nucleic Acids Res. 23 (1995) 1576–1583.
[25] H.A. Heck, N.W. Flynn, S.E. Buttrill Jr., R.L. Dyer, M. Anbar, Determination ofimipramine in plasma by high pressure liquid chromatography and fieldionization mass spectrometry: increased sensitivity in comparison with gaschromatography mass spectrometry, Biomed. Mass Spectrom. 5 (1978) 250–257.
[26] M.F. Barakat, K. El-Salamawy, M. El-Banna, M. Abdel-Hamid, A.A.-R. Taha,Radiation effects on some dyes in non-aqueous solvents and in somepolymeric films, Radiat. Phys. Chem. 61 (2001) 129–136.
[27] H. Waechter, D. Munzke, A. Jang, H.-P. Loock, Simultaneous and continuousmultiple wavelength absorption spectroscopy on nanoliter volumes based onfrequency–division multiplexing fiber-loop cavity ring-down spectroscopy,Anal. Chem. 83 (2011) 2719–2725.
[28] H. Kuhn, H.-D. Försterling, D. Hennessey Waldeck, Principles of PhysicalChemistry, John Wiley, New York, 2009.
[29] R. Russ, J. Rau, A. Stolz, The function of cytoplasmic flavin reductases in thereduction of azo dyes by bacteria, Appl. Environ. Microbiol. 66 (2000) 1429–1434.
[30] K.W. Ro, K. Lim, B.C. Shim, J.H. Hahn, Integrated light collimating system forextended optical-path-length absorbance detection in microchip-basedcapillary electrophoresis, Anal. Chem. 77 (2005) 5160–5166.
[31] N. Nikolaidis, C. Erkey, B.F. Smets (Eds.), Hazardous and Industrial Wastes:Proceedings of the Thirty-first Mid-Atlantic Industrial and Hazardous WasteConference, Environmental Engineering Program, University of Connecticut,Storrs, CT, 1999.
[32] N. Milanovich, M. Suh, R. Jankowiak, G.J. Small, J.M. Hayes, Binding of TO-PRO-3 and TOTO-3 to DNA: fluorescence and hole-burning studies, J. Phys. Chem.100 (1996) 9181–9186.
[33] Y. Liu, B. Danielsson, Fluorometric broad-range screening of compounds withaffinity for nucleic acids, Anal. Chem. 77 (2005) 2450–2454.
[34] R.P. Haugland, in: M.T.Z. Spence (Ed.), Handbook of Fluorescence Probes andResearch Chemicals, Molecular Probes, Eugene, OR, 1996, p. 153.
[35] A.N. Lane, T.C. Jenkins, T. Brown, S. Neidle, Interaction of berenil with the EcoRIdodecamer d(CGCGAATTCGCG)2 in solution studied by NMR, Biochemistry 30(1991) 1372–1385.
[36] R.D. Snyder, M.R. Arnone, Putative identification of functional interactionsbetween DNA intercalating agents and topoisomerase II using the V79 in vitromicronucleus assay, Mutat. Res. 503 (2002) 21–35.
[37] R.D. Snyder, D.E. Ewing, L.B. Hendry, Evaluation of DNA intercalation potentialof pharmaceuticals and other chemicals by cell-based and three-dimensionalcomputational approaches, Environ. Mol. Mutagen. 44 (2004) 163–173.
[38] N.V. Hud, V. Sklenár, J. Feigon, Localization of ammonium ions in the minorgroove of DNA duplexes in solution and the origin of DNA A-tract bending, J.Mol. Biol. 286 (1999) 651–660.
[39] G.M. Blackburn, M.J. Gait, D. Loakes, D. Williams (Eds.), Nucleic Acids Chem.Biol., Royal Society of Chemistry, Dorchester, UK, 2006. pp. 361–370.
[40] M.A. Worley, M.H. Ivey, D.C. Graves, Characterization and cloning ofPneumocystis carinii nucleic acid, J. Eukaryot. Microbiol. 36 (1989) 9S–11S.
[41] A. Nakabachi, A. Yamashita, H. Toh, H. Ishikawa, H.E. Dunbar, N.A. Moran, M.Hattori, The 160-kilobase genome of the bacterial endosymbiont Carsonella,Science 314 (2006) 267.
[42] Y. Cho, S. Gorina, P.D. Jeffrey, N.P. Pavletich, Crystal structure of a p53 tumorsuppressor–DNA complex: understanding tumorigenic mutations, Science 265(1994) 346–355.
[43] M.J. Rudolph, J.P. Gergen, DNA-binding by Ig-fold proteins, Nat. Struct. Biol. 8(2001) 384–386.