determination of monod kinetic coefficients for volatile hydrophobic organic compounds
TRANSCRIPT
Determination of Monod Kinetic Coefficients for Volatile Hydrophobic Organic Compounds
Saumyen Guha and Peter I?. Jaffe* Department of Civil Engineering and Operations Research, Princeton University, Princeton, New Jersey 08544
Received September 18, 7995/Accepted January 5, 1996
A new procedure is presented to determine Monod kinetic coefficients and the microbial yield coefficient for volatile hydrophobic compounds such as phenanthrene. Batch experiments were conducted with a mixed culture capa- ble of degrading phenanthrene. The phenanthrene disap- pearance and carbon dioxide production were monitored with time. A maximum likelihood estimator was formu- lated to fit the set of equations that describe the system to the measured data. The model takes into account a number of processes such as partition ontothe apparatus, volatilization, and partition onto the biomass. The param- eters required to describe these processes were obtained by independent experiments. The yield coefficient could be determined within a small range. However, the specific growth rate and the half-saturation constant were found to vary widely, with pairs of them describing the system adequately. It was shown that partition and volatilization processes can significantly affect the determination of the yield and Monod kinetic coefficients and need to be taken into account. 0 1996 John Wiley & Sons, Inc. Key words: batch reactor Monod kinetic coefficient parameter estimation phenanthrene *volatile hydropho- bic substrate
INTRODUCTION
Biodegradation kinetics of aromatic hydrocarbon com- pounds like benzoate:" phenol, and c h l ~ r o p h e n o l ' ~ ~ ' ~ can be described adequately using Monod kinetics or some variation of that formulation. The reported value of the coefficients often varies widely, depending on the type of culture (pure or mi~ed) ' " '~ and the initial substrate and biomass concentrations.20 The formula- tion of Monod kinetics, to describe the growth dynamics of mixed cultures in natural environments, has no theo- retical foundation. This is because Monod kinetics are based on Michaelis-Menten enzyme reaction kinetics, which assume a steady state in their formulation. A steady state is never achieved in a natural environment in nutrient- and carbon source- depleting situation^.^ Often more than one enzyme is responsible for carrying out the degradation of a complex substrate. More than one of these stages may be rate limiting. This reduces the Monod kinetic equation to a hyperbolic curve fitting equation with p, and K, being the fitting parameters.
* To whom all correspondence should be addressed
Therefore one often encounters errors in extrapolating the values of kinetic coefficients determined for a certain concentration range and microbial environment to a different concentration and environment.'
For a given concentration range and environmental condition, Monod kinetics are a useful tool for describ- ing biodegradation dynamics. A precise determination of the coefficients is required to achieve good predictive ability of the biodegradation dynamics. Determination of kinetic coefficients from batch reactor studies were described in detail for H,-limited batch growth of pure culture'' and phenol degradation by mixed culture." Both of these studies fit the substrate disappearance data to the Monod kinetic equation using a nonlinear regression. The latter requires the yield coefficient to be determined separately from biomass measurements.
Application of similar procedures to low solubility, volatile hydrophobic compounds poses two problems. The first is that for highly hydrophobic organic com- pounds, a significant portion of the contaminant will be sorbed by the experimental setup and biomass in the system. Failing to account for the partitioned fraction will lead to erroneous estimates of the specific growth rate and microbial yield coefficient. The second problem is that highly volatile compounds will have losses to the head space. The volatilized portion of the contaminant may be wrongly assigned to biodegradation, resulting in an erroneous value of the yield coefficient or specific growth rate. The effect will be more pronounced for low solubility compounds, because the fraction of total contaminant sorbed or volatilized will be higher. Given the need to assess the fate of low-solubility, sorbing organic compounds in the environment under nat- ural conditions and during enhanced bioremediation schemes, an accurate description of the biodegradation of such substances is needed. This cannot be achieved without a precise determination of the growth-kinetic coefficients.
This study addresses the above-mentioned problems by implementing a statistically rigorous approach to parameter estimation, incorporating partition and vola- tilization processes in the equations describing the bio- degradation dynamics, and fitting carbon dioxide pro-
Biotechnology and Bioengineering, Vol. 50, Pp. 693-699 (1996) 0 1996 John Wiley & Sons, Inc. CCC 0006-3592/96/060693-07
duction in addition to substrate disappearance to the system of equations.
MATERIALS AND METHODS
Materials and Analytical Procedure
Biomass
A mixed enrichment culture was used, which had been isolated from a petroleum contaminated soil sample." This culture was capable of using phenanthrene as a sole carbon source and was maintained in the laboratory by replacing periodically a fraction of the mixed liquor with a fresh solution containing phenanthrene and nutri- ents [biochemical oxygen demand (BOD) dilution wa- ter]. For the biodegradation experiments, a part of the mixed liquor in the late exponential growth phase was centrifuged, resuspended in the nutrient solution, and starved for 72 h to minimize carryover of phenanthrene along with the seed.
Con tam inan t
Because phenanthrene has a low aqueous solubility, volatilizes rapidly from the aqueous phase,17 and is eas- ily biodegraded in the presence of an appropriate micro- bial population, it was selected as a model polycyclic aromatic hydrocarbon (PAH) compound. Its aqueous solubility at 25°C is 1.29 2 0.07 mg/L.'' 14C-labeled phenanthrene was mixed with nonlabeled phenanthrene to obtain a desired radioactivity in the solution. Radio- activity was analyzed in a Pacard 1900TR Liquid Scintil- lation Counter using Fisher Scientific Scintiverse BD scintillation cocktail.
Biomass was quantified as total organic carbon (TOC) in a Coulometrics TOC-TC analyzer. Liquid samples were oxidized at 900°C in a pure oxygen environment in the presence of a barium chromate combustion catalyst/ scrubber. The carbon dioxide produced was measured in a COz coulometer.' The TOC of the biomass was calculated from the difference between the bulk sample and the filtered (0.2 pm) sample.
Volatilization Dynamics
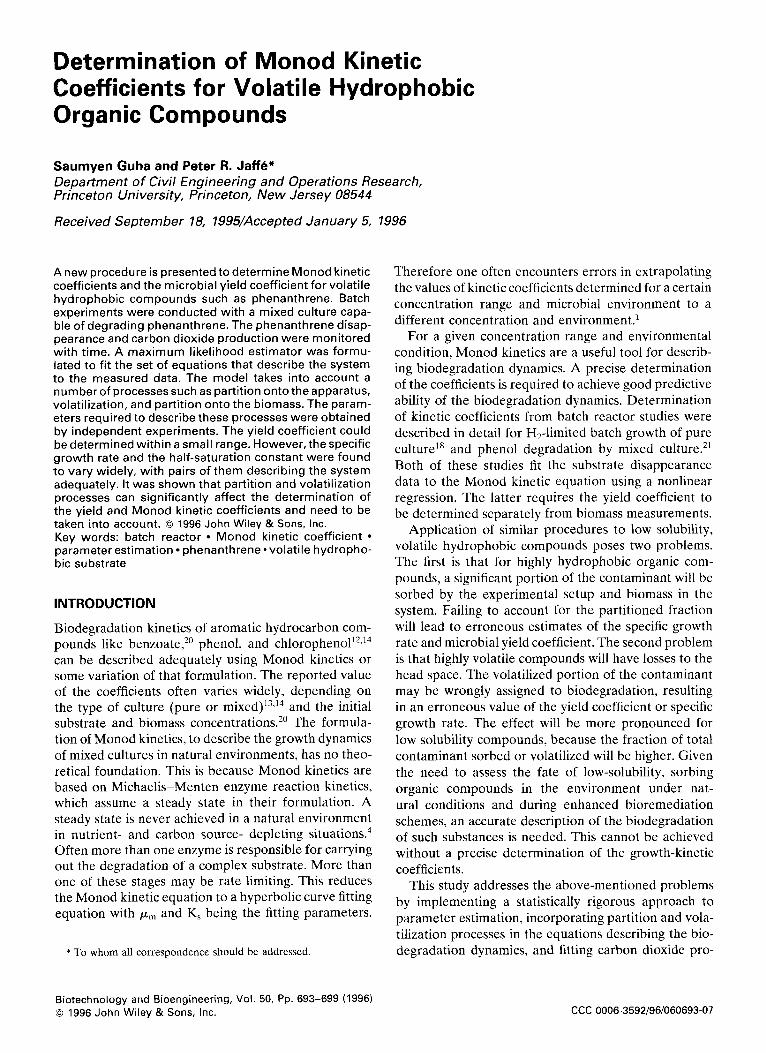
Equilibrium between the dissolved phase and head space is reached through volatilization, followed by par- titioning onto the surfaces adjacent to the headspace (Fig. 1). To describe the dynamics of this process, a series of flasks were set up, each containing a 15-mL phenanthrene solution of known radioactivity and con- centration. The flasks were sampled after varying incu- bation times to quantify the phenanthrene remaining in the solution. After sampling, the flasks were discarded.
Sorption of Phenanthrene onto Biomass
A stock solution of radiolabeled phenanthrene in BOD dilution water, with an initial concentration near its solu- bility limit and a known initial radioactivity, was pre- pared. A series of 15-mL centrifuge tubes were set up with varying amounts of biomass in them. A fixed amount of stock solution was pipetted into each of the centrifuge tubes to make up a total volume of 10 mL. A second set was prepared with the same amount of biomass but a different concentration of phenanthrene. Each of the above sets was prepared in duplicate. Blanks without biomass were prepared for each of the sets. After capping the tubes, they were placed into a rotary shaker at 20°C for 15 min. At the end of the incubation time the tubes were centrifuged at -600g for 15 min. The supernatant from each tube was analyzed for radio- activity to quantify the concentration of phenanthrene in solution and determine the sorbed phenanthrene by the difference between the sample and the blank.
Biodegradation Experiments
These experiments were conducted in 25-mL reaction vessels that contain in their headspace a cup in which the C02 that evolves during the biodegradation can be absorbed into a KOH solution (Fig. 1). Rubber stoppers were lined with aluminum foil to minimize losses due to sorption from the headspace. A stock solution of
Rubber Stopper lined with
Aluminium Foil
Sorption onto the Apparatus
These experiments were required for a proper correc- tion of the overall mass of phenanthrene in the system, based on measurements of the dissolved-phase phenan- threne. Fifteen milliliters of phenanthrene solution of varying concentrations were added to each flask and stirred for 5 min. Concentration of phenanthrene was then analyzed. The sorption of nonionic phenanthrene onto the inorganic glassware surface was assumed to be instantaneous.
Teflon Stir Bar
Figure 1. Batch experimental setup for the biodegradation experi- ments.
694 BIOTECHNOLOGY AND BIOENGINEERING, VOL. 50, NO. 6, JUNE 20, 1996
phenanthrene was prepared in BOD dilution water. The total phenanthrene concentration in the experiments was 0.863 mg/L, which is less than the solubility of phen- anthrene in water. A low contaminant to biomass ratio was used to get an estimate of the kinetic parameters that were more representative of the existing condition of the culture.' A total reactant volume of 15 mL con- taining phenanthrene, seed, and nutrient (BOD dilution water) was placed in a reaction vessel. A volume of 0.25 mL of 1N KOH was placed in the KOH cup.
Reaction vessels were sealed and placed on a mag- netic stirrer to mix the reactant continuously. At the end of the desired reaction time, concentrated sulfuric acid was introduced into the vessels through the side arm to stop the reaction and to release any dissolved carbon dioxide from the aqueous solution. After an additional 4 to 6 h period, samples from the KOH cups were analyzed for radioactivity to determine the amount of carbon dioxide produced. Samples from the reaction chambers were centrifuged at -600g for 15 min and passed through 0.2-pm inorganic syringe filters to sepa- rate the biomass. To minimize sorption losses of phenanthrene in the filters, the syringe filters were preequilibrated with the solution from the reaction chamber by filtering 3 mL of the solution. After this pre-equilibration, 0.5 mL of samples were filtered in duplicate, and the radioactivity of the samples was mea- sured to obtain the disappearance of phenanthrene. A series of blanks without biomass were run to quantify any possible solubilization of the volatilized phenan- threne into the KOH solution. No detectable loss was found due to this redistribution of phenanthrene.
THEORY Partition of the phenanthrene onto the apparatus and biomass is described by linear isotherms as described below. Apparatus is
c, = Kdgc (1) where C, is phenanthrene concentration on the glass (expressed as equivalent phenanthrene concentration in solution), mg/L; C is phenanthrene concentration dis- solved in water, mg/L; and Kdg is partition coefficient, dimensionless.
Biomass is
Cbrm = ko,C (2) where cb,, is phenanthrene sorbed to biomass, mg/mg; C is phenanthrene dissolved in water, mg/L; and k,, is the partition coefficient (organic carbon), L/mg.
Volatilization is described by a kinetic formulation as described by Cho and Jaffi7:
(4)
where K,, is mass transfer rate coefficient between the water phase and head space per hour; KH* is coefficient describing the equilibrium between the headspace and water;f,,f' is fractional volume of water and head space; and C,C, is concentration in water and head space.
Expressing the biodegradation in terms of the Monod kinetics results in the following set of equations that describe the experimental system;
(7)
d[Co2] = (!+)Kx + ( y ) h X , 1 - Y (8) K, + C dt
where C is contaminant concentration, mg/L; X is bio- mass concentration, mg/L; C 0 2 is carbon dioxide con- centration, mg/L; X , is radioactive biomass concentra- tion, mg/L; pm is maximum specific growth rate per hour; K, is half saturation constant, mg/L; b is first-order endogenous respiration coefficient, per hour; and Y is yield coefficient, dimensionless.
C, X , X,, and C02 above are expressed as carbon. The experiments were seeded with nonradioactive biomass. Because the contaminant in the system was radiola- beled, there was some production and decay of radioac- tive biomass during the period of the experiments. The amount of radioactive biomass was resolved at each time step during the numerical solution with the help of the growth term of Equation (7) and endogenous respiration of the radioactive fraction of the biomass. The contribution of the endogenous respiration to the 14C02 production was also accounted for. In the absence of any substrate in the solution, Equation (7) reduces to a simple first-order decay equation. The coefficient b was determined separately from an experiment con- ducted with biomass undergoing endogenous respi- ration.
In Equations (5)-(8) the only unknowns are the three biological parameters, pm, K,, and Y. For given values of these three parameters, the system of equations can be solved numerically for C and C02. We define e, = - C and eco2 = e02 - C02 as the residuals, which
are the differences between the observed and computed values, respectively. An optimization problem can be formulated for estimating pm, K,, and Y, based on the following assumptions:
1. Residuals in the values of C and C02 are normally
2. Residuals in individual experiments are independent. distributed.
GUHA AND JAFFE: VOLATILE HYDROPHOBIC ORGANIC COMPOUNDS 695

3. All the experiments have the same covariance matrix
A maximum likelihood equation can then be stated as3
minimize f (0 ) = -log[det M ( e ) ] ,
for the distribution of residuals.
n 2
subject to 0 = (9)
where rz is number of observations and M ( 0 ) is moment matrix of the residuals given by
Computed values of C and C 0 2 were obtained by solv- ing Equations (5)-(8).
The above nonlinear dynamic programming prob- lem was solved using a variable metric method, the Broyden-Fletcher-Shanno a l g ~ r i t h m . ~ ~ ' ~ . ' ~ Cubic itera- tion was employed for line search. Euler backward time stepping in conjunction with the Picard iteration scheme were used to solve the system of equations.
RESULTS AND DISCUSSION
Partition and Volatilization
The partition isotherm between the phenanthrene in solution and the apparatus is shown in Figure 2. The value of the partition coefficient (Kdg) remained con- stant (0.2384) over the concentration range of interest.
The simulation and measured volatilization from the reactor flasks is shown in Figure 3. For these simulations, the value for Kdg obtained above was used. The mass transfer rate coefficient, K,, has a value of 0.03/h, which is less than the rate of volatilization of phenanthrene from the water phase for a similar, noncapped system
\ Kdg= 0.2384 / P2 = 0.9745
T
0.0 0.2 0.4 0.6 0.8
Concentration in Solution, mg/l
Sorption isotherm on experimental setup. Figure 2.
Kwg K:-i] = 0.03 /hr
a . .
0 5 10 15 20
Time, hours
Figure 3. of the experimental setup.
Volatilization equilibria of the reactant with the head space
(-9.0/h.9 The equilibrium parameter KH* has a much higher value (0.48) than Henry's law constant for phen- anthrene (0.006).9 This is because it also accounts for the partitioning onto the KOH cup and the seals of the headspace.
The sorption isotherm of phenanthrene onto the bio- mass is shown in Figure 4. The normalized partition coefficient (Koc) with respect to the organic carbon con- tent was found to be 1.37 X lo-' L/mg. The partition coefficient for sorption of phenanthrene onto soil or- ganic carbon ranges from 0.52 X lo-' to 2.29 X lo-, L/ mg.16 This shows that the biomass in the reactor is capa- ble of sorbing a fraction of the substrate, which if not properly accounted for can impart a significant error to the determination of the Monod kinetic coefficients.
Endogenous Respiration
An experiment was conducted in which biomass was aerated in the absence of a growth substrate to deter- mine the endogenous respiration coefficient. The results
Koc= 0.0137 I/mg rA2 = 0.9935
/
- Koc= 0.0137 I/mg
rA2 = 0.9935
0.0 0.2 0.4 0.6
mg/l of Phenanthrene in Solution
Sorption isotherm of phenanthrene on biomass (phenan- Figure 4. threne and biomass expressed as carbon).
696 BIOTECHNOLOGY AND BIOENGINEERING, VOL. 50, NO. 6, JUNE 20, 1996
4 b =0.0016 /hour
0 m i '----------....
0 1
, I -1-
0 100 200 300 400
Tirne.hours
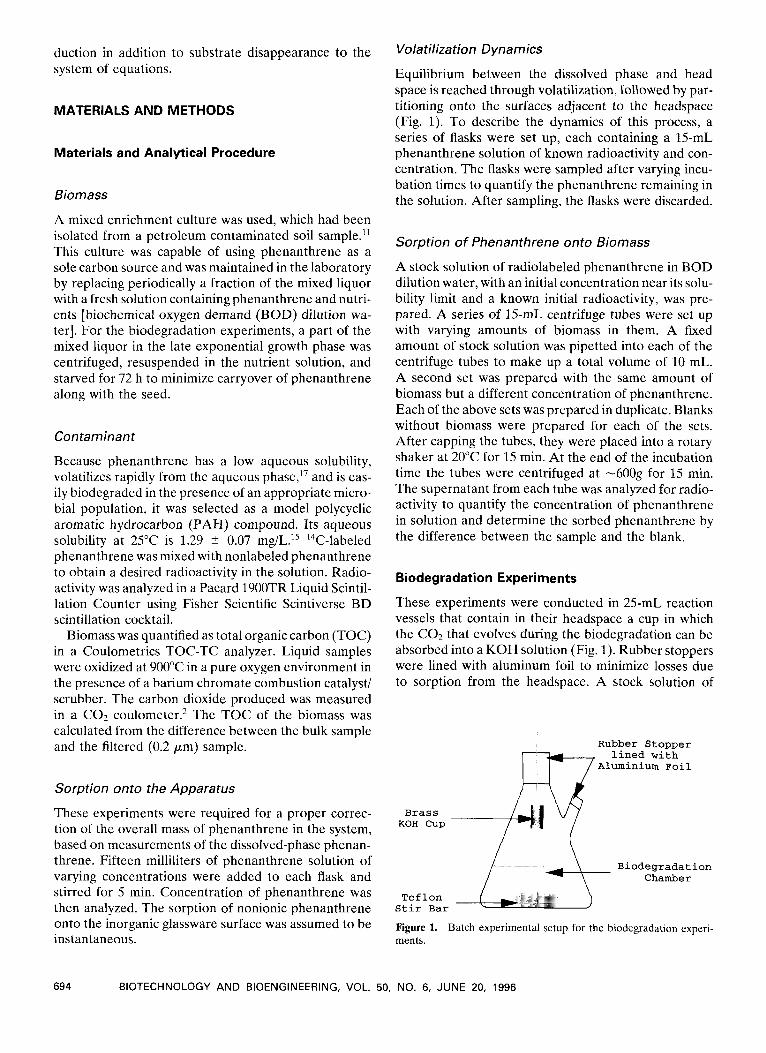
Figure 5. Endogenous respiration coefficient for the mixed culture.
of this experiment are shown in Figure 5. The value of the endogenous respiration coefficient, b, for the mixed culture was found to be 0.0016/h.
Monod Kinetic Parameters
The optimization problem described above was solved using the partition, volatilization, and endogenous respi- ration parameters described in the previous sections. The data used for the optimization were obtained from four separate biodegradation experiments conducted for two different initial biomass concentrations and the same initial phenanthrene concentration. Combining the four experiments resulted in 51 time-dependent data points for each of phenanthrene and carbon dioxide. The fitting was performed on all four experimental sets simultaneously. The model's fit to the carbon dioxide and phenanthrene data, obtained for one initial biomass concentration, are shown in Figures 6 and 7, respec- tively. In all cases, carbon dioxide data fit the model better than the phenanthrene data. This is attributed to the fact that the determination of carbon dioxide is more accurate than that of phenanthrene. Processes such as partition and volatilization affect the phenanthrene con-
0 5 10 15 20 25
Time, hour
Figure 6. Phenanthrene concentration in the different phases. Sym- bols are experimental concentrations in solution. Lines are simulated concentrations in different phases. Initial total phenanthrene =
0.863 mg/L as carbon. Initial biomass = 22.35 mg/L as carbon.
0 5 10 15 20 25
Time, hour
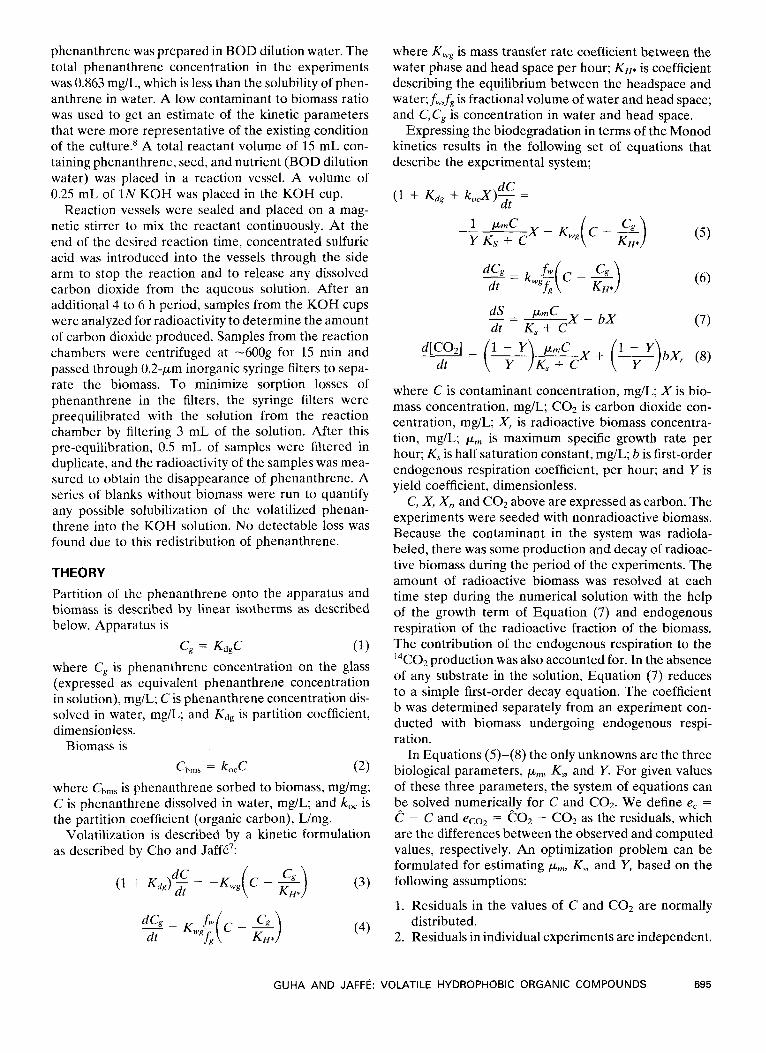
Figure 7. Carbon dioxide production expressed as the carbon in solution. Symbols are experimental and the line is simulated. Ini- tial total phenanthrene = 0.863 mg/L as carbon. Initial biomass = 22.35 mg/L as carbon.
centration in solution and are thus capable of imparting more noise to the data. In contrast, the carbon dioxide concentration is only the result of the biological activity.
The volatilization dynamics, as formulated in this arti- cle, incorporates two separate processes; (a) volatiliza- tion of phenanthrene from the water phase to the head- space, and (b) sorption of phenanthrene from the gas phase to the surfaces surrounding the headspace. While the volatilization in a completely mixed and closed sys- tem is believed to be reversible, the sorption is often not. A part of the sorbed compound may show rate limited desorption. The small deviations between the measurements and simulations in Figures 6 and 7 during the latter portion of the test may be indicative of this desorption limitation.
The value of pm, and K,, and Y were found to be 0.1104 X 10⁻²/h, 0.0898 mg/L, and 0.392, respectively, for an objective function value of -179.1.
Distribution of Residuals
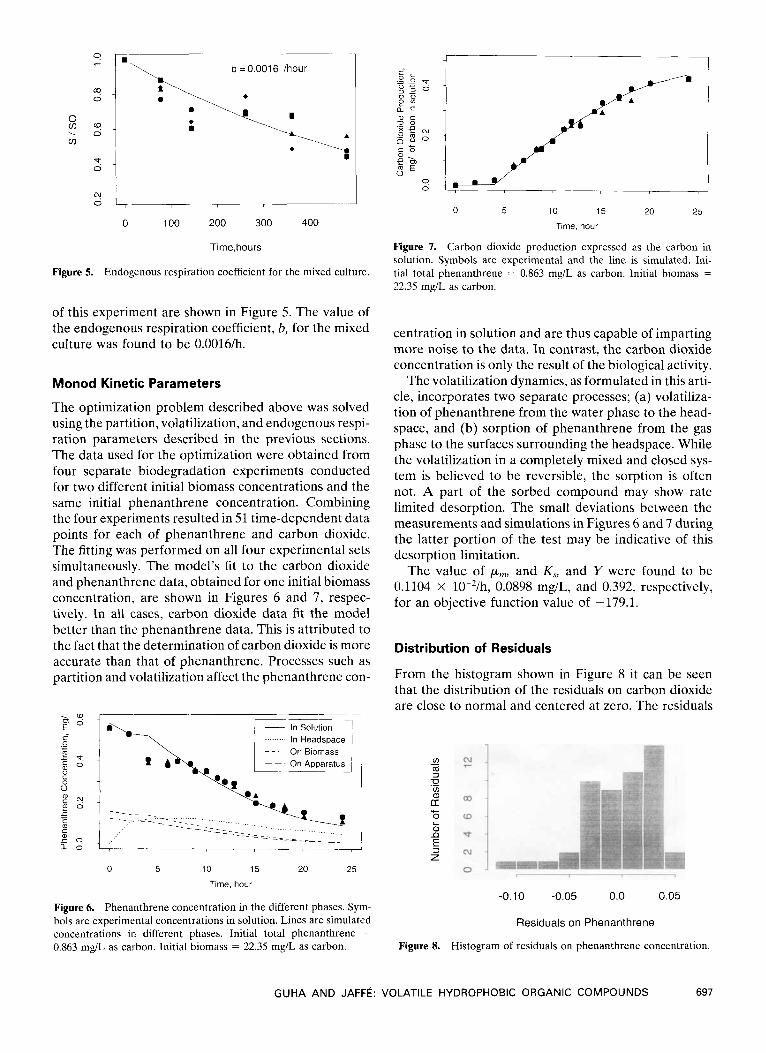
From the histogram shown in Figure 8 it can be seen that the distribution of the residuals on carbon dioxide are close to normal and centered at zero. The residuals
-0.10 -0.05 0.0 0.05
Residuals on Phenanthrene
Figure 8. Histogram of residuals on phenanthrene concentration.
GUHA AND JAFFE: VOLATILE HYDROPHOBIC ORGANIC COMPOUNDS 697
-0.04 0.0 0.02 0.04
Residualuals on Carbon Dioxide
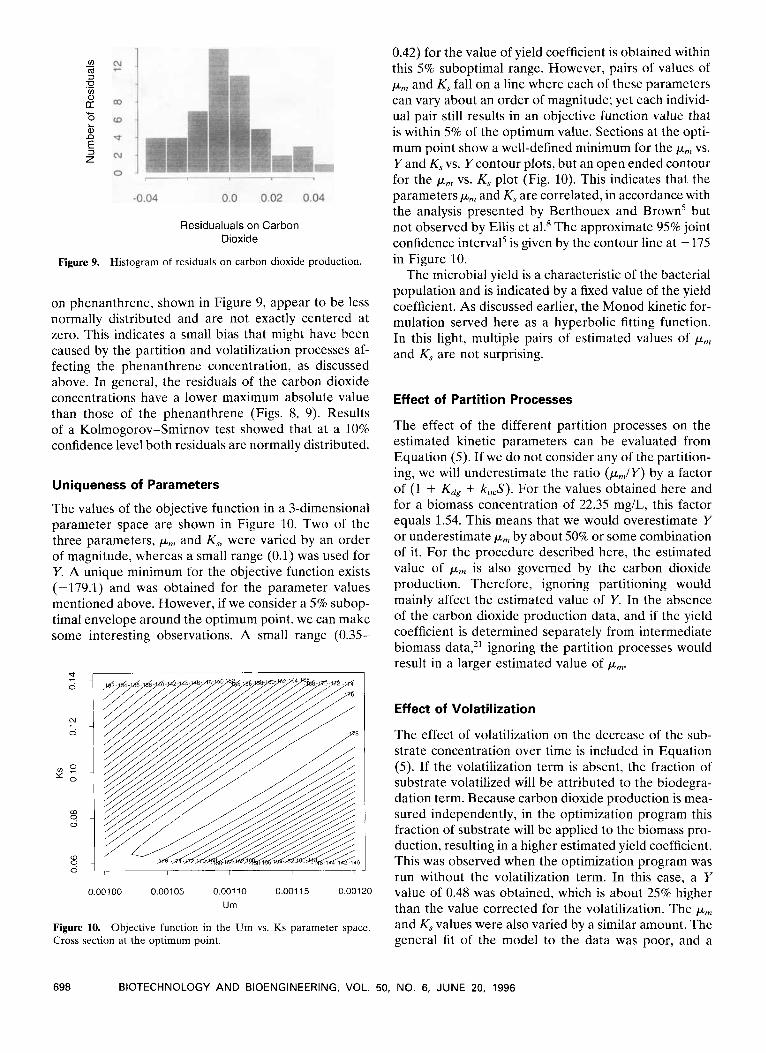
Figure 9. Histogram of residuals on carbon dioxide production.
on phenanthrene, shown in Figure 9, appear to be less normally distributed and are not exactly centered at zero. This indicates a small bias that might have been caused by the partition and volatilization processes af- fecting the phenanthrene concentration, as discussed above. In general, the residuals of the carbon dioxide concentrations have a lower maximum absolute value than those of the phenanthrene (Figs. 8, 9). Results of a Kolmogorov-Smirnov test showed that at a 10% confidence level both residuals are normally distributed.
Uniqueness of Parameters
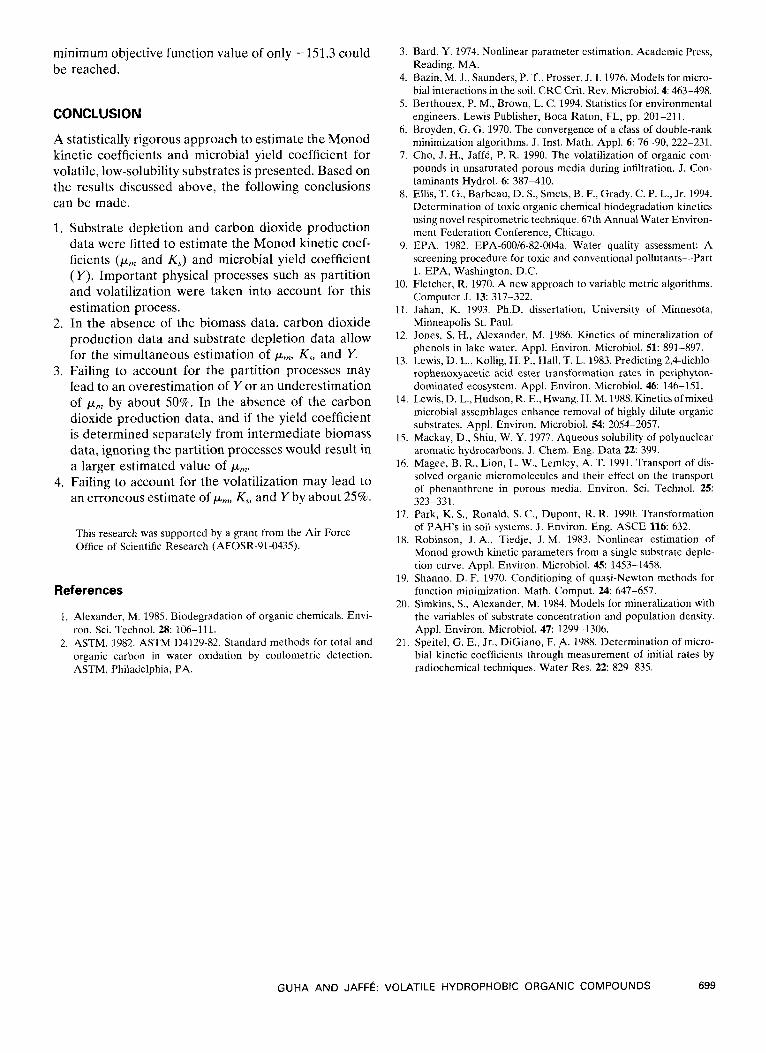
The values of the objective function in a 3-dimensional parameter space are shown in Figure 10. Two of the three parameters, p, and K,, were varied by an order of magnitude, whereas a small range (0.1) was used for Y. A unique minimum for the objective function exists (-179.1) and was obtained for the parameter values mentioned above. However, if we consider a 5% subop- timal envelope around the optimum point, we can make some interesting observations. A small range (0.35-
I I I I
0.00100 0.00105 0.00110 0.00115 000120 Urn
Figure 10. Objective function in the Um vs. Ks parameter space. Cross section at the optimum point.
0.42) for the value of yield coefficient is obtained within this 5% suboptimal range. However, pairs of values of p, and K, fall on a line where each of these parameters can vary about an order of magnitude; yet each individ- ual pair still results in an objective function value that is within 5% of the optimum value. Sections at the opti- mum point show a well-defined minimum for the p, vs. Y and K, vs. Y contour plots, but an open ended contour for the p, vs. K, plot (Fig. 10). This indicates that the parameters p, and K, are correlated, in accordance with the analysis presented by Berthouex and Brown' but not observed by Ellis et a1.' The approximate 95% joint confidence interval5 is given by the contour line at -175 in Figure 10.
The microbial yield is a characteristic of the bacterial population and is indicated by a fixed value of the yield coefficient. As discussed earlier, the Monod kinetic for- mulation served here as a hyperbolic fitting function. In this light, multiple pairs of estimated values of ,urn and K, are not surprising.
Effect of Partition Processes
The effect of the different partition processes on the estimated kinetic parameters can be evaluated from Equation ( 5 ) . If we do not consider any of the partition- ing, we will underestimate the ratio (pmIY) by a factor of (1 + Kdg + k,,,S). For the values obtained here and for a biomass concentration of 22.35 mg/L, this factor equals 1.54. This means that we would overestimate Y or underestimate pm by about 50% or some combination of it. For the procedure described here, the estimated value of pm is also governed by the carbon dioxide production. Therefore, ignoring partitioning would mainly affect the estimated value of Y. In the absence of the carbon dioxide production data, and if the yield coefficient is determined separately from intermediate biomass ignoring the partition processes would result in a larger estimated value of p,,,.
Effect of Volatilization
The effect of volatilization on the decrease of the sub- strate concentration over time is included in Equation (5) . If the volatilization term is absent, the fraction of substrate volatilized will be attributed to the biodegra- dation term. Because carbon dioxide production is mea- sured independently, in the optimization program this fraction of substrate will be applied to the biomass pro- duction, resulting in a higher estimated yield coefficient. This was observed when the optimization program was run without the volatilization term. In this case, a Y value of 0.48 was obtained, which is about 25% higher than the value corrected for the volatilization. The p, and K, values were also varied by a similar amount. The general fit of the model to the data was poor, and a
698 BIOTECHNOLOGY AND BIOENGINEERING, VOL. 50, NO. 6, JUNE 20, 1996
minimum objective function value of only -151.3 could be reached.
CONCLUSION
A statistically rigorous approach to estimate the Monod kinetic coefficients and microbial yield coefficient for volatile, low-solubility substrates is presented. Based on the results dixussed above, the following conclusions can be made.
1. Substrate depletion and carbon dioxide production data were fitted to estimate the Monod kinetic coef- ficients (p,,, and K,) and microbial yield coefficient ( Y ) . Important physical processes such as partition and volatilization were taken into account for this estimation process.
2. In the absence of the biomass data, carbon dioxide production data and substrate depletion data allow for the simultaneous estimation of p,,,, K , and Y.
3. Failing to account for the partition processes may lead to an overestimation of Y or an underestimation of p,,, by about 50%. In the absence of the carbon dioxide production data, and if the yield coefficient is determined separately from intermediate biomass data, ignoring the partition processes would result in a larger estimated value of pm.
4. Failing to account for the volatilization may lead to an erroneous estimate of p,,,, K,, and Y by about 25%.
This research was supported by a grant from the Air Force Office of Scientific Research (AFOSR-91-0435).
References
1. Alexander, M. 1985. Biodegradation of organic chemicals. Envi- ron. Sci. Technol. 28: 106-111.
2. ASTM. 1982. ASTM D4129-82. Standard methods for total and organic carbon in water oxidation by coulometric detection. ASTM, Philadelphia, PA.
3. Bard, Y . 1974. Nonlinear parameter estimation. Academic Press, Reading, MA.
4. Bazin, M. J., Saunders, P. T., Prosser, J. I. 1976. Models for micro- bial interactions in the soil. CRC Crit. Rev. Microbiol. 4: 463-498.
5. Berthouex, P. M., Brown, L. C. 1994. Statistics for environmental engineers. Lewis Publisher, Boca Raton, FL, pp. 201-211.
6. Broyden, G. G. 1970. The convergence of a class of double-rank minimization algorithms. J. Inst. Math. Appl. 6: 76-90, 222-231.
7. Cho, J. H., Jaffe, P. R. 1990. The volatilization of organic com- pounds in unsaturated porous media during infiltration. J. Con- taminants Hydrol. 6 387-410.
8. Ellis, T. G., Barbeau, D. S., Smets, B. F., Grady, C. P. L., Jr. 1994. Determination of toxic organic chemical biodegradation kinetics using novel respirometric technique. 67th Annual Water Environ- ment Federation Conference, Chicago.
9. EPA. 1982. EPA-600/6-82-004a. Water quality assessment: A screening procedure for toxic and conventional pollutants-Part 1. EPA, Washington, D.C.
10. Fletcher, R. 1970. A new approach to variable metric algorithms. Computer J. 13: 317-322.
11. Jahan, K. 1993. Ph.D. dissertation, University of Minnesota, Minneapolis St. Paul.
12. Jones, S. H., Alexander, M. 1986. Kinetics of mineralization of phenols in lake water. Appl. Environ. Microbiol. 51: 891-897.
3. Lewis, D. L., Kollig, H. P., Hall, T. L. 1983. Predicting 2,4-dichlo- rophenoxyaeetic acid ester transformation rates in periphyton- dominated ecosystem. Appl. Environ. Microbiol. 46: 146-151.
4. Lewis, D. L., Hudson, R. E.,Hwang, H. M. 1988. Kineticsofmixed microbial assemblages enhance removal of highly dilute organic substrates. Appl. Environ. Microbiol. 5 4 2054-2057.
5. Mackay, D., Shiu, W. Y. 1977. Aqueous solubility of polynuclear aromatic hydrocarbons. J. Chem. Eng. Data 22 399.
16. Magee, B. R., Lion, L. W., Lemley, A. T. 1991. Transport of dis- solved organic micromolecules and their effect on the transport of phenanthrene in porous media. Environ. Sci. Technol. 25: 323-331,
17. Park, K. S., Ronald, S. C. , Dupont, R. R. 1990. Transformation of PAH’s in soil systems. J. Environ. Eng. ASCE 116: 632.
18. Robinson, J. A., Tiedje, J. M. 1983. Nonlinear estimation of Monod growth kinetic parameters from a single substrate deple- tion curve. Appl. Environ. Microbiol. 45: 1453-1458.
19, Shanno, D. F. 1970. Conditioning of quasi-Newton methods for function minimization. Math. Comput. 24: 647-657.
20. Simkins, S., Alexander, M. 1984. Models for mineralization with the variables of substrate concentration and population density. Appl. Environ. Microbiol. 4 7 1299-1306.
21. Speitel, G. E., Jr., DiGiano, F. ,A. 1988. Determination of micro- bial kinetic coefficients through measurement of initial rates by radiochemical techniques. Water Res. 22: 829-835.
GUHA AND JAFFE: VOLATILE HYDROPHOBIC ORGANIC COMPOUNDS 699