determination of micropollutants in water samples from
TRANSCRIPT

Determination of micropollutants in water samples from swimming pool systems
Anna Lempart *, Edyta Kudlek , Mariusz Dudziak

INTRODUCTON
Research on PPCPs in swimming pools are still in their infancy and available data are limited.
PPCPs are designed to be biologically active even at low concentrations.
Long-term exposure to the PPCPs mixture may potentially cause negative health effects.
PPCPs’ degradation in swimming pool water treatment
systems is possible and their by-products may be more relevance to the health of swimmers than their parent compound

INTRODUCTON
Swimmers have direct contact with the compounds present in the swimming pool water and their by-products

INTRODUCTON
The determination of PPCPs requires very sensitive analytical methods that enables to confirm the presence of tested compounds in a complex organic extract.
This study presents a selection of procedure for determining
the concentration of three compounds from the macro-group of Pharmaceutical and Personal Care Products.
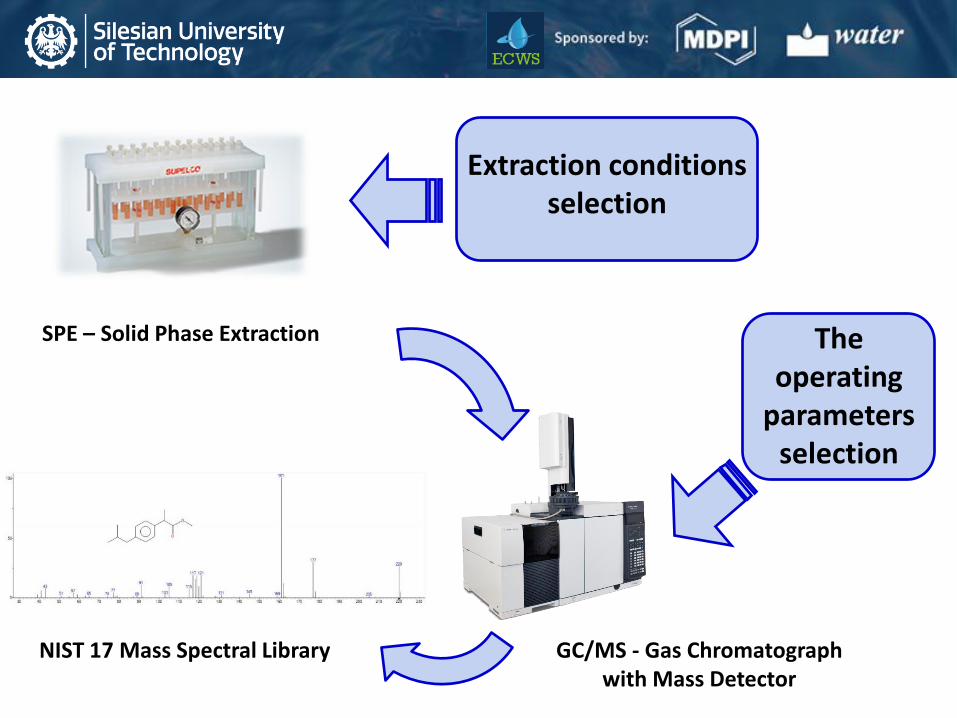
NIST 17 Mass Spectral Library
SPE – Solid Phase Extraction
GC/MS - Gas Chromatograph with Mass Detector
Extraction conditions selection
The operating
parameters selection

MATERIALS AND METHODS
Standard Structural
formula
Molecular
formula
Molar Mass
[g/mol] CAS Number Purity
Caffeine
(CAF) C8H10N4O2 194.19 58-08-2 > 99%
Benzophenone-3
(BP-3) C14H12O3 228.24 131-57-7 98%
Carbamazepine
(CBZ) C16H12N2O 236.27 298-46-4 >99%
Table 1. Characteristics of tested compounds

Table 2. Characteristics of Supelclean™ Tubes applied to Solid Phase Extraction
MATERIALS AND METHODS
Tube
Type
Bed
Weight
[g]
Tube Volume
[mL]
Carbon
Loading
[%]
Bed Type
ENVI-8 1 6 14 C8 (octyl)
ENVI-18 1 6 17 C18 (octadecyl)
LC-8 0.5 6 7 C8 (octyl)
LC-18 1 6 11.5 C18 (octadecyl)
LC-CN 0.5 6 7 Cyano
LC-Ph 0.5 3 5.5 Phenyl

The oven
temperature program:
80 °C (6 min), 5 °C/min to 260 °C, 20 °C/min to 300 °C
The support phase: helium with a flow
of 1.1 mL/min
Injector:
250 oC
Ion source:
230 oC
Ion trap: 150 oC
Ion recording mode:
50 ÷ 700 m/s
RESULTS – The determined operating GC-MS (EI) parameters

RESULTS - The linearity of mass detector response
(a) (b) (c)
Figure 1. Calibration curve by GC-MS for (a) CAF, (b) BP-3, (c) CBZ
RESULTS - The linearity of mass detector response
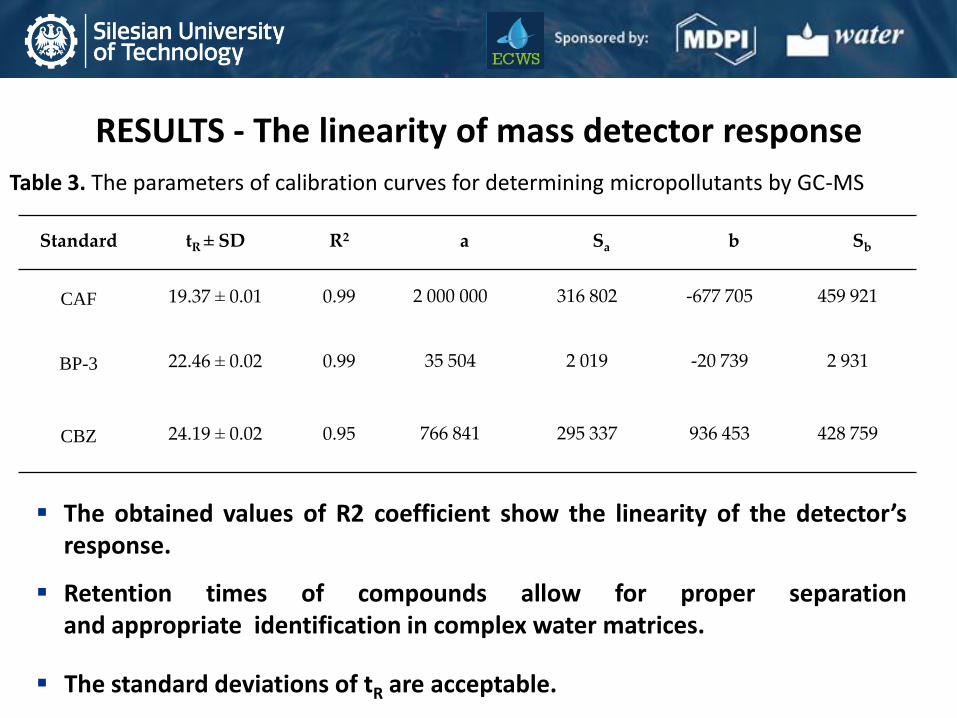
Standard tR ± SD R2 a Sa b Sb
CAF 19.37 ± 0.01 0.99 2 000 000 316 802 -677 705 459 921
BP-3 22.46 ± 0.02 0.99 35 504 2 019 -20 739 2 931
CBZ 24.19 ± 0.02 0.95 766 841 295 337 936 453 428 759
Table 3. The parameters of calibration curves for determining micropollutants by GC-MS
The obtained values of R2 coefficient show the linearity of the detector’s response.
Retention times of compounds allow for proper separation and appropriate identification in complex water matrices.
The standard deviations of tR are acceptable.

RESULTS - The repeatability of the measurements
Standard CV [%] LOD
[ng/L] 0.5 ng/μl 1.0 ng/μl 2.0 ng/μl 5.0 ng/μl 10.0 ng/μl
CAF 0.66 1.39 1.81 1.67 2.25 0.02
BP-3 1.32 1.41 2.28 2.08 0.95 0.02
CBZ 2.81 2.89 2.68 1.59 1.66 0.10
Table 4. Coefficient of Variation (CV) for five concentration levels of tested micropollutants
The LOD determines the lowest quantity of a substance that can be
distinguished from the absence of that substance within a stated confidence limit
The obtained values of CV do not exceed 3% that confirm the high repeatability of conducted measurements.

RESULTS - Recovery and LOQ for
various combinations of SPE Tube types and the solvents
Chosen as the most optimal methodology
RESULTS – Recoveries in different matrices
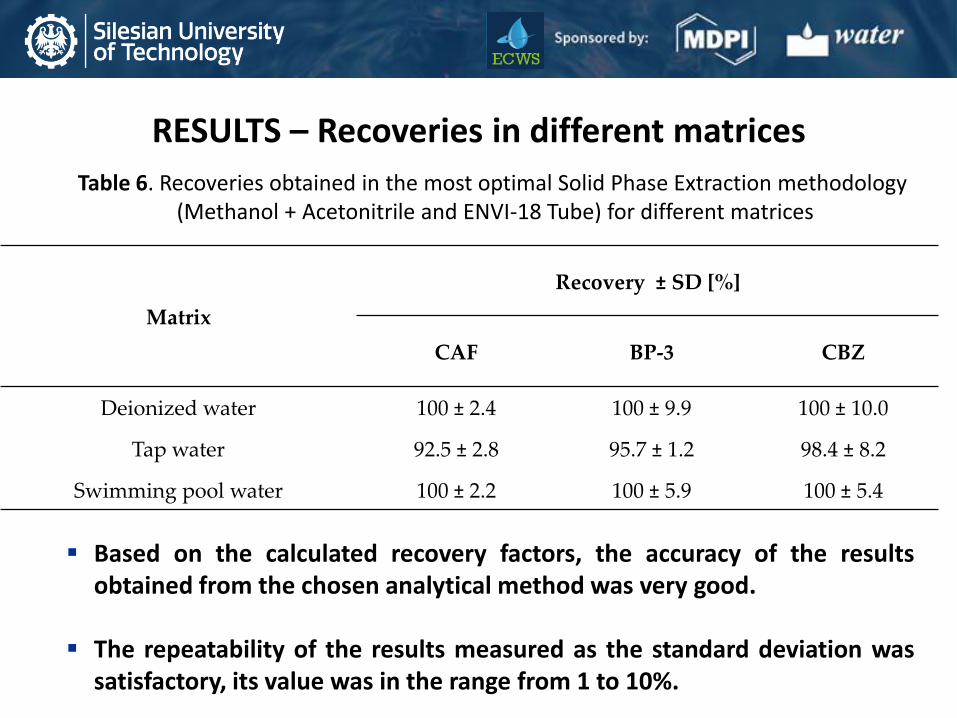
Table 6. Recoveries obtained in the most optimal Solid Phase Extraction methodology (Methanol + Acetonitrile and ENVI-18 Tube) for different matrices
Based on the calculated recovery factors, the accuracy of the results obtained from the chosen analytical method was very good.
The repeatability of the results measured as the standard deviation was
satisfactory, its value was in the range from 1 to 10%.
Matrix
Recovery ± SD [%]
CAF BP-3 CBZ
Deionized water 100 ± 2.4 100 ± 9.9 100 ± 10.0
Tap water 92.5 ± 2.8 95.7 ± 1.2 98.4 ± 8.2
Swimming pool water 100 ± 2.2 100 ± 5.9 100 ± 5.4

RESULTS - the recoveries of the selected as the best conditions of Solid Phase Extraction for the various matrices
Table7. Limits of Quantification obtained in the most optimal
Solid Phase Extraction methodology (Methanol+Acetonitrile and ENVI-18) for different matrices
The lowest LOQs were obtained for swimming pool water, while the highest were observed for deionized water.
The observed differences show the influence of the organic and inorganic substances presence in the water matrix on the LOQ value.
Matrix LOQ [ng/L]
CAF BP-3 CBZ
Deionized water 0.84 0.95 0.87
Tap water 0.78 0.88 0.83
Swimming pool water 0.69 0.75 0.71

CONCLUSIONS
The presented analytical procedure enables the quantification of caffeine, carbamazepine and benzophenone-3 with satisfactory repeatability and accuracy.
The obtained recovery values ensure the possibility of full quantitative control of the tested micropollutants in samples collected from swimming pool waster systems.
The developed methodology can be used for analytical control
of swimming pool water treatment processes from selected Pharmaceuticals and Personal Care Products.
The different physicochemical composition of water affect on LOQ. The values of LOQ obtained for swimming pool water were lower than for deionized and tap water.