determination of mean high water mark within new south … · determination of mean high water mark...
TRANSCRIPT
University of Southern Queensland
Faculty of Engineering and Surveying
Determination of Mean High Water Mark
within New South Wales
A dissertation submitted by
Mr. Adam Clerke
In fulfilment of the requirements of
Courses ENG4111 and 4112 Research Project
towards the degree of
Bachelor of Surveying
October, 2004

i
ABSTRACT
The boundary between water and land is one of the most ancient boundaries used by
society. Despite the long history of usage, society has found that the land/ sea zone is not a
definite boundary. The influences on a tidal boundary are many, from gravitational and
centrifugal forces acting on the earth to the many local variations that can shape a tide.
From this active interface between water and land, a surveyor must determine a precise
boundary. The aim of this project is to develop a system of procedures that will help to
define this dynamic boundary.
Developing a procedure manual will involve researching and evaluating the current
guidelines, regulations and survey techniques used in determining tidal boundaries. This
research will allow the development of a system that will guide a land surveyor when
determining Mean High Water Mark boundaries along tidal land. These guidelines will be
applied to a tidal boundary on the Central Coast of New South Wales, so as to validate the
procedures.
This project has found that using tidal information collected over a long period of time at a
tide gauge would increase the accuracy of determining a tidal plane. By comparing the tidal
data of a site that does not have long term tidal data with a control gauge, which does have
long term tidal data, a reliable answer can be achieved. Therefore a procedure was
developed to guide a surveyor through the determination of a Mean High Water Mark
within New South Wales.
The procedure manual will introduce a system in the techniques to follow in determining a
water boundary. The user of the manual will be aware of the various issues faced in
establishing a tidal boundary and this manual will allow them to make the informative
decisions. It is recommended that this manual be incorporated into any survey company’s
quality control management system.

ii
University of Southern Queensland
Faculty of Engineering and Surveying
ENG4111 and 4112 Research Project
Limitation of Use
The council of the University of Southern Queensland, its Faculty of engineering
and Surveying, and the staff of the University of Southern Queensland, do not
accept any responsibility for the truth, accuracy or completeness of the material
contained within or associated with this dissertation.
Persons using all or part of this material do so at their own risk, and not at the risk of
the Council of the university of southern Queensland, its faculty of Engineering and
surveying or the staff of the University of Southern Queensland.
This dissertation reports an educational exercise and has no purpose or validity
beyond this exercise. The sole purpose of the course pair entitled ‘Research Project’
is to contribute to the overall education within the student’s chosen degree program.
This document, the associated hardware, software, drawings, and other material set
out in the associated appendices should not be used for other purposes: if they are so
used, it is entirely at the risk of the user.
Prof G Baker
Dean
Faculty of Engineering and Surveying

iv
Acknowledgements
I would like to thank my supervisor, Mr Peter Gibbings for his advice and guidance. I
would also like to acknowledge the assistance of Mr Geoff Songberg and Mr Phil
Watson, NSW Department of Land and Water Conservation, and Mr Peter Davidson,
Manly Hydraulics Laboratory, for their contribution of data and Stuart McEvoy,
Mr Paul Honour and Mr Chris Hooghuis for their contribution in the field.
Finally I would like to thank my wife Carole and son James for their loving support
during the year.

v
TABLE OF CONTENTS
Contents Page
ABSTRACT i
LIMITATION OF USE ii
CERTIFICATION iii
ACKNOWLEDGEMENTS iv
LIST OF FIGURES ix
LIST OF TABLES xi
LIST OF APPENDICES xii
NOMENCLATURE xiii
CHAPTER 1 - INTRODUCTION
1.1 The Problem 1
1.2 Research Aim 3
1.3 Justification 3
1.4 Scope Of Research 5
1.5 Summary: Chapter 1 6
CHAPTER 2 - LITERATURE REVIEW
2.0 Introduction 7
2.1 Mean High Water As A Boundary 7
2.2 The Suitability Of Mean High Water Mark As A Boundary 9
2.3 The Importance Of Case Law And Water (Tidal) Boundaries 12
2.4 How Tidal Determinations Affect Accretion And Erosion 12
vi
2.5 Legislation Affecting New South Wales Tidal Boundaries 13
2.6 Survey Requirements When Determining Tidal Boundaries
Within New South Wales 14
2.7 Tidal Or Non Tidal Waters Status 15
2.8 Methods Of Determination 16
2.8.1 Procedures Within New South Wales 17
2.8.2 Procedures Within Other States And Countries 17
2.9 Accuracies In Determining Mean High Water 18
2.9.1 Accuracies When Levelling From A Benchmark 19
2.9.2 Accuracies When Levelling From Local Tide Gauge 21
2.9.3 Accuracies Using Range Ratio 26
2.9.4 Other Methods 28
2.10 Summary: Chapter 2 30
CHAPTER 3 - RESEARCH METHOD
3.1 Introduction 31
3.2 Procedure Manual Format 31
3.3 Mean High Water Mark Procedure 33
3.3.1 Search And Locality Procedure 33
3.3.2 Format For Determining And Positioning Tidal Plane 37
3.3.3 Establishing Previous Mean High Water Mark 41
3.3.4 Format For Survey Plan And Report 42
3.4 Validation Of Procedures 42
3.5 Summary: Chapter 3 43

vii
CHAPTER 4 – PROCEDURE MANUAL
4.1 Introduction 44
4.2 Procedure For A Mean High Water Mark Survey 44
4.2.1 Purpose 44
4.2.2 Scope 45
4.2.3 References 45
4.2.4 Responsibilities 45
4.2.5 Client Instructions 46
4.2.6 Data Search 46
4.2.7 Field Survey 46
4.2.8 Boundary Definition For Reinstating Previous MHWM 47
4.2.9 Plan Preparation 47
4.2.10 Survey Reports 47
4.2.11 Definition 48
4.2.12 Appendices 48
4. 3 Procedure For Data Search Requirements 50
4.4 Procedure When Levelling From A Benchmark 53
4.5 Procedure When Levelling From A Local Tide Gauge 55
4.6 Procedure When Using Range Ratio Method 59
4.7 Procedure For Levelling & Positioning A Horizontal Plane 63
4.8 Establishing Previous Mean High Water Mark 65
4.9 Plan Presentation Of Mean High Water Mark Determination 66
4.10 Reporting On Mean High Water Mark Determination 67
4.11 Summary: Chapter 4 70

viii
CHAPTER 5 – VALIDATION (CASE STUDY – PATONGA)
5.1 Introduction 71
5.2 The Site 71
5.3 Procedures For A Mean High Water Mark 72
5.4 Acquiring Search And Geographical Names 73
5.5 Tidal Status 73
5.6 Gaining Bench Mark Information 73
5.7 Acquiring Tidal Heights And Information 74
5.8 Establishing Mean High Water 75
5.8.1 Levelling From A Benchmark 75
5.8.2 Levelling From A Local Tide Gauge 77
5.8.3 Range Ratio Method 79
5.9 Results 81
5.10 Establishing Previous Mean High Water Mark 81
5.11 Presentation Of Mean High Water Mark Determination 83
5.12 Reporting On The Mean High Water Mark Determination 85
5.13 Summary: Chapter 5 88
CHAPTER 6 – CONCLUSION
6.1 Introduction 89
6.2 Achievement Of Aims. 89
6.3 Conclusion: Chapter 5 90
APPENDICES 91
BIBLIOGRAPHY 103

ix
LIST OF FIGURES
Figures Title Page
1 Illustrated example of the importance of Mean High Water
position and building setback. 4
2 Guide to semi-diurnal tidal planes 9
3 Accretion and Erosion along a Dynamic Coastline 11
4 Hawkesbury River, New South Wales 16
5 Lake Macquarie, New South Wales 20
6 Observed High Tides, Camp Cove, Sydney Harbour 22
7 Mean High Tide at Fort Denison, Sydney Harbour 23
8 Rise in sea level 25
9 Ideal Tidal Gradient 26
10 Tidal Gradients Along the New South Wales Coast 27
11 Tidal datum heights along Sesquehanna River, USA 28
12 Land Title Search Web Page, Department of Lands 34
13 Geographical Names Board of NSW Web Page 35
14 Example of a Manly Hydraulic Request Form. 36
15 Procedure Flowchart 49
16 Location Plan, Patonga, New South Wales 72
17 Levelling in position of MHWM 76
18 Tide gauge at Patonga 77
19 Lunation of high and low water levels at Patonga 78

x
20 Tide Staff at Patonga 79
21 Plan of Redefinition. 84
22 Sandy foreshore and jetty along Patonga Creek 86
23 Mangroves on Patonga Creek 86
24 Boatshed along Patonga Creek 87

xi
LIST OF TABLES
Number Title Page
1 Observed High Tides Over One Lunation Camp Cove,
Sydney Harbour 22

xii
LIST OF APPENDICES
Number Title Page
A Project Specification 91
B Department of Lands Checklist For Water Boundary Consent 92
C Addresses of approving authorities and information suppliers 93
D Location Map of Sydney and Patonga 94
E D.P. 8549 95
F Part of Patonga Parish Maps 96
G SCIMS DCDB Plot and coordinates of SSM 94488 97
H Tidal Datum for Patonga 98
I Tidal Data Sheet 99
J Tidal Data Sheet 100
K DCDB Plans on Cadastre Sheet1 101
L Plan of Redefinition of Mean High Water Mark at Patonga 102

xiii
NOMENCLATURE
The following abbreviations have been used throughout the text and bibliography: -
MHWM Mean High Water Mark
MHW Mean High Water
AHD Australian Height Datum
LTO Land Title Office
LPI Land and Property Information
DP Deposited Plan
SLR Sea Level Rise
GPS Global Positioning Systems
DCDB Digital Cadastre Data Base
ICSM Intergovernmental Committee on Surveying and Mapping

Chapter 1 - Introduction
Determination of Mean High Water Mark 1
CHAPTER 1
INTRODUCTION
‘The true nature of the boundary surveyor’s role lies not in
theories of exact measurement but in the proposition that the
basic determinant of the limits of any region in respect of which
some person or body holds exclusive legal rights is not a matter
of surveying but a matter of law’ (Hallmann, 2000).
1.1 The Problem
The above quotation indicates that a surveyor’s role is to not only mark the
boundaries of land accurately but also ensure that the boundaries defined are legally
sustainable over time. The interface between water and land is dynamic, conventional
boundaries may be two to three dimensional (i.e. X, Y, Z) but tidal and non tidal
boundaries are unique due to their fourth dimension – time (Cole, 1997).
This is true of tidal and non-tidal boundaries as redefinitions of a water boundary
may yield significantly varying results over a short period of time.
With the determination of any boundary the question of accuracies that are
obtainable should be asked. Harcombe (1985) notes that the following question must
be addressed when defining the position of Mean High Water Mark (MHWM).
‘Is the approximation of mean high water mark under
investigation technically correct?’

Chapter 1 - Introduction
Determination of Mean High Water Mark 2
Here he refers to the New South Wales Surveying Regulations 2001 clause 55(4)
quoting that a surveyor should determine mean high water mark with ‘appropriate
accuracy’. But there is no linear indication of what this accuracy should be. In New
South Wales guidelines for determining tidal boundaries have been published but
only advise on legislation affecting tidal boundaries and list methods for determining
tidal boundaries but do not advise on the issues faced when physically measuring
these boundaries. When a method is picked to determine a tidal boundary all
guidelines and manuals are there ‘to assist Surveyors in using their professional
judgement’ (SOM, 1999) but do not quote what accuracies may be achieved and
where accuracies are quoted they do not cite evidence to the claim. There is no
clarification of the techniques used for determining tidal boundaries and no
procedural methods that can be relied upon when determining these boundaries.
The use of tidal analysis by early surveyors for determining high water mark was
rarely used and the understanding of the concepts of accretion and erosion were not
understood (Gordon, 2003). In many cases in Australia, Mean High Water property
boundary determinations were only approximated by early surveyors (Moore, 1968).
These flaws make it difficult or even impossible to make a comparison between the
original and present Mean High Water Mark (MHWM) positions. When assessing a
claim for accretion or erosion it is mandatory that the original MHWM be shown (as
required by most ’surveyors practice manuals in the different states). It will be
demonstrated in this research project that the positioning of a MHWM boundary is
by no way precise. But it is essential that standard procedure(s) be adopted therefore
eliminating any ambiguity in the determination of the current MHWM.
Chapter 1 - Introduction
Determination of Mean High Water Mark 3
1.2 Research Aim
The aim of this research is to clarify the legal and physical implications associated
with determining tidal boundaries within New South Wales and to develop
procedures for determining tidal boundaries (defined in Appendix A).
The objectives are to assist a surveyor in determining a water boundary using current
legislation and alerting them to possible issues that may be faced when determining
boundaries. The outcome will inform the reader of the various issues faced when
determining a tidal boundary so as to allow for an informative and correct decision in
determining tidal boundaries.
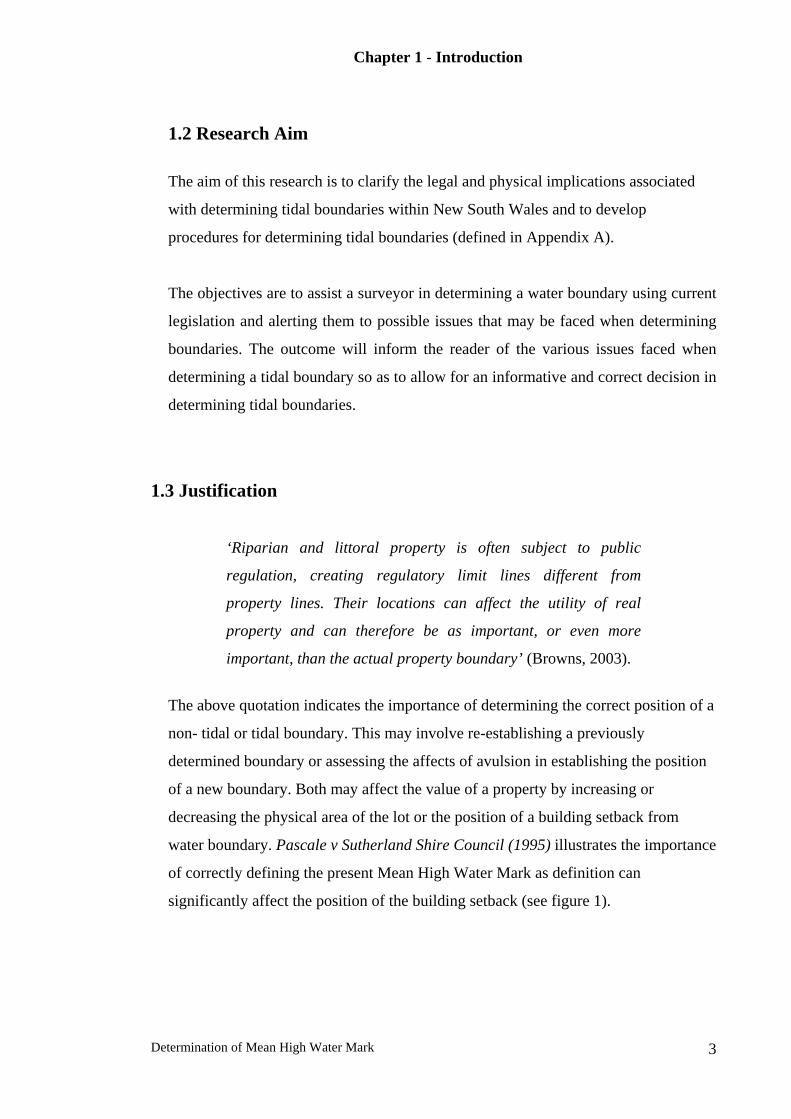
1.3 Justification
‘Riparian and littoral property is often subject to public
regulation, creating regulatory limit lines different from
property lines. Their locations can affect the utility of real
property and can therefore be as important, or even more
important, than the actual property boundary’ (Browns, 2003).
The above quotation indicates the importance of determining the correct position of a
non- tidal or tidal boundary. This may involve re-establishing a previously
determined boundary or assessing the affects of avulsion in establishing the position
of a new boundary. Both may affect the value of a property by increasing or
decreasing the physical area of the lot or the position of a building setback from
water boundary. Pascale v Sutherland Shire Council (1995) illustrates the importance
of correctly defining the present Mean High Water Mark as definition can
significantly affect the position of the building setback (see figure 1).

Chapter 1 - Introduction
Determination of Mean High Water Mark 4
Lot X
by title
Mean
Tidal River
High
Water
Building Setback
Building Setback
15metres
Setback
Previous
Mean
HighW
ater
Present
Figure 1. - Illustrated example of the importance of Mean High Water position and
building setback.
Tidal boundaries are ambulatory, meaning that the boundary will fluctuate over time.
Clause 55(4) of the New South Wales Surveying Regulations 2001 states the mean
high water mark must be determined with appropriate accuracy by a surveyor. How
accurate should the determination be and how long should this ambulatory definition
last? In the United States there was a 1974 study, which showed that a 0.03 metre
difference in the establishing of the high water mark datum had a $3 million impact
on property values along the Atlantic and Gulf coast (Nichols and McLaughlins
1984). With approximately 50,000 properties within New South Wales with tidal
frontage (Jones, 2002) and with the value that water frontages carry today, the impact
of an approximate tidal line needs to be definitely considered in today’s society in
terms of land value.

Chapter 1 - Introduction
Determination of Mean High Water Mark 5
1.4 Scope Of Research
The scope of my project is to investigate current legislation and guidelines that assist
a land surveyor in establishing a tidal boundary, assess the accuracies of each
technique used for determining Mean High Water Mark tidal plane and to construct a
procedural manual for future determinations within New South Wales.
The Literature Review in Chapter 2 will illustrate the current guidelines and
regulations for determining tidal boundaries within New South Wales. From this the
examination on how legal precedents has affected the determination of tidal
boundaries and how the determination of water boundaries affects the doctrine of
accretion and erosion. The last section of the Literature Review is reviewing the
limited number of other tidal boundary techniques and their accuracies used around
Australia and other parts of the world.
The research method is divided into two sections. The first section is the construction
of a procedure manual when determining a Mean High Water Mark using the
techniques outlined by the Manual of the New South Wales Integrated Survey Grid
(1976). These methods are as listed: -
1. Levelling from a benchmark.
2. Levelling from a Local Tide Gauge.
3. The Range Ratio Method.
The format of the procedural manual will be based on the Association of
Consulting Surveyors Australia, and the Model Quality System Survey Procedure
Manual for cadastral and topographic surveys. The procedure manual will be
divided into following subsections: -
1. Introduction
2. Search and locality information.
Chapter 1 - Introduction
Determination of Mean High Water Mark 6
3. Determining the tidal plane.
4. Positioning the tidal plane
5. Establishing the previous tidal boundary.
6. Survey plan and report requirements.
The second section of the research method is to apply the procedures to a case study
to validate the procedures.
A conclusion will be drawn in Chapter 6 and recommendations will be made for
further research.
1.5 Summary: Chapter 1
Water boundaries are widely used all around the world. Despite the long history of
usage, water boundaries are probably the most widely contested boundary in today’s
society (Cole 1997,99. xi). This is because of the dynamic nature of a land/water
boundary. The surveyor is in a unique role of providing a linkage between the
scientific determination of a tidal boundary and the law.
This dissertation aims to address the legal and practical problems faced by a land
surveyor when attempting to establish a Mean High Water Mark boundary within
New South Wales and provide clarification through the aid of a procedural manual.
The current legislation, guidelines, legal precedence and methods for determining
tidal boundaries are discussed in chapter 2, Literature Review. The chapter
summarises the state of knowledge with regards to legislation, guidance and how it
affects the surveyor and their professional survey practice within New South Wales
and other states.

Chapter 2 – Literature Review
Determination of Mean High Water Mark 7
CHAPTER 2
LITERATURE REVIEW
2.0 Introduction.
This chapter will serve as a review of past and present literature on the determination
of tidal boundaries within New South Wales. This review will help to develop
procedures for determining Mean High Water Mark (MHWM) within New South
Wales.
Therefore the aim from this literature review is to appraise the current knowledge
base in the methods used in determining tidal boundaries under the guidelines set by
state authorities.
This will be achieved by discussing the legislation, legal precedence and survey
techniques and practices introduced by the New South Wales State Government and
authorised institutions. Comparisons with other state guidelines will indicate
similarities in techniques used for determining water boundaries and assist in
assessing the deficiencies found within these current guidelines.
2.1 Mean High Water As A Boundary
The accurate determination and representation of natural water boundaries is an
important aspect of both the planning and implementation phases of the management
of coastal zones (Horlin, 1990). States have adopted different positions for defining
tidal boundaries. Within each state there are various departments and authorities that
have responsibilities in the decision making process within the land/sea zone. Hirst &
Todd (2003) put forward a view that the administration of the land/sea zone requires

Chapter 2 – Literature Review
Determination of Mean High Water Mark 8
a clear definition of the extent of defined tidal boundaries and to be able to position
these lines out on site.
The origin of a Water Mark boundary comes from the English law derived to deal
with the rivalry between kings and nobles over the ownership of the booty from
shipwrecks (Baldwin, 1982: Coutts, 1987). The water marked the boundary wherever
it lay.
Lord Chief Justice Hale first espoused the definition of the boundary between land
and sea in his treatise ‘ De Jure Maris’ in 1666 (Coutts, 1987). He reasoned that the
rights to the monarch extended only ‘ to land that is usually overflowed of the sea at
ordinary high tides’ and defines the right as to where the sea ends not where the land
starts (Baldwin, 1982). Coutts (1987) states in this sense ‘Mean High Water as a
boundary was developed to define the balance or remainder, rather than as an attempt
to delineate the land itself’. Cole (1997), Blume (1995) and Gordon (2003) refer to
the Hale’s use of the term ‘ordinary’ tides as being incorrect taking into account the
understanding we have today about tides and how they can affect the positioning of a
tidal boundary.
The above definition would be clarified in the judgement of the Attorney General v
Chambers. In this case the Crown retained the seashore therefore stopping the mining
of coal within this zone. The judgement states that the Crown (at that time being
Queen Victoria) had a claim that ‘extended landwards as far as high water mark at
ordinary monthly spring tides’. The judgement would also clarify what tides would
be excluded from ordinary tides. Blume (1995) discusses that there is great variation
in terminologies for defining Mean High Water (MHW) in legislations and
guidelines within New South Wales, which has lead to confusion in how MHWM
should be calculated.
An example of this confusion can be demonstrated in the definitions for MHWM
found in the Surveying Regulations 2001 and those found in the Hallmann, 2004 and
the Manual of the New South Wales Integrated Survey Grid (1976). VanderNie

Chapter 2 – Literature Review
Determination of Mean High Water Mark 9
(2003) states that New South Wales is no exception to variations of terminologies,
for example, in Queensland Mean High Water Spring is commonly referred to as
MHW (Hirst & Todd, 2003). As shown in figure 2 the difference can be significant.
To position a tidal boundary precisely the same precision is required in definitions.
Figure 2. Guide to semi-diurnal tidal planes (MSQ Qld, 2004).
2.2 The Suitability Of Mean High Water Mark As A Boundary
The suitability of MHWM as a boundary along the coastal fringe has been questioned
by many (Moore, 1968; Coutts, 1987 and Gordon, 2003).
‘The fallacy of this method is that it really establishes a level
at which the High Water occurs, rather than a position in the
horizontal plane. If the particular coastline is a stable one,
then there is unlikely to be a foreseeable problem’ (Coutts,
1987; 555).

Chapter 2 – Literature Review
Determination of Mean High Water Mark 10
However, the open coast beaches of much of Australia are far more dynamic in
nature than the tides. Where a tide may fluctuate from zero to 2 metres vertically
along a beach the beach itself can fluctuate horizontally by 10 to 30 metres in a
single tide (Gordon, 2003; 6). The profile of a beach is dynamic and can change from
day to day, changing with it the boundary. Baldwin (1982), Coutts (1989) and
Gordon (2003) note that there is little point in accurately determining a boundary
position that will be devastated by the next minor storm.
The Coastal Protection Amendment Bill 2002 was passed to address the
shortcomings with common law rights of the doctrine of accretion and erosion. Its
aim was to holt the loss of public access along foreshore and to stop the one way
activity of owners claiming accretion but not surrendering claim to erosion, as shown
in figure 3 (Jones, 2002 & Gordon, 2003).
The amendment to the Coastal Protection Act 1979 mainly concentrated on the issue
of public access along foreshore areas and how redefining the position of mean high
water will affect access rights. No longer does the theory of gradual and
imperceptible change only apply to claims of accretion but now includes the
assessment of indefinite sustainability, geomorphological processes and public
access.
Knowledge of the geomorphological processes that form our coastal and estuary
foreshores is required in the assessment of the ‘sustainability’ of a claim for accretion
or erosion under the guidelines of the amended Coastal Protection Act 1979. After a
MHWM determination has been made, both the Department of Lands (Gardner,
2004, per comm., 6 April) and Surveyor General’s Direction 2004 recommend that
professional advice or evidence should be obtained from experts, such as coastal
engineers, on the affects of accretion or erosion when assessing and submitting a
claim along a foreshore.

Chapter 2 – Literature Review
Determination of Mean High Water Mark 11
Figure 3: Accretion and Erosion Along A Dynamic Coastline (Thom, 2003).

Chapter 2 – Literature Review
Determination of Mean High Water Mark 12
2.3 The Importance Of Case Law And Water (Tidal) Boundaries
When a property has a natural boundary that is water the determination of that
boundary:
‘…invokes questions of fact and law, perhaps more so than is
the case for artificial boundaries’ (Hallmann, 1973: 187).
Therefore many legal principles must be taken into consideration when disputes are
presented to the courts.
Many legal rules and principles have been deduced from the many detailed
law reports that accompany a judgement for a case. Hallmann (1973,
pp251) notes that ‘case law is not a system of law’ as decisions made by
judges are not statute law but can contribute to the establishment of
legislation (Butt, 1983).
Definitions in tidal terminology have been contested since Attorney General v
Chambers to the present, State of Queensland v Beames [2002] QCA 209. Two
American cases, City of Los Angeles v Borax Consolidated Limited (1935) and
Luttes v State of Texas (1958). These cases deal with the time period for determining
a tidal plane. These and many other cases illustrate how legal precedence has
influenced the procedures in calculating and therefore positioning tidal boundaries.
The survey techniques used in a MHWM determination have never been challenged
in the New South Wales courts.
2.4 How Tidal Determinations Affect Accretion and Erosion
The position of a tidal boundary determination will be influenced by the affects of
accretion or erosion upon that site. Accretion and erosion are caused by the natural or
artificial imperceptible changes in the position of the shoreline over a period of time
(Horlin, 1990, Harcombe, 1985, Hanna, 1989 & others). The inaccuracy in the

Chapter 2 – Literature Review
Determination of Mean High Water Mark 13
techniques used to determine tidal planes is questioned by Songberg (2004) as a
cause for variations in tidal boundary positions and not always from the action of
erosion and accretion. The accuracies of different survey techniques used in defining
a tidal boundary must be understood, because the decision made by a surveyor may
be tested in court; the surveyor must ensure that his opinion is correct and true
(Lambden & De Rijcke, 1996:180).
2.5 Legislation Affecting New South Wales Tidal Boundaries. The type of water body, tidal or non-tidal, adjacent to land will affect what laws, acts
and regulations that apply. It is the surveyor’s responsibility to satisfy the applicable
laws, acts and regulations when defining a water boundary.
Where land is bounded by tidal water, the common law rule is that the boundary is
the MHWM (Hallmann, 2004). The definition for MHWM is setout in Clause 55(2)
& (3) in the New South Wales Surveying Regulations 2001. Inconsistencies in
definitions were discussed in Chapter 2.1. The land between mean high water (MHW) and low water mark (LWM), i.e.
foreshore, and the land below low water mark belong, at common law, to the Crown.
The Crown is presumed to own the bed of tidal rivers up to the HWM (Hallmann,
2004).
Therefore approval from the Minister administering the Crown Land Act or any other
owner of the adjoining land below MHW is required for the MHWM determination
(Clause 55(6) of the New South Wales Surveying Regulations 2001). Approval of the
Minister or adjoining owner to water boundary changes are set out in Clause 58 (1)
and (2) in the Surveying Regulations. Amendments made to the Coastal Protection Act have brought about changes to the
Doctrine of Accretion and Erosion. From these changes, the NSW Department of
Chapter 2 – Literature Review
Determination of Mean High Water Mark 14
Land require a surveyor to confirm each part of a MHWM determination by
completing an appropriate checklist - Appendix B (SGD, 2004).
2.6 Survey Requirements When Determining Tidal Boundaries Within New South Wales
Surveying Regulations 2001, as amended by the Surveying Regulations 2003,
instructs a surveyor on the methods that should be used when surveying in an urban
or rural environment. Amendments to the doctrine of erosion and accretion, vide
Section 55N of the Coastal Protection Act 1979, are important alterations to the
regulations.
Surveyors must obtain all relevant information i.e. search etc on the subject site to be
surveyed in accordance with Surveying Regulations 2001 Part 3 Measurement and
Calculations Section 13.
Clauses 20 and 59 of the Surveying Regulations 2001 require the position of all
natural features to be accurately located. Clause 55 (4) of the Regulation advises that
MHWM must be determined with appropriate accuracy.
Clause 55 (5) of the Surveying Regulations 2001 says that all seawalls and reclaimed
land must be shown on a plan of survey. Clause 9 requires that the description of any
substantial structure and/or fence within 1 metre of the boundary to be shown on the
survey plan.
Clause 57 (1) of the Act stipulates that where a landward boundary of an existing
reservation of stipulated width has not be defined by a survey the boundary must be
defined by right lines (artificial lines) approximately parallel to the line of mean high
water. This boundary may require approval by the Crown if no previous approval had
been granted by this Act or previous Regulations under this Act; Clause 57(3).

Chapter 2 – Literature Review
Determination of Mean High Water Mark 15
Clause 59 (1) to (3) are concerned with the calculation of the areas of land abutting a
natural feature. Appropriate accuracies must be used. All natural features must be
described on the survey plan and the bearing and distances between end points of
radiations or offsets defining the natural feature must be shown (as well as overall
area of land abutting the natural feature).
Part 6 of the Surveyors General’s Directions 2004 outlines the administrative
procedures for establishing mean high water mark and re-establishing the original
boundary along non-tidal waters. The methods of determination of MHWM are to be
found in part 6, section 22 of the Manual of the New South Wales Integrated Survey
Grid.
Part 7 set outs the approval requirements from the Department of Land for MHWM
definitions when substantial change has occurred from the previous plan and when
definitions is effectively the same as the previous plan.
2.7 Tidal Or Non Tidal Waters Status
Part of the procedure of preparing a survey plan and defining an ambulatory
boundary is confirming that the foreshore is tidal as required by Clause 55 (3) of the
Surveying Regulations 2001. Hurcum (1992) notes that if a tidal status is not
properly identified then the non-tidal or tidal determination of a property may be a
waste of time.
Difficulties can be faced when determining tidal limits by mere observations
(DLWC, 2004). Towards the limits of tidal influence, a tide may only last
approximately one hour and therefore go unnoticed by casual observations. The
actual limit of tidal influence varies over time, depending on the freshwater flows of
upstream river and creeks and the natural variability of the tides (DLWC, 2004). The
next paragraph illustrates the difficulties faced when determining the tidal limit.

Chapter 2 – Literature Review
Determination of Mean High Water Mark 16
The Hawkesbury River is approximately 140 kilometres long and figure 4 shows a
gravel bar that is approximately one kilometre below the downstream of the tidal
limits. The bar is exposed 90 % of the time and the rise in river level is
approximately 0.2 metres (It is assumed from this example that spring and neap high
tides are within the tidal range 0.2 metres). It illustrates the difficulties of casually
observing tidal influences and therefore it would be wise to observe or record the
influence of the tide for at least a period of one day.
Low tide High tide Figure 4 Hawkesbury River, New South Wales (DLWC, 2004)
Tidal status may be confusing in coastal lagoons. In these cases refer to Part 3 of the
Surveyor Generals Directions as it refers to the Crown Land Act 1989 for the
redefinition of non-tidal waters. Some court decisions have held that marine lagoons
can be considered non-tidal under certain circumstances and therefore MHWM
determinations and the doctrine of accretion and erosion does not apply.
2.8 Methods Of Determination
‘It is one thing for a court, of whatever jurisdiction, to sit in
judgement on a set of circumstances and determine where a
tidal boundary should lie and another to actually physically
delimit such a boundary on the ground’ (Horlin, 1990).

Chapter 2 – Literature Review
Determination of Mean High Water Mark 17
In most states within Australia there are laws and regulations that define tidal
definitions but there is minimal guidance on how to determine tidal planes and relate
them to the cadastre.
The following will outline the various methods available as stipulated by controlling
authorities for surveyors to use when determining a tidal boundary.
2.8.1 Procedures Within New South Wales
In New South Wales the Surveyor General’s Direction, 1999, advises that some
methods of determination of MHWM are contained in part 6,section 22 of the
Manual of the New South Wales Integrated Survey Grid, 1976 (ISG 1976). The three
methods described in the ISG 1976 are the levelling from a benchmark, levelling
from a local tide gauge and the Range Ratio method.
The Direction also informs that current tidal plane statistical data should be obtained
from the Department of Commerce (now Manly Hydraulic Laboratory, part of the
Department of Public Works and Services).
2.8.2 Procedures Within Other States And Countries
The following section will outline the techniques adopted by some States within
Australia, as well as New Zealand and the United States of America. From this brief
overview it can be seen that there are only a handful of techniques that are used for
determining a tidal boundary. Accuracies of these methods are discussed later.
The determination of a tidal plane using the ratio of tide ranges observed at two
stations is a widely used method. Methods range from the Range Ratio method (ISG
1976) or the Standard Method widely used in the United States of America (Cole
1997 & NOAA 2003). There are other ratio methods listed in SOM, 1996 Cole, 1997
and NOAA, 2003 that have different tidal characteristics. Simplified methods for

Chapter 2 – Literature Review
Determination of Mean High Water Mark 18
determining tidal planes, based on tidal range ratios are setout in the South Australian
Manual of Survey Practice (Section 12.4, Methods For Determining MHWM). The
South Australian Manual of Survey Practice and Hanna (1989) both discuss using
methods that use the water level to transfer tidal benchmarks without considering
tidal gradients.
The use of statutory heights on a recoverable datum, preferably Australian Height
Datum (AHD), for determining MHWM is used widely throughout Australia. It is
referred to in the ISG Manual, South Australian Manual of Survey Practice (Section
12, Natural Boundaries) and Western Australian Survey and Plan Practice Manual
2003 (Chapter 5, Surveys of Water Boundaries). In the USA it is also widely used,
Cole (1997).
Levelling from a local tide gauge is a prescribed method in Queensland, Western
Australia, South Australia, New Zealand and the USA. All referred to in their
manuals as mentioned above.
Biological methods of identifying MHW are referred to in the New Zealand
Cadastral Survey Guidelines (Section 3 of part 11.5.12 -Tidal Boundaries) and South
Australian Manual of Survey Practice (Section 12, Natural Boundaries). The tide
coordinated aerial photograph method (Cole, 1997) combined with vegetation and
ground truth points is also an accepted method used in the USA.
2.9 Accuracies In Determining Mean High Water
The horizontal uncertainty in the location of a boundary is directly proportionate to
the vertical error of the tidal datum calculated and surveyed out in the survey field
(NOAA, 2003 & Songberg, 2004). The accuracy of any procedure needs to be known
so it can be used appropriately when surveying.
Chapter 2 – Literature Review
Determination of Mean High Water Mark 19
2.9.1 Accuracies When Levelling From A Benchmark
Even with an Australian Height Datum (A.H.D.) value for MHWM, Blume (1995)
notes that the integrity of the original levelling or relevelling method of adjustment
and general movement of the surrounding area can challenge the reliability of the
benchmarks being used. Blume (1995) also points out that the A.H.D. value given for
MHWM for one side of a bay or river may not be accurate for the other side.
Harcombe (1985) and Hanna (1989) also note some of the pitfalls in using this
method. Accurate methods and adjustments may be used to transfer a datum across
the water body but a misclose may result if it is compared with other established
benchmarks. Both sides of the water body may have fully adjusted benchmarks but
both sides may not be connected or compatible with each other.
The assumption that an A.H.D. level is not accurate around all areas of an estuary or
lake is also examined by Songberg (2004). He points out that a level network to
establish A.H.D. that surrounds a water body may be many kilometres long and that
the ‘associated errors may induce an apparent tidal difference where there is none’.
Songberg demonstrates the above potential problem using an area around Lake
Macquarie. Lake Macquarie is a large tidal lake just south of Newcastle in New
South Wales. It has a narrow channel that restricts the flow from the lake out into the
sea and vice versa.
The approximate AHD level for MHW along the shore of Lake Macquarie can range
between 0.75 to 0.150 metres AHD. There is a sparse network of tide gauges around
the lake that have been tied to an AHD level network (see figure 5) and from this
tidal gradients have been calculated. As seen on figure 5 the linkage between gauges
is reliant on a level network run around the perimeter of the lake. If the level run was
started from Swansea near the lake’s entrance and followed the perimeter of the lake
around to the western side to Dora Creek the resulting order of accuracies would be
up to ± 55mm (3rd order accuracy). The approximate MHWM levels for Lake
Macquarie are within the accuracies required. Although the western foreshores of

Chapter 2 – Literature Review
Determination of Mean High Water Mark 20
Lake Macquarie are relatively flat and any variation in height can make a significant
difference in the location of the MHWM (Ferrier, 1985). As discussed in NOAA,
2003, significant horizontal errors are a function of both the slope of land and the
uncertainties in the position of a tidal plane.
Figure 5 Lake Macquarie, New South Wales (Songberg, 2004)
Songberg (2004) questions the accuracy of A.H.D values for MHWM supplied by
Manly Hydraulic Laboratories (MHL), part of the Department of Public Works and
Services, as they do not indicate what height accuracy the values are. At present
MHL are considering an accuracy of ± 0.05 metres with all MHWM determinations

Chapter 2 – Literature Review
Determination of Mean High Water Mark 21
issued (P. Davidson, per. com., 24/7/2004). Blume (1995) cautions that AHD values
must be confirmed for a tide gauge that is used for establishing MHWM so as to
comply with survey regulations. The Crown or other approving authorities will
supply MHWM values on AHD for tidal boundary determination. Therefore caution
must be taken when given data from approving authorities, as there is no indication
of how accurate the supplied height is.
The use of the ‘Levelling From A Bench Mark’ method cannot be used within
estuaries or streams unless reliable tidal gradients can be obtained, Harcombe (1985)
and Hanna (1989). The Manual of the New South Wales Integrated Survey Grid
(1976) demonstrates that differences of up to ± 0.10 metre over relative short
distances. Tidal gradient issues are further discussed in section 2.9.3.
2.9.2 Accuracies When Levelling From Local Tide Gauge
So as to obtain an accurate result the ISG Manual suggests that tide observations
should be taken over a 12-month period to minimise the affects of the ‘influences
tending to disturb the rhythmical flow of the tide’ (ISG, 1976). It also provides a
simpler alternative to the above by observing tides for one lunation of 29 days. The
manual states that the determination is approximate but then quotes an accuracy of ±
0.015metres for height. Songberg (2004) states that ‘the manual does not cite any
references as to where or how this accuracy is derived’.
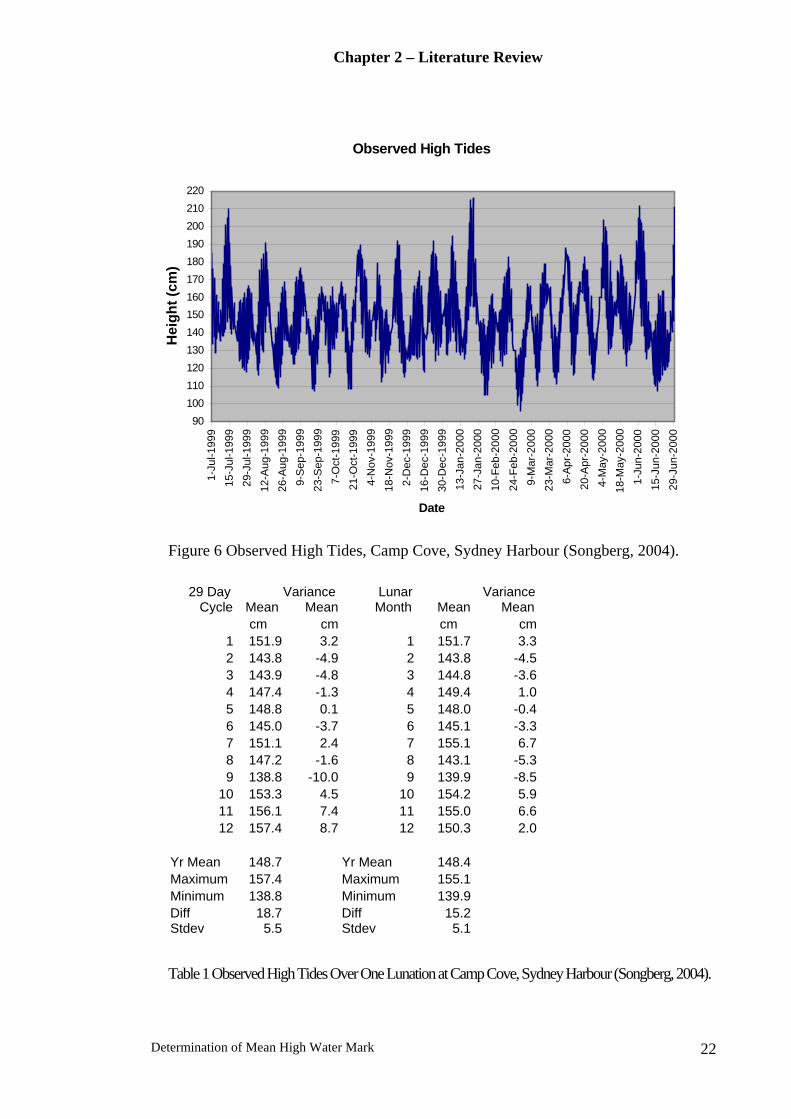
Figure 6 shows all of the spring and neap tidal observations for Camp Cove, Sydney
Harbour, during the period starting 1 July 1999 to 30 June 2000. A yearly and lunar
month average can be calculated (Songberg, 2004). The chart shows an 80 cm
variation in the tidal range from a low of 96cm to a high of 216cm. A comparison is
shown in Table 1 illustrating the means of high tides over a series of 29-day lunation.
Also shown is a 29 day 12 hours 44 minutes and 2.8second mean values, the precise
time the moon takes to complete one phase.
Chapter 2 – Literature Review
Determination of Mean High Water Mark 22
Observed High Tides
90100110120130140150160170180190200210220
1-Ju
l-199
915
-Jul
-199
929
-Jul
-199
912
-Aug
-199
926
-Aug
-199
99-
Sep
-199
923
-Sep
-199
97-
Oct
-199
921
-Oct
-199
94-
Nov
-199
918
-Nov
-199
92-
Dec
-199
916
-Dec
-199
930
-Dec
-199
913
-Jan
-200
027
-Jan
-200
010
-Feb
-200
024
-Feb
-200
09-
Mar
-200
023
-Mar
-200
06-
Apr
-200
020
-Apr
-200
04-
May
-200
018
-May
-200
01-
Jun-
2000
15-J
un-2
000
29-J
un-2
000
Date
Hei
ght (
cm)
Figure 6 Observed High Tides, Camp Cove, Sydney Harbour (Songberg, 2004).
29 Day Cycle Mean
Variance Mean
Lunar Month Mean
Variance Mean
cm cm cm cm1 151.9 3.2 1 151.7 3.32 143.8 -4.9 2 143.8 -4.53 143.9 -4.8 3 144.8 -3.64 147.4 -1.3 4 149.4 1.05 148.8 0.1 5 148.0 -0.46 145.0 -3.7 6 145.1 -3.37 151.1 2.4 7 155.1 6.78 147.2 -1.6 8 143.1 -5.39 138.8 -10.0 9 139.9 -8.5
10 153.3 4.5 10 154.2 5.911 156.1 7.4 11 155.0 6.612 157.4 8.7 12 150.3 2.0
Yr Mean 148.7 Yr Mean 148.4 Maximum 157.4 Maximum 155.1 Minimum 138.8 Minimum 139.9Diff 18.7 Diff 15.2 Stdev 5.5 Stdev 5.1
Table 1 Observed High Tides Over One Lunation at Camp Cove, Sydney Harbour (Songberg, 2004).

Chapter 2 – Literature Review
Determination of Mean High Water Mark 23
From the mean value of twelve lunations for one year, it can be seen that the
accuracy quoted by the Manual of the New South Wales Integrated Survey Grid of
± 0.015metres cannot be achieved. Some differences are up to 0.1 metres (shown in
the variance mean columns), which is seven times greater than the required accuracy.
There is a possibility that a surveyor could go to a site in one period of lower mean
value and disagree by as much as 0.19 metre with another surveyor who fixed the
mean high water during a period of high mean value.
Songberg (2004) and Blume (1995) demonstrate the variation in MHW, as shown in
the Figure 7, over a period of approximately 80years. The MHW varies from a low of
1.38 metres to a maximum of 1.56 metres, which is a difference of approximately 0.2
metres. The largest variation from one year to the next is 0.083 metres. It is possible
for a surveyor to establish a boundary one year and to find the next year that it has
moved up or below the original determination the next.
MHW FORT DENISON
y = 0.001x + 1.41
y = 0.0008x + 1.4276
1.36
1.38
1.4
1.42
1.44
1.46
1.48
1.5
1.52
1.54
1.56
1918
1922
1926
1930
1934
1938
1942
1946
1950
1954
1958
1962
1966
1970
1974
1978
1982
1986
1990
1994
1998
2002
YEAR
AH
D
MHW 19MHW
Linear (19MHW) Linear (MHW)
Figure 7 Mean High Tide at Fort Denison, Sydney Harbour (Songberg 2004)

Chapter 2 – Literature Review
Determination of Mean High Water Mark 24
Another problem faced by a surveyor determining the mean value for MHWM is that
most tidal data supplied is at least a couple of years old. MHWM should be
determined at the location at the time of survey (Hallmann 2004 pp13.39 &
Songberg, 2004). If the surveyor does not use measurements at the time of survey,
and they use the values that are out of date, this could cause considerable error as
described above. Cole (1997), NOAA (2003) & Songberg (2004) suggested that it is
more desirable to recalculate the more current epoch than rely on old published data
that has been supplied by controlling authorities. NOAA (2003) and Songberg (2004)
suggest the use of either the 19 year average mean or the trend line determined over
the longest possible recorded history of a tide gauge to be the most reliable estimate
of MHWM. Harcombe (1985) and others site the case, City of Los Angeles v Borax
Consolidated Limited 1935, as stating that 19 years is a sufficient span of observation
time to determine MHWM to a degree of certainty. Manly Hydraulic Laboratories at
present use 10-19 year averages and are now looking at introducing an adjustable
yearly MHWM level to counter the affects of sea level rise (Judge, 2004, per com.,
20 August).
Globally tide gauges have indicated a rise in sea level of between 0.1 to 0.25 metres
over the last century (Denys and Hannah, c.1998.). As shown on figure 8 there is a
predicted rise in the sea level of approximately 0.5 metres in the next 50 years (IPCC,
1995).
The recommended practices for calculating a tidal datum are discussed in NOAA,
(2003,) Cole (1997) and DLWC (2003). As mentioned previously, the averaging of
19 years of tidal data is seen as the most accurate estimate of MHWM. The standard
deviation of the calculated result is in the 0.01 to 0.02 metres range for this period of
time (NOAA, 2003). If shorter observation times are required then tidal data is
averaged over this time and compared with the tidal data of the same period from an
established gauge with at least 19 years of records (NOAA, 2003).

Chapter 2 – Literature Review
Determination of Mean High Water Mark 25
1.0
0.8
0.6
0.4
0.2
0.02000 2020 2040 2060 2080 2100
Year
High range
Low range0.12m
0.48m
Sea
Leve
l Ris
e (m
etre
)
Figure 8 – Rise in sea level (Watson, 2004)
The use of an in-situ tide gauge is recommended by Cole (1997) and Harcombe
(1985) as giving a ‘better estimate’ of MHWM. Blume (1994) questions the real
value of using a local tide gauge in determining a tidal value, due to the commercial
cost and the delivery time frame of a survey plan. Harcombe (1985) discusses the
need for portable automatic solid-state tide gauges that can record one lunation of
tidal data for mean high water mark determinations.
The definition of MHWM adopted by different bodies is also a matter of concern as
explained by Blume (1995) and Songberg (2004). The exclusion of some tidal
observations in the calculating of MHWM may not be within the definition as handed
down by court case, Attorney General v Chambers, this being the accepted legal

Chapter 2 – Literature Review
Determination of Mean High Water Mark 26
definition (see chapter 4.2). All tides, except those in flood or extreme conditions, are
considered in the calculation of a MHWM plane (DLWC, 2003 & NOAA, 2003).
This accuracy issue is faced by all of the methods when determining and calculating
a MHWM plane.
2.9.3 Accuracies Using Range Ratio
In theory the relationship of MHW along any estuary or coastline is constant over
time (Songberg, 2004). Travelling up the coast or along an estuary the tidal gradient
would rise or fall in a ratio that is constant but not necessarily equal between
different locations. Figure 9 depicts what the tidal gradient should look like over
time.
Figure 9 Ideal Tidal Gradient
Using the tidal gradient information Songberg (2004) demonstrates that the
relationship between gauges is not a consistent relationship, which the range ratio
method relies on. He explains that there is over a 0.1 metre variation between the 10-
year mean and the MHW for any one-year. Taking the highest and lowest values
there is over a 0.2 metre difference in MHW levels. Using this data surveyors would
find that the ratio varies from year to year and hence there is movement in the
boundary.
Songberg (2004) continues to demonstrate the MHW gradients along the New South
Wales Coast by using Middle Harbour, Sydney, as a reference gauge and assigning

Chapter 2 – Literature Review
Determination of Mean High Water Mark 27
the other gauges along the coast as field gauges. Using the yearly MHW spring,
MLW spring and the10 year average for mean sea level each yearly MHW was
calculated using the range ratio method from Sydney. The Manual of the New South
Wales Integrated Survey Grid states that ‘fairly accurate values of mean high water’
can be achieved when observing one day’s semi diurnal tidal range when transferring
the tidal plane using the Range Ratio method. As seen in figure 10, this may not be
the case as variations of up to 0.2 metres may occur over very short periods of time.
To increase the accuracy of this method, use simultaneous observation from various
established gauges with at least 19 years of tidal records (Cole 1997 & NOAA 2003).
MHW gradient NSW Coast
0.30.350.4
0.450.5
0.550.6
0.650.7
1990
/91
1991
/92
1992
/93
1993
/94
1994
/95
1995
/96
1996
/97
1997
/98
1998
/99
1999
/00
Year interval
Hei
ght (
AH
D)
Brunswick Heads Yamba Coffs HarbourSW Rocks Port Macquarie Crowdy HeadPatonga Middle Harbour Crookhaven headsJervis Bay Clyde River Eden
Figure 10 Tidal Gradients Along the New South Wales Coast (Songberg, 2004).

Chapter 2 – Literature Review
Determination of Mean High Water Mark 28
Figure 11 Tidal datum heights along Sesquehanna River, USA (Cole, 1997, pp.20)
Figure 11 shows that local variations in tidal gradients can also change from bank to
bank along an estuaries or streams (Cole, 1997). Therefore the accuracy of
transferring a MHWM level from one side of an estuary to another is questionable.
Cole (1997) and NOAA (2003) note that vertical datum should not be transferred into
areas of differing hydrographic characteristics. This could be an estuary leading into
a bay or a tide gauge in the ocean being used to determine the level within a harbour.
The Manual of the New South Wales Integrated Survey Grid also advises that the
accuracies of observation can be affected by abnormal weather or flood conditions
and that observations of tides should be taken at periods of spring tide at the time of
new and full moons.
2.9.4 Other Methods
Tidal coordinated aerial photographs can be used in areas where dense vegetation is
not obscuring the land/water interface Cole (1996). Harcombe (1985) and Horlin
(c.1990) report that remote sensing techniques using black and white infrared serial
photography have been used to accurately locate both MHW and MLW. There is no
mention of what accuracies were achieved. Cole (1996) reinforces the benefits of

Chapter 2 – Literature Review
Determination of Mean High Water Mark 29
using aerial techniques as field staff and equipment in remote areas would be an
expensive exercise. There are many inherent inaccuracies in digital data, e.g scale;
this combined with physically realising a water boundary makes the use of aerial
photographs for cadastral purposes extremely difficult. Hirst &Todd (2003) adds that
it is difficult enough to determine a high tide line of a beach within 2-5 metres on the
ground and therefore even more so from the air.
The use of the biological profile methods in conjunction with remote sensing
techniques are accepted methods used within the United States of America,
(Harcombe 1985 & Cole 1997). It is claimed in the United States that the
determination of MHW can be accurately positioned when using the location of
mangroves and salt resisted marshes together with aerial photogrammetry (Maloney
and Ausness, 1974). In Victoria, there are two plant types, White Mangrove growing
below Mean High Tide and salt marsh located between Mean High Tide and Spring
Tide. The seaward side of salt marsh is precise for Mean High Tide (Sherwood, 1976
as cited by Blume, 1995). The Surveyors Board of Victoria does not accept this
approach as being accurate (B Ross 2004, per comm., 22 July). The South Australian
Manual of Survey Practice also mentions that the seaweed line method is to be
avoided by surveyors not experienced in determining MHWM. They should choose
more objective methods. The top of oyster growth about a pier is very close to the
MHW line but at present there is no evidence on the potential accuracy of this
biological indicator (Songberg, 2004).
The vegetation test may be combined with the locating of control points by field
survey methods to provide interpolation from aerial photography of the line between
points, therefore eliminating gross errors and achieving higher accuracies (Horlin,
1990). Maloney and Ausness (1974) claim that the use of this technique was more
accurate and economical than field surveys. Research by Freedman & Higgins,
c.2001 suggests that there are positional errors in tidal boundaries where biological
indicators are used. Songberg (2004) suggests that further studies on the accuracies
of boundary determination are required before such methods are adopted.
Chapter 2 – Literature Review
Determination of Mean High Water Mark 30
Hirst &Todd (2003) state that even if tidal variations are allowed in the
determination of a tidal boundary from one point to another, the issues of instability
and irregularity in terminology and techniques, result in inherent uncertainty.
2.10 Summary: Chapter 2
This review has called upon a breadth of material available which provides a good
indication of the complexities involved in determining an ambulatory boundary
within New South Wales. The research project has by no means discussed all the
issues faced when assessing a tidal boundary determination but has addressed the
issues faced when determining a current MHWM.
The project methodology used for this research project is discussed in the next
chapter (chapter 3).

Chapter 3 – Research Method
Determination of Mean High Water Mark 31
CHAPTER 3
RESEARCH METHOD
3.1 Introduction
This chapter will describe the methodology that was employed to develop a
procedure manual for determination Mean High Water Mark (MHWM) within New
South Wales.
The aim of this chapter is to discuss the methods used in accessing information,
calculating tidal planes, techniques used in the field and presenting a survey plan and
report.
The analysis is organised into three sections. The first section describes what format
the manual will follow. The next section describes how the procedure manual for
determining MHWM was formatted. The final section explains how the procedure
manual was validated.
3.2 Procedure Manual Format
A procedure manual is a vital part of a surveying firm’s quality control system that
ensures that a task is performed with precise and clear instructions. It is important
that these procedures are flexible, so as to cope with the varying scenarios a MHWM
determination can offer.

Chapter 3 – Research Method
Determination of Mean High Water Mark 32
All procedures will be in accordance with the Surveying Regulations 2001 and
Surveyor General’s Directions 2004. The user of the manual will be able to
incorporate the procedure into the Department of Lands ‘Checklist for Water
Boundary Consent’ (Appendix B).
The format for the procedure manual is based on the Model Quality System Survey
Procedure Manual, written by the Association of Consulting Surveyors Australia
(ACS), for cadastral and topographic surveys. The ACS manual is widely used by the
surveying community around Australia and was seen as the best layout for this
procedure manual.
The Format for each part of the procedure manual will be as follows: -
• Procedure Title – very brief explanation of what the procedure covers.
• Purpose – a concise description of the procedure.
• Scope – explains what the procedure covers and does not cover.
Explains when the procedure should be used and not used.
• References – lists manuals and policies used in the procedure.
• Procedure - Data Search – acquiring all relevant information for
determining ambulatory boundary.
Field Survey – a step-by-step instruction on the
procedures to be followed.
Survey Plan and Report Preparation – requirement in
presenting boundary determination.
• Definitions – explains any technical term used in the procedure.
• Appendices – further information as required by the procedures.

Chapter 3 – Research Method
Determination of Mean High Water Mark 33
3.3 Mean High Water Mark Procedure
The following are the individual sections that will make up the procedure manual and
were selected as major parts for determining a tidal boundary.
• Search and locality information.
• Determining and positioning a tidal boundary.
• Survey plan and report requirements.
The following sections outline the preparation of the procedure manual in accordance
with legislation and recommended guidelines. All stages of the procedure manual
will require the surveyor’s signature and a date to verify the work has been done and
checklist completed.
3.3.1 Search And Locality Procedure
The establishing of a tidal boundary requires preliminary investigation before the
surveyor can visit the site. This will involve searching for geographical names,
property titles, historical survey plans, tidal data and benchmarks on Australia Height
Datum (AHD). This section is relevant to the procedure manual, as Clause 13 of the
Surveying Regulations 2001 states that: -
‘a surveyor must obtain all relevant information on public record
with government departments and public authorities necessary to
locate or relocate the boundaries of any land to be surveyed……’
Title, historical and geographical name searches are required to be undertaken on all
sites to be surveyed in order to ascertain who the owners of the land above and below
the Mean High Water (MHW) are and to determine if there are any encumbrances on
the title, such as leases of land below MHW or restrictions on the use of the land

Chapter 3 – Research Method
Determination of Mean High Water Mark 34
above MHW. The historical plan search will allow the surveyor to examine and re-
establish the original boundaries and MHWM. The procedure manual states the
various ways of obtaining the search. The user can access the information by the
following: -
• the Internet
• approved information brokers
• the search facilities within the Land Titles Office within the Land and
Property Information centre, Sydney
The method by which information will be obtained for all parts of the procedure
manual will be through the Internet. This is seen as the most accessible method of
obtaining information. As Internet addresses may change over time, the manual will
include mailing addresses. Figure 12 and 13 are examples of the many Internet sites
used in the procedure manual.
Figure 12 - Land Title Search Web Page, Department of Lands.
Chapter 3 – Research Method
Determination of Mean High Water Mark 35
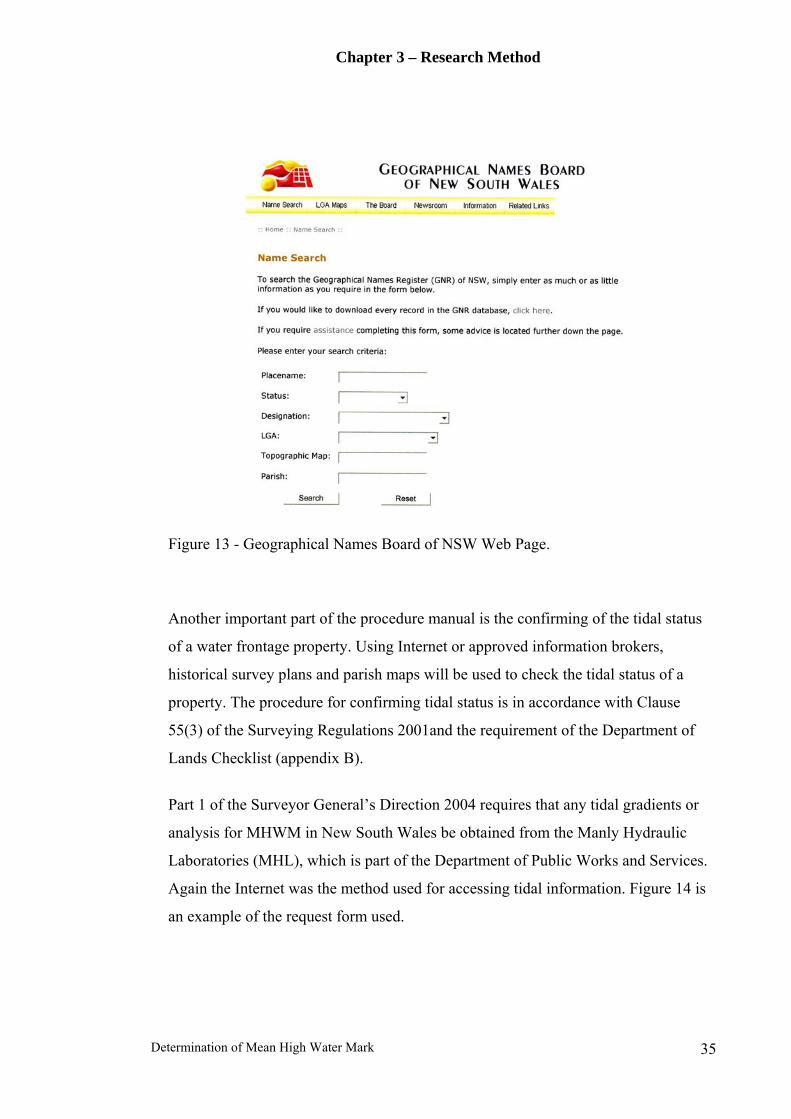
Figure 13 - Geographical Names Board of NSW Web Page.
Another important part of the procedure manual is the confirming of the tidal status
of a water frontage property. Using Internet or approved information brokers,
historical survey plans and parish maps will be used to check the tidal status of a
property. The procedure for confirming tidal status is in accordance with Clause
55(3) of the Surveying Regulations 2001and the requirement of the Department of
Lands Checklist (appendix B).
Part 1 of the Surveyor General’s Direction 2004 requires that any tidal gradients or
analysis for MHWM in New South Wales be obtained from the Manly Hydraulic
Laboratories (MHL), which is part of the Department of Public Works and Services.
Again the Internet was the method used for accessing tidal information. Figure 14 is
an example of the request form used.

Chapter 3 – Research Method
Determination of Mean High Water Mark 36
Figure 14 - Example of a Manly Hydraulic Request Form.
All tidal data was checked for anomalies, such as the effects of local floods and other
hydrological influences and then related to a datum within its region, usually AHD.
Tidal data was filtered for tidal anomalies using MHL analysis software package
called INTERACTIVE program DBSPR V1.0.
Part 7.2.2 and 8 of the Surveyor General’s Direction, 2004 requires that all MHWM
determinations be referenced to AHD and Part 5 of the Surveyor General’s Direction,
2004 requires that all plans of survey, including redefinitions, are connected to
established marks with Map Grid Australia (MGA) coordinates. This information is
supplied by the Survey Control Information Management System (SCIMS) at the
Land and Property Information (LPI) centre and can also be accessed via the Internet.

Chapter 3 – Research Method
Determination of Mean High Water Mark 37
3.3.2 Format For Determining And Positioning Tidal Plane
All surveying requirements that are setout in the procedure manual for determining
MHWM are in accordance with the Surveying Regulations 2001 and the Surveyor
General’s Direction (2004). The primary survey techniques used in the procedure
manual are those setout in part 6, section 22 of the Manual of the New South Wales
Integrated Survey Grid (1976). They are as follows:
1. Levelling from a benchmark.
2. Levelling from a Local Tide Gauge.
3. The Range Ratio Method.
Research papers and studies were reviewed in the Chapter 2 – Literature Review – to
assess the current state of knowledge in the survey techniques used to determine
MHWM. The main issue addressed was the accuracies that could be expected when
using varying survey techniques. It was seen that all of the techniques referred to in
the Manual of the New South Wales Integrated Survey Grid had major problems
achieving the accuracies claimed by the manual.
The use of an AHD benchmark to determine MHWM will be the first choice in the
procedure manual when a statutory authority has a reliable height for MHWM. This
height is calculated from approximately 10 to 19 years of recorded tidal data and is
accurately tied to Australian Height Datum (AHD). After this the use of a local tide
gauge, Range Ratio method or a combination of both will be controlled by the
availability of tidal data or the distance the datum must be transferred from the
benchmark or tide gauge.
To allow for a consistent answer when calculating a MHWM the tidal data of a
subject site will be compared to the tidal data of an established long-term tidal gauge

Chapter 3 – Research Method
Determination of Mean High Water Mark 38
(19 years of records/ 10 years minimum) for the same period. It is accepted that 19
years is a sufficient time to determine MHW to a degree of certainty (refer 2.3 &
2.9). The method adopted by the procedure manual was the use of reliable tidal data
recorded for at least 10 to 19 years; over 19 years a standard deviation for a MHWM
determination will be around ± 0.02 metres (refer Chapter 2.9.2).
The Manual of the New South Wales Integrated Survey Grid (1976) refers to the
‘Levelling from a Local Tide Gauge’ that has been established for one lunation. This
can lead to significantly different answers over time, as referred to above. The
procedure manual will adopt the principle that the MHWM should be calculated over
a long period of time. Therefore the ‘Levelling from a Local Tide Gauge’ method
will require an adjustment to correlate the MHWM calculated at the subject site to
the long-term reading of an established tide gauge. The only difference in this
technique to the Range Ratio method is that it uses a lunation (or more) of tidal data
from a local tide gauge. The Range Ratio method only requires consecutive high and
low tides. The procedure manual will require at least three consecutive tides to be
measured for the Range Ratio method to improve the accuracy of a determination. As
well as being used to establish a height the Range Ratio method will be used in the
procedure manual for verifying a MHWM height. This will involve recalculating the
height at a different time other than the time of survey.
When it was required to observe and compute simultaneous tidal information for a
local and control tide gauge, the National Oceanic and Atmospheric Administration
(NOAA) method of computing tidal datums at short-term stations was used.
The method used by the NOAA is a follows:
1) Select a time period for simultaneous observations at the local tide gauge and
an established tide gauge. Select an established tide gauge (control) with a
minimum of 10 years of tidal data. Ensure the local site and control are
similar in tidal characteristics and surroundings.

Chapter 3 – Research Method
Determination of Mean High Water Mark 39
2) Obtain data from both sites over the same period. Correct data for ambiguities
(i.e. flood affected, bad data, etc) and calculate tidal components for the
period at subject site. Methods used for calculating statistical data are
discussed further on. 3) Obtain the accepted tidal components for the control gauge from MHL. 4) Compute the ratios in the tidal parameters, using the Range Ratio formula
(see below), and apply differences to subject site data.
5) When calculating simultaneous observations a standard deviation of ± 0.03
metres or less should be achieved over three tidal cycles, for the
determination of a MHWM plane.
The following method was used in the calculation of mean differences and ratios in
tidal parameters between the subject site gauge to be surveyed and the established
tide gauge. The formulae and components are explained as follows.
Range Ratio Method Approx. MHW = M.T.L.2 + K1 + K2
Where K1 = M.T.L.0 – M.T.L.1
K2 = L.T.R. * O.R.2
2 * O.R.1
M.T.L.2 = Mean of observed High Water at site gauge (m) (M.T.L is Mean Tide Level).
M.T.L.0 = Long term value on the gauge of mean tide level at automatic gauge (m).
M.T.L.1 = Mean of observed High Water and Low Water at automatic gauge (m).
L.T.R = Difference between Mean High Water and Mean Low Water at automatic
gauge (m).
O.R.2 = Observed range at site gauge (m).
O.R.1 = Observed range at automatic gauge (m).

Chapter 3 – Research Method
Determination of Mean High Water Mark 40
The following statistics were used in the calculation of tidal datums for calculating
the mean tidal range and for assessing the precision of that value.
• The Mean – is the average of the observations in a sample. It is the sum of all
the data and divided by the total number of that data.
µ = x1 + x2 + …. + Xn
n
Where µ = mean, x = observation (m) and n = total number of observations.
• The variance – is a measure of how spread out the distribution is. It is
calculated as the average squared deviation of each number from its mean.
σ2 = 1 Σ ﴾ x1 - µ ﴿2
n - 1
Where µ = mean, x = observation (m), n = total number of observations,
and σ2 = variance
• The standard deviation – measures spread by looking at how far the
observations are from their mean. It is calculated as the square root of the
variances.
___
σ = √ σ2
Where σ2 = variance and σ = standard deviation
For the above computations, Microsoft Excel worksheets were used for the ease of
arranging data and calculating statistical information.
A tidal staff placed in a protected position out in the tidal zone, will be used for
measuring high and low water levels out on site. The measuring of the water level
where it intersects the land is not seen as accurate due to wave and wind disturbance
on the surface of the water (although in some circumstances this may be the only
Chapter 3 – Research Method
Determination of Mean High Water Mark 41
method). To ensure that the correct levels for low and high water are obtained
observations will be taken 30 minutes before and after predicted tides as shown on
tide charts.
The method used for establishing a MHWM boundary line out on site was by using
the staking method. The staking method involved differentially levelling from an
established benchmark that was related to a level for MHWM. Differential levelling
is the operation of determining differences of elevation by measuring vertical
distances directly on a graduated staff with the use of a levelling instruments such as
a dumpy level or theodolite (USQ, 2000). This MHWM level was transferred to the
foreshore by assuming that MHW is a contour in the immediate area and tracing that
contour by conventional levelling methods. This technique is used in the procedure
manual and is in accordance with the survey requirements of parts 3 to 5 of the
Surveying Regulations 2001 and Surveyor General’s Directions, 2004.
The use of differential levelling in locating the position of the MHWM was used in
the procedure manual. This allowed the surveyor to physically see the position of the
boundary at the time of survey and therefore allows for any adjustments to be made
on the position of the determination. It is common to adjust tidal boundary positions
on flat or irregular foreshores. Survey field techniques for differential levelling used
in the procedure manual are in accordance with company procedures and Surveying
Regulations.
3.3.3 Establishing Previous Mean High Water Mark
The procedures are prepared in accordance with Surveyor General’s Direction
2004 parts 3, 4, 6, 7 and 10. These all relate to the requirements for any
cadastral survey from ‘Controls for Cadastral Surveys’ through to the
requirement of the ‘Surveying of Crown Land’. Also adhered to was the

Chapter 3 – Research Method
Determination of Mean High Water Mark 42
legislation setout by the Surveying Regulations 2001 dealing with cadastral
surveys and natural boundaries.
The plan of redefinition was calculated on a survey office software package called
Liscad 6.2 and exported to AutoCAD for the drafting of the final plan
3.3.4 Format For Survey Plan And Report
Plan preparation was in accordance with the draft Surveyor General’s Directions
2004 for ‘Water as a Boundaries Procedures’ and Registrar General’s Directions for
Deposited Plans. All references to drafting requirements will be for either computer
aided drafting (CAD) or free hand drafting.
Where consent is required for a change in position of MHWM, a comprehensive
report is required in accordance with the Part 7.2.2 and 8.2 of the Surveyor General’s
Directions No.6 (2004) and Clause 58(2) of the Surveying Regulations 2001. The
procedure manual will format this report in accordance to the information
requirements set out by the above noted directions and regulations. The procedure
manual will not cover all aspects of erosion and accretion or legal precedence upon
MHWM claims, but it will give advice on basic principles and where this
information and advice should be obtained.
3.4 Validation Of Procedures
A case study was selected to validate the procedure manual for determining MHWM.
This would allow any shortcomings in the procedure manual to be found and to be
discussed.
Patonga, on the Central Coast of New South Wales, was the site chosen because of
the ease of access to the MHWM from the public reserve, which surrounds the entire
peninsula. Under the guidance of the procedure manual an optimum time was chosen
to survey the site.

Chapter 3 – Research Method
Determination of Mean High Water Mark 43
Under the guidance of the procedure manual the position of the current MHWM was
established. All methods for positioning a MHWM boundary were used in the
procedure manual to evaluate the accuracy of the determination. An authorized AHD
height for MHWM was used to define the boundary. This determination was checked
by using data collected from the local Patonga tide gauge, which was calculated and
adjusted against an established tide gauge in Middle Harbour, Sydney. The last
technique used to validate the position of the MHWM, was the use of the Range
Ratio method. This was achieved by measuring three different gauge sites (Patonga,
Ettalong and Middle Harbour) and calculating the ratios between each site.
The position of the previous MHWM will be established using normal cadastral
techniques. This will include looking for original survey marks and reinstating the
subject boundaries. Comparisons can be made between the original and current
position of the MHWM to see if a change in position has occurred. The procedure
manual will recommend what course of action is required within current guidelines
and legislation.
3.5 Summary Chapter 3
This chapter has discussed the methods used for constructing a procedure manual for
establishing a MHWM boundary. The procedure manual discussed in Chapter 4 can
be used as part of a company’s quality control system. This will allow employees to
formally check that each part of a determination complies with both legislation and
the firm’s standards.

Chapter 4 –Procedure Manual
Determination of Mean High Water Mark 44
CHAPTER 4
PROCEDURE MANUAL
4.1 Introduction
This chapter will set out the procedures to be followed to allow a surveyor to
establish or re-establish a Mean High Water Mark (MHWM) boundary within New
South Wales. These procedures can be part of any surveying company’s quality
control for establishing a tidal boundary.
The aim of this chapter is to establish a clear and well-organised set of procedures
that allow the user to determine a MHWM boundary.
The manual will be structured to allow the surveyor to be aware of the benefits and
limitations of each technique used to determine a MHWM, while combining
recommendations with legislation and guidelines required by the State’s controlling
authorities.
4.2 Procedure For A Mean High Water Mark Survey
4.2.1 Purpose
This document describes the tasks to be undertaken when carrying out a Mean High
Water Mark (MHWM) survey within New South Wales. In addition to ensuring that
all client requirements are addressed, it is intended to ensure that requirements of the
Department of Lands, Land Titles Office and any statutory authorities are satisfied.

Chapter 4 –Procedure Manual
Determination of Mean High Water Mark 45
4.2.2 Scope
The following procedures will cover all classes of a MHWM determination survey,
undertaken by a firm, which includes boundary identification surveys, detail surveys
and plans of MHWM redefinition. Activities associated with initial client dealings,
establishing job files, and invoicing are detailed in the company’s procedures for
dealing with client instructions and project administration.
4.2.3 References
4.3 - Procedures for Data Search Requirements.
4.4 - Procedures for Levelling From A Bench Mark.
4.5 - Procedures for Levelling From A Local Tide Gauge.
4.6 - Procedures for using Range Ratio Method.
4.7 - Procedures for Levelling & Positioning a Horizontal Plane.
4.8 - Procedures for Establishing Previous Mean High Water Mark.
4.9 - Procedures for Plan Presentation.
4.10 - Procedures for Reporting on Determination.
4.2.4 Responsibilities
The Principal shall not approve any Procedure that does not use the following
format.
Approved by:___________________
Date:___________________
Chapter 4 –Procedure Manual
Determination of Mean High Water Mark 46
4.2.5 Client Instructions
Determination of client requirements, cost estimates, indexing, allocation of the
survey, invoicing and archiving of files shall be undertaken in accordance with
company’s procedures for client instructions and project administration. A job file
for each survey will have been created by the receptionist and placed in the work
pending file in accordance with company’s procedures for client instructions and
project administration. This procedure manual is to be used to accurately determine
the position of MHWM. Refer to Clause 29 of the Surveying Regulations 2001 for
guidance in surveys not requiring strict accuracy while using this manual.
4.2.6 Data Search
The Searcher shall undertake a data search for each job to fulfil requirements
described on the company’s job instruction form. Data search procedures are
described in 4.3.
4.2.7 Field Survey
The project surveyor shall undertake the field survey in accordance with survey
techniques explained in procedures 4.4 to 4.7. For deciding on which method to use to
establish MHWM refer to the procedure flowchart (figure 15 on page 49). Conduct of
the survey and marking requirements shall comply with the company’s standards,
Surveyor General’s Directions and the Survey Act and Regulations. All equipment
used shall have a current calibration/testing status in accordance with company’s
procedures for measuring equipment testing and maintenance. Where the project
surveyor uses any equipment other than the permanently allocated equipment set, this
shall be noted in accordance with company procedure.
Approved by:___________________
Date:___________________

Chapter 4 –Procedure Manual
Determination of Mean High Water Mark 47
4.2.8 Boundary Definition For Reinstating Previous MHWM
All fieldwork and computations required in the reinstatement of boundaries will be in
accordance will Surveying Regulations, Surveyor General’s Directions and company
procedures. See 4.8 for specific instructions for reinstating previous MHWM
position.
4.2.9 Plan Preparation
Recommended practices for detail and identification surveys and statutory
requirements for survey plans of MHWM redefinitions are setout in procedure 4.9.
4.2.10 Survey Reports
The project surveyor will be required to prepare a survey report with all MHWM
determinations - see procedure 4.10.
Approved by:___________________
Date:___________________

Chapter 4 –Procedure Manual
Determination of Mean High Water Mark 48
4.2.11 Definitions
MHWM Mean High Water Mark
AHD Australian Height Datum
SGD Surveyor General’s Direction, 2004
MGA Map Grid of Australia
LPI Land and Property Information Centre
LTO Land Title Office
MPAD Maritime Property & Assets Division
MHL Manly Hydraulic Laboratories
SCIMS Survey Control Information Management System
GPS Global Positioning System
CAD Computer Aided Drafting
4.2.12 Appendices
Registrar General’s Directions 2002
Surveyor General’s Directions 2004
Surveying Regulations 2001
Department of Lands Checklist 6.2 for ‘Water as a Boundary’
Survey Act and other relevant Acts and Regulations.
Manual of the New South Wales Integrated Survey Grid, 1976
Approved by:___________________
Date:___________________

Chapter 4 –Procedure Manual
Determination of Mean High Water Mark 49
Procedure Flowchart
Yes No
Yes
No
Use Levelling from a Tide Gauge Method see procedure 4.5
Use Range Ratio Method.
See procedure 4.6
Use Levelling from a Bench Mark Method
see procedure 4.4
Use company procedures for client instructions and project administration.
Proceed with data search requirements for determining MHWM position.
See procedure 4.3
Is there a MHWM datum within 1.5 km of the subject site and related to a benchmark
.
Is there a local tide gauge within 1.5 km of the subject site.
Establishing the position of the previous MHWM. see procedure 4.8.
Plan presenting requirements for a MHWM determination.
See procedure 4.9.
Reporting on the determination of a MHWM boundary.
See procedure 4.10.
Start here
Procedures for Levelling & Positioning a Horizontal Planesee procedure 4.7
Verify position of MHWMsee either procedures 4.4, 4.5 or 4.6
Figure 15 Procedure Flowchart Approved by:___________________
Date:___________________

Chapter 4 –Procedure Manual
Determination of Mean High Water Mark 50
4.3 Procedure For Data Search Requirements
Introduction - This is to give guidelines on the procedures that should be
followed when ordering a search and other information used for the
determining of a MHWM boundary within New South Wales.
Scope - The procedure following will encompass all cadastral search and tidal
information requirements when determining a MHWM for cadastral purposes
within New South Wales. This will include contact information, such as
Internet and mailing address, for land title search and tidal data.
Responsibilities - The Principal shall not approve any Procedure that does not
use this format.
Procedure
Checking Geographical Names: -
• Checking the geographical names of the site and adjoining water is accessed
by contacting the Geographical Names Board at the LPI (Appendix C) or the
website, www.gnb.nsw.gov.au/lgamap/search, and entering the required
information.
• Confirm procedure by marking ‘Y’ in items 1 and 2 in Checklist- 6
(Appendix B).
Acquiring Map Reference And Details: -
• All state survey marks have MGA coordinates of varying accuracies and can
be obtained from SCIMS at the LPI (Appendix C) or the Internet at
http://scims.lands.nsw.gov.au/scims.html. Joining fees and data costs can be
obtained from the website.
Approved by: ___________________
Date: ___________________

Chapter 4 –Procedure Manual
Determination of Mean High Water Mark 51
• Rough coordinates can be scaled from any topographic map with MGA
coordinates. This is sufficient for the approximate location of a site for the
purposes of the Department of Land.
• Confirm procedure by marking ‘Y’ in items 1.1 in Checklist- 6 (Appendix B).
Acquiring Search On Tidal Status: -
• References or symbols shown on historical survey plans must be checked
against Parish maps to confirm tidal status. This will also apply when a title
diagram does not show the tidal status of a water frontage. Parish maps can be
obtained from the LPI (Appendix C) or in a digitised format from the Internet
at http://www.lands.nsw.gov.au/MapsAndPhotos/ParishMaps/default.htm.
• When there are doubts on the tidal status of a water frontage, contact MHL
(Appendix C) to confirm the tidal status. The surveyor must observe at least
one tidal cycle out on site.
• Refer to part 4 of the Surveyor General’s Direction 2004 for marine water
bodies, such as lagoons, that have been judged non-tidal.
• Confirm procedure by marking ‘Y’ in items 2.1 in Checklist- 6 (Appendix B).
Data Search Information: -
• Title, registered and unregistered information can be obtained from the LPI
(Appendix C) or over the Internet via the Integrated Titling System at
http://www.lands.nsw.gov.au/Records/PropertyInformation/default.htm.
Search costs can be obtained from the website. Follow companies procedures
for ordering and checking data search.
• Confirm that the landward boundary of a reservation fronting tidal water has
been recorded by a plan of survey. Refer to Clause 57 (1 & 3) Surveying
Regulations 2001 for instructions if otherwise.
• Confirm procedure by marking ‘Y’ in items 3.1 to 3.4 in Checklist- 6
(Appendix B).
Approved by: ___________________
Date: ___________________

Chapter 4 –Procedure Manual
Determination of Mean High Water Mark 52
Benchmark Information: -
• Bench Marks on AHD can be obtained from the SCIMS at the LPI (Appendix
C) and can also be accessed via the Internet at http://scims.lands.nsw.gov.au
/scims.html. Joining fees and data costs can be obtained from the website.
• Search for the nearest accurate benchmark can be done by using either the
name or number of the survey mark or using the various arrays of coordinate
searches. An accuracy Class of “LD” or “B” or better should be obtained for
the benchmark (SGD – sec. 7.22 & 8.2).
• Confirm procedure by marking ‘Y’ in item 3.5.1 in Checklist- 6 (Appendix
B).
Acquiring Tidal Information For MHWM: -
• AHD reduced levels for MHWM can be obtained from either MHL or the
MPAD (Appendix C) for areas specified in Sections 7 & 8 of the Surveyor
General’s Direction 2004. Check that heights provided are on AHD (and at
what accuracy) or other datum. Request for information on any benchmarks
placed within the vicinity of the site to be surveyed.
• Check when the MHWM level was calculated, as old data will need to be
corrected for rise in sea level. Correct MHWM level for sea level rise by
subtracting the current year from the year the MHWM was calculated and
multiplying it by 2mm.
• Tidal data for calculating or predicting MHWM is accessed from the MHL
(Appendix C). Refer to procedure 4.5 and 4.6 for specific requirements.
Check that heights provided are on AHD (and at what accuracy) or some
other datum. If another datum is used check how it relates to the tide gauge.
Request for information on any benchmarks placed within the vicinity of the
site to be surveyed.
Approved by: ___________________
Date: ___________________
Chapter 4 –Procedure Manual
Determination of Mean High Water Mark 53
• Low tide is ideal for establishing the tidal plane out in the field. Tidal
predictions can be made using a tide chart or MHL have a website at
http://www.mhl.nsw.
gov.au/www/tidtab.htmlx. Time differences will have to be allowed for where
locations are outside Sydney Harbour as shown on tide charts and on the web
page (Appendix C).
• Confirm procedure by marking ‘Y’ in items 3.5.2 & 3.5.4 in Checklist- 6
(Appendix B).
4.4 Procedure When Levelling From A Benchmark
Introduction - The following are procedures when determining a MHWM
within close proximity of an established tide gauge that has been related to
AHD.
Scope - When a MHWM datum is known within an area and is related to a
benchmark then this procedure can be used. The datum must only be used
within the vicinity of where it is specified (approx 1.5 km). If tidal gradients
are not available, then judgement will have to be used when transferring a
MHWM datum from the coastline into an estuary or when transferring a datum
along an estuary. In these cases other methods may have to be used as outlined
in procedures 4.5 and 4.6. The following procedure is not to be solely relied
upon for the determination of MHWM and should be checked by other
methods as listed in the procedure manual.
Approved by: ___________________
Date: ___________________
Chapter 4 –Procedure Manual
Determination of Mean High Water Mark 54
References
4.2.7 - Field Survey
4.3 - Procedures for Data Search Requirements.
4.5 - Procedures for Levelling From A Local Tide Gauge.
4.6 - Procedures for using Range Ratio Method.
4.7 - Procedures for Levelling & Positioning a Horizontal Plane.
Responsibilities - The Principal shall not approve any Procedure that does not
use the following format.
Procedure
Information And Method: -
• All data requirements used for this procedure will follow Procedure 4.3.
• Where a MHWM and benchmark heights are related to the same datum, then
differential levelling will be used to transfer the MHWM datum to the site
requiring determination.
• The AHD value used as the bases of the definition for MHWM must be
verified by a closing level traverse between Permanent Marks that have
accurate heights of accuracy Class ‘LB’ or ‘B’ (SGD – sec. 7.22 & 8.2).
• Verifying MHWM Position - Procedure 4.5 or 4.6 can be used to verify that
no gross errors have occurred in the determination.
• If a subject site is between two adjacent tide stations on the same datum, then
the difference between MHWM elevations of the two stations can be
proportioned according to the distance the survey site is from either control
tide gauges. This can be used as an approximate check on MHWM
determination.
Approved by: ___________________
Date: ___________________
Chapter 4 –Procedure Manual
Determination of Mean High Water Mark 55
• Procedure 4.3 was used to determine an approximate time for a survey to
proceed. This will also allow the position of the established MHWM to be
verified by recording the time when water level intersects the determined
boundary. The tidal position can be confirmed by MHL supplying a time
when MHWM should occur at the site.
• Confirm procedure by marking ‘Y’ in items 7 in Checklist- 6 (Appendix B).
• Checks of determination should be within ± 0.10 metres. If error is greater
than this contact MHL for advice.
• Proceed to Procedure 4.8.
4.5 Procedure When Levelling From A Local Tide Gauge
Introduction - The following are procedures when determining a MHWM
using a local tide gauge.
Scope - When there is no MHWM on a known datum such as AHD then the
use of a local tide gauge should be used to determine the required plane. The
following procedure explains where to locate, what to record and how to
calculate a reliable MHWM plane. The MHWM datum must only be used
within the vicinity of the tide gauge (within 1.5km). When no tidal gradients
are available, then judgement will have to be used when transferring a MHWM
datum from the coastline into an estuary or when transferring a datum along an
estuary. In this cases use procedure 4.6. The procedure outlined below is not to
be solely relied upon for the determination of MHWM and should be checked
by other methods as listed in the procedure manual.
Approved by: ___________________
Date: ___________________

Chapter 4 –Procedure Manual
Determination of Mean High Water Mark 56
References
4.2.7 - Field Survey
4.3 - Procedures for Data Search Requirements.
4.6 - Procedures for using Range Ratio Method.
4.7 - Procedures for Levelling & Positioning a Horizontal Plane.
Responsibilities
The Principal shall not approve any Procedure that does not use the following
format.
Procedure
Information And Equipment -
• All equipment and field techniques are in accordance with procedures noted in
4.2.
• All data requirements used for this procedure will follow Procedure 4.3.
Positioning Of Local Tide Gauge And Benchmarks -
• Contact MHL (Appendix C) for installation of a tide gauge at a site. MHL
will collect and process data for a fee. Fee information is available on
application (Approx costs $3000 for one lunation i.e. 29 days).
• When locating a position for a local tide gauge the site must be protected
from the wind, affects of waves and any possible collision with boats. Attach
gauge to jetty or other permanent structure for rigidity and security.
Approved by: ___________________
Date: ___________________

Chapter 4 –Procedure Manual
Determination of Mean High Water Mark 57
• A benchmark will be placed along the shoreline close to the local tide gauge.
The difference between the tide gauge zero on the tidal staff (placed next to
the gauge) and benchmark will be determined. This benchmark will then be
related to MHWM when calculated and also used to check if the gauge has
been disturbed. The placement and installation of a benchmark near the tide
gauge is in accordance with company procedures.
• The tide gauge is to be calibrated in accordance with MHL procedures for
establishing temporary tide gauges and is to be automatically recorded in
accordance with MHL procedures for tidal data gauges.
Tidal Data Requirements: -
• When calculating a value for MHWM from a local tide gauge then
simultaneous observations with an established (control) tide gauge are
required. The control gauge must have a minimum of 10 years of tidal records
and have similar topographic and hydrographic surroundings (i.e. both tide
gauges are on the open coast or in an estuary).
• The gauge is required to measure all spring and neap high and low water
levels (day and night) for a minimum period of one full lunation. Tidal data
must be recorded every 15 minutes. A lunation being the period between
successive new moons (29.531 days).
• The affects of abnormal meteorological and tidal conditions should be taken
into account when deciding on a recording schedule and when assessing the
final data of the local tide gauge.
• In periods of floods, data may have to be ignored and re-observed. Care
should be taken that tidal field observations are not affected by flood
conditions, which can seriously affect the accuracy of the data.
Approved by: ___________________
Date: ___________________

Chapter 4 –Procedure Manual
Determination of Mean High Water Mark 58
• When calculating simultaneous observations a standard deviation of ± 0.03
metres or less should be achieved over three tidal cycles, for the
determination of a MHWM plane. Follow procedure 4.7 for calculating
differences between site and control tide gauges.
• In areas where there are no established tidal gauges, such as remote areas, the
length of observations should be taken over one lunation cycle or longer, so
that satisfactory results will be obtained.
• It is recommended when determining the tidal plane on a very flat foreshore
that several lunation periods should be observed.
• When MHL have been contracted to calculate the reduced level of MHWM
for a tide gauge, the following must be requested; tidal data analysis for
MHWM determination, the height of the benchmark placed near the gauge
and the height of zero mark on the staff placed near the tidal gauge. Also
confirm if there are any other benchmarks within the vicinity that the tide
gauge has been tied to for height. These could be used to check the tide
gauge.
• All levelling and locating of the MHWM position are in accordance with
Procedure 4.7.
Verifying Mean High Water Mark Position: -
• If earlier tidal data for tidal gauge is available then recalculate the tidal
lunation to check the current result. When data is not available it is
recommended that the observation of another lunation of tides take place to
check the results.
• Use procedure 4.7 to independently check that no gross error has occurred in
the determination.
Approved by: ___________________
Date: ___________________

Chapter 4 –Procedure Manual
Determination of Mean High Water Mark 59
• Procedure 4.3 was used to determine an approximate time for a survey to
proceed. This will also allow the position of the established MHWM to be
verified by recording the time when water level intersects the established
boundary. The tidal position can be confirmed by MHL supplying a time
when MHWM should occur at the site. Confirm procedure by marking ‘Y’ in
items 7 in Checklist- 6 (Appendix B).
• If a subject site is between two adjacent tide stations on the same datum, then
the difference between MHWM elevations of the two stations can
proportioned according to the distance the survey site is from either control
tide gauges. This can be used as an approximate check on MHWM
determination.
• Checks of determination should be within ± 0.10 metres. If the error is greater
than this contact MHL for advice.
• Proceed to Procedure 4.8.
4.6 Procedure When Using Range Ratio Method
Introduction: - This is to give guidelines on the procedures that should be
followed when determining of MHWM within New South Wales when using
Range Ratio Method.
Scope: - The procedure covers the steps to be followed when establishing a
MHWM value at a site requiring determination, using a distant established tide
gauge. The Range Ratio Method is used when the high and low water can be
measured for consecutive tides. Where possible procedures 4.5 and 4.6 should
be used in preference to this unless specified otherwise.
Approved by: ___________________
Date: ___________________

Chapter 4 –Procedure Manual
Determination of Mean High Water Mark 60
References
4.2.7 -Field Survey
4.3 - Procedures for Data Search Requirements.
4.4 - Procedures for Levelling From A Bench Mark.
4.5 - Procedures for Levelling From A Local Tide Gauge.
4.7 - Procedures for Levelling & Positioning a Horizontal Plane.
Responsibilities: -The Principal shall not approve any Procedure that does not
use the following format.
Procedure
Information And Equipment: -
• All equipment and field techniques are in accordance with procedures noted in
4.2.7.
• All data requirements used for this procedure will follow Procedures 4.3.
Determining Mean High Water Mark Plane: -
• Recording heights for high and low water levels should be taken where there
is relatively low wave and wind disturbance.
• Refer to 4.5 for the positioning of a local tide gauge.
• It is advisable that the observation of tides should be taken during a period of
spring tides at the time of new moon not affected by abnormal weather
conditions or floods. Use a tide chart to find times when new moons occur or
use MHL website at http://www.mhlnsw.gov.au/www/tidtab.htmlx.
Approved by: ___________________
Date: ___________________

Chapter 4 –Procedure Manual
Determination of Mean High Water Mark 61
• When calculating a value for MHWM using Range Ratio it is advisable that
the control gauge must have a minimum of 10 years of tidal records and have
similar topographic and hydrographic surroundings (i.e. both tide gauges are
on the open coast or in an estuary).
• Short-term observations of 2 or 3 tidal cycles can be recorded in a field book
when observed but long-term observations (lunation of tidal cycles) will
require the use of an automatic recording tide gauge.
• The following procedures will be followed when observing:
1.) Select time periods for simultaneous observations at the local tide gauge
and an established tide gauge. Select an established tide gauge (control)
with a minimum of 10 years of tidal data. Ensure that the local site and
control are similar in tidal characteristics and surroundings.
2.) Obtain data from both sites over same period. Correct data for ambiguities
(i.e. flood affected, bad data, etc) and calculate tidal components for
calculation over the period of time at subject site.
3.) Obtain the accepted tidal components for the control gauge from MHL.
M.T.L.2 = Mean of observed high water at site gauge (m) (M.T.L is Mean Tide Level).
M.T.L.0 = Long term value on the gauge of mean tide level at automatic gauge (m).
M.T.L.1 = Mean of observed high water a low water at automatic gauge (m).
L.T.R.= Difference between Mean high water and Mean low water at automatic
gauge (m).
O.R.2 = Observed range at site gauge (m).
O.R.1 = Observed range at automatic gauge (m).
4.) Compute the ratios in the tidal parameters, using the following formula,
and apply differences to subject site data.
Approved by: ___________________
Date: ___________________

Chapter 4 –Procedure Manual
Determination of Mean High Water Mark 62
5.) When calculating simultaneous observations a standard deviation of ± 0.03
metres or less should be achieved over three tidal cycles, for the
determination of a MHWM plane.
Range Ratio Method Approx. MHW = M.T.L.2 + K1 + K2
Where: - K1 = M.T.L.0 – M.T.L.1
K2 = L.T.R. * O.R.2
2 * O.R.1
• All levelling and locating of MHWM position are in accordance with Procedure
4.7.
Verifying Mean High Water Mark Position: -
• On a day that suits the conditions as previously stated use the Range Ratio
method to independently check that no gross errors have occurred in the
determination.
• Procedure 4.3 was used to determine an approximate time for a survey to
proceed. This will also allow the position of the established MHWM to be
verified by recording the time when water level intersects the established
boundary. The tidal position can be confirmed by MHL supplying a time
when MHWM should occur at the site. Confirm procedure by marking ‘Y’ in
items 7 in Checklist- 6 (Appendix B).
• Checks of determination should be within ± 0.10 metres. If the error is greater
than this contact MHL for advice.
• Proceed to Procedure 4.8.
Approved by: __________________
Date: __________________

Chapter 4 –Procedure Manual
Determination of Mean High Water Mark 63
4.7 Procedure For Levelling & Positioning A Horizontal Plane
Introduction: -This is to give guidelines on the procedures that should be followed
when levelling in the position of a MHWM plane and then locating these points
using survey techniques.
Scope: - Once the MHWM elevation has been calculated using either procedure 4.4
to 4.6, then this plane must be located on the ground as points. These points will be
located and related to survey control points.
References
4.4 - Procedures for Levelling From A Bench Mark.
4.5 - Procedures for Levelling From A Local Tide Gauge.
4.6 - Procedures for using Range Ratio Method.
Responsibilities: - The Principal shall not approve any Procedure that does not
use the following format.
Procedure
Levelling Position Of MHWM: -
• All equipment and field techniques are in accordance with procedures noted in
4.2.7.
• Any tide below MHW is ideal for establishing the MHWM boundary out in the
field. To access tidal information refer to procedure 4.3.
• The MHWM boundary will be located on the ground by levelling from a
benchmark that is related to the MHWM level. These level points will be
located by conventional levelling methods, which will follow the contour of
the foreshore in the immediate area.
Approved by: ___________________
Date: ___________________

Chapter 4 –Procedure Manual
Determination of Mean High Water Mark 64
• All levelling runs should be closed back onto the original benchmark or
another related benchmark to check for any gross errors.
• Benchmarks should be placed within the subject site and levelled to the
original benchmark or local tide gauge with AHD or other known datum. The
placement and installation of a benchmark is in accordance with company
procedures.
• Where possible connect any calculated MHWM determinations to a
benchmark with an AHD value with an accurate height of accuracy Class
‘LB’ or ‘B’ (SGD – sec. 7.22 & 8.2).
• Surveys using GPS equipment to establish the MHWM position, must use
approved GPS survey techniques to achieve an accuracy Class “B” or better
(Cl.23 - Surveying Regulations 2001)
Locating Horizontal Plane: -
• Once the MHWM contour has been determined stakes can be placed at
deflection points along the contour. These points represent the intersection of
a horizontal plane with land, which can then be located as a line for cadastral
purposes using conventional survey techniques.
• A control survey should be traversed adjacent to the MHWM so as to radiate
stakes representing points along the MHWM. To ensure that each point is
radiated the stake should be removed after it has been located.
• In accordance with Clause 9 & 55(5) Surveying Regulations 2001 all
encroachments and features along the MHWM should be located. This can be
done while locating the MHWM.
• These points and lines are to be tied to the local cadastral information in
accordance with SGD, Surveying Regulations 2001 and company procedures.
Approved by: ___________________
Date: ___________________

Chapter 4 –Procedure Manual
Determination of Mean High Water Mark 65
• All survey plans of MHWM redefinition are to be connected to State Survey
Control marks in accordance with Part 10 SGD, Clause 3 Surveying
Regulations 2001 and company procedures.
• Return to the procedure used to determine MHWM plane and verify position
of MHWM boundary as recommended in each procedure. • Proceed to Procedure 4.8.
4.8 Establishing Previous Mean High Water Mark
Introduction: - This is to give guidelines on the procedure that should be
followed when establishing the previous position of a Mean High Water Mark
(MHWM) within New South Wales.
Scope: - The procedure covers the steps to be followed when establishing the
position of a previous MHWM. This procedure will cover all classes of
MHWM determination survey undertaken by a firm including boundary
identification surveys, detail surveys and plans of redefinition. All the procedures
described will be used on all classes of survey unless specified otherwise.
References
Procedures 4.3 – Procedures for Data Search requirements.
Responsibilities: - The Principal shall not approve any Procedure that does not
use this format. Procedure
• To establish the previous position of the MHWM for a subject site a full title
and historical search will be undertaken as instructed in procedure 4.3.
Approved by: ___________________
Date: ___________________

Chapter 4 –Procedure Manual
Determination of Mean High Water Mark 66
• Using survey techniques find and connect to by measurement all original
survey marks related to the position of the previous MHWM determination.
The project surveyor will then reinstate the corners and the line of the original
MHWM using the original dimensions as shown on the plan of survey.
Conduct of the survey and marking requirements shall comply with the
company standards, SGD and the Survey Regulations.
• To establish the original line of the MHWM the project surveyor will have to
scale distances from the original plan, if there are no dimensions shown. • Erroneous survey information may occur on some plans and it is up to the
surveyor to re-establish the position of the original MHWM to their best
ability. For erroneous or confused survey information refer to the appendix A
of the SDG. • The current position of MHWM located by procedure 4.7 must be connected
by survey to the previous MHWM now located.
4.9 Plan Presentation Of Mean High Water Mark Determination Introduction: - This is to give guidelines on the procedure that should be followed
when presenting a plan showing MHWM.
Scope: -The procedure covers the requirements when presenting a survey plan
of MHWM redefinition for approval by the Department of Lands and Land
Titles Office within New South Wales. Also covered are the recommendations
for detail and identification plans within New South Wales.
Responsibilities: - The Principal shall not approve any Procedure that does not
use this format.
Approved by: ___________________
Date: ___________________
Chapter 4 –Procedure Manual
Determination of Mean High Water Mark 67
Procedure
• Specific requirements for plans of MHWM redefinition are explained in
Section 2 of the Surveyor General’s Direction 2004.
• Plans for proposed registration at Land Titles Office are prepared in
accordance with requirements as described in the Registrar General’s
Directions for Plan Preparation (Chapter 4). This can be accessed via the
Internet at http://www.lpi.nsw.gov.au/publications/rgdirections/plans
/RGs_Directions_Plans.htm.
• The placement of a benchmark on or near the site and connecting it to AHD
should be shown on detail and identification surveys. The reduced level
adopted for MHWM on AHD should also be shown on these plans. The
source from where information is obtained for tidal calculations and AHD
levels should also be noted on the plan. • The drafter shall follow the company’s procedures for drafting all plans
prepared using CAD or by freehand. All drafting validation is in accordance
with company’s procedures for plan validation and authorisation before a
plan is lodged or passed to the client.
4.10 Reporting On Mean High Water Mark Determination
Introduction: - This section is to give guidelines on reporting on the
procedures that were used in determining a MHWM boundary and clarifying
the legal and physical implications of any differences between the previous and
current MHWM definitions.
Approved by: ___________________
Date: ___________________

Chapter 4 –Procedure Manual
Determination of Mean High Water Mark 68
Scope: - All MHWM determinations require reports; this allows other
surveyors to re-establish the same tidal position. The following format is
recommended when reporting on the determination of a MHWM boundary and
where significant changes have occurred between the previous and current
position of the MHWM. The report will also indicate what paths are to be taken
if the plan of redefinition is to comply with the Coastal Protection Act 1979 or
if a previous MHWM definition is found to be incorrect.
References: - Procedure 4.3- Procedures for Data Search Requirements.
Responsibilities: - The Principal shall not approve any Procedure that does not
use this format.
Procedure
• To allow quick referencing between a surveyor and any other user of the
report a file reference should be shown in accordance with the company’s
procedures.
• A full description of the site including the property address, lot number, plan
number, locality, county and parish should also be included.
• Specific requirements for reporting on MHWM determinations are explained
in Surveyor General’s Directions 7.2.2, 8.2 and Department of Lands
Checklist 6 (Appendix B).
• Confirm that each requirement is answered by marking ‘Y’ in all items in the
Department of Lands Checklist 6 (Appendix B).
• The reports written for detail or identification surveys will not require the
depth of evidence that a survey plan of re-definition requires. A brief report is
recommended covering the requirements of the Department of Lands
Checklist 6 (Appendix B).
Approved by: ___________________
Date: ___________________
Chapter 4 –Procedure Manual
Determination of Mean High Water Mark 69
• The report will briefly explain the reasons for the difference in position
between the previous and current MHWM. This brief assessment should note
if the changes were:
- the result of a natural process.
- caused by a deliberate act.
- caused from the proprietors erect structures to protect their land from
erosion but not for reclamation.
- caused by a sudden storm.
- horizontal progressed rather than vertical silting.
- not noticeable from day to day, week to week and month to month.
- predominantly long-term steady movement, be it by water or other
natural agents.
Reporting on this will validate the current MHWM definition by clarifying
why there are differences between the current and previous definitions.
• Advise on how the determination of MHWM is affected by the Coastal
Protection Act 1979. Advise on what course of action should be followed to
deal with the requirement of Section 55N of the Coastal Protection Act 1979
are described in Sections 6, 7.2 and 8 of the Surveyor General’s Direction
2004.
• If it is ascertained that an error has occurred in the previous definition of a
MHWM boundary then procedures for reporting on the mistake can be
followed as setout in ‘Redefinition Plans’ - Appendix A of the Surveyor
General’s Direction 2004.
Approved by: _________________
Date: _________________

Chapter 4 –Procedure Manual
Determination of Mean High Water Mark 70
4.11 Summary: Chapter 4
This chapter covers the procedures to be used when determining MHWM from the
search requirements through to the presentation of a plan and report. Each stage of
the MHWM determination can be checked against the checklist as shown in
appendix B. By following the procedures and checklist, the Surveyor will introduce
quality control for all aspects in the determination of the tidal boundary.
The next chapter will validate the procedures by establishing a MHWM along a
beach and estuary on the Central Coast of New South Wales.

Chapter 5 – Validation
Determination of Mean High Water Mark 71
CHAPTER 5
VALIDATION
(CASE STUDY – PATONGA)
5.1 Introduction. This chapter will analyse and discuss how the procedure manual was used to
establish a Mean High Water Mark (MHWM) boundary along a coastal and estuary
strip of land within New South Wales.
The aim of this chapter is to validate a procedure manual used in determining
MHWM boundaries. This will be achieved by applying the procedures to a case
study and analysing the results.
The case study will provide information on all of the aspects of a survey from the
methods used to establish MHWM through to the reporting of its determination.
5.2 The Site. Patonga is the most southerly beach on the Central Coast of New South Wales. It is
located 97 km north of Sydney via the Newcastle Freeway. Patonga is situated on the
Hawkesbury River just inland from the mouth of Broken Bay. Its main beach, Brisk
Bay, faces southeast towards Broken Bay and is partially exposed to the influence of
the Pacific Ocean (appendix D). At the southern tip of the Patonga peninsula there is
an ancient tidal inlet, Patonga Creek that snakes inland. There are also large stands of
mangroves around the estuarine mudflats opposite the survey site.
The site was chosen because of the easy access to the MHWM from the public
reserve, which surrounds the entire peninsula. The effects of ocean swell off the

Chapter 5 – Validation
Determination of Mean High Water Mark 72
Pacific Ocean influences the shoreline of Patonga Beach, while the estuary is well
protected from the influence of the swell by the shape of the peninsula that forms
Patonga (Figure 16). The assessment of the effects of erosion or accretion on both
foreshores will be influenced by their exposure to the open coast. There is
approximately 800 metre of foreshore and the reserve is approximately 2.4 hectares.
Figure16 Location Plan, Patonga, New South Wales (UBD, 2001).
5.3 Procedures For A Mean High Water Mark The determination of the tidal boundary will follow the requirements of the
procedure manual as set in Chapter 4. The relevant pages and parts of the required
checklist should be signed off as each procedure is completed. For the purpose of this
exercise it is assumed that each sheet has been signed.
Chapter 5 – Validation
Determination of Mean High Water Mark 73
5.4 Acquiring Search And Geographical Names Geographical names of the locations and waterways to be surveyed were checked by
accessing the website as setout in procedure 4.3. Patonga, Patonga Creek and Brisk
Bay were the correct geographical names for their locations. Most survey plans and
titles were available from the Land and Property Information (LPI) website as layout
in procedure 4.3 to enable the surveyor to establish the present MHWM and to
reinstate the previous MHWM as shown on D.P.8549 (appendix E). An authorised
searcher had to be used to gain Crown Land Portion plans with reference number
greater than 70000 as they have not yet been scanned for the Internet.
5.5 Tidal Status
Both Patonga Beach and Brisk Bay face southeast towards Broken Bay and are
partially exposed to the influence of the Pacific Ocean. It is obvious that the beach is
subject to tidal influences. There are no dams or weirs affecting the flow of the tides
into the estuary. The parish map shown in appendix F also shows that the waterway
along the Hawkesbury River is tidal. The original land grant and our subject survey
plan, D.P.8549, states that the boundary is along ‘High Water Mark’ and ‘Mean High
Water Mark’ respectively. By following procedure 4.3 it can be confirmed that the
water boundary of the reserve is tidal.
5.6 Gaining Bench Mark Information
Following procedure 4.3, benchmark data was accessed via the Internet using the
Survey Control Information Management System (SCIMS) at the LPI. An example
of the output data is shown in appendix G.

Chapter 5 – Validation
Determination of Mean High Water Mark 74
5.7 Acquiring Tidal Heights And Information
A height for MHWM on Australian Height Datum (AHD) was accessed from the
Manly Hydraulic Laboratories (MHL) as setout in procedure 4.3. The reduced level
for Mean High Water (MHW) at Patonga was 0.554 metres (m) Australian Height
Datum with a mean standard deviation of ± 0.023 metres (appendix H). Also shown
at the bottom of the page of appendix H is the statement that all ‘…tidal plane
heights only approximately related to AHD’ and ‘…users should independently
verify the suitability of this data’. This meant that the AHD height for MHWM had
to be checked.
The position of MHWM related to the zero mark on the tide gauge staff was given as
- 0.42m. This was confirmed out on the site using the State Survey Mark (SSM)
94488 that was related to AHD with a Class ‘B’ accuracy (refer 4.3). When surveyed,
the reduced level for the MHWM position on the tide gauge staff was RL 0.55 m
AHD. The level supplied by MHL for MHWM was considered satisfactory because
the difference between the benchmark and the tide gauge was only - 0.004 m.
Therefore the height supplied by MHL was confirmed using procedure 4.3.
Tidal information for the Local Tide Gauge and Range Ratio methods were collected
from MHL. It was confirmed that all tidal data had been corrected for meteorological
and tidal anomalies by MHL (refer 4.5). The data obtained for Middle Harbour gauge
station was referenced to Camp Cove Zero Datum, which is 0.925 metres below
AHD; this was confirmed by MHL but the accuracy could not be verified. It was not
critical that AHD level should be confirmed, as a ratio of differences in high and low
tides would be measured not their relationship to AHD heights.
Tidal predictions were accessed from the MHL Web page for the 7th August 2004 as
setout in the 4.3 of the procedure manual. Allowing for a 10-minute delay for the tide
to be at high or low tide at Patonga compared with Middle Harbour, Sydney, it was

Chapter 5 – Validation
Determination of Mean High Water Mark 75
found that the best approximate times to measure low tide was at 7.10 am and high
tide at 1.40 pm. As high tide was approximately 0.5 metres AHD there was plenty of
time to position the MHWM boundary after measuring low tide. Due to time
limitations with the use of equipment and labour it was decided not to undertake the
survey during a period of spring tides or at a time of a full moon (refer 4.6) – (which
was taking place approximately one week later).
Much time was allocated in obtaining information to check the datum of the tide
gauge with AHD. Further research is required on the possibilities of establishing a
data set on the accuracies of heights issued from tidal gauges. The tidal datum may
vary as shown by a variance factor but the heights should be set at specified
accuracies as set by the Standards and Practices for Control Surveys (SP1, 2002).
5.8 Establishing Mean High Water All methods were used in the determination of the tidal plane, as setout in procedures
4.4 to 4.6 of the manual. This was done so as to validate the MHWM boundary.
5.8.1 Levelling From A Benchmark
The accuracy of the field equipment used in the survey was checked using procedure
4.2.7 and all data requirements were obtained and checked in accordance with
procedure 4.3 as follows.
The reduced level of 0.554 m AHD for Patonga had been verified as referred in
Chapter 5.7. The information supplied was for the period, 1990 to 2000, and no
adjustment was made for the rise in sea level. An approach to adjusting this height
might be to recalculate the epoch between 1994 and 2004 or over a 19-year period of
1985 to 2004. As discussed in Chapter 2.1 the present definition for the MHW refers
to the spring high and low water levels used to calculate its position. There is no
mention of time periods involved in observing these components. Yet MHL, the
Manual of the New South Wales Integrated Survey Grid and others use a long period
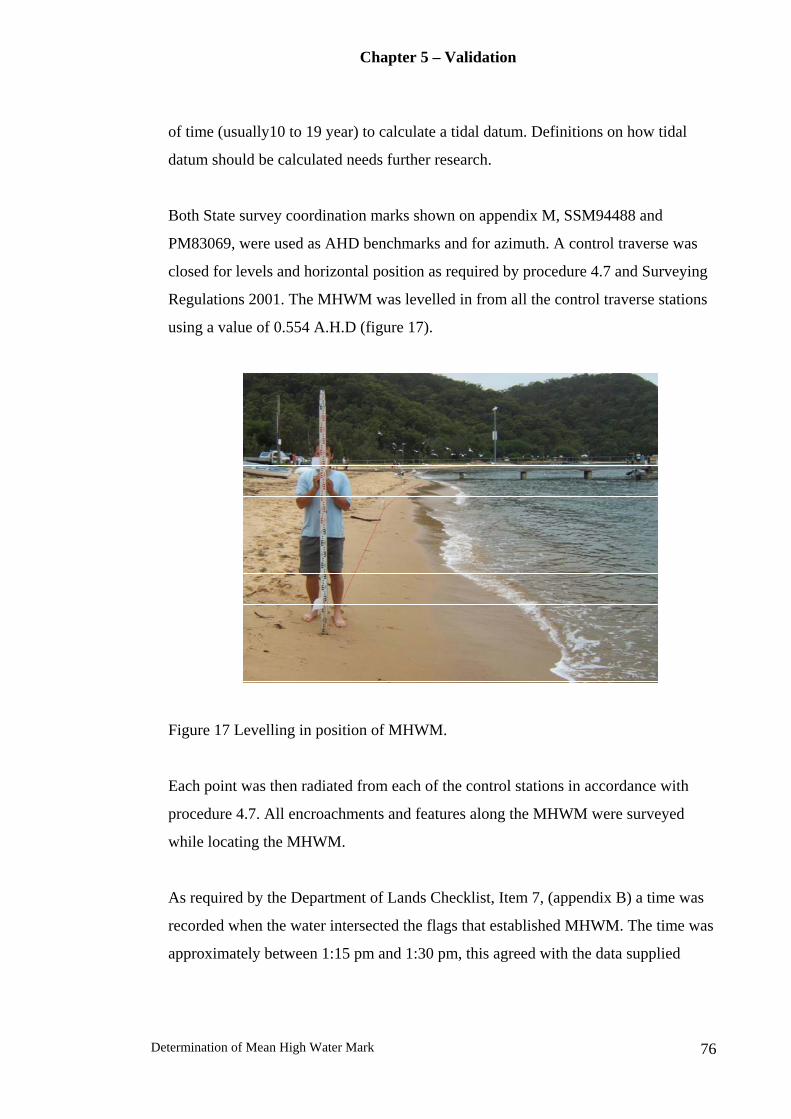
Chapter 5 – Validation
Determination of Mean High Water Mark 76
of time (usually10 to 19 year) to calculate a tidal datum. Definitions on how tidal
datum should be calculated needs further research.
Both State survey coordination marks shown on appendix M, SSM94488 and
PM83069, were used as AHD benchmarks and for azimuth. A control traverse was
closed for levels and horizontal position as required by procedure 4.7 and Surveying
Regulations 2001. The MHWM was levelled in from all the control traverse stations
using a value of 0.554 A.H.D (figure 17).
Figure 17 Levelling in position of MHWM.
Each point was then radiated from each of the control stations in accordance with
procedure 4.7. All encroachments and features along the MHWM were surveyed
while locating the MHWM.
As required by the Department of Lands Checklist, Item 7, (appendix B) a time was
recorded when the water intersected the flags that established MHWM. The time was
approximately between 1:15 pm and 1:30 pm, this agreed with the data supplied
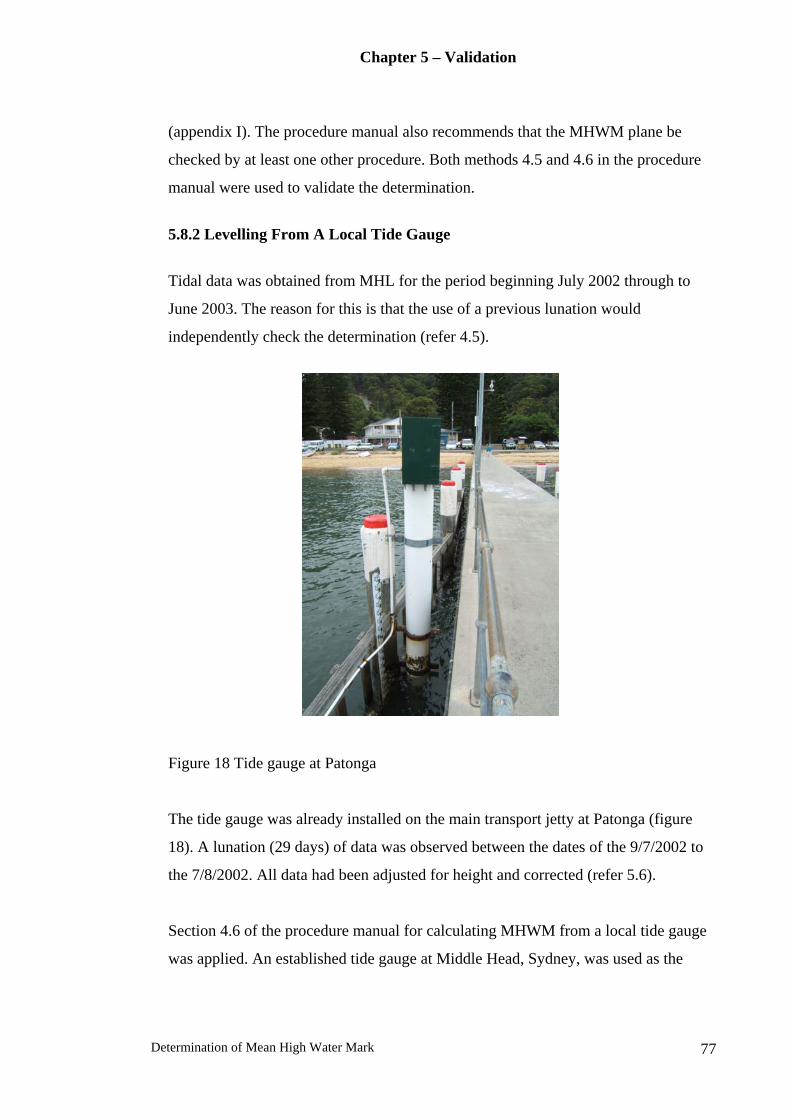
Chapter 5 – Validation
Determination of Mean High Water Mark 77
(appendix I). The procedure manual also recommends that the MHWM plane be
checked by at least one other procedure. Both methods 4.5 and 4.6 in the procedure
manual were used to validate the determination.
5.8.2 Levelling From A Local Tide Gauge
Tidal data was obtained from MHL for the period beginning July 2002 through to
June 2003. The reason for this is that the use of a previous lunation would
independently check the determination (refer 4.5).
Figure 18 Tide gauge at Patonga
The tide gauge was already installed on the main transport jetty at Patonga (figure
18). A lunation (29 days) of data was observed between the dates of the 9/7/2002 to
the 7/8/2002. All data had been adjusted for height and corrected (refer 5.6).
Section 4.6 of the procedure manual for calculating MHWM from a local tide gauge
was applied. An established tide gauge at Middle Head, Sydney, was used as the
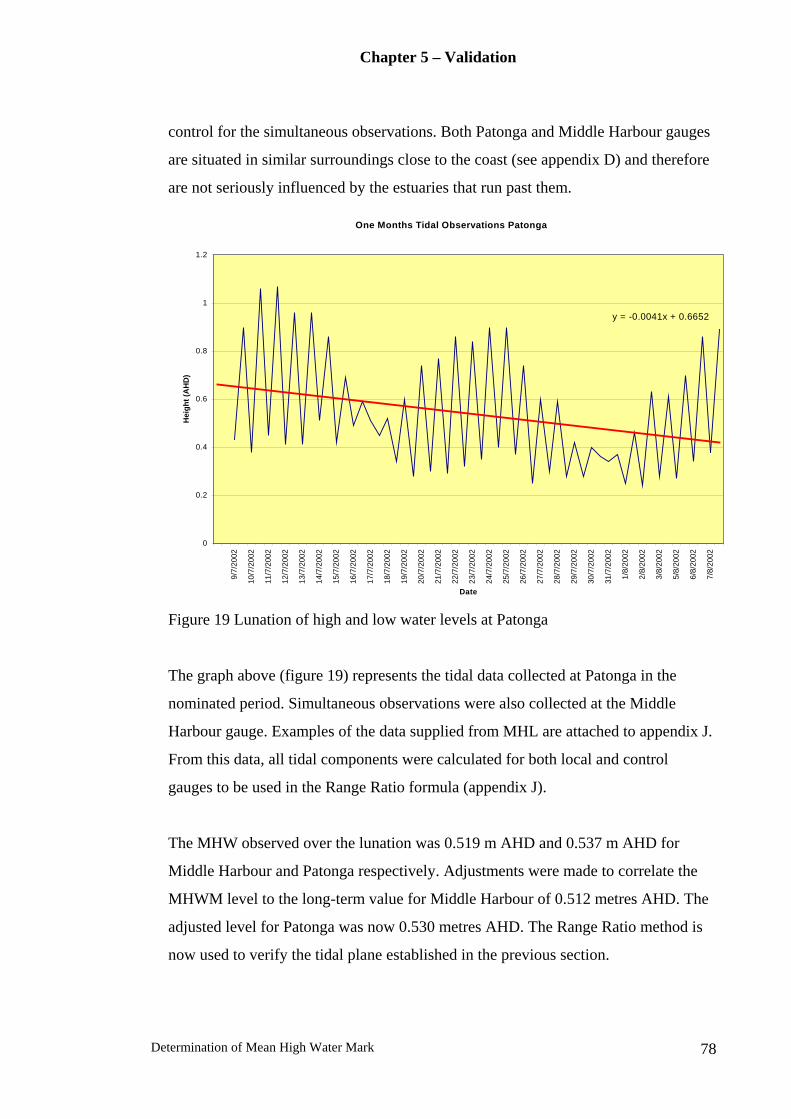
Chapter 5 – Validation
Determination of Mean High Water Mark 78
control for the simultaneous observations. Both Patonga and Middle Harbour gauges
are situated in similar surroundings close to the coast (see appendix D) and therefore
are not seriously influenced by the estuaries that run past them.
One Months Tidal Observations Patonga
y = -0.0041x + 0.6652
0
0.2
0.4
0.6
0.8
1
1.2
9/7/
2002
10/7
/200
2
11/7
/200
2
12/7
/200
2
13/7
/200
2
14/7
/200
2
15/7
/200
2
16/7
/200
2
17/7
/200
2
18/7
/200
2
19/7
/200
2
20/7
/200
2
21/7
/200
2
22/7
/200
2
23/7
/200
2
24/7
/200
2
25/7
/200
2
26/7
/200
2
27/7
/200
2
28/7
/200
2
29/7
/200
2
30/7
/200
2
31/7
/200
2
1/8/
2002
2/8/
2002
3/8/
2002
5/8/
2002
6/8/
2002
7/8/
2002
Date
Hei
ght (
AH
D)
Figure 19 Lunation of high and low water levels at Patonga
The graph above (figure 19) represents the tidal data collected at Patonga in the
nominated period. Simultaneous observations were also collected at the Middle
Harbour gauge. Examples of the data supplied from MHL are attached to appendix J.
From this data, all tidal components were calculated for both local and control
gauges to be used in the Range Ratio formula (appendix J).
The MHW observed over the lunation was 0.519 m AHD and 0.537 m AHD for
Middle Harbour and Patonga respectively. Adjustments were made to correlate the
MHWM level to the long-term value for Middle Harbour of 0.512 metres AHD. The
adjusted level for Patonga was now 0.530 metres AHD. The Range Ratio method is
now used to verify the tidal plane established in the previous section.

Chapter 5 – Validation
Determination of Mean High Water Mark 79
5.8.3 Range Ratio Method
Simultaneous observations were taken at the site gauge at Patonga and at the
automatic tidal gauges at Ettalong, approximately 5 kilometres to the northeast of the
site, and at Middle Harbour, Sydney. Procedure 4.6 was used to guide all field and
calculation techniques. Observations were taken at high and low tide over one day,
but it was not possible to observe tides during a period of spring tides due to time
limitations with the use of equipment and labour. The tide staff affixed adjacent to
the tide gauge at Patonga (figure 20) was used to read the water level at both high
and low tide.
Figure 20. Tide Staff at Patonga
The zero reading on the tide gauge staff was connected to SSM94488 for AHD
height. Field observations were recorded at prearranged times (see 5.6) with the
automatic recordings at each tide gauge to allow for simultaneous readings of the
tides. The tidal data components were calculated from the field data and data
supplied by MHL as required for the formula in procedure 4.6. These components
Chapter 5 – Validation
Determination of Mean High Water Mark 80
were then entered into the Range Ratio formula for MHWM levels at Patonga. See
appendix K for data and calculations.
Both field observations and tide gauge data recorded at Patonga were calculated. The
answers ranged from 0.44 to 0.547 metres AHD for MHWM. The difference between
the calculated levels using Middle Harbour and Ettalong control gauges is due to
Ettalong being situated at the mouth of a narrow estuary, which feeds into the
Brisbane Waters. The tidal gradient between the Hawkesbury River and Brisbane
Waters is approximately 0.25 metres, which affects the MHWM at Ettalong.
Appendix K also shows a calculated height for Ettalong using Middle Harbour as the
control gauge. The MHWM level for Ettalong is 0.4 metres AHD with a standard
deviation of ± 0.031 metres as supplied from MHL and calculated by range ratio
method is 0.47 metres AHD. For this reason the long established tide gauge at
Ettalong was not used to check MHWM at Patonga.
Another reason for differences between answers are due to measuring inaccuracies as
on shore waves, wash from boats and the slight swell made it difficult to read the
staff. Readings averaging every 20 seconds over 2 minutes was the approach used.
A reduced level of 0.516 metres AHD was adopted as the MHWM level using the
Range Ratio technique, as it is assumed for this technique that there was no tide
gauge at Patonga.
5.9 Results
From the methods mentioned there is a difference in the MHWM result of
approximately 0.05 metres vertically. To improve the results of the Local Tide Gauge
and Range Ratio methods more lunation and tidal cycles should be observed. As
recommended in the procedure manual and by the National Oceanic and
Atmospheric Administration in the USA (NOAA, 2003) - refer to Chapter 2 – a
standard deviation of ± 0.03 should be achieved between each calculated lunation

Chapter 5 – Validation
Determination of Mean High Water Mark 81
and tidal cycle. The standard deviation for the lunation of observed tides at Patonga
was ± 0.24 m (appendix I) and the standard deviation for 80 years of observations at
Fort Denison, Sydney is approximately ± 0.03 m. The required standard deviation of
± 0.03 m for three tidal cycles or lunation does not appear to be achievable. Further
research will be required to see if this is correct.
With an average slope of approximately 1: 10 for most of the shoreline along Patonga
this will make a vertical error of 0.05 metres, approximately 0.5 metres horizontally.
Tidal boundary re-establishment in areas of mangroves and sand flats would show
where care in survey and tidal determination is needed. Extreme caution is needed in
these situations as a few centimetres vertically may mean several metres
horizontally. Research is required on finding a system that is fair and equitable for
both owners above and below MHWM when determining boundaries in areas where
survey techniques are not accurate enough.
As shown in the Literature Review in Chapter 2 the error for establishing a MHWM
plane can be up to ± 0.1 metres vertically. The unacceptable standard deviation for
the tidal data observed over a lunation does not mean the procedure manual has
achieved an unsatisfactory answer for MHWM. The manual has achieved an answer
by two methods, which agree within 0.05 m and have been validated by the long term
tide gauge level.
5.10 Establishing Previous Mean High Water Mark
A traverse was established to reinstate the rear boundaries that fronted the 100-foot
(30.48 metres) reserve. The corners and angles have been reinstated so that the 100-
foot (30.48 metres) reserve, as shown on D.P.8549 and D.P. 9408, can be projected
out to re-establish the position of the original MHWM. This is part of the
requirements of Part 7.22 of the Surveyor General’s Directions 2004.

Chapter 5 – Validation
Determination of Mean High Water Mark 82
The traverse was run from the northeast corner of Brisk Bay and it headed in a
southwesterly direction along the beach of Brisk Bay. It continued in a north westerly
direction along Brisk Street until it intersected with Patonga Creek, from here it
headed in a north easterly direction to intersect with Jacaranda Street. The traverse
was closed back onto the origin by traversing down Jacaranda Street to Brisk Bay.
The angular and linear misclose of the traverse was acceptable and within the
guidelines of the Surveying Regulations 2001 clause 25 and 26.
The traverse was also tied to establish State survey coordination marks as specified
by Surveyor General’s Directions 2004 for plans of redefinition. The misclose
between Map Grid Australia (MGA) coordinates was within the allowable range as
setout in Clause 27 of the Surveying Regulations 2001.
An azimuth was adopted from D.P.832588 (refer appendix K) due to the plan being
related to original rock marks from D.P.8549. The reinstatement of the boundaries
between the 100-foot (30.48 metres) reservation and the adjoining lots along Brisk
Bay were adjusted to fit with the reference mark found at the corner of lot 212 in
D.P.231290 (refer appendix K). There was approximately 0.15 metres excess
between the reference marks and no marks were found between these reference
marks. The reinstatement of Brisk Street was undertaken by adopting the reference
marks along the alignment. All marks were found to fit within 0.03 metres with the
subject survey plan (D.P.8549). The next stage was the reinstatement of the 100 feet
reserve (30.48 metres) along Patonga Creek starting from Brisk Street. At the corner
of lot 1 in D.P.561540 (refer appendix K) a reference mark was adopted. Again no
marks were found between Brisk Street and Jacaranda Avenue. At Jacaranda Avenue
a peg and survey nail in a fence was found at the corners of lots 128 and 130 in D.P.
9408 respectively. There was an excess of 0.4 metres between marks, which was
proportioned along the reserve boundary. Due to the shortage of time it was not
possible to look for more survey marks to investigate why there was so much excess.
The fences adjoining Jacaranda Avenue were of little help as there were many metres
out of position.

Chapter 5 – Validation
Determination of Mean High Water Mark 83
Using the survey information obtained out in the field, a line representing the
approximate original MHWM was plotted 100 feet (30.48 metres) parallel to the rear
of the adjoining lots to the reserve. This was compared with the original MHWM, as
shown on D.P.8549 and D.P. 9408, and differences were noted in the following plan
and report (refer 5.11 & 5.12).
Just like determining a current MHWM boundary, the reinstating of a previous tidal
boundary can be fraught with problems. The reinstating of the boundaries along
Brisk Bay was successful due to original survey marks being found. This was not the
case along Patonga Creek, where next to no marks were found. The procedure
manual explains how to reposition a previous MHWM but the accuracy of this
position is dependent on what survey marks are found. All surveys marks must be
looked for so that the previous position of MHWM is valid.
5.11 Presentation Of Mean High Water Mark Determination
The processed information from the surveying software package was exported to a
drafting package called AutoCAD. The plan of MHWM redefinition (figure 21) is in
accordance with procedure 4.9. See appendix L for smaller scale plot.
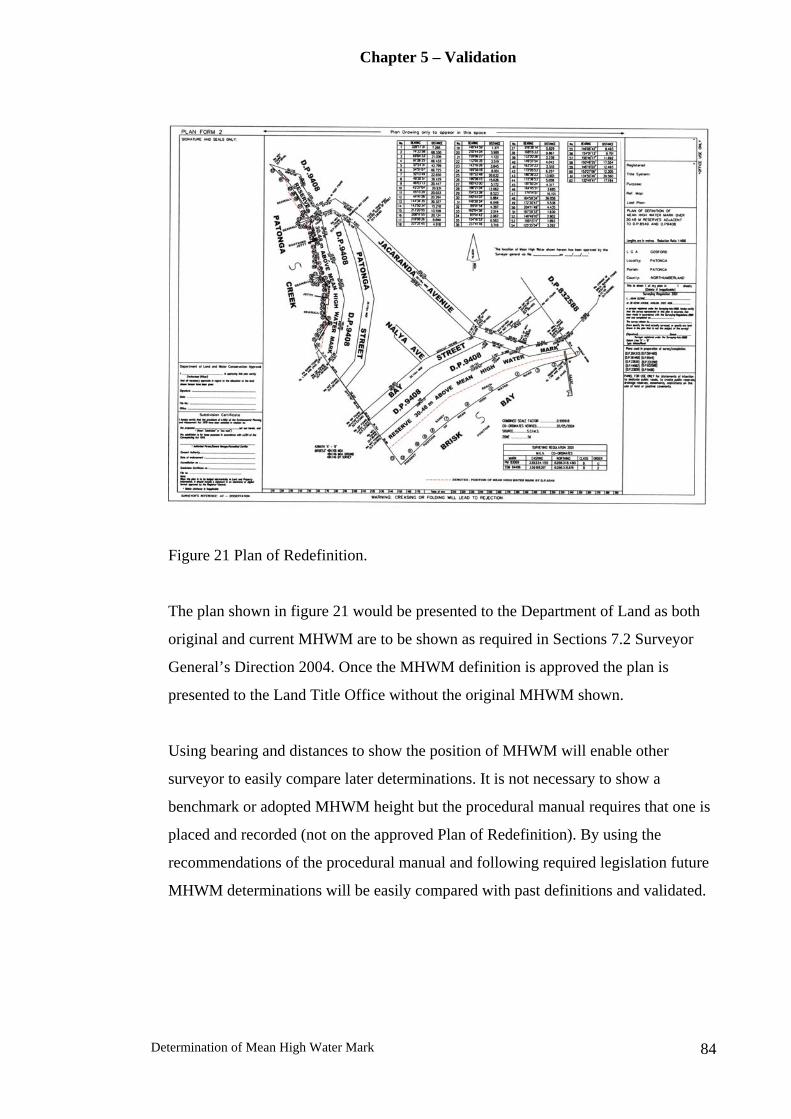
Chapter 5 – Validation
Determination of Mean High Water Mark 84
Figure 21 Plan of Redefinition.
The plan shown in figure 21 would be presented to the Department of Land as both
original and current MHWM are to be shown as required in Sections 7.2 Surveyor
General’s Direction 2004. Once the MHWM definition is approved the plan is
presented to the Land Title Office without the original MHWM shown.
Using bearing and distances to show the position of MHWM will enable other
surveyor to easily compare later determinations. It is not necessary to show a
benchmark or adopted MHWM height but the procedural manual requires that one is
placed and recorded (not on the approved Plan of Redefinition). By using the
recommendations of the procedural manual and following required legislation future
MHWM determinations will be easily compared with past definitions and validated.
Chapter 5 – Validation
Determination of Mean High Water Mark 85
5.12 Reporting On The Mean High Water Mark Determination
The following is a survey report that will validate the MHWM determination and
fulfill the requirements as setout in Procedure 4.10 for water boundary consent from
the Department of Lands.
File Reference: - AC Dissertation Date: 1st November 2004.
This report is on the determination of a Mean High Water Mark (MHWM) along a
30.48 metres Public Reserve adjacent to D.P.8549 and D.P. 9408. This Reserve is
located along Brisk Bay and Patonga Creek within the locality of Patonga, Parish of
Patonga and County of Northumberland.
The title search showed that William Thurlow purchased the land in 1839 from the
Crown. Within the grant there was a reservation of ‘all land within One hundred feet
of high water mark on the Sea coast and on every Creek, Harbour and inlet’. A
subsequent owner Thomas Shakespeare then subdivided the land in 1916. It is
impossible to re-establish the original 1837 MHWM, as there is no survey
information shown. The last plan to define the MHWM was D.P. 8549 (appendix E)
in 1916 and therefore this plan was used to reinstate the landward reserve and tidal
boundaries. This boundary will be referred to as the ‘previous’ MHWM as it may not
be the original position as shown in 1837.
There is a sandy beach along Brisk Bay that has a southeast aspect towards Broken
Bay and is partially exposed to the influence of the Pacific Ocean. The only structure
along the beach is a concrete jetty constructed at the eastern end of the subject survey
area (figure 17, page 15).
The surveyed foreshore of Patonga Creek is mainly sandy with one small pocket of
mangroves situated approximately halfway (Figure 22 & 23). There are various
improvements to be found along the creek foreshore such as a boatshed, several small
seawalls and a storm water outlet.
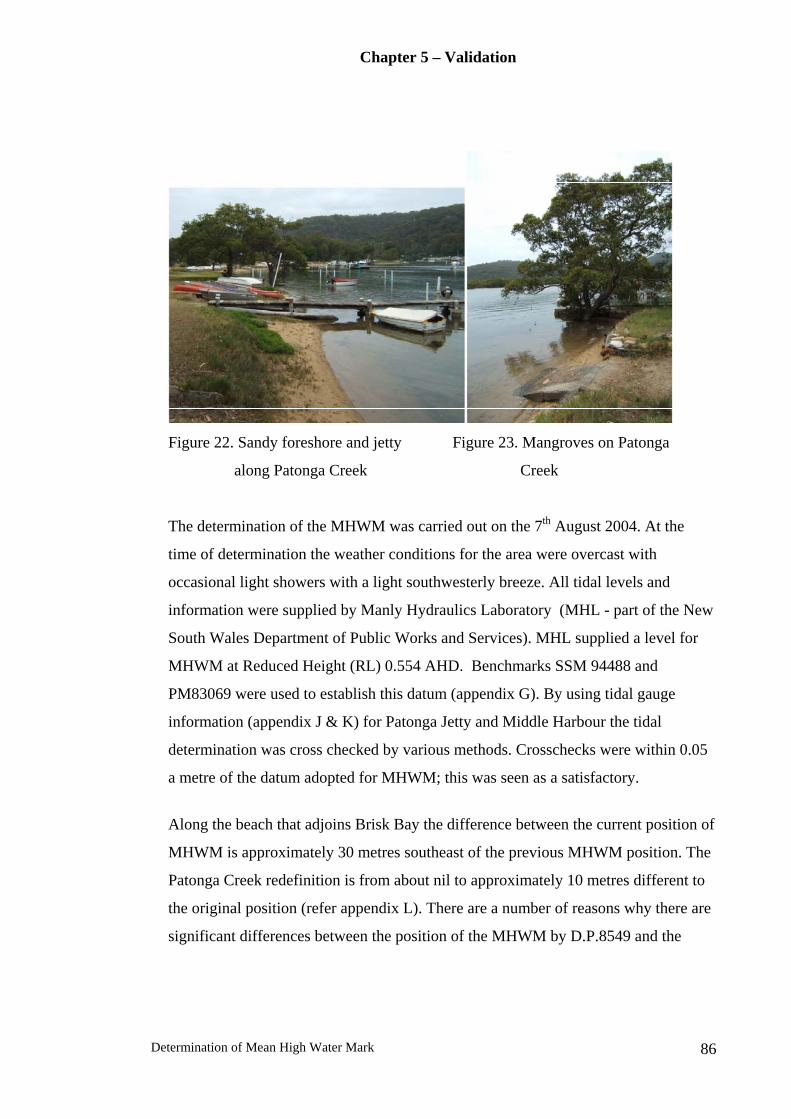
Chapter 5 – Validation
Determination of Mean High Water Mark 86
Figure 22. Sandy foreshore and jetty Figure 23. Mangroves on Patonga
along Patonga Creek Creek
The determination of the MHWM was carried out on the 7th August 2004. At the
time of determination the weather conditions for the area were overcast with
occasional light showers with a light southwesterly breeze. All tidal levels and
information were supplied by Manly Hydraulics Laboratory (MHL - part of the New
South Wales Department of Public Works and Services). MHL supplied a level for
MHWM at Reduced Height (RL) 0.554 AHD. Benchmarks SSM 94488 and
PM83069 were used to establish this datum (appendix G). By using tidal gauge
information (appendix J & K) for Patonga Jetty and Middle Harbour the tidal
determination was cross checked by various methods. Crosschecks were within 0.05
a metre of the datum adopted for MHWM; this was seen as a satisfactory.
Along the beach that adjoins Brisk Bay the difference between the current position of
MHWM is approximately 30 metres southeast of the previous MHWM position. The
Patonga Creek redefinition is from about nil to approximately 10 metres different to
the original position (refer appendix L). There are a number of reasons why there are
significant differences between the position of the MHWM by D.P.8549 and the

Chapter 5 – Validation
Determination of Mean High Water Mark 87
present position. The following sections are some of the reasons why differences
have occurred.
The beach that fronts Brisk Bay is affected by the dynamics of the Pacific Ocean. A
Parish map from 1933 (appendix F) shows the position of the ‘beach’ some distance
south of the original MHWM. It can only be guessed that either a storm or a series of
storms deposited huge amounts of sand along the foreshore or that the original
MHWM definition was vastly out of position. Further investigation will be required
if application for redefinition is submitted.
Figure 24. Boatshed along Patonga Creek.
The erosion and accretion along Patonga Creek is due to a combination of natural
and manmade influences. The northern section of the reserve has eroded away due to
natural causes, as there is minimal disturbance by man to this area. Further south
along the creek numerous small retaining walls and a boatshed have been built with
the effect of causing erosion in some areas and accretion in others (refer figure 24).
Other than a small protrusion out into the creek, the accretion and erosion seems to
be the result of natural processes and is not a deliberate act to claim accretion. This is
probably the case, as no one would gain benefit from the effects of accretion onto a
public reserve.

Chapter 5 – Validation
Determination of Mean High Water Mark 88
The redefinition of the MHWM boundary will not affect the public access, as it is
already public reserve. This part of Section 55N of the Coastal Protection Act 1979
would be meet. Under Section 55N the new definition of MHWM must demonstrate
a perceived trend to indefinitely sustain any new accretion by natural means. It will
be necessary to employ professional engineers in coastal and estuary hydrodynamic
to report on the history of accretion and quantify the accretion trends. Also, reporting
on the physical processes that will affect the foreshore and how climate change will
impact on the subject foreshore.
5.13 Summary: Chapter 5
The research outcome was a set of procedures that will allow a surveyor to check and
apply all requirements needed in the defining of a MHWM limit. The solution to
obtaining a reliable result using a short-term observation at a gauge will benefit
surveyors who need to estimate a MHWM boundary to within ± 0.05 to 0.1 metres.
The requirement to obtain consistent results over a tidal cycle or lunation requires
more research.
The results from the case study at Patonga illustrates that a MHWM boundary can be
determined successfully using the procedure manual as setout in Chapter 4. It can be
seen that the procedure manual can only guide the surveyor, as each determination of
a MHWM can be vastly different.
Chapter 6 - Conclusion
Determination of Mean High Water Mark 89
CHAPTER 6
CONCLUSION
6.1 Introduction
This chapter will discuss if the research project has achieved the aim of clarifying the
legal and physical implications associated with determining tidal boundaries and the
development of a procedure manual for defining a MHWM boundary.
6.2 Achievement Of Objectives
One of the objectives of this research project was to clarify the legal and physical
implications associated with determining a tidal boundary within New South Wales.
From the review of the current state of knowledge in both the physical and legal
components required in establishing tidal boundaries, it was found that there were
inconsistencies in both the legal and physical components.
The project clarifies that the use of MHWM as a boundary is by no way a precise
determination. The research project has demonstrated that there are physical
limitations to precisely positioning a tidal boundary. Using current techniques in
calculating a tidal plane, a surveyor will only achieve an answer of between ± 0.05
to 0.1metres at best. With further research it might be possible to achieve a vertical
difference of a couple of centimetres. But this may extend many metres horizontally
when transferred to a low-lying area. An equitable system of defining water
boundaries in low-lying areas should be addressed.
Chapter 6 - Conclusion
Determination of Mean High Water Mark 90
From the development of the procedure manual the user can be guided and
instructed on the best method to use in determining a MHWM. The manual clarifies
the legal and physical requirements needed to determine a MHWM and therefore
eliminates any ambiguities. It also alerts the user to potential issues that may be
faced in the field or office. This manual can be incorporated as part of a surveying
company’s quality control system.
To fulfil the objectives of the research project the procedure manual was used on a
case study on the Central Coast of New South Wales. The redefinition of the tidal
boundary was successfully achieved using the guidelines setout by the manual.
Some of the accuracies stipulated by the procedure manual were not met and more
case studies will be required to see if they could ever be achieved.
6.3 Conclusion: Chapter 6
The procedures established in this research project will assist surveyors in the field
to determine Mean High Water Mark boundaries within New South Wales, using
current legislation to alert them to any possible issues they may face and also assist
in the initial stages of preparing and retrieving information for a Mean High Water
Mark determination.


93
Addresses of Approving Authorities and Information Suppliers Land & Property Information Department of Lands Queens Square Building Crown Land NSW 1 Prince Albert Road, P O Box 2185 SYDNEY NSW 2000 DANGAR NSW 2309 Phone: 9228 6798 Phone: (02) 4960 5000 Or Fax: (02) 4960 5020 GPO Box 15 SYDNEY NSW 2001 Department of Lands
Website: www.lands.nsw.gov.au District Offices PARRAMATTA: (Metropolitan Office) GRAFTON: 10 Valentine Avenue 98 Victoria Street Parramatta NSW 2150 (Locked Bag 10) (PO Box 3935 Parramatta 2124) Grafton NSW 2460 MAITLAND: TAREE: Cnr Newcastle Rd & Bank St 98 Victoria Street (PO Box 6) (PO Box 440) East Maitland NSW 2323 Taree NSW 2430 NOWRA ORANGE 5 O’keefe Avenue 92 Kite Street (PO Box 309) (PO Box 2146) Nowra NSW 2541 Orange NSW 2800 Maritime Property & Assets Division (MPAD) Office Location Sydney Harbour, Newcastle Harbour, Port Kembla and Botany Bay Survey & Spatial Information Branch MPAD PO Box R228 Royal Exchange Sydney NSW 1223 Phone: (02) 9563 8836 Fax: (02) 9563 8800 Manly Hydraulics Laboratory Office Location Manly Hydraulics Laboratory 110B King Street Manly Vale NSW 2093 Phone: (02) 9949 0200 Website: www.mhl.nsw.gov.au Appendix C


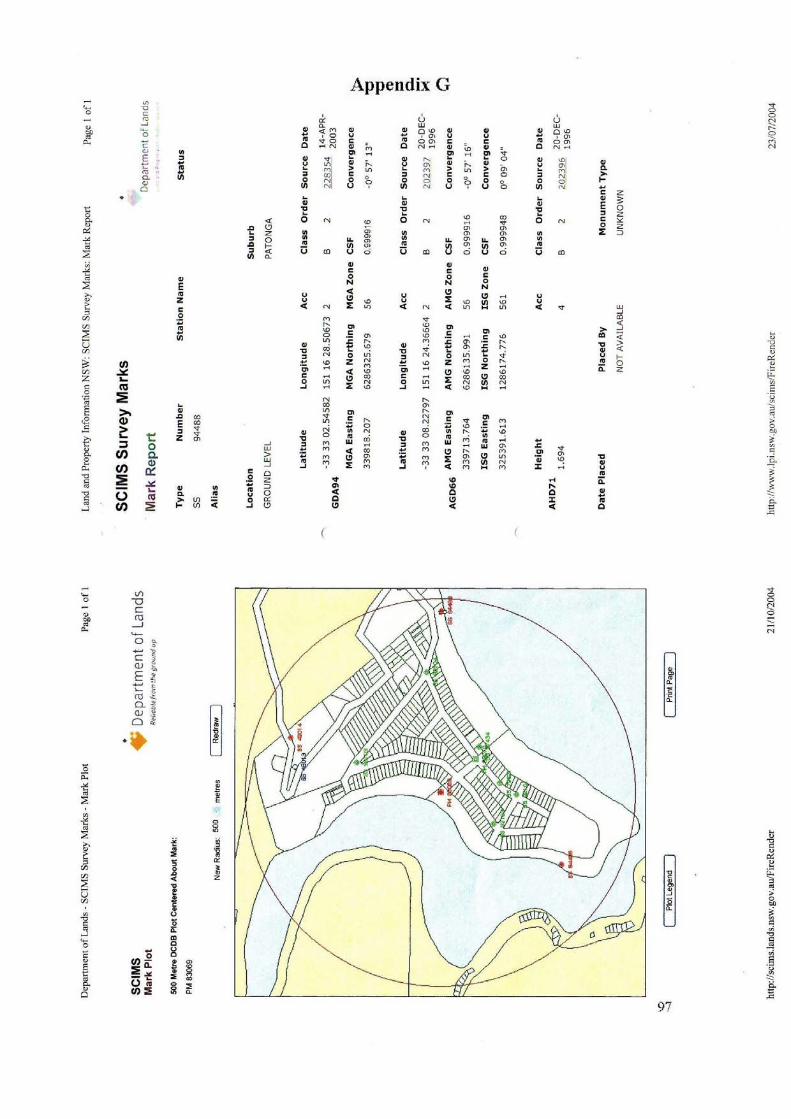
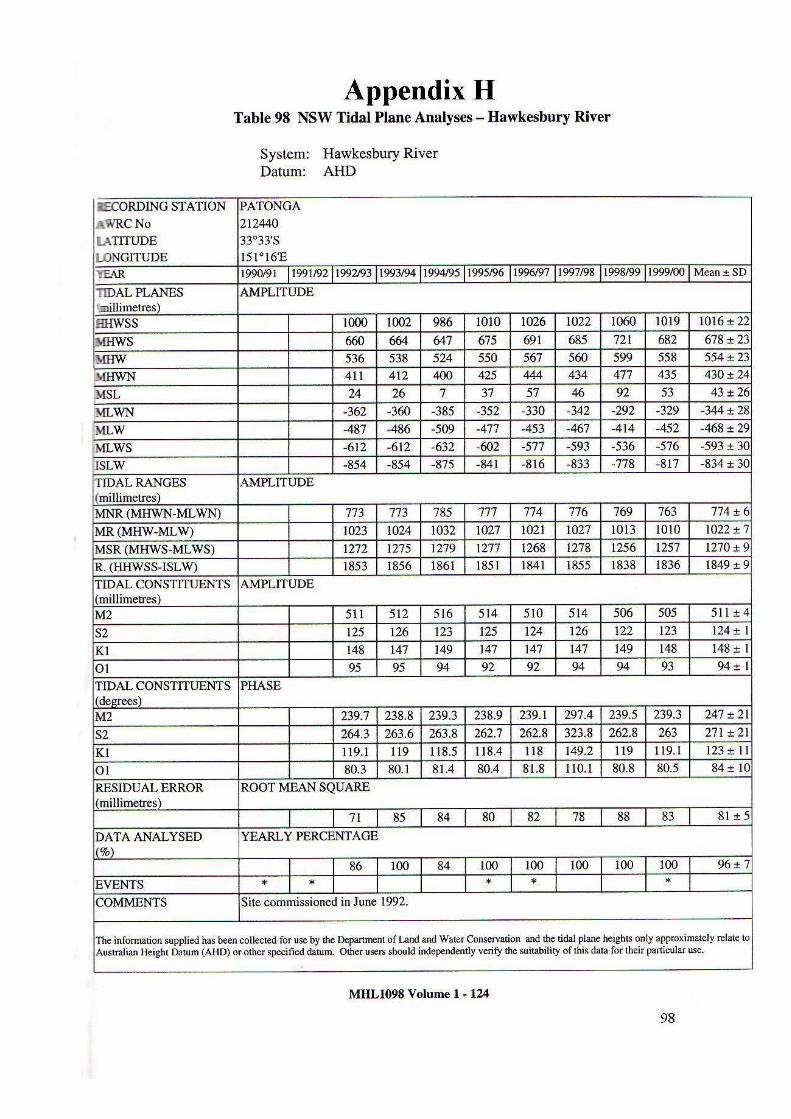
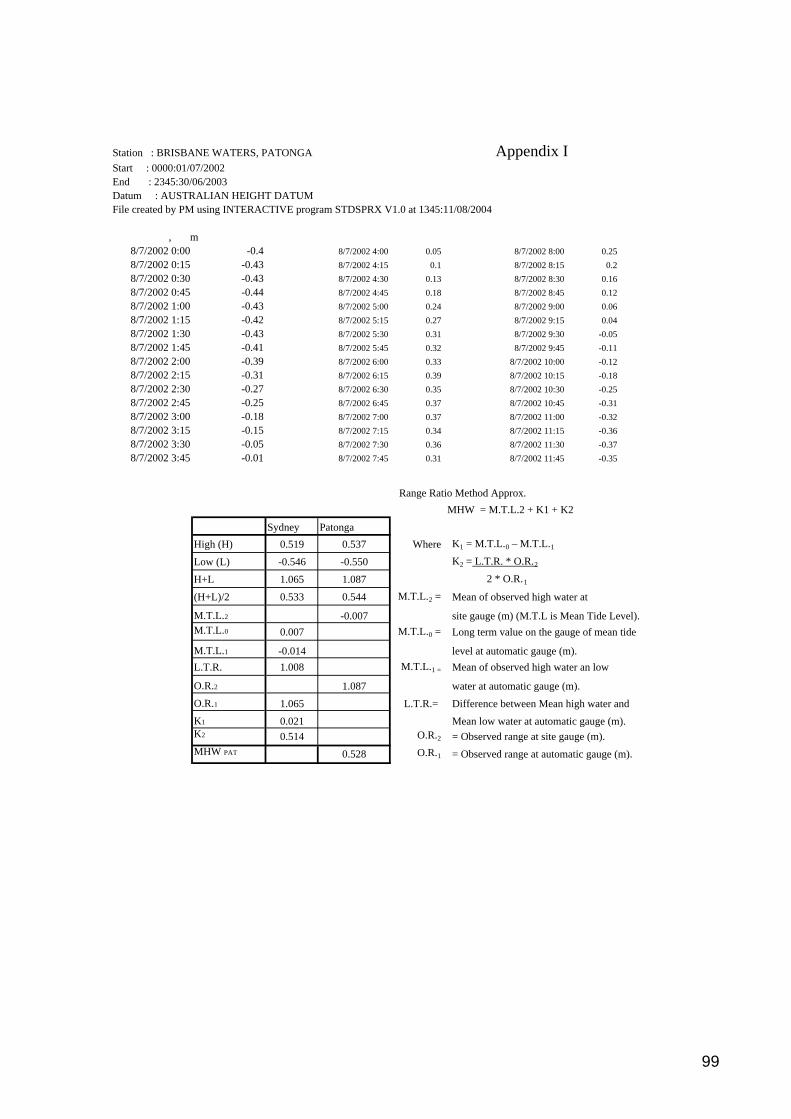
Station : BRISBANE WATERS, PATONGA Appendix IStart : 0000:01/07/2002End : 2345:30/06/2003Datum : AUSTRALIAN HEIGHT DATUMFile created by PM using INTERACTIVE program STDSPRX V1.0 at 1345:11/08/2004 , m
8/7/2002 0:00 -0.4 8/7/2002 4:00 0.05 8/7/2002 8:00 0.258/7/2002 0:15 -0.43 8/7/2002 4:15 0.1 8/7/2002 8:15 0.28/7/2002 0:30 -0.43 8/7/2002 4:30 0.13 8/7/2002 8:30 0.168/7/2002 0:45 -0.44 8/7/2002 4:45 0.18 8/7/2002 8:45 0.128/7/2002 1:00 -0.43 8/7/2002 5:00 0.24 8/7/2002 9:00 0.068/7/2002 1:15 -0.42 8/7/2002 5:15 0.27 8/7/2002 9:15 0.048/7/2002 1:30 -0.43 8/7/2002 5:30 0.31 8/7/2002 9:30 -0.058/7/2002 1:45 -0.41 8/7/2002 5:45 0.32 8/7/2002 9:45 -0.118/7/2002 2:00 -0.39 8/7/2002 6:00 0.33 8/7/2002 10:00 -0.128/7/2002 2:15 -0.31 8/7/2002 6:15 0.39 8/7/2002 10:15 -0.188/7/2002 2:30 -0.27 8/7/2002 6:30 0.35 8/7/2002 10:30 -0.258/7/2002 2:45 -0.25 8/7/2002 6:45 0.37 8/7/2002 10:45 -0.318/7/2002 3:00 -0.18 8/7/2002 7:00 0.37 8/7/2002 11:00 -0.328/7/2002 3:15 -0.15 8/7/2002 7:15 0.34 8/7/2002 11:15 -0.368/7/2002 3:30 -0.05 8/7/2002 7:30 0.36 8/7/2002 11:30 -0.378/7/2002 3:45 -0.01 8/7/2002 7:45 0.31 8/7/2002 11:45 -0.35
Range Ratio Method Approx. MHW = M.T.L.2 + K1 + K2
Sydney PatongaHigh (H) 0.519 0.537 Where K1 = M.T.L.0 – M.T.L.1Low (L) -0.546 -0.550 K2 = L.T.R. * O.R.2
H+L 1.065 1.087 2 * O.R.1
(H+L)/2 0.533 0.544 M.T.L.2 = Mean of observed high water at
M.T.L.2 -0.007 site gauge (m) (M.T.L is Mean Tide Level).M.T.L.0 0.007 M.T.L.0 = Long term value on the gauge of mean tide
M.T.L.1 -0.014 level at automatic gauge (m).L.T.R. 1.008 M.T.L.1 = Mean of observed high water an low
O.R.2 1.087 water at automatic gauge (m).O.R.1 1.065 L.T.R.= Difference between Mean high water andK1 0.021 Mean low water at automatic gauge (m).K2 0.514 O.R.2 = Observed range at site gauge (m).MHW PAT 0.528 O.R.1 = Observed range at automatic gauge (m).
99

Sydn
eyPa
tong
aSy
dney
Pato
nga
Sydn
eyEt
talo
ngR
ange
Rat
io M
etho
d A
ppro
x.A
uto
Site
Aut
oFi
eld
Aut
oSi
te M
HW
= M
.T.L
.2 +
K1
+ K
2G
auge
Gau
geG
auge
Obs
.G
auge
Gau
geH
igh
0.55
50.
590
Hig
h0.
555
0.56
0H
igh
0.55
50.
517
Whe
reK
1 = M
.T.L
. 0 –
M.T
.L. 1
Low
-0.4
15-0
.420
Low
-0.4
15-0
.400
Low
-0.4
15-0
.229
K2 =
L.T
.R. *
O.R
. 20.
970
1.01
00.
970
0.96
00.
970
0.74
6
2
* O
.R. 1
0.48
50.
505
0.48
50.
480
0.48
50.
373
M.T
.L. 2
=M
ean
of o
bser
ved
high
wat
er a
tM
.T.L
. 20.
085
M.T
.L.2
0.08
0M
.T.L
.20.
144
site
gau
ge (m
) (M
.T.L
is M
ean
Tide
Lev
el).
M.T
.L.0
0.00
7M
.T.L
.00.
007
M.T
.L.0
0.00
7M
.T.L
. 0 =
Long
term
val
ue o
n th
e ga
uge
of m
ean
tide
M.T
.L.1
0.07
0M
.T.L
.10.
070
M.T
.L.1
0.07
0le
vel a
t aut
omat
ic g
auge
(m).
L.T.
R.
1.00
8L.
T.R
.1.
008
L.T.
R.
1.00
8M
.T.L
. 1 =
Mea
n of
obs
erve
d hi
gh w
ater
an
low
O.R
.21.
010
O.R
.20.
960
O.R
.20.
746
wat
er a
t aut
omat
ic g
auge
(m).
O.R
.10.
970
O.R
.10.
970
O.R
.10.
970
L.T.
R.=
D
iffer
ence
bet
wee
n M
ean
high
wat
er a
ndK
1-0
.063
K1
-0.0
63K
1-0
.063
Mea
n lo
w w
ater
at a
utom
atic
gau
ge (m
).K
2 PA
T0.
525
K2
PAT
0.49
9K
20.
388
O.R
. 2=
Obs
erve
d ra
nge
at si
te g
auge
(m).
MH
W
0.54
7M
HW
0.51
6M
HW
0.46
9O
.R. 1
= O
bser
ved
rang
e at
aut
omat
ic g
auge
(m).
Exam
ple
of T
idal
Dat
a St
atio
n :
BR
ISB
AN
E W
ATE
RS
PA
TON
GA
Sta
tion
: S
YD
NE
Y T
IDE
GA
UG
ESt
art
: 0
000:
07/0
8/20
04S
tart
:
0000
:07/
08/2
004
Etta
long
Pato
nga
Etta
long
Pato
nga
End
: 000
0:08
/08/
2004
End
: 00
00:0
8/08
/200
4A
uto
Site
Aut
oFi
eld
Dat
um
: A
UST
RA
LIA
N H
EIG
HT
DA
TUM
Dat
um
: Z
ER
O C
AM
P C
OV
E (s
ubtra
ct 0
.92
for A
HD
)G
auge
Gau
geG
auge
Obs
.Fi
le c
reat
ed b
y A
J usi
ng IN
TER
AC
TIV
E pr
ogra
m D
BSP
R V
1.0
at 0
940:
File
cre
ated
by
AJ
usin
g IN
TER
AC
TIV
E p
rogr
am D
BS
PR
V1.
0 at
162
4H
igh
0.51
70.
590
Hig
h0.
517
0.56
0
Lo
w-0
.229
-0.4
20Lo
w-0
.229
-0.4
00
m
m0.
746
1.01
00.
746
0.96
0
0.
373
0.50
50.
373
0.48
07/
8/20
04 0
:00
0.43
7/8/
2004
0:0
01.
34M
.T.L
.20.
085
M.T
.L.2
0.08
07/
8/20
04 0
:15
0.44
7/8/
2004
0:1
51.
35M
.T.L
.00.
036
M.T
.L.0
0.03
67/
8/20
04 0
:30
0.45
7/8/
2004
0:3
01.
34M
.T.L
.10.
144
M.T
.L.1
0.14
47/
8/20
04 0
:45
0.44
7/8/
2004
0:4
51.
35L.
T.R
.0.
728
L.T.
R.
0.72
87/
8/20
04 1
:00
0.43
7/8/
2004
1:0
01.
33O
.R.2
1.01
0O
.R.2
0.96
07/
8/20
04 1
:15
0.43
7/8/
2004
1:1
51.
33O
.R.1
0.74
6O
.R.1
0.74
67/
8/20
04 1
:30
0.41
7/8/
2004
1:3
01.
32K
1-0
.108
K1
-0.1
087/
8/20
04 1
:45
0.35
7/8/
2004
1:4
51.
26K
20.
493
K2
0.46
87/
8/20
04 2
:00
0.33
7/8/
2004
2:0
01.
26M
HW
0.47
0M
HW
0.44
07/
8/20
04 2
:15
0.3
7/8/
2004
2:1
51.
197/
8/20
04 2
:30
0.29
7/8/
2004
2:3
01.
167/
8/20
04 2
:45
0.25
7/8/
2004
2:4
51.
14
Ran
ge R
atio
Cal
cula
tions
7/8/
2004
3:0
00.
187/
8/20
04 3
:00
1.07
7/8/
2004
3:1
50.
137/
8/20
04 3
:15
1.03
App
endi
x J
7/8/
2004
3:3
00.
057/
8/20
04 3
:30
0.97
7/8/
2004
3:4
50.
027/
8/20
04 3
:45
0.91
7/8/
2004
4:0
0-0
.03
7/8/
2004
4:0
00.
887/
8/20
04 4
:15
-0.1
7/8/
2004
4:1
50.
82
100


Determination of Mean High Water Mark 103
List of References
Baldwin, A.J. 1982, Seaward Cadastral Boundaries. New Zealand Surveyor, February 1982, pp141-145. Blume, P. 1995, Mean High Water Revisited. New South Wales Staff Surveyors Association Incorporate Annual Conference. Newcastle 1995. Brown, C.M, Walter, G.R, Donald, A.A 2003, Brown’s Boundary Control and legal Principles, 5th Edition. May, 2003. Butt, P., 1988, Land Law. Law Book Company.2nd Edition, 1988, pp433-434. Cole, G.M.,1997, Water Boundaries. John Wiley & Son, Inc., 1st Edition, 1997.
Coutts, B J. 1987, Mean High Water As A Cadastral Boundary, New Zealand Surveyor February 1987. pp544-559
DLWC, 2004, Estuaries of NSW- Physical Characteristic and Behaviour.Department of Land and Water Conservation. viewed 8/5/4. <http://www.dlwc.nsw.gov.au/care/water/estuaries/FactSheets/Physical/limits.html> Ferrier, A. 1985, Investigations Relating to Definitions of Mean High Water Mark of Lake MacQuarie, Internal Report, Location Unknown, NSW, Australia. Freedman & Higgins c.2001, What Do You Mean By Mean High Tide? The Public Trust Doctrine in Rhode Island. http://www.crmc.ri.gov /projects/pdfs/wdymbht.pdf Viewed on 10/6/4.
Gordon, A. 2003, The Boundary of Ignorance, viewed 4/4/4 <www.sydneycoastalcouncils.com.au/newsletter/HWM%20The%20Boundary%20o%20Ignorance.doc> Hallmann, F.M. 1973, Legal Aspects of Boundary Surveying as apply in New South Wales. The Institution of Surveyors, Australia, NSW Division. Sydney. Hallmann, F.M. 2000, Legal Aspects of Boundary Surveying as apply in New South Wales. The Institution of Surveyors, Australia, NSW Division. Sydney. Hallmann, F.M. 2004, Legal Aspects of Boundary Surveying as apply in New South Wales. The Institution of Surveyors, Australia, NSW Division. Sydney.

Determination of Mean High Water Mark 104
Hanna, R. 1989, Guidelines for assessing claims for alteration to Mean High Water Marks. New South Wales Staff Association Incorporated Annual Conference. Nowra. NSW, Australia. Hannah, J & Deny, P.H. 1998, GPS and Sea Level Measurements in New Zealand. viewed 8/5/4 <http://www.pol.ac.uk/psmsl/gb/gb6/denys.html > Harcombe, P.1985, Practical aspects in determining Mean High Water Mark. New South Wales Staff Surveyors Association Incorporated Annual Conference. Nowra. NSW, Australia. Hirst, B & Todd, P, 1990, Defining boundaries within the Tidal interface. Coastal GIS Conference. Wollongong. July, 2003,NSW, Australia. Horlin, E.J, c.1990, Determination of Riparian and Littoral Boundaries, , Unpublished, Department of Land Information, Western Australia. Hurcum, N,1992, Investigations, HWM Bellinger River, DP814538 Parish North Bellingen, County Raleigh, Land Information Centre.1992. Jones, R, 2002, Bill read second tim , viewed5/4/4.<Http://www.parliament. nsw.gov.au/prod/parlment/HansTrans.nsf/all/ca256d110020B6CDCA256C6800357B1C> Lanmbden, D. W. & de Rijcke, I, 1996, Legal Aspects of Surveying Water Boundaries. Carswells, Ontario, Canada. ISG (1976) NSW Dep’t Land, 1976, Manual of the New South WalesIintegrated Survey Grid. New South Wales Department of Lands. Sydney, NSW, Australia. Maloney, F.E. and Ausness, R.C,1974, The Use and Legal Significance of The MeanHigh Water Line in Coastal Boundary Mapping, North Carolina Law Review, Vol. 53, pp. 185-266. MHL, 1995, Tidal data Compilation, prepared by Manly Hydraulic Laboratory for Department of Land and Water Conservation, Report MHL937. Moore, J, 1968, Land by the Water. The Australian Law Journal. Vol. 41.pp. 532-542. Australia. MSQ Qld 2004, Guide to Semidurnal Tidal Planes, viewed 21/9/4 <(http://www.msq.qld.gov.au/…/index/tide_tidal_plane>, September 2004 )> Nichols, S.E. and McLaughlin, J, 1984, Tide Mark or Tidal Datum: The need for an interdisciplinary approach to tidal boundary delimitation, Report from Department of Surveying Engineering, University of New Brunswick, Fredericton, N.B.
Determination of Mean High Water Mark 105
New South Wales Surveying Regulations 2001 (amendments Surveying Regulations 2003). viewed 9/4/4 <http://www.bossi.nsw.gov.au/surveyor/pracreg.pdf> New South Wales Surveyor General’s Directions 2004 (draft), Surveyor General’s Department, Land and Property Information Centre, Sydney. NOAA, 2003, National Oceanic and Atmospheric Administration, Computation Techniques For Tidal Datums Handbook, Special Publication NOS CO-OP2 (Http:// Viewed 10/9/4 <http://www.co-ops.nos.noaa.gov/pub.html>
Thom, B., 2003., Changes to the Coastal Protection Act Professor Bruce Thom Coastal Council of NSW, viewed 23/3/4 <ttp://www.cumberlandgroup.com.au/Development-Seminar-2003-Session-1.htm> Songberg, G. 2004. Accurate Mean High Water Mark Determination Fact or Fiction. New South Wales Staff Surveyors Association Incorporated Annual Conference. Entrance. NSW, Australia. Standards and Practices for Control Surveys (SP1), 2002. Intergovernmental Committee on Surveying and Mapping. Version 1.5. Publication No.1. VanderNie, J.,2003. Tidal Interface – Analysis of Legal Entities – Tasmania, Tidal Interface Working Group, Compendium of Terms, Inter- governmental Committee on Surveying and Mapping, May, 2003 viewed 23/4/4 <www.icsm.gov.au/icsm/publications/ tidal_interface >
Case Law Attorney General v. Chambers, 43 Eng.Rep. 486 (1854). State of Queensland v Beames [2002] QCA 209 Borax Consolidated, Ltd. v. City of Los Angeles, 196 U.S. 10 (1935). Luttes v. State of Texas (1958)- 289 SW2 357, 324 SW2 167 Pascale v. Sutherland Shire Council (1995) 87 LGERA 30