determination of ephemeral intermittent … final draft hydrology protocol for the determination of...
TRANSCRIPT

1
FINAL DRAFT
HYDROLOGY PROTOCOL
FOR THE
DETERMINATION OF EPHEMERAL, INTERMITTENT, AND PERENNIAL WATERS
Prepared by
Surface Water Quality Bureau New Mexico Environment Department
December 2010

2
This page left intentionally blank.

3
SUMMARY The Hydrology Protocol provides a methodology for distinguishing among ephemeral, intermittent and perennial streams and rivers in New Mexico. The ability to make such determinations is often key to assuring that the appropriate designated uses and water quality criteria are applied to a particular water. New Mexico’s water quality standards (Standards for Interstate and Intrastate Waters, 20.6.4 NMAC) set distinct protections for unclassified ephemeral, intermittent and perennial waters (see 20.6.4.97-99 NMAC) and also identify many classified waters by their hydrology, e.g. “perennial tributaries to” or “perennial reaches of” (see 20.6.4.101-899 NMAC), so use of this protocol will be helpful in determining the hydrologic nature of the waterbody in order to properly classify and protect waters of the State. The Hydrology Protocol was specifically developed to generate documentation of the uses supported by the hydrology of a given stream or river (see Appendix 1 for information on the development process). This information can then be used to provide technical support for a Use Attainability Analysis (UAA), and is required for the expedited UAA process (20.6.4.15C NMAC); however, it cannot be used in place of the UAA. The information gained from the protocol can also be used to identify unclassified waters within an otherwise classified standards segment. The details of these specific applications are described in Section II of New Mexico’s Water Quality Management Plan and Continuing Planning Process, to which this Hydrology Protocol is an appendix. Other applications where a determination of stream hydrology is necessary are possible, but results of the hydrology protocol must be evaluated cautiously within the specific decision framework. The protocol relies on hydrological, geomorphic and biological indicators of the persistence of water and is organized into two levels of evaluations. The Level 1 Evaluation is required for the expedited UAA process described in 20.6.4.15C NMAC. The expedited process facilitates the efficient application of the limited aquatic life and secondary contact uses to ephemeral waters where appropriate. SWQB or any other party may conduct a UAA, therefore the user/evaluator may be a member of SWQB, another regulatory agency, a contractor, or a member of the public. Data gathered during the Level 1 Evaluation should, in most cases, provide enough information to give a clear indication of the hydrological status of the stream. A “Cover Sheet” is included in Appendix 2 as part of the required field sheets. The cover sheet is necessary for the expedited UAA process and is designed to explain how the supporting documentation from the Level 1 Evaluation is consistent with the UAA conclusion, namely that the stream reach identified is ephemeral and that attainment of Clean Water Act Section 101(a)(2) aquatic life and recreational uses is not feasible due to the factor identified in 40CFR131.10(g)(2): natural, ephemeral, intermittent, or low flow conditions or water levels prevent the attainment of the use. Additional information and explanation may be attached if needed. In certain instances, additional data and supporting information are necessary to determine the hydrological condition of the stream. The methods described as part of the Level 2 Evaluation may be conducted if the Level 1 Evaluation is inconclusive (i.e. the score falls within a gray zone – see Section 2, Table 5). The Level 2 Evaluation relies on more intense and focused data collection efforts and provides the evaluator with additional data and information to make a final

4
hydrological determination. The Level 2 Evaluation may be used for either an expedited or regular UAA as documentation to support the proper standards classification of a given reach. Regardless of whether a Level 1 or Level 2 Evaluation is performed, the SWQB encourages the evaluator to gather as much information as possible to make an accurate assessment of the stream. Recommendations are provided in the protocol, but other data not included in these recommendations may be gathered as well.

5
Introduction Streamflow can be described as flowing surface water along a defined natural channel generated by a combination of (Maidment 1993):
Stormflow – streamflow resulting from the relatively rapid runoff of precipitation from the land as interflow (rapid, unsaturated, subsurface flow), overland flow, or saturated flow from raised, near surface water tables close to the stream
Baseflow – return flow from sustained groundwater discharge into the channel Contributions of discharge from upstream tributaries as stormflow or baseflow Contributions of discharge from point source dischargers and irrigation return flows.
In this protocol, the term “stream” refers to a wadeable, lotic water body (typically 1st, 2nd, or 3rd order) and the term “river” refers to a non-wadeable, lotic water body (generally 4th order or higher). Throughout this document the terms are interchangeable with one another as the same process and procedures are used regardless of whether the channel is wadeable or not. Streams are drainage features that may change from ephemeral to intermittent and intermittent to perennial along a gradient or continuum—sometimes with no single distinct point demarcating these transitions. Nevertheless, all stream systems are characterized by interactions among hydrological, biological, and geomorphic (physical) processes. Attributes of these three processes are used in this protocol to produce a numeric score. The score is then used to characterize the reach as “ephemeral,” “intermittent,” or “perennial.” Definitions The draft Hydrology Protocol is based on the definitions of “ephemeral,” “intermittent” and “perennial” recently adopted by the WQCC in 20.6.4.7 NMAC as follows:
“Ephemeral” when used to describe a surface water of the state means the water body contains water briefly only in direct response to precipitation; its bed is always above the water table of the adjacent region.
“Intermittent” when used to describe a surface water of the state means the water body contains water for extended periods only at certain times of the year, such as when it receives seasonal flow from springs or melting snow. “Perennial” when used to describe a surface water of the state means the water body typically contains water throughout the year and rarely experiences dry periods.

6
SECTION 1 – Hydrology Determination and Rating Form User/Evaluator Experience In order to distinguish ephemeral streams and rivers from non-ephemeral ones or intermittent streams and rivers from perennial ones using the information presented in this protocol, the evaluator should have experience making geomorphic, hydrological, and biological observations in New Mexico or in the semi-arid climate of the southwestern U.S. The Hydrology Protocol was designed to provide the necessary supporting documentation for an expedited Use Attainability Analysis (UAA); however the protocol is only one tool out of many that may be used to support a standard UAA. NMED or any other party may conduct a UAA, therefore the User/Evaluator may be a member of NMED, another regulatory agency, a contractor, and/or a member of the public. The Standards explain the requirements of a UAA at 20.6.4.15 NMAC. Drought Conditions Spatial and temporal variations in stream attributes occur within and among stream systems. Perhaps the predominant source of variation results from changes in the persistence and volume of flow and the temporal variation of flow. These changes can be related to seasonal precipitation and evapotranspiration patterns as well as influenced by recent weather and interannual climate variability.
Local drought information and weather data should be reviewed prior to evaluating flow conditions in the field. Perennial streams will have water in their channels year-round in the absence of drought conditions. Therefore, it is strongly recommended that field evaluations be conducted outside of drought conditions whenever possible. Drought conditions, for the purposes of this Hydrology Protocol, are defined as any time the Standardized Precipitation Index (SPI) is less than -1.5, indicating severely to extremely dry conditions (NDMC 1995). The 12-month SPI will be used to determine drought conditions and noted on the Hydrology Determination Field Sheet (Appendix 3).
The 12-month SPI was chosen for use in the Hydrology Protocol because SPIs of this time-scale can be linked to groundwater-surface water fluctuations and reservoir storage, it can provide an early warning of drought, and it can help assess drought severity. The SPI calculation for any location in New Mexico is based on 10 climate regions of New Mexico and long-term precipitation records (both rainfall and snowpack), and has available archived maps dating back to 1996. The 12-month SPI value for a particular stream is included as another piece of evidence to be evaluated before making a final stream determination. If the evaluator believes that extreme conditions such as severe drought or abnormal precipitation are influencing the overall rating, he may want to postpone a final decision until another evaluation can take place during more normal conditions. Recent Rainfall Activity Recent (generally considered to be within 48 hours) rainfall can also influence scoring; therefore it is strongly recommended that field evaluations be conducted at least 48 hours after the last known major rainfall. Field observations regarding the presence or absence of recent high flows
7
should be made and documented on the Hydrology Determination Field Sheet (Appendix 3) to supplement any available local rain gauge data and to determine if field observations were made at least 48 hours following a precipitation event. To reduce this source of variability the Level 1 Field Evaluation should occur during stable baseflow conditions which will vary by region and elevation of the study reach, but is typically between late May and mid July (to avoid snowmelt) OR mid September and early November (to avoid monsoons). Please note that the protocol and scoring mechanism have been designed with redundancy (i.e. multiple indicators) to allow for satisfactory ratings even after a recent rainfall or during drought conditions. Nevertheless, performing field evaluations during or after severe conditions, such as floods or drought, is not optimal nor is it recommended. Scoring The Hydrology Determination Field Sheet is used to record the score for each attribute and determine the total numeric score for the reach under investigation. The sheet specifically requests information regarding Date, Project, Evaluator, Site, Assessment Unit, 12-month SPI Value, and Latitude/Longitude. However, any other pertinent observations will also be recorded on this sheet, such as indications of recent rain events. These should include the amount and date of the last recent rain, if available, and evidence of any anthropogenic influences and modifications. The Hydrology Determination Field Sheet is an official record, so all pertinent observations will be recorded on it. A “yes” / “no” format was determined to be inadequate to properly encompass and assess the natural variability encountered when making hydrological determinations in the field. Therefore, a four–tiered, weighted scale is used for evaluating and scoring each attribute. The scores, “Poor”, “Weak”, “Moderate”, and “Strong” are applied to sets of geomorphic, hydrological and biological attributes. Moderate scores are intended as an approximate qualitative midpoint between the two extremes of Poor and Strong. The remaining qualitative description of Weak represents gradations that will often be observed in the field. The score given to an attribute reflects the evaluator’s judgment of the average degree of development of the attribute along a representative reach. These categories are intended to allow the evaluator flexibility in assessing variable features or attributes. In addition, the small increments in scoring between gradations will help reduce the range in scores between different evaluators. The score ranges were developed to better assess the often gradual and variable transitions of streams from ephemeral to non-ephemeral. Definitions of Poor, Weak, Moderate and Strong are provided in Table 1. These definitions are intended as guidelines and the evaluator must select the most appropriate category based upon experience and observations of the reach under review, its watershed, and physiographic region.
8
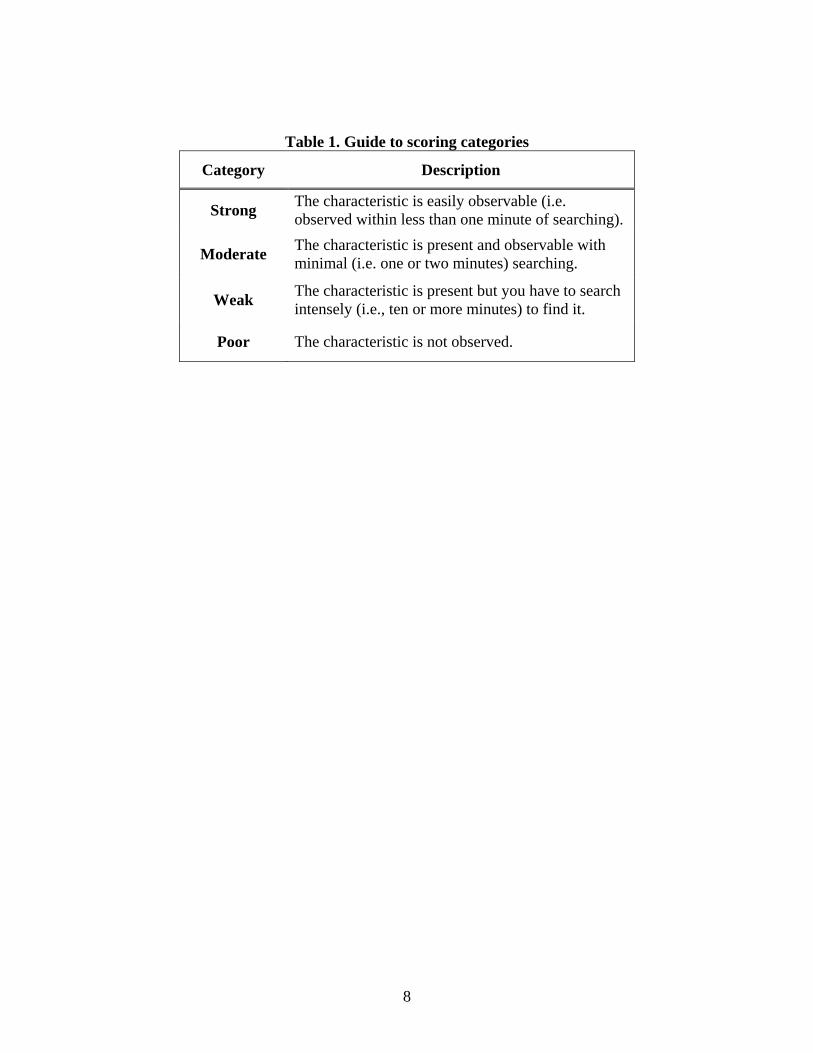
Table 1. Guide to scoring categories
Category Description
Strong The characteristic is easily observable (i.e. observed within less than one minute of searching).
Moderate The characteristic is present and observable with minimal (i.e. one or two minutes) searching.
Weak The characteristic is present but you have to search intensely (i.e., ten or more minutes) to find it.
Poor The characteristic is not observed.

9
LLEEVVEELL 11 EEVVAALLUUAATTIIOONN:: DDaattaa CCoolllleeccttiioonn ffoorr tthhee HHyyddrroollooggyy DDeetteerrmmiinnaattiioonn ooff NNMM SSttrreeaammss aanndd RRiivveerrss
Level 1 Office Procedures The following information should be reviewed prior to conducting a Level 1 Field Evaluation. Gather as much information as you can prior to field work. Unfortunately, not all information listed here will be available for every AU.
Historic or recent flow data from gauges such as those managed by the USGS or Los Alamos National Laboratory (LANL) should be used to make hydrological determinations. Gauge data, if available, may clearly indicate ephemeral, intermittent, or perennial flow patterns for the available period of record and will facilitate the scoring of Indicator #1.1 Water in Channel. The following coverages and resources reside on the SWQB GIS station and will help identify (and name) the appropriate AU for a given investigation and generate field maps showing the project area. In addition, the aerial photographs, GIS coverages and resources listed below can be used to calculate sinuosity prior to field work (see Indicator #1.7 (Sinuosity) for more information). Those who do not have access to the SWQB GIS station or other research tools utilized by the SWQB may use whatever tools and programs they have at their disposal – the idea being to gather as much physical and geographic information about the study reach as possible prior to going out into the field.
Useful resources and/or SWQB projects include:
- Google Earth - NHD_Plus_AUs.mxd (ArcGIS project on Desktop) - NMED_data.apr (ArcView project on Desktop) - C://Projects/Hydro_Protocol_Sites.apr (ArcView project)
Useful coverages that can be added to an ArcGIS or ArcView project include:
- SWQB water quality stations - SWQB assessment units - NHD_streams - OSE data (F://GIS folder/data/OSE data/NMOSE_EGIS) - USGS quadrangle maps - Aerial photographs - National Hydrography Dataset, 2004 - Digital Geologic Map of NM - National Land Cover Dataset, 2000 - BLM Land Status, 2005 - USDA or NRCS soil survey - Omernik Ecoregions - NM Roads
10
The following resources will help determine drought conditions and recent rainfall activity. Unfortunately, not all information listed here will be available for every AU:
- Historic or recent flow data (known sources include SWQB, USGS, or localized sources such as Los Alamos National Laboratory for waters on the Pajarito Plateau)
- Standardized Precipitation Index: http://www.drought.unl.edu/monitor/currspi.htm - Rain gauge stations within the County - Airport/regional climate data - The National Weather Service:
a. http://www.weather.gov/climate/index.php?wfo=abq b. http://www.weather.gov/climate/xmacis.php?wfo=abq c. http://water.weather.gov/
Refer to Drought Conditions and Recent Rainfall Activity on pages 5-6 for more information. Stream Segment Identification, Reach Selection & Field Map Generation This protocol describes a method for assessing geomorphic, hydrological, and biological indicators of stream flow duration. However, flow characteristics often vary along the length of a stream, resulting in gradual transitions in flow duration. Choosing the reach on which to conduct an assessment can influence the resulting conclusion about flow duration. Stream and river reaches are defined by various factors such as hydrological or watershed boundaries, geology, topography, incoming tributaries, surrounding land use/land management, water quality standards, etc. Before a determination of hydrology can be made for a stream the appropriate reach must be identified. For SWQB, reaches are classified as assessment units (AUs) that are designed to represent waters with assumed homogeneous water quality (WERF 2007). AUs in New Mexico average 10 miles in length and are typically no more than 25 miles in length, unless there are no tributaries or land use changes to consider along the reach (NMED/SWQB 2008). Below are several factors to look for when determining the representativeness of the AU and study reach:
- Are there significant tributaries (2nd order or higher) entering along the reach? - Are there any changes in geology? - Are there any dramatic shifts in land use? - Is there a dramatic change in slope? - Are there changes in riparian vegetation type and amount? - Are there any point sources discharging into the reach? - Are there any irrigation return flows discharging into the reach?
Many of these questions may be evaluated using maps and remote sensing products (e.g. Google Earth), however field reconnaissance along the length of the proposed reach – to evaluate potential gradients in stream hydrology and to select representative site(s) for hydrologic evaluation – should also be conducted.

11
If there are questions regarding the homogeneity of an AU (e.g. you answered “yes” to any of the questions above) then a hydrology evaluation should be performed on multiple reaches along the AU to identify potential transition point(s) between flow categories and accurately characterize the AU. The reach(es) selected for evaluation with the Hydrology Protocol should be as representative as possible of the natural characteristics of the AU. Additionally, SWQB typically defines a representative reach for conducting data collection (such as is associated with the protocol) as 40 times the average stream width or 150 meters, whichever is larger. Level 1 Field Procedures In order to distinguish between ephemeral, intermittent, and perennial streams and rivers using the information presented in this protocol, the field evaluator should have experience making geomorphic, hydrological, and biological observations in New Mexico or the semi-arid region of the southwestern U.S. Field evaluations should be performed at least 48 hours after the last known major rainfall event. In addition, it is strongly recommended that field evaluations be conducted outside of drought conditions whenever possible. Site Selection Before selecting a location for the survey, note the character of the stream while driving to the site to verify that the reach is representative of the assessment unit (AU) being characterized. This initial examination allows the evaluator to study the nature of the channel, observe characteristics of the watershed, and observe characteristics that indicate what source of water (stormflow, or base flow plus tributary/point source discharges, if present) may predominantly or solely contribute to flow in the AU. These initial observations also aid in determining the magnitude (poor, weak, moderate or strong) of specific parameters. In addition, the assessor can identify if the study reach is generally uniform (e.g. “representative”) or if it should be assessed as two or more distinct reaches. Hydrology evaluations must not be made at one point without first walking up and down the channel for at least 150 meters. Ideally, the visual examination would be from the stream origin to the downstream confluence with a larger stream or until a change in characteristics such as slope or geology is observed, but this is usually not feasible nor practical. Furthermore, property access issues may arise on privately held property. Make sure the site is easily and safely accessible. If the site is on private property get the land owner’s approval before conducting an evaluation. Photodocumentation It is important to explain the rationale behind any conclusions reached using this protocol and sometimes photos are just the medium to do that. It is essential to take several photos of the reach condition and any disturbances or modifications that are relevant to making a final hydrology determination. Photos that document the evaluation attributes (e.g. riparian vegetation, macroinvertebrates, etc.) are encouraged and provide excellent supporting documentation for any conclusions reached. The assessor should include a detailed description of each photo on the Hydrology Determination Field Sheet, including date, description of the photo (e.g. left bank, right bank, upstream, downstream, etc.), and GPS coordinates (if different from site location), and attach the
12
photos to the Field Sheet to officially document the reach condition at the time of the evaluation and to support any conclusions that were reached using this protocol. Level 1 Field Equipment and Supplies
Copy of Hydrology Protocol and associated field forms Site maps and aerial photographs (1:250 scale if possible) Global Positioning System (GPS) – used to determine latitude and longitude Clipboard/pencils/sharpies Two Metric Rulers Two Measuring Tapes Survey rod Bank pins Laser Level/Rod Eyes (preferred?) Clinometer Compass (if not available as part of GPS unit) Camera – used to photograph and document site features Shovel or Soil Auger D-frame dip net/white sorting tray (optional) Munsell soil color chart (optional) Long piece of string (optional) Mechanical tally counter (optional) Sand-gauge card (optional)
Level 1 Scoring Hydrological determinations are accomplished by evaluating up to 14 different attributes of the reach and assigning a numeric score to each attribute following the four–tiered, weighted scale described on page 7 and Table 1. Total scores reflect the persistence of water with higher scores indicating intermittent and perennial systems. Please see Section 2 – Guidance for the Determination of Streams and Rivers in NM for more details.
13
LLEEVVEELL 11 IINNDDIICCAATTOORRSS 1.1. Water in Channel It is necessary to distinguish stormwater inflow (resulting from precipitation within the past 48 hours) from baseflow. Flow observations preferably should be taken at least 48 hours after the last substantial rainfall. Local weather data and drought information should be reviewed before evaluating flow conditions. Perennial systems will have water in their channels year-round in the absence of drought conditions. Therefore, it is recommended that field evaluations be conducted outside of drought conditions whenever possible. Drought conditions are defined as any time the Standard Precipitation Index (SPI) is less than -1.5, indicating severely to extremely dry conditions (NDMC 1995). The 12-month SPI should be recorded on the field survey sheet to indicate climatic conditions at the time of sampling. Evidence of recent high flows should be noted on the Hydrology Determination Field Sheet (Appendix 3). Such evidence includes moist or wet sediment on plants or debris and organic drift lines at or above bankfull or in the active floodplain. Artificial (i.e. point-source) discharges should also be noted on form. Site inspections should result in visually discernible stream flows as evidence of base flow contribution between rain events, even in low flow conditions. If base flows are present during a site inspection that is more than 48 hours after a major rainfall event, the reach is either perennial or intermittent. However, intermittent reaches do not always have water in them. A good rule of thumb for differentiating ephemeral reaches from intermittent ones is if they have water in them during the dry season or during a drought. Look for water in pool areas in the streambed. The presence or types of plants as well as saturated sediment underneath rocks located within the channel are also good indications of the presence of water during the dry season or during a drought. If the site is visited during the dry season (typically defined in NM as late May to mid July and mid September to early November, but also varies by region and elevation of the study reach) and base flows are not evident, the reach may be ephemeral or intermittent. If there is no flowing water within 48 hours of a rain event, then the reach is more than likely ephemeral. The prerequisite for a reach to be determined as ephemeral is that there must be no evidence of base flows in the stream banks.
Strong – Flow is evident throughout the reach. Moving water is seen in riffle areas but may not be as evident throughout the runs.
Moderate – Water is present in the channel but flow is barely discernable in areas of greatest gradient change (i.e. riffles) or floating object is necessary to observe flow.
Weak – Dry channel with standing pools. There is some evidence of base flows (e.g. riparian vegetation growing along channel, saturated sediment under rocks, etc)
Poor – Dry channel. No evidence of base flows was found. If available, historic or recent flow data from gauges such as those managed by the USGS or Los Alamos National Laboratory (LANL) may clearly indicate ephemeral, intermittent, or perennial flow patterns for the available period of record and will facilitate the scoring of Indicator #1.1 Water in Channel.
14
1.2. Fish (qualitative observations) In most cases, fish are indicators of perennial systems, since fish will rarely inhabit an intermittent stream. Fluctuating water levels of intermittent streams provide unstable and stressful habitat conditions for fish communities. When looking for fish, all available habitats should be observed, including pools, riffles, root clumps, and other obstructions (to greatly reduce surface glare, the use of polarized sunglasses is recommended). In small streams, the majority of species usually inhabit pools and runs. Fish should be easily observed within a minute or two. Also, fish will seek cover once alerted to your presence, so be sure to look for them slightly ahead of where you are walking. Check several areas along the sampling reach, especially underneath undercut banks.
Strong - Found easily and consistently throughout the reach. Moderate - Found with little difficulty but not consistently throughout the reach. Weak - Takes 10 or more minutes of extensive searching to find. Poor - Fish are not present.
1.3. Benthic Macroinvertebrates (qualitative observations) The larval stages of many aquatic insects are good indicators that a stream is perennial because a continuous aquatic habitat is required for these species to mature. Turn over the rocks and other large substrate found in areas of visible flowing water, (i.e. riffles) and scan the undersides for benthic macroinvertebrates. Also observe the newly disturbed area where the rock once was for signs of movement. This method may be more suitable for mountainous areas where riffles predominate. For lower gradient systems and other areas of slow moving water, benthic macroinvertebrates may be located in a variety of habitats including root wads, undercut banks, pools, leaf-packs, and submerged aquatic vegetation. Note that some benthic macroinvertebrates will make small debris/sand cases, which can be covered with periphyton and easily confused for excess debris picked up from the substrate. The use of a small net to sample a variety of habitats including water under overhanging banks or roots, accumulations of organic debris (e.g. leaves) and the substrate may be helpful. In DRY channels, focus the search on the sandy channel margins for mussel and aquatic snail shells, any remaining pools for macroinvertebrates, and under cobbles and other larger bed materials for caddisfly casings. Casings of emergent mayflies or stoneflies may be observed on dry cobbles or on stream-side vegetation.
Strong - Found easily and consistently throughout the reach. Moderate - Found with little difficulty but not consistently throughout the reach. Weak - Takes 10 or more minutes of extensive searching to find. Poor - Benthic macroinvertebrates are not present.
1.4. Presence of Filamentous Algae and Periphyton (qualitative observations) These forms of algae are attached to the streambed substrate and require an aquatic environment to persist. They are visible as a pigmented mass or film, or sometimes hair-like growths on submerged surfaces of rocks, logs, plants and any other structures within the channel. Periphyton growth is influenced by chemical disturbances such as increased nutrient (nitrogen or phosphorus) inputs and physical disturbances such as increased sunlight to the stream from riparian zone disturbances.
15
Strong - Found easily and consistently throughout the reach. Moderate - Found with little difficulty but not consistently throughout the reach. Weak - Takes 10 or more minutes of extensive searching to find. Poor - Filamentous algae and/or periphyton are not present.
1.5. Differences in Vegetation As a rule, only perennial and intermittent systems can support riparian areas that serve the entire suite of riparian ecological functions. Ephemeral streams generally do not possess the hydrological conditions that allow true riparian vegetation to grow. Although water flows down ephemeral channels periodically, the water table does not occur sufficiently close to the soil surface to allow water loving vegetation to access the greater quantity of water they need to grow. Vegetation growing along ephemeral watercourses may occur in greater densities or grow more vigorously than vegetation in the adjacent uplands, but generally there are no dramatic compositional differences between the two. Even along those ephemeral channels where vegetation composition differs somewhat from the adjacent uplands, that vegetation does not require as much soil moisture as true riparian plants.
***Note if vegetation is absent or altered due to man-made activities on Hydrology Determination Field Sheet***
Strong – Dramatic compositional differences in vegetation are present between the banks and the adjacent uplands. A distinct riparian vegetation corridor exists along the entire reach – riparian, aquatic, or wetland species dominate the length of the reach.
Moderate – A distinct riparian vegetation corridor exists along part of the reach. Riparian vegetation is interspersed with upland vegetation along the length of the reach.
Weak – Vegetation growing along the reach may occur in greater densities or grow more vigorously than vegetation in the adjacent uplands, but there are no dramatic compositional differences between the two.
Poor – No compositional or density differences in vegetation are present between the banks and the adjacent uplands.
1.6. Absence of Rooted Upland Plants in Streambed This attribute relates flow to the absence of rooted plants, since flow will often act as a deterrent to plant establishment by removing seeds or preventing aeration to roots. Cases where rooted upland plants are present in the streambed may indicate ephemeral or intermittent flow. Focus should be on the presence of plants in the bed or thalweg and plants growing on any part of the bank should not be considered. Note, however, there will be exceptions to this attribute. For example, rooted plants can be found in shaded perennial streams with moderate flow but in all cases these plants will be water tolerant (i.e. obligate and/or facultative wetland plants).
Strong – Rooted upland plants are absent within the streambed/thalweg. Moderate – There are a few rooted upland plants present within the streambed/thalweg. Weak – Rooted upland plants are consistently dispersed throughout the streambed/thalweg. Poor – Rooted upland plants are prevalent within the streambed/thalweg.
16
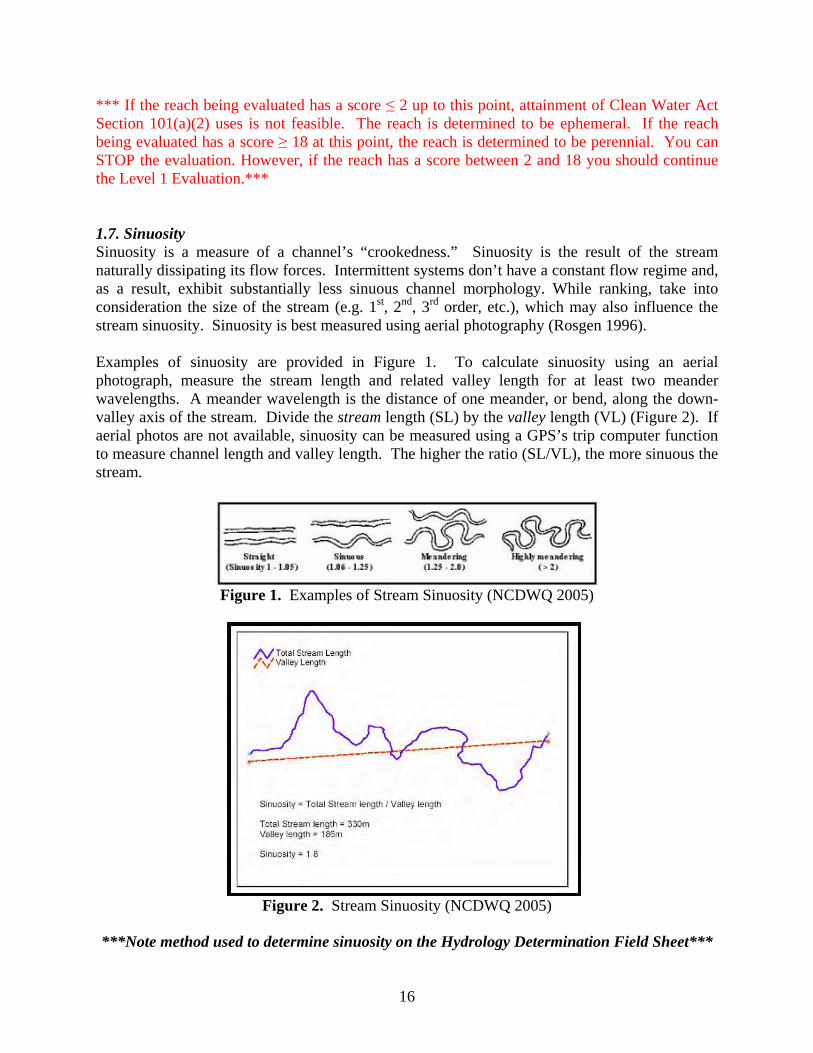
*** If the reach being evaluated has a score ≤ 2 up to this point, attainment of Clean Water Act Section 101(a)(2) uses is not feasible. The reach is determined to be ephemeral. If the reach being evaluated has a score ≥ 18 at this point, the reach is determined to be perennial. You can STOP the evaluation. However, if the reach has a score between 2 and 18 you should continue the Level 1 Evaluation.*** 1.7. Sinuosity Sinuosity is a measure of a channel’s “crookedness.” Sinuosity is the result of the stream naturally dissipating its flow forces. Intermittent systems don’t have a constant flow regime and, as a result, exhibit substantially less sinuous channel morphology. While ranking, take into consideration the size of the stream (e.g. 1st, 2nd, 3rd order, etc.), which may also influence the stream sinuosity. Sinuosity is best measured using aerial photography (Rosgen 1996). Examples of sinuosity are provided in Figure 1. To calculate sinuosity using an aerial photograph, measure the stream length and related valley length for at least two meander wavelengths. A meander wavelength is the distance of one meander, or bend, along the down-valley axis of the stream. Divide the stream length (SL) by the valley length (VL) (Figure 2). If aerial photos are not available, sinuosity can be measured using a GPS’s trip computer function to measure channel length and valley length. The higher the ratio (SL/VL), the more sinuous the stream.
Figure 1. Examples of Stream Sinuosity (NCDWQ 2005)
Figure 2. Stream Sinuosity (NCDWQ 2005)
***Note method used to determine sinuosity on the Hydrology Determination Field Sheet***

17
Strong - Ratio > 1.4. Stream has numerous, closely-spaced bends, few straight sections. Moderate - Ratio < 1.4. Stream has good sinuosity with some straight sections. Weak - Ratio < 1.2. Stream has very few bends and mostly straight sections. Poor - Ratio = 1.0. Stream is completely straight with no bends.
1.8. Entrenchment Ratio The relative importance of many fluvial processes in arid regions, especially the magnitude and frequency of their operation, differs considerably from more humid regions. As a result, channel forms also differ considerably from humid regions. Although one of the difficulties of characterizing dryland ephemeral channels is their enormous variability in form, they tend to have low entrenchment ratios relative to intermittent and perennial channels (Knight et al. 1999). Entrenchment is qualitatively defined as the vertical containment of a river and the degree to which it is incised in the valley floor (Kellerhals et al. 1972). When determining entrenchment, it is important to distinguish whether the flat adjacent to the channel is a frequent floodplain, a terrace (abandoned floodplain), or is well outside of the flood-prone area. The entrenchment ratio is the ratio of the width of the flood-prone area to the surface width of the bankfull channel (Rosgen 1994)*. The flood-prone area width is measured at the elevation that corresponds to twice the maximum depth of the bankfull channel as taken from the established bankfull stage (Figure 1). Bankfull or active channel is defined as that which is filled with moderate sized flood events that would typically occur every one or two years and do not usually inundate the floodplain. Bankfull levels can be identified by:
The presence of a floodplain at the elevation of initial flooding, The elevation associated with the highest depositional features, An obvious slope break that differentiates the channel from a relatively flat floodplain
terrace higher than the channel, A transition from exposed sediments to terrestrial vegetation, Moss growth on rocks along the banks, Evidence of recent flooding, Presence of drift material caught on overhanging vegetation, and Transition from flood- and scour-tolerant vegetation to that which is relatively
intolerant. Entrenchment Ratio Field Protocol: The evaluator(s) should start by selecting a representative reach for the purpose of obtaining bankfull data. In general, the easiest location to measure bankfull channel width is within the narrowest segment of the selected reach. Deflectors such as rocks, logs, or unusual constrictions that make a stream especially narrow should be avoided.
1. Once a representative reach is chosen, obtain a rod reading for an elevation at the “max depth” location by having one person hold a survey rod at the max depth location (thalweg) and a second person on the terrace adjacent to the stream using a clinometer and a meter stick or ski pole with one meter marked on it (if available, a surveyor’s level can be used instead of a clinometer). Hold the clinometer at the one meter mark on the ski
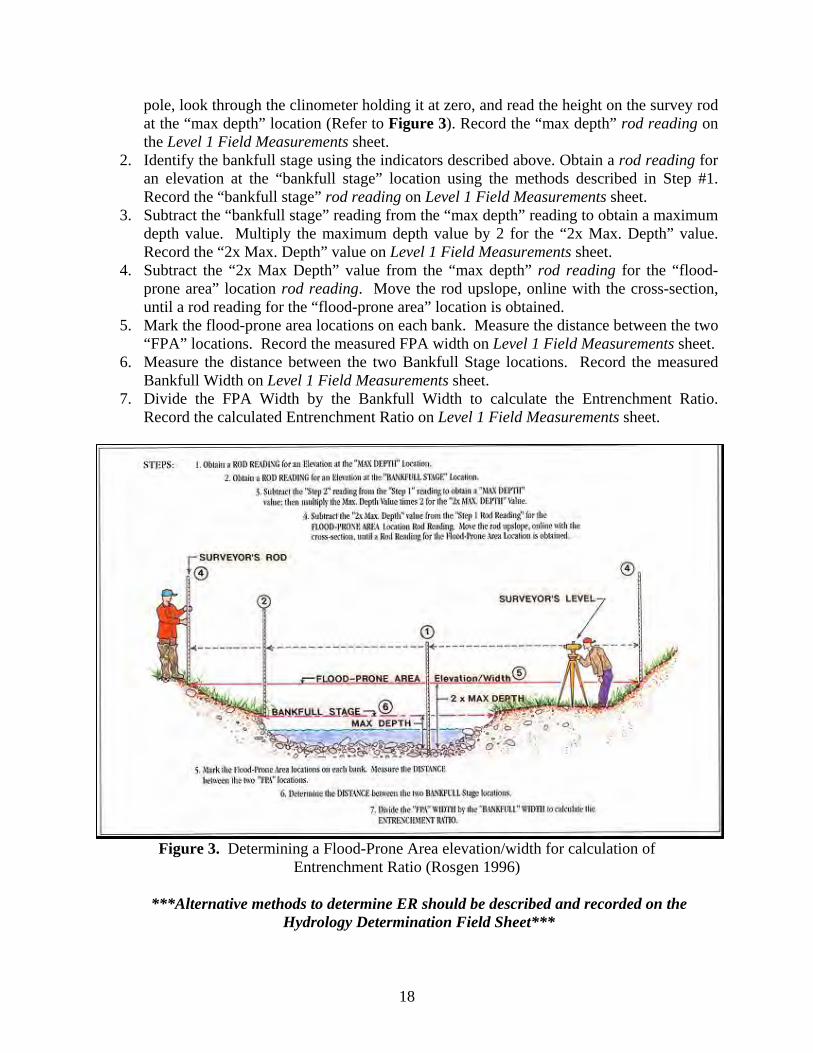
18
pole, look through the clinometer holding it at zero, and read the height on the survey rod at the “max depth” location (Refer to Figure 3). Record the “max depth” rod reading on the Level 1 Field Measurements sheet.
2. Identify the bankfull stage using the indicators described above. Obtain a rod reading for an elevation at the “bankfull stage” location using the methods described in Step #1. Record the “bankfull stage” rod reading on Level 1 Field Measurements sheet.
3. Subtract the “bankfull stage” reading from the “max depth” reading to obtain a maximum depth value. Multiply the maximum depth value by 2 for the “2x Max. Depth” value. Record the “2x Max. Depth” value on Level 1 Field Measurements sheet.
4. Subtract the “2x Max Depth” value from the “max depth” rod reading for the “flood-prone area” location rod reading. Move the rod upslope, online with the cross-section, until a rod reading for the “flood-prone area” location is obtained.
5. Mark the flood-prone area locations on each bank. Measure the distance between the two “FPA” locations. Record the measured FPA width on Level 1 Field Measurements sheet.
6. Measure the distance between the two Bankfull Stage locations. Record the measured Bankfull Width on Level 1 Field Measurements sheet.
7. Divide the FPA Width by the Bankfull Width to calculate the Entrenchment Ratio. Record the calculated Entrenchment Ratio on Level 1 Field Measurements sheet.
Figure 3. Determining a Flood-Prone Area elevation/width for calculation of
Entrenchment Ratio (Rosgen 1996)
***Alternative methods to determine ER should be described and recorded on the Hydrology Determination Field Sheet***
19
Strong - Ratio > 2.5*. Stream is slightly entrenched. Moderate - Ratio between 1.2 and 2.5. Stream is moderately entrenched. Weak - Ratio < 1.2. Stream is entrenched.
*NOTE: a high entrenchment ratio implies a low entrenchment condition, while a low entrenchment ratio implies an entrenched condition. If the channel is dry and bankfull stage cannot be determined, score this indicator based on your observations: Strong = stream is not entrenched; Moderate = stream is moderately entrenched; Weak = stream is undeniably entrenched.
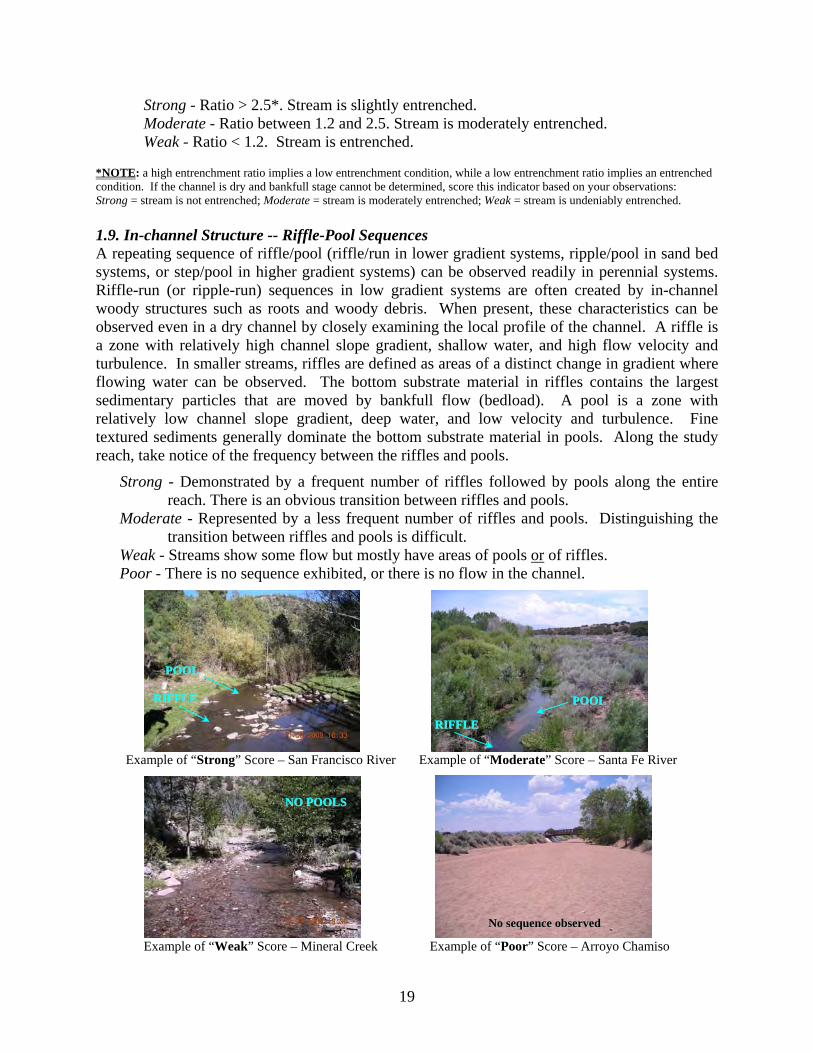
1.9. In-channel Structure -- Riffle-Pool Sequences A repeating sequence of riffle/pool (riffle/run in lower gradient systems, ripple/pool in sand bed systems, or step/pool in higher gradient systems) can be observed readily in perennial systems. Riffle-run (or ripple-run) sequences in low gradient systems are often created by in-channel woody structures such as roots and woody debris. When present, these characteristics can be observed even in a dry channel by closely examining the local profile of the channel. A riffle is a zone with relatively high channel slope gradient, shallow water, and high flow velocity and turbulence. In smaller streams, riffles are defined as areas of a distinct change in gradient where flowing water can be observed. The bottom substrate material in riffles contains the largest sedimentary particles that are moved by bankfull flow (bedload). A pool is a zone with relatively low channel slope gradient, deep water, and low velocity and turbulence. Fine textured sediments generally dominate the bottom substrate material in pools. Along the study reach, take notice of the frequency between the riffles and pools.
Strong - Demonstrated by a frequent number of riffles followed by pools along the entire reach. There is an obvious transition between riffles and pools.
Moderate - Represented by a less frequent number of riffles and pools. Distinguishing the transition between riffles and pools is difficult.
Weak - Streams show some flow but mostly have areas of pools or of riffles. Poor - There is no sequence exhibited, or there is no flow in the channel.
Example of “Strong” Score – San Francisco River Example of “Moderate” Score – Santa Fe River
Example of “Weak” Score – Mineral Creek Example of “Poor” Score – Arroyo Chamiso
PPOOOOLL
RRIIFFFFLLEE PPOOOOLL
RRIIFFFFLLEE
NNOO PPOOOOLLSS
NNoo sseeqquueennccee oobbsseerrvveedd

20
*** If the reach being evaluated has a score ≤ 5 at this point, attainment of Clean Water Act Section 101(a)(2) uses is not feasible. The reach is determined to be ephemeral. If the reach being evaluated has a score ≥ 21 at this point, the reach is determined to be perennial. You can STOP the evaluation. However, if the reach has a score between 5 and 21 you should continue the Level 1 Evaluation.*** 1.10. Particle size or Stream Substrate Sorting This feature can be examined in two ways. The first is to determine if the sediment texture in the bottom of the channel is similar to the texture outside the channel. If this is the case, then there is evidence that erosive forces have not been active enough to down cut the channel and support an intermittent or perennial system. Sediment in the bed of ephemeral channels typically have the same or comparable texture (i.e. particle size) as areas close to but not in the channel. Accelerated stormflow resulting from human activities may produce deep, well-developed ephemeral or intermittent channels but which have little or no coarse bottom materials indicative of upstream erosion and downstream transport. The bottom substrate of non-ephemeral systems often has accumulations of coarse sand and larger particles. The second way this feature can be examined is to look at the distribution of the particles in the substrate in the channel. In lower-gradient, sand-bed streams one may need to look for size variations among sand grains – for instance, coarse versus fine sand. Note, however, the usefulness of this attribute may vary among ecoregions. For instance, in the plateaus or tablelands the variability in the size of substrate particles will probably be less than in the mountains. Examples of Methods used to determine particle size and gradation:
- Sand Gauge Reference Card (best for sand dominated systems) - Standard Sieve Analyses - Wire Screen Method - Pebble Count Method:
EPA’s EMAP Pebble Count Wolman Pebble Count Zig Zag Pebble Count USFS Pebble Count Sampling Frame
For whatever method is chosen, repeat procedure for an area close to but not in the channel for comparison purposes. Step outside the bankfull width or above the bank onto the floodplain or first terrace and repeat the procedure used in the bankfull channel. Avoid areas of dense vegetation and soil accumulation. Beware of cactus, snakes, and other hazards when “blindly” picking up particles outside of the channel or even in dry streambeds. For pebble counts, the objective is to measure at least 50 pebbles in the channel and 50 pebbles in areas close to but not in the channel for accurate distributional representations and comparisons.
21
Strong - Particle sizes in the channel are noticeably different from particle sizes in areas close to but not in the channel. There is a clear distribution of various sized substrates in the channel with finer particles accumulating in the pools, and larger particles accumulating in the riffles/runs.
Moderate - Particle sizes in the channel are moderately similar to particle sizes in areas close to but not in the channel. Various sized substrates are present in the channel and are represented by a higher ratio of larger particles (gravel/cobble).
Weak - Particle sizes in the channel are similar or comparable to particle sizes in areas close to but not in the channel. Substrate sorting is not readily observed in the channel.
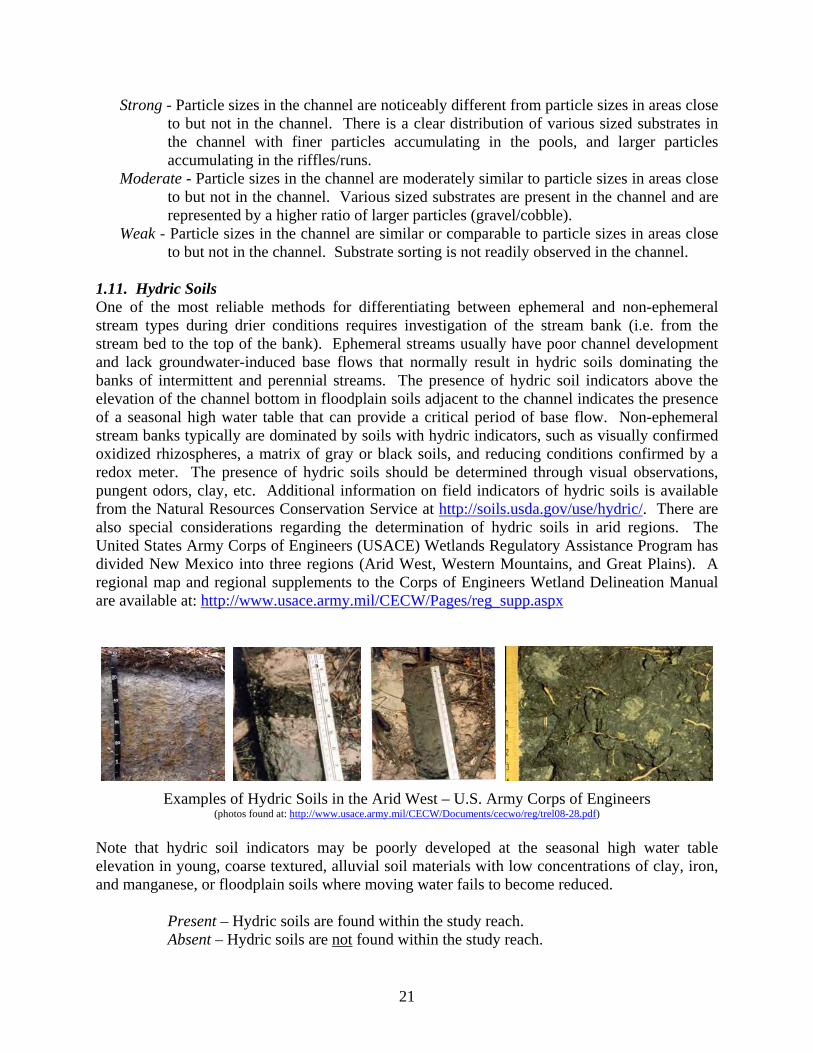
1.11. Hydric Soils One of the most reliable methods for differentiating between ephemeral and non-ephemeral stream types during drier conditions requires investigation of the stream bank (i.e. from the stream bed to the top of the bank). Ephemeral streams usually have poor channel development and lack groundwater-induced base flows that normally result in hydric soils dominating the banks of intermittent and perennial streams. The presence of hydric soil indicators above the elevation of the channel bottom in floodplain soils adjacent to the channel indicates the presence of a seasonal high water table that can provide a critical period of base flow. Non-ephemeral stream banks typically are dominated by soils with hydric indicators, such as visually confirmed oxidized rhizospheres, a matrix of gray or black soils, and reducing conditions confirmed by a redox meter. The presence of hydric soils should be determined through visual observations, pungent odors, clay, etc. Additional information on field indicators of hydric soils is available from the Natural Resources Conservation Service at http://soils.usda.gov/use/hydric/. There are also special considerations regarding the determination of hydric soils in arid regions. The United States Army Corps of Engineers (USACE) Wetlands Regulatory Assistance Program has divided New Mexico into three regions (Arid West, Western Mountains, and Great Plains). A regional map and regional supplements to the Corps of Engineers Wetland Delineation Manual are available at: http://www.usace.army.mil/CECW/Pages/reg_supp.aspx
Examples of Hydric Soils in the Arid West – U.S. Army Corps of Engineers (photos found at: http://www.usace.army.mil/CECW/Documents/cecwo/reg/trel08-28.pdf)
Note that hydric soil indicators may be poorly developed at the seasonal high water table elevation in young, coarse textured, alluvial soil materials with low concentrations of clay, iron, and manganese, or floodplain soils where moving water fails to become reduced.
Present – Hydric soils are found within the study reach. Absent – Hydric soils are not found within the study reach.
22
1.12. Sediment on Plants or Debris The transportation and processing of sediment is a main function of streams. Therefore, evidence of sediment on plants or other debris in the channel may be an important indicator of recent high flows. Note that sediment production in stable, vegetated watersheds is considerably less than in disturbed watersheds. Are plants in the channel, on the streambank, or in the floodplain covered with sediment? Look for silt/sand accumulating in thin layers on debris or rooted aquatic vegetation in the runs and pools. Be aware of upstream land-disturbing construction activities, which may contribute greater amounts of sediments to the channel, and can confound this indicator. Note these activities on the data sheet if these confounding factors are present.
Strong – Sediment found readily on plants and debris within the channel, on the streambank, and within the floodplain throughout the length of the reach.
Moderate – Sediment found on plants or debris within the channel although not prevalent along the reach. Mostly accumulating in pools.
Weak – Sediment is isolated in small amounts along the reach. Poor – No sediment is present on plants or debris.
**Refer to Section 2, page 32, for guidance on overall Level 1 score interpretation**

23
LLEEVVEELL 11 SSUUPPPPLLEEMMEENNTTAALL IINNDDIICCAATTOORRSS
The following indicators do not occur consistently throughout New Mexico, which may be the reason why they were not statistically significant between waterbody types. Regardless, when they occur they are useful indicators in the determination of perenniality. If the indicator is present record the score on the Hydrology Determination Field Sheet (Appendix 3) and include the score when calculating the total points. 1.13. Seeps and Springs Seeps: Seeps have water dripping or slowly flowing out from the ground or from the side of a hill or incised streambank. Springs: Look for “mushy” or very wet, black decomposing leaf litter nearby in small depressions or in the channel. Springs and seeps often are present at grade controls and headcuts. The presence of this indicator suggests that groundwater is a source of streamflow except during a period of drought. Score this category based on the abundance of these features observed within the reach. 1.14. Iron Oxidizing Bacteria/Fungi These features are often (although not exclusively) associated with groundwater. Iron oxidizing bacteria/fungi derive energy by oxidizing iron, originating from groundwater, in the ferrous form (Fe2+) to the ferric form (Fe3+). In large amounts, iron-oxidizing bacteria/fungi discolor the substrate giving it a red, rust-colored appearance. In small amounts, it can be observed as an oily sheen on the water’s surface. This indicates that the stream water is derived from a groundwater source, and these features are most commonly seen in standing water on the ground’s surface or in slow moving creeks and streams. Filmy deposits on the surface or banks of a stream are often associated with the greasy "rainbow" appearance of iron oxidizing bacteria. This is a naturally occurring phenomenon where there is iron in the groundwater. However, a sudden or unusual occurrence may indicate a petroleum product release from an underground fuel storage tank. One way to differentiate iron-oxidizing bacteria from oil releases is to trail a small stick or leaf through the film. If the film breaks up into small islands or clusters, it is most likely bacterial in origin. However, if the film swirls back together, it is most likely a petroleum discharge.
Oily sheen on water’s surface due to iron-oxidizing bacteria (photos found at: http://www.arlingtonva.us/departments/EnvironmentalServices/epo/EnvironmentalServicesEpoDr.aspx)
**Refer to Section 2, page 32, for guidance on overall Level 1 score interpretation**

24
LLEEVVEELL 22 EEVVAALLUUAATTIIOONN:: BBoorrddeerrlliinnee DDeetteerrmmiinnaattiioonnss If after conducting a Level 1 Evaluation, a hydrological determination cannot be made because more information is required, then a Level 2 Evaluation should be conducted between mid August and mid November to coincide with SWQB’s biological index period. Level 2 Office Procedures
Refer to the results of the Level 1 Evaluation. If this step was not completed in the Level 1 Evaluation or cannot be located then refer to Drought Conditions and Recent Rainfall Activity on pages 5-6 and the Level 1 Office Procedures on pages 8-10, particularly Stream Segment Identification, Reach Selection & Field Map Generation, for more information.
Additional Supporting Information Additional supporting information may not be scored but can be used to support a Level 2 hydrological determination. Unfortunately, not all information listed here will be available for every assessment unit. Additional supporting information includes, but is not limited to:
Observation of flow: Observation of flow under certain seasonal or hydrological conditions can directly support classifying a reach as perennial. Reaches with flow during the dry season or periods of drought are likely perennial. Although the presence of flow during a drought indicates perennial conditions, care must be taken in evaluating the upper limits of perenniality because some perennial systems may only contain isolated pools of water or be dry during periods of drought. - Historic or recent SWQB thermograph data may provide some insight on flow during
certain seasonal or hydrological conditions - Do thermograph and/or streamflow data (or lack thereof) warrant the use of
equipment to estimate the onset and cessation of flow? (See Indicator #2.1 below)
Key biological indicators: As discussed below, the presence of aquatic organisms whose life cycle requires residency in flowing water for extended periods (especially those one year or greater) is a strong indication that a reach is perennial. If a reach is recognized as borderline, a qualified aquatic biologist or environmental scientist should evaluate the presence and abundance of such macroinvertebrates and vertebrates species before making a final hydrological determination. - Current and/or historic fisheries data may be found at:
o Natural Heritage New Mexico (http://nhnm.unm.edu/) o Museum of SW Biology (http://www.msb.unm.edu/index.html) o Sublette, James E. et al. 1990. The Fishes of New Mexico – First Edition.
University of New Mexico Press. 393 p. - SWQB Fisheries Data may be found at P:\SWQB PUBLIC\Gary S Public
Other information that may be considered: - Groundwater contour maps and/or nearby, local well logs. - Information provided by a long-term resident and/or local professional who has observed
the stream during various seasons and hydrological conditions.

25
- Review of historic information such as aerial photography. - Professional judgment may be used in conjunction with the total score and supporting
information in making the final determination.
Level 2 Field Procedures
In order to distinguish between ephemeral, intermittent, and perennial streams and rivers using the information presented in this protocol, the field evaluator should have experience making geomorphic, hydrological, and biological observations in New Mexico or the semi-arid region of the southwestern U.S. Field evaluations should be performed at least 48 hours after the last known major rainfall event. In addition, it is strongly recommended that field evaluations be conducted outside of drought conditions whenever possible. Drought conditions, for the purposes of this Hydrology Protocol, are defined as any time the 12-month SPI is less than -1.5, indicating severely to extremely dry conditions (NDMC 1995). Refer to the results of the Level 1 Evaluation. If this step was not completed in the Level 1 Evaluation or cannot be located then refer to the Level 1 Field Procedures, specifically Site Selection and Photodocumentation, on page 10 for more information. Level 2 Field Equipment and Supplies Copy of Hydrology Protocol and associated field forms Thermograph deployment/download form Fish collection/voucher specimen sheet Site maps and aerial photographs (1:250 scale if possible) Global Positioning System (GPS) –
used to determine latitude and longitude Camera and Compass –
used to photograph and document site features Clipboard/pencils/sharpies Measuring tape Survey flags for transect locations Survey rod Bank pins Level Shovel or Soil Auger Thermographs with caps and tags Zip ties/bailing wire Hammer & T-post driver Rebar & T-posts (various lengths) Flagging Wire/tie cutters Kicknet (18 inch; 500µm net size)
Forceps Sieve (500µm mesh) Buckets -- to help sort
macroinvertebrates Sample containers (500-mL or 1-L) Ethanol Ethanol-proof sample labels Ethanol-proof pen Timepiece Backpack electrofisher &
accessories Seine net Buckets & aerators Dip & aquarium nets Voucher kit & formalin Field guide Collection permits Measuring Board One battery per site –
for electrofisher + back-up
26
LEVEL 2 INDICATORS 2.1. Water in Channel (OPTIONAL) Observation of flow under certain seasonal or hydrological conditions can directly support classifying a reach as perennial. Reaches with flow during the dry season or periods of drought are likely perennial. The longer the period from the last substantial rainfall the stronger the presence of flow supports the perennial determination. Although the presence of flow during a drought indicates perennial conditions, care must be taken in evaluating the upper limits of perenniality because some perennial systems may only contain isolated pools of water or be dry during periods of drought. If available, historic or recent flow data from gauges such as those managed by the USGS or Los Alamos National Laboratory (LANL) may clearly indicate ephemeral, intermittent, or perennial flow patterns for the available period of record and will facilitate the scoring of this indicator. If gauge data are not available, temperature sensors (or electrical resistance sensors or pressure transducers) can be used to estimate the onset and cessation of flow (Constanz et al. 2001; Lawler 2002; Blasch et al. 2002). Periods of flow are characterized by those sections of the thermograph where the amplitude of the diel temperature signal is visibly dampened (Constanz et al. 2001). When the in-stream temperature data are compared graphically to the temperature data from a nearby site out of streamflow where little dampening has occurred, a flow signal is easily identifiable.
Strong – The water sensor is decidedly different from the air sensor. The streamflow signal is easily identifiable and occurs throughout the entire time of deployment (i.e. water sensor has a diel signal that is visibly dampened compared to air sensor throughout the deployment).
Moderate – The water sensor differs from the air sensor. A flow signal is identifiable during the majority of time; however, there are short periods of time when the water sensor has a diel signal that is comparable to the air sensor indicating periods of drying.
Weak – The water sensor differs somewhat from the air sensor. A flow signal is identifiable during certain days or weeks; however, there are long periods of time when the water and air sensors have similar diel signals (i.e. no dampening) indicating dry periods.
Poor – There are no substantial differences between the water and air sensors. The two thermographs are visibly comparable to one another indicating little to no water in the channel.
**If using an electrical resistance sensor or pressure transducer, use the following ratings:
Strong – The streamflow signal is easily identifiable and occurs throughout the entire time of deployment
Moderate – A streamflow signal is identifiable during the majority of time; however, there are short periods of time when the sensor indicates periods of drying.
Weak – A streamflow signal is identifiable during certain weeks or months; however, there are long periods of time when the sensor indicates a dry channel.
Poor – There is no sustained streamflow signal from the sensor (flow signal is only for very brief periods of time – on the timescale of days – indicating a flow response due to storm events). Or there is no discernible streamflow signal.

27
2.2. Hyporheic Zone/Groundwater Table Hyporheic zone: Even when there is no visible flow above the channel bottom, there may likely be slow groundwater discharge into and downstream flow in the hyporheic zone. The hyporheic zone is the subsurface interface beneath and adjacent to a stream or river where surface water and shallow groundwater mix. It may be recognized by the accumulation of coarse textured sediments in the bottom of the channel that may be up to 2-3 ft deep in small streams. The saturated sediment in the hyporheic zone exchanges water, nutrients, and fauna with surface flowing waters. Consequently, the hyporheic zone is the site of much groundwater discharge to the stream channel, downstream flow, and biological and chemical activity associated with aquatic functions of the stream. Indicators of a hyporheic zone can be observed by digging a bore hole in the streambed when site conditions are conducive to manually digging a bore hole. Water standing in the bore hole or saturated sediment within the bore hole indicates the presence of a hyporheic zone. If conditions are not conducive to boring a hole in the streambed, one can look under rocks. Saturated or moist sediment underneath rocks located within the channel indicates the presence of a hyporheic zone. Groundwater Table: The presence of a seasonal high water table or groundwater discharge (i.e. seeps or springs) from the bank, above the elevation of the channel bottom, indicates a relatively reliable source of base flow to a stream. When site conditions are conducive to manually digging a bore hole, indicators of a current water table can be observed by digging a bore hole in the adjacent floodplain approximately two feet away from the streambed. The presence of water standing in the hole above the elevation of the channel bottom after waiting for at least 30 minutes (longer for clayey soils) indicates the presence of a high groundwater table.
Strong – Considerable base flow is present. Hyporheic zone and/or groundwater table is readily observable throughout reach.
Moderate – Some base flow is present. Hyporheic zone and/or groundwater table is present, but not abundant throughout reach.
Weak – Water is standing in pools and the hyporheic zone is saturated, but there is not visible flow above the channel bottom. Indicators of groundwater discharge are present, but require considerable time to locate.
Poor – Little to no water in the channel. No indication of a high groundwater table or hyporheic zone.
2.3. Bivalves Clams cannot survive outside of water, thus one should examine the streambed or look for them where plants are growing in the streambed. Also, look for empty shells washed up on the bank. Some bivalves can be pea-sized or smaller. Since clams require a fairly constant aquatic environment in order to survive, the search for bivalves can be conducted while looking for other benthic macroinvertebrates. A small net may be useful.
Present – Bivalves are found within the study reach. Absent – Bivalves are not found within the study reach.
28
2.4. Amphibians Salamanders and tadpoles can be found under rocks, on streambanks and on the bottom of the stream channel. They may also appear in the benthic sample. Frogs will alert you of their presence by jumping into the water for cover. Frogs and tadpoles typically inhabit the shallow, slower moving waters of the pools and near the sides of the bank. Amphibian eggs, also included as an indicator, can be located on the bottom of rocks and in or on other submerged debris. They are usually observed in gelatinous clumps or strings of eggs.
Present – Amphibians are found within the study reach. Absent – Amphibians are not found within the study reach.
Any collection and identification of aquatic species should be performed by a qualified aquatic biologist, environmental scientist, or other professional.
2.5. Benthic Macroinvertebrates (quantitative observations) The larval stages of many aquatic insects are good indicators that a stream is perennial because a continuous aquatic habitat is required for these species to mature. The Arid West Water Quality Research Project has published a final report on Aquatic Communities of Ephemeral Stream Ecosystems that may be a useful supplement to this protocol. The NMED/SWQB in cooperation with NM Department of Game and Fish (NMDGF) continues to compile a list of organisms of intermittent ecosystems (available by contacting NMDGF – Conservation Services Division, (505) 476-8000 or SWQB – Monitoring and Assessment Section, (505) 827-0187). In addition, SWQB scientists have been looking for the presence of long-lived aquatic species as reliable determinants for perennial channels, North Carolina State University is continuing to work on a list of specific genus that exhibit aquatic larval stages requiring a year before maturity (NCSU – Water Quality Group, [email protected]) and West Virginia’s Department of Environmental Protection maintains a list of macroinvertebrate species that have an extended aquatic life stage (WVDEP – Watershed Assessment Branch, (304) 926-0495). Further information on life histories of specific macroinvertbrates found through the application of this protocol can be researched, if necessary. Examples of Methods and Equipment used to collect Benthic Macroinvertebrates:
- EPA’s EMAP Protocol - SWQB’s Benthic Macroinvertebrate SOP - Kick Net - D-Frame Dip Net - Rectangular Dip Net - Surber Sampler - Hess Sampler - Approaches:
o Targeted Riffle o Reach-Wide, Multi-Habitat
top/bottom of riffle, undercut banks, pools/runs, snags/roots/logs

29
The goal is to collect as many different kinds of aquatic macroinvertebrates from as many different habitats as necessary to ensure an accurate site assessment. Be aware that each habitat type has different sampling protocols and some have a greater diversity of organisms than others (Table 2). If you have many habitats from which to choose, consider sampling from those with the most diversity. If your stream has a rocky bottom, sample at two separate riffle areas and at one other habitat. If your stream has a soft bottom or does not have riffles, collect samples at submerged logs, snags or undercut banks. Table 2. Relative diversity of various habitat types
Habitat Type Stream Type Habitat Riffles Rocky bottom Most diverse
Undercut banks Rocky, soft bottoms
Snags, tree roots, logs Rocky, soft bottoms Least diverse
Strong – More than one taxa of benthic macroinvertebrate that requires water for their entire life cycle (rheophilic taxa) are present as later instar larvae. Overall there is a balanced distribution of taxa. A list of benthic organisms that indicate perennial features are listed in Tables 3 and 4.
Moderate – Only one rheophilic taxon was found in the sample, however sample is diverse. Overall there is a balanced distribution of taxa.
Weak – Rheophilic taxa are not present in the sample; however other types of benthic macroinvertebrates are present. Both diversity and abundance are low or not distributed evenly.
Poor – Benthic macroinvertebrates are not present. Table 3. Ephemeroptera, Plecoptera, and Trichoptera (EPT) perennial indicator taxa
Ephemeroptera (Mayflies)
Plecoptera (Stoneflies)
Tricoptera (Caddisflies)
Caenidae Peltoperlidae Hydropsychidae Ephemerellidae Perlidae Lepidostomatidae Ephemeridae Perlodidae Molannidae Heptageniidae Odontoceridae
Philopotamidae Polycentropidae Psychomyiidae
Family:
Rhyacophilidae
30
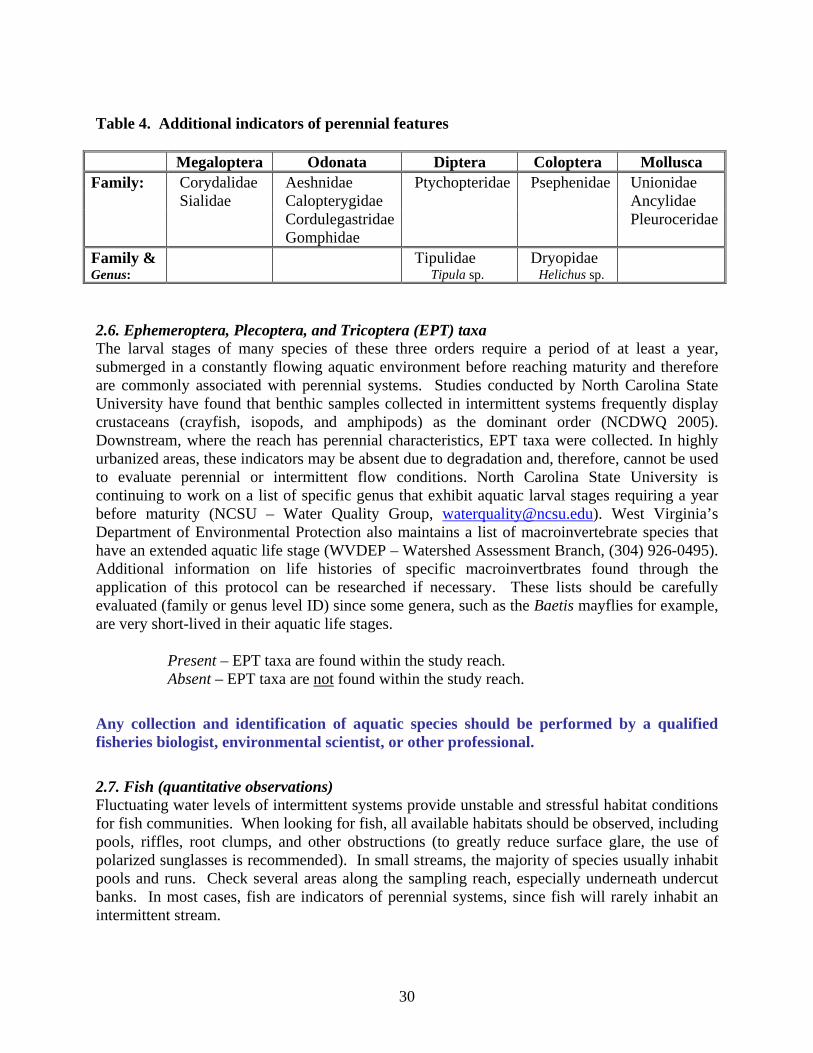
Table 4. Additional indicators of perennial features
Megaloptera Odonata Diptera Coloptera Mollusca Corydalidae Aeshnidae Ptychopteridae Psephenidae Unionidae Sialidae Calopterygidae Ancylidae Cordulegastridae Pleuroceridae
Family:
Gomphidae Family & Genus:
Tipulidae Tipula sp.
Dryopidae Helichus sp.
2.6. Ephemeroptera, Plecoptera, and Tricoptera (EPT) taxa The larval stages of many species of these three orders require a period of at least a year, submerged in a constantly flowing aquatic environment before reaching maturity and therefore are commonly associated with perennial systems. Studies conducted by North Carolina State University have found that benthic samples collected in intermittent systems frequently display crustaceans (crayfish, isopods, and amphipods) as the dominant order (NCDWQ 2005). Downstream, where the reach has perennial characteristics, EPT taxa were collected. In highly urbanized areas, these indicators may be absent due to degradation and, therefore, cannot be used to evaluate perennial or intermittent flow conditions. North Carolina State University is continuing to work on a list of specific genus that exhibit aquatic larval stages requiring a year before maturity (NCSU – Water Quality Group, [email protected]). West Virginia’s Department of Environmental Protection also maintains a list of macroinvertebrate species that have an extended aquatic life stage (WVDEP – Watershed Assessment Branch, (304) 926-0495). Additional information on life histories of specific macroinvertbrates found through the application of this protocol can be researched if necessary. These lists should be carefully evaluated (family or genus level ID) since some genera, such as the Baetis mayflies for example, are very short-lived in their aquatic life stages.
Present – EPT taxa are found within the study reach. Absent – EPT taxa are not found within the study reach.
Any collection and identification of aquatic species should be performed by a qualified fisheries biologist, environmental scientist, or other professional.
2.7. Fish (quantitative observations) Fluctuating water levels of intermittent systems provide unstable and stressful habitat conditions for fish communities. When looking for fish, all available habitats should be observed, including pools, riffles, root clumps, and other obstructions (to greatly reduce surface glare, the use of polarized sunglasses is recommended). In small streams, the majority of species usually inhabit pools and runs. Check several areas along the sampling reach, especially underneath undercut banks. In most cases, fish are indicators of perennial systems, since fish will rarely inhabit an intermittent stream.

31
Fish should be collected, measured, and classified to verify if fish are present in a water body and to help confirm the appropriate hydrological determination. Best professional judgment should be exercised to determine sampling methodology (e.g. shocking, seining, etc.) and to ensure that safety concerns are addressed.
Strong – Fish are present in all habitats (riffles, pools, runs, root clumps, undercut banks, etc.). Multiple age classes are present and evenly represented. Large-bodied fish may be present.
Moderate – Fish are evident in fewer numbers with one age class dominating. Some habitat is not occupied. Large-bodied fish may be present.
Weak – Fish are not readily visible, require 10 or more minutes to locate, and are typically found within one habitat type (e.g. pools, runs). Very sparse.
Poor – Fish are not found within the study reach.

32
SECTION 2 – Guidance for Overall Score Interpretation The final determination of whether a reach is ephemeral, intermittent, or perennial is based on a variety of information including the total score, supporting information, and professional judgment. The use of the Level 1 Evaluation should, in most cases, provide enough information to accurately distinguish between ephemeral, intermittent, and perennial systems. Scores should reflect the persistence of water with higher scores indicating intermittent and perennial systems. However, if a reach is recognized as borderline (i.e. gray zone – see Table 5) or if observations are made during a severe or extreme drought (12-month SPI value less than -1.5), then a Level 2 Evaluation that relies on more intensive and focused data collection can be used to make a final hydrological determination or to verify the Level 1 evaluation. For a Level 1 Evaluation a minimum total score of 9.0 is set as a guideline to distinguish ephemeral channels from non-ephemeral ones unless there are aquatic macroinvertebrates and/or fish, in which case at least one of the Clean Water Act Section 101(a)(2) objectives is attainable and the stream is at least intermittent. In addition, a Level 1 score greater than 22.0 distinguishes perennial streams from non-perennial streams. SWQB recognizes that there is inherent variability in nature, therefore Level 1 scores between 9 and 12 may be ephemeral but will be recognized as intermittent until further data collection and analysis through a Level 2 evaluation or detailed UAA can more clearly determine that the stream is ephemeral. Similarly, Level 1 scores between 19 and 22 may be intermittent but will be recognized as perennial until further data collection and analysis indicate that the stream is intermittent. Table 5 summarizes interpretation of Level 1 scoring. In most instances, the use of a Level 1 Evaluation should be sufficient to make a final hydrological determination. If after conducting Level 1 Evaluation, a hydrological determination cannot be made because more information is required, then a Level 2 Evaluation which uses more intensive data collection can be conducted. Table 5. Summary of Level 1 Score Interpretation Waterbody Type Level 1 Total Score Hydrology Determination Ephemeral Less than 9.0* Stream is ephemeral
≥ 9.0 and < 12.0 Stream is recognized as intermittent until further analysis indicates that the stream is ephemeral
Intermittent ≥ 12.0 and ≤ 19.0 Stream is intermittent
> 19.0 and ≤ 22.0 Stream is recognized as perennial until further analysis indicates that the stream is intermittent
Perennial Greater than 22.0 Stream is perennial * If there are aquatic macroinvertebrates and/or fish the stream is at least intermittent.
If a study reach is recognized as borderline (within the gray zones), reaches upstream and downstream of the study area should be assessed to better evaluate the changes in stream classifications along a channel. Additional supporting information can be used to help make the final determination. This supporting information may include, but is not limited to:
33
Observation of flow: Observation of flow under certain seasonal or hydrological conditions can directly support classifying a stream reach as intermittent or perennial. Conditions supporting a perennial stream classification include:
Stream reaches with flow during the dry season or periods of drought are likely perennial. The longer the period from the last substantial rainfall the stronger the presence of flow supports the perennial stream determination. Although the presence of flow during a drought indicates perennial conditions, care must be taken in evaluating the upper limits of perenniality because some perennial streams may only contain isolated pools of water or be dry during periods of drought.
Key biological indicators: As discussed in the Level 2 Evaluation, the presence of aquatic organisms whose life cycle requires residency in flowing water for extended periods (especially those one year or greater) is a strong indication that a stream reach is perennial. If a stream or river is recognized as borderline, a qualified aquatic biologist/environmental scientist should evaluate the presence and abundance of such macroinvertebrates and vertebrates species before determining the final stream classification.
Other additional supporting information that may be considered:
- Groundwater contour maps or nearby, local well logs. - Information provided by a long-term resident and/or local professional who has
observed the stream during the various seasons and hydrological conditions. - Review of historic information such as aerial photography. - Professional judgment may be used in conjunction with the total score and supporting
information in making the final determination. The total score can be affected by seasonal or hydrological conditions as well as man-made impacts such as irrigation diversions or livestock impoundments associated with activities in the watershed. For example, a reach may score less in drought conditions due to the lack of biological and/or certain hydrological indicators. However, a reach may score higher on certain indicators such as drift lines and alluvial deposits if directly below a stormwater outfall. The final hydrological determination should take these factors into account. The Hydrology Protocol is considered to be an evolving, living document. Current thresholds are based on data collected by SWQB during the 2008 and 2009 field seasons from 57 stream reaches throughout the state of New Mexico. An analysis of these data was performed to determine which indicators clearly differentiated the three types of streams and to identify threshold values for scoring (Refer to Appendix 1 for more information). In the event that new data indicate the threshold values used in this protocol are not appropriate and/or if new standards are adopted, the threshold values and differentiating scores will be adjusted accordingly.
34
LITERATURE CITED Blasch, K., T.P.A. Ferre, A.H. Christensen, and J.P. Hoffmann. 2002. New field method to determine
streamflow timing using electrical resistance sensors. Vadose Zone Journal 1:289-299. Constantz, J., D. Stonestrom, A.E. Stewart, R. Niswonger, and T.R. Smith. 2001. Analysis of streambed
temperatures in ephemeral channels to determine streamflow frequency and duration. Water Resources Journal 37:329-340.
Lawler, D. 2002. Using Streambed Temperature Sensors to Monitor Flow Events in the San Pedro River,
Southeast Arizona and North-Central Sonora, Mexico. M.A. Thesis. University of Arizona, Tucson, AZ.
Levick, L., D. Goodrich, M. Hernandez, D. Semmens, J. Stromberg, R. Leidy, M. Apodaca, D. P. Guertin,
M. Tluczek, and W. Kepner. 2007. Hydrology and Ecology of Intermittent and Dry Wash Ecosystems. USDA-ARS EPA/600/R-07/142, ARS/218464. Tucson, AZ.
Kellerhals, R., C.R. Neill, and D.I. Bray. 1972. Hydraulic and geomorphic characteristics of rivers in
Alberta. Research Council of Alberta, River Engineering and Surface Hydrology Report 72-1: 52 p. Knight, K., T. Moody, W. Odem, and M. Wirtanen. 1999. Stream Channel Morphology in New Mexico:
Regional Relationships. Department of Civil and Environmental Engineering, Northern Arizona University, Flagstaff, AZ. 53 p.
Maidment, D.R. 1993. Handbook of Hydrology. McGraw-Hill, Inc. New York. National Drought Mitigation Center (NDMC). 1995. The Standardized Precipitation Index (SPI). School of
Natural Resources, University of Nebraska – Lincoln. New Mexico Administrative Code (NMAC). 2007. State of New Mexico Standards for Interstate and
Intrastate Surface Waters. 20.6.4. New Mexico Water Quality Control Commission. As amended through August 1, 2007. (20.6.4 NMAC)
New Mexico Environment Department/Surface Water Quality Bureau (NMED/SWQB). 2008. State of New
Mexico Procedures for Assessing Standards Attainment for the Integrated 303(d)/305(b) Water Quality Monitoring and Assessment Report. January 2008.
North Carolina Division of Water Quality (NCDWQ). 2005. Identification methods for the origins of
intermittent and perennial streams. Version 3.1. North Carolina Department of Environment and Natural Resources, Division of Water Quality. Raleigh, NC.
Rosgen, D.L. 1994. A classification of natural rivers. Catena, Vol. 22: 169-199. Elsevier Science, B.V.
Amsterdam. Rosgen, D.L. 1996. Applied river morphology. Wildland Hydrology. Pagosa Springs, Colorado. Water Environment Research Foundation (WERF). 2007. Evaluating waterbody assessment and listing
processes: Integration of monitoring and evaluative techniques. Alexandria, VA.