determination of 5-log reduction times in escherichia …
TRANSCRIPT

DETERMINATION OF 5-LOG REDUCTION TIMES IN ESCHERICHIA COLI O157:H7 AND LACTOBACILLUS SPECIES IN CUCUMBER JUICE MEDIUM WITH VARIED SALT
TREATMENTS
by
DOROTHY E. DUPREE
(Under the Direction of Elizabeth L. Andress)
ABSTRACT
Survival of pathogenic bacteria, such as Escherichia coli O157:H7, in
fermented and acidified vegetables continues to be an area of concern in the processed
vegetable industry. Survival of fermentative microorganisms, such as Lactobacillus
species (spp.), is desired. This study determined 5-log reduction times in 5-strain
cocktails of E. coli O157:H7 and Lactobacillus spp. independently in cucumber juice
media with varied salt treatments of 2% NaCl, 6% NaCl, and 1.1% CaCl2. 5-log reductions
were reached for E. coli O157:H7 in 14 hours (6% NaCl) and 18 hours (1.1% CaCl2), but
not observed by 18 hours in 2% NaCl. For Lactobacillus spp., a 5-log reduction was
reached in 40 hours (6% NaCl) and 46 hours (2% NaCl), but not observed by 46 hours for
CaCl2. There is some evidence from this study that CaCl2 could be useful for reducing E.
coli O157:H7 populations while allowing survival of desirable Lactobacillus spp.
INDEX WORDS: Escherichia coli O157:H7, Lactobacillus, Cucumber, Acidified vegetables, Fermented vegetables, Salt treatment

DETERMINATION OF 5-LOG REDUCTION TIMES IN ESCHERICHIA COLI O157:H7 AND LACTOBACILLUS SPECIES IN CUCUMBER JUICE MEDIUM WITH VARIED SALT
TREATMENTS
by
DOROTHY E. DUPREE
B.S.F.C.S., The University of Georgia, 2014
A Thesis Submitted to the Graduate Faculty of The University of Georgia in Partial
Fulfillment of the Requirements for the Degree
MASTER OF SCIENCE
ATHENS, GEORGIA
2017

© 2017
Dorothy E. Dupree
All Rights Reserved
DETERMINATION OF 5-LOG REDUCTION TIMES IN ESCHERICHIA COLI O157:H7 AND LACTOBACILLUS SPECIES IN CUCUMBER JUICE MEDIUM WITH VARIED SALT
TREATMENTS
by
DOROTHY E. DUPREE
Major Professor: Elizabeth L. Andress Committee: Fred Breidt Jamie A. Cooper Judy A. Harrison Barbara M. Grossman Electronic Version Approved: Suzanne Barbour Dean of the Graduate School The University of Georgia August 2017

iv
DEDICATION
This scientific masterpiece is dedicated to my Mom and Dad.

v
ACKNOWLEDGEMENTS
This project would not have been possible without the support and daily
assistance in data collection from the USDA/ARS Food Science Research Unit in Raleigh,
NC. I am specifically very grateful to Dr. Fred Breidt, USDA/ARS Microbiologist and
USDA Professor of Food Science and Robert Price, Biological Science Technician,
USDA/ARS for this invaluable education. The laboratory location is as follows:
USDA Agricultural Research Service
Food Science Research Unit
Dept. of Food, Bioprocessing and Nutrition Sciences
322 Schaub Hall, Box 7624, NC State University
Raleigh, NC 27695-7624
This material is based upon work supported in part by the National Institute of
Food and Agriculture, U.S. Department of Agriculture, under Agreement No. 2011-
51110-30995.

vi
TABLE OF CONTENTS
Page
ACKNOWLEDGEMENTS ........................................................................................................ v
LIST OF TABLES .................................................................................................................... ix
LIST OF FIGURES .................................................................................................................. xi
CHAPTER
1 INTRODUCTION ................................................................................................. 1
2 LITERATURE REVIEW ......................................................................................... 5
The Microbiology of Foods ......................................................................... 5
The Microflora of Fresh Vegetables ............................................................ 5
Characteristics of Escherichia coli (E.coli) ................................................... 9
What is Escherichia coli? ............................................................................. 9
Prevalence and Economic Costs of E. coli O157:H7.................................. 10
Isolation and Identification of E. coli O157:H7 ......................................... 11
E. coli O157:H7 Transmission .................................................................... 11
Acid Resistance of E. coli O157:H7 ............................................................ 12
Environmental Survival of E. coli O157:H7 ............................................... 13
Achievement of a 5-Log Reduction: How do various foodborne pathogens
compare? .................................................................................................. 14
Survival of Escherichia coli O157:H7 in Cucumber Brines ........................ 16
vii
Treatment Determination for a 5-Log Reduction of Escherichia coli in
Refrigerated Pickle Products ..................................................................... 18
Characteristics of Genus Lactobacillus ..................................................... 18
What are Lactobacillus? ............................................................................ 18
Function of Lactic Acid Bacteria in Carbohydrate Fermentation ............. 19
Objective, Hypotheses, and Specific Aims ................................................ 20
3 METHODS ........................................................................................................ 22
Cucumber Juice Preparation ..................................................................... 22
Bacterial Strains and Growth Conditions .................................................. 23
Making Cucumber Juice Treatments ........................................................ 24
Making 5-Strain Cocktails ......................................................................... 26
Treatment Inoculation Procedures ........................................................... 26
Sampling of Treatments ............................................................................ 27
Plating of Treatments ............................................................................... 30
Colony Counting ........................................................................................ 30
4 RESULTS........................................................................................................... 31
E. coli O157:H7 Results ............................................................................. 33
Lactobacillus Species Results .................................................................... 37
5 DISCUSSION ..................................................................................................... 41
Escherichia coli O157:H7 Log Reductions ................................................. 41
Lactobacillus spp. Log Reductions ............................................................ 44
Limitations................................................................................................. 47

viii
6 SUMMARY AND CONCLUSIONS ...................................................................... 48
Suggestions for Future Research .............................................................. 50
REFERENCES .... …………………………………………………………………………………………………52
ix
LIST OF TABLES
Page
Table 3.1: Cucumber Juice Treatments for Escherichia coli O157:H7 .............................. 25
Table 3.2: Cucumber Juice Treatments for Lactobacillus spp .......................................... 25
Table 3.3: Serial Dilutions for Escherichia coli O157:H7 Samples ..................................... 28
Table 3.4: Serial Dilutions for Lactobacillus spp. Samples ................................................ 29
Table 4.1: Surviving Populations of E. coli O157:H7 in log CFU/ml in Varied Salt Types
and Concentrations over Time and Time Required to Achieve a 5-Log
Reduction .............................................................................................................. 34
Table 4.2: Type III Test: Results of Fixed Effects Analysis in Log Reductions of E. coli
O157:H7 in Media with Varying Salt Types and Concentrations .......................... 35
Table 4.3: Equality Test: Differences of Least Square Means of Log Reductions in E. coli
O157:H7 Cocktail Population When Comparing Salt Levels at Various Time
Points ................................................................................................................... 36
Table 4.4: Surviving Populations of Lactobacillus spp. in log CFU/ml in Varied Salt Types
and Concentrations over Time and Time Required to Achieve a 5-Log
Reduction .............................................................................................................. 38
Table 4.5: Type III Test: Results of Fixed Effects Analysis in Log Reductions of
Lactobacillus spp. in Media with Varying Salt Types and Concentrations ........... 38

x
Table 4.6: Equality Test: Differences of Least Square Means of Log Reductions in
Lactobacillus spp. Cocktail Population When Comparing Salt Levels at Various
Time Points ........................................................................................................... 40

xi
LIST OF FIGURES
Page
Figure 2.1: Schematic Depiction for E. coli O157:H7 Transmission .................................. 12
Figure 4.1: Univariate Methods for Statistical Analysis in Microbiology .......................... 32
Figure 5.1: Mean Log Reduction of E. coli O157:H7 in a Cucumber Juice Medium over
Time in Varied Salt Treatments Stored at 30 °C ................................................... 43
Figure 5.2: Mean Log Reduction of Lactobacillus spp. in a Cucumber Juice Medium over
Time in Varied Salt Treatments Stored at 30 °C ................................................... 46

1
CHAPTER 1
INTRODUCTION
Pickled and acidified foods are popular components of the typical U.S.
diet, as well as in international cultures. Commonly consumed acidified condiments are
pickled fruits and vegetables, including mixtures such as salsas and other relishes (USDA,
2015). Pickles of one type or another are eaten by more than 67% of American
households; the per capita American consumption is at least 9 pounds annually (Pickle
Packers International, 2017). More than 30 states grow pickling cucumbers in the U.S.
Up to half of the $1.5 billion per year pickled vegetable market consists of products that
are actually preserved without thermal processing. This includes fermented products,
which are naturally acidified and defined as acid foods (Breidt and Caldwell, 2011).
Fermented food production today constitutes one of the world’s largest industries, with
some estimates showing that as much as one-third of all food eaten by humans
worldwide is fermented. Commonly regarded benefits of fermented foods, which may
explain their widely estimated consumption, include: preservation, health, energy
efficiency and flavor (Katz, S.E., 2012).
Cucumbers as well as other vegetables can be quick pickled through the addition
of acid brines (such as vinegar-based seasoned solutions). Vegetables can also be
fermented in salt brine solutions where the growth of primarily lactic acid bacteria
2
decrease the reducing sugar content and increases acidity of the vegetable substrate
(USDA, 2015). The result also changes the flavor to that of a pickled food.
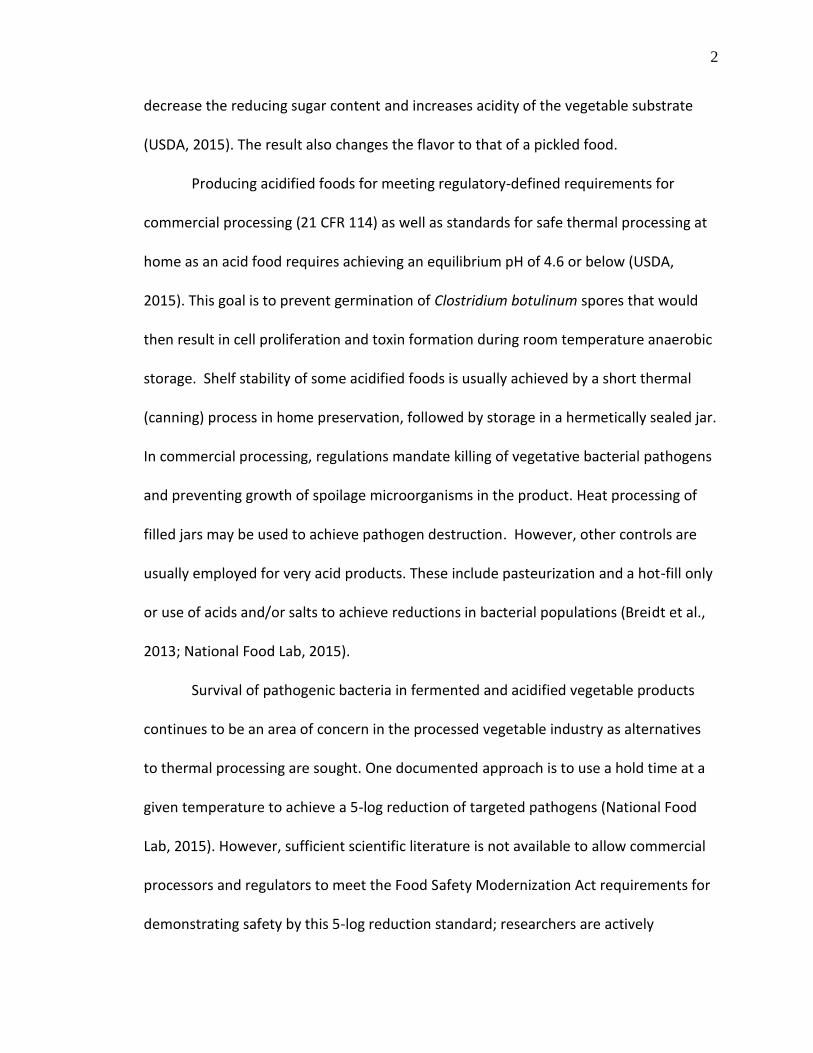
Producing acidified foods for meeting regulatory-defined requirements for
commercial processing (21 CFR 114) as well as standards for safe thermal processing at
home as an acid food requires achieving an equilibrium pH of 4.6 or below (USDA,
2015). This goal is to prevent germination of Clostridium botulinum spores that would
then result in cell proliferation and toxin formation during room temperature anaerobic
storage. Shelf stability of some acidified foods is usually achieved by a short thermal
(canning) process in home preservation, followed by storage in a hermetically sealed jar.
In commercial processing, regulations mandate killing of vegetative bacterial pathogens
and preventing growth of spoilage microorganisms in the product. Heat processing of
filled jars may be used to achieve pathogen destruction. However, other controls are
usually employed for very acid products. These include pasteurization and a hot-fill only
or use of acids and/or salts to achieve reductions in bacterial populations (Breidt et al.,
2013; National Food Lab, 2015).
Survival of pathogenic bacteria in fermented and acidified vegetable products
continues to be an area of concern in the processed vegetable industry as alternatives
to thermal processing are sought. One documented approach is to use a hold time at a
given temperature to achieve a 5-log reduction of targeted pathogens (National Food
Lab, 2015). However, sufficient scientific literature is not available to allow commercial
processors and regulators to meet the Food Safety Modernization Act requirements for
demonstrating safety by this 5-log reduction standard; researchers are actively

3
conducting studies to build databases that processing authorities can utilize (Breidt et
al., 2007; Breidt et al., 2013; Ingham et al., 2017).
Acid-resistant microorganisms are the primary pathogens of concern in
fermented and acidified vegetables. The pathogenic bacteria, Escherichia coli O157:H7,
particularly is considered to be the most acid resistant pathogen of concern for non-
fermented acidified foods. However, this organism is also of concern for its ability to
survive in fermentation procedures. Recent research has shown that E. coli O157:H7 can
require between 3 and 25 days to achieve a 5-log reduction in cell numbers in cucumber
fermentation brines, depending on specific brine conditions (Breidt and Caldwell, 2011).
Standard pickling methods have historically used sodium chloride (NaCl) as the salt of
choice to inhibit microbial growth during fermentation and pickling. More recent
research has been investigating the use of calcium chloride (CaCl2) as an alternative, due
to waste water issues near commercial processing plants (USDA, 2016).
Several research projects are ongoing to determine bacterial survival and
reduction rates under various acidic conditions using both NaCl and CaCl2 (USDA, 2016).
As a precursor to studying specific acidified food systems, data are still needed to
characterize certain survival and reduction patterns of bacteria of interest in pickling
and fermentation. Pathogen control is required and focuses on E. coli O157:H7 control,
as the most acid resistant pathogen of interest. At the same time, behavior of lactic acid
bacteria under the same conditions must be understood because of their critical role in
fermentation.

4
The current study was undertaken to determine 5-log reduction times of E. coli
O157:H7 and Lactobacillus species (spp.) in a 50% cucumber juice medium with varied
salt type and concentration. The growth medium was adjusted to a pH of 3.2 and
equilibrated at 30 °C for all samples. Samples were inoculated with a 5-strain cocktail for
each microorganism. Log reductions for samples were determined were by: 1) spiral
plating samples at specified time points, 2) storing plates at 30 °C for Lactobacillus spp.
and 37 °C for E. coli O157:H7 to allow for colony growth, and 3) counting surviving
colonies. The results will contribute to the scientific database needed to meet newer
regulatory goals for 5-log reduction in processed acidified foods.

5
CHAPTER 2
LITERATURE REVIEW
The microbiology of foods
Food microbiology is the study of the biology of the microorganisms present in
food including: their growth characteristics, identification, and pathogenesis. Food
microbiologists study the relationship between microorganisms and food poisoning,
food spoilage, food preservation, and food legislation. Bacteria are the most abundant
microorganisms and include species that are both beneficial and harmful to human
health, allowing an opportunity for conduction of extensive research to characterize
their individual behavior within a food system (USDA 2011). There are several
parameters that affect the growth of microorganisms including pH, moisture content,
oxidation-reduction potential, nutrient content, antimicrobial constituents within the
food system, and temperature. Within research, these parameters are either controlled
for or manipulated to assess their effects on growth and death of specific
microorganisms within a food system (USDA 2011).
The microflora of fresh vegetables
Vegetables are commonly eaten raw or fermented (non-heat treated) and, as a
result, may inherently present a food safety risk. Fresh vegetables are capable of serving
as a natural habitat for a wide variety of microorganisms. Representative microflora of
vegetables includes aerobic bacteria (Pseudomonas, Staphylococcus, Bacillus), lactic acid

6
bacteria (Lactobacillus, Streptococcus, Pediococcus), enteric bacteria (Enterococcus,
Enterobacter, Escherichia), and yeasts and molds (Aspergillus, Penicillium, Fusarium). In
raw vegetable products, lactic acid bacteria are actually outnumbered by non-lactic
competitors by a thousand times or more. Total populations of Pseudomonas,
Flavobacterium, Bacillus, and Escherichia are capable of reaching levels as high as 107
cells per gram, while lactic acid bacteria are normally present at only about 103 cells per
gram (Mehta, B.M. 2012). It is worth noting that, despite the disparity in population
numbers, successful lactic acid fermentation of vegetables can be done with appropriate
salt concentration, temperature control, and a proper anaerobic environment as long as
a minimal lactic acid population is present (Hutkins, R.W. 2006).
Increased fresh produce demand within the U.S. is closely related to the
agricultural development of the central coast region of California. This region is actually
known as the “Salad Bowl of America.” This region in California is capable of providing
leafy greens and other various vegetables year-round to the rest of the nation because
of the ideal climate for production. The increased demand requires shipping over long
distances rapidly. Increased efficiency of production/harvest, new/improved cultivars,
and new methods for treating plant disease have been areas of innovation to handle
this increased demand. However, there remains an increase in illnesses and outbreaks,
including multistate outbreaks, many of which have a source region of California
documented. Escherichia coli O157:H7 has been linked to leafy greens in several
documented outbreaks dating back to 1995. Salmonella has also been implicated in
several outbreaks of cantaloupe and tomato commodities. In 2006, a multistate E. coli
7
O157:H7 outbreak was seen in bagged baby spinach that originated from California.
Over 200 individuals fell ill as a result. S. Newport was implicated in a tomato outbreak
originating in Virginia that resulted in over 500 ill individuals (Fan et al., 2001).
Removal of pathogenic and spoilage bacteria from fresh fruits and vegetables
prior to any processing is difficult. Biofilms containing pathogenic bacteria on fresh
produce may be more resistant to sanitizing agents and other organic acid treatments
than free cells (Kumar and Anand 1998; Bower and Daeschel 1999; Riordan, et al., 2001;
Sapers 2001). The USDA AMS Microbial Data Program assessed the incidence of E. coli
on selected fresh produce items from 2002-2007. Over 65,000 samples were analyzed.
Both domestic and imported commodities were tested (including cantaloupe, leaf and
romaine lettuce, tomatoes, green onions, etc.) for generic E. coli, including E. coli
O157:H7, and Salmonella. Results from the multi-year studies indicated low levels of E.
coli on produce items. Samples were considered positive for E. coli if >0.03 MPN/ml
rinse was determined. (MPN refers to the most probable number and is generated using
a standardized tool based on sample dilutions showing positive coliform and/or fecal
coliform). Only 1.5-2.7% of samples each year were positive for E. coli at concentrations
>10 MPN/ml (USDA 2008). Although major outbreaks are of concern, it should be
emphasized that relative to the consumption frequency of ready-to-eat produce,
outbreaks are not frequent, resulting in a low number of total cases per total
consumptions. Nevertheless, researchers seek to identify what is a rare event versus
practices within food production and handling that may lead to increased risk of
contamination and possible outbreaks (Fan et al., 2001).

8
As stated previously, both lactic acid bacteria, such as Lactobacillus, and enteric
bacteria, such as Escherichia, are naturally present in the environment. Vegetables can
serve as a natural habitat for these microorganisms. Population numbers can vary
widely though, in general, non-lactic acid competitors outnumber lactic acid bacteria. To
reiterate, with an appropriate starting population of lactic acid bacteria, fermentation
has long been understood to proceed, with colonies of lactic acid bacteria in brines
demonstrating a competitive advantage versus other microorganisms, including enteric
bacteria. Several additional factors, such as pH, temperature, acid concentration, and
salt create an environment for such a competitive advantage to exist (Hutkins, R.W.
2006). Despite a wealth of anecdotal evidence showing this to be true, the scientific
realm of research has yet to fully catch up. Although there has been a long history of
vegetable fermentation and non-thermal acidified vegetable processing, the USDA and
Center for Home Food Preservation have limited information to disseminate to
consumers for safe home-fermentation. Industry is also looking for guidance to handle
non-thermal processing of these products to achieve appropriate reduction in
foodborne pathogens, such as Escherichia coli O157:H7, as the Food Safety
Modernization Act (FSMA) begins to fully go into effect (Ingham, et al., 2017).
To date, much of the industry guidance relates to the Code of Federal
Regulations (21 CFR 114; 17) mandate that vegetative cells of microorganisms of public
health significance be destroyed during the manufacture of acidified canned foods. The
FDA’s 2010 draft Guidance for Industry: Acidified Foods further specifies that “To be
adequate… the scheduled process for acidified foods should be sufficient to destroy or

9
prevent the presence of vegetative cells of…pathogenic microorganisms (such as
Escherichia coli O157:H7, Listeria monocytogenes, and Salmonella species) that are acid-
tolerant. Destruction of pathogens is usually achieved via a thermal process, ensuring a
5-log pathogen reduction (FDA, 2010). With many acidified and fermented vegetable
products, thermal processing for a 5-log reduction does not take place. It is therefore
important to characterize pathogen survival, particularly acid-resistant pathogens such
as E. coli O157:H7, in environments the microorganisms are likely to face in an acidified
or fermented product. Since lactic acid bacteria, such as Lactobacillus, will also be
naturally occurring in such an environment, it is important to characterize its survival as
well. As mentioned previously, in successful fermentations, lactic acid bacteria
demonstrate a competitive advantage versus other initially present microorganisms.
Before quantifying such a competitive advantage scientifically, it is important to first
characterize their survival patterns independently.
Characteristics of Escherichia coli (E. coli)
What is Escherichia coli?
Escherichia coli (E. coli) is a Gram-negative, rod-shaped facultative anaerobic
bacterium. Most E. coli strains colonize the gastrointestinal tract of humans and animals
as part of the normal flora and do no harm (Lim et al., 2010). Some E. coli strains have
evolved into pathogenic bacteria, however, by acquiring virulence factors through
plasmids, transposons, bacteriophages, and/or pathogenicity islands. Categorization of
these pathogenic types is based on serogroups, pathogenicity mechanisms, clinical
symptoms, or virulence factors (Kaper et al., 2004).

10
Among these pathogenic categories is enterohemorrhagic E. coli (EHEC). EHEC
are pathogenic E. coli strains that produce Shiga toxins (Stxs) and cause hemorrhagic
colitis (HC) and potentially life-threatening hemolytic uremic syndrome (HUS) in
humans. Several serotypes in EHEC are frequently associated with human diseases
including: O26:H11, O91:H21, O111:H8, O157:NM, and O157:H7. E. coli O157:H7 is the
most frequently isolated serotype of EHEC from ill individuals in the United States,
Japan, and the United Kingdom (Lim et al., 2010).
E. coli O157:H7 was first recognized in 1982 as a human pathogen associated
with outbreaks of bloody diarrhea in Oregon and Michigan and was also linked to
sporadic cases of HUS in 1983. Since then, several outbreaks associated with EHEC have
been reported in the United States. As a result, E. coli O157:H7 has become one of the
most important foodborne pathogens (Lim et al., 2010).
Prevalence and Economic Costs of E. coli O157:H7
The Centers for Disease Control and Prevention (CDC) has estimated that E. coli
O157:H7 infections cause 73,000 illnesses, 2,200 hospitalizations, and 60 deaths
annually in the United States (Mead et al., 1999). Outbreak surveillance data from CDC
has reported, however, that E. coli O157:H7 infections are decreasing after the peak in
1999. Despite this, large outbreaks and sporadic cases continue to occur. The annual
cost of illness due to E. coli O157:H7 infections in 2005 was 405 million dollars at its
peak, including lost productivity, medical care, and premature deaths (Frenzen et al.,
2005).

11
Isolation and Identification of E. coli O157:H7
E. coli O157:H7 expresses the somatic (O) antigen 157, a lipopolysaccharide, and
the flagella (H) antigen. E. coli O157:H7 has other unique features useful for isolation
purposes. E. coli O157:H7 has delayed D-sorbitol fermentation (>24 h) and inability of
producing β-glucuronidase, which hydrolyzes 4-methyl-umeebelliferyl-D-glucoronide
(Thompson et al., 1990). Detection of E. coli O157:H7 can thus be done by
supplementing Sorbitol MacConkey (SMAC) agar with MUG. To increase E. coli O157:H7
selectivity, cefixime, potassium tellurite, and vancomycin can be added to SMAC agar
plates to inhibit other Gram-negative bacterium (Lim et al., 2010).
E. coli O157:H7 Transmission
Cattle are a natural reservoir for E. coli O157:H7. Healthy cattle carry and shed E.
coli O157:H7 in their feces at any given time (Dunn et al., 2004). Food has remained the
predominant transmission route of E. coli O157:H7. Transmission by food accounts for
61% of 8,598 outbreak cases from 1982-2002 (Dunn et al., 2004). While ground beef
continues to be a primary vehicle for transmission, fresh produce is increasingly being
indicated as well. Produce-associated outbreaks of E. coli O157:H7 infection were first
reported in 1991. The largest outbreak of E. coli O157:H7 was actually traced to radish
sprout contamination in Osaka, Japan in 1996 which saw 7,966 individuals diagnosed
with confirmed infection (Michino et al., 1999). Raw vegetables continue to be
implicated in many outbreaks in North America, Europe, and Japan (Rangel et al., 2005).
A model of transmission of E. coli O157:H7 is shown below (Lim et al., 2010). The varied

12
possible transmission routes seen can be attributed to the very low infectious dose (~50
CFU) of E. coli O157:H7.
Figure 2.1. Schematic Depiction for E. coli O157:H7 Transmission.
Source: Lim, J.Y., Yoon, J.W., Hovde, C.J. 2010. A brief overview of Escherichia coli O157:H7 and its plasmid O157. Journal of Microbiology Biotechnology (20)1:14. Acid Resistance of E. coli O157:H7
In general, acid resistance is the ability of bacteria to protect themselves from
low pH (<pH 3.0). The low pH of the stomach is one of the first host defenses against
foodborne enteric pathogens (Peterson et al., 1989). The ability to survive in the acidic
environment of the stomach increases the chances of the bacteria to colonize the
intestines and cause infection. An effect of acid resistance is that infectious dose of
enteric pathogens is lowered, as seen with E. coli O157:H7 with an infectious dose seen
to be as low as ~50 CFU. The low infection dose is one of the best known characteristics
of E. coli O157:H7 and is what makes it a highly infectious pathogen (Lim et al., 2010).
Environmental Survival of E. coli O157:H7

13
E. coli O157:H7 can survive in varied environments including soil, water, animal
reservoirs, and food. E. coli O157:H7 has been shown to survive for up to a year in
manure-treated soil (Jiang et al., 2002). E. coli O157:H7 can also survive for long periods
of time in water, especially if kept at cold temperatures (LeJeune et al., 2001). To survive
in numerous environments, E. coli O157:H7 must adapt to variations or extreme
changes in temperature, pH, and osmolarity. To combat acidic environments and
temperature increases, E. coli O157:H7 produces various classes of exopolysaccharides
(EPS) and alters its lipid composition in membranes (Yuk and Marshall, 2004).
Increased osmotic pressure has been used to control the growth of food spoilage
and pathogenic bacteria specifically by desiccation or addition of high amounts of
osmotically active ingredients, such as sodium chloride, which result in decreased water
activity. When the osmotic pressure in the surrounding environment increases, cells
activate osmoregulation systems to prevent shrinkage and plasmolysis. In E. coli
specifically, osmotic stress conditions mimic physiological features of starvation-
including the production of peroxisome assembly proteins and heat shock proteins.
Ultimately, increased osmolarity in bacterial cells has been associated with the
inhibition of DNA replication, cell growth, and nutrient uptake (Chung et al., 2006).
Environmental adaptations of E. coli O157:H7 help to explain the persistence and
dissemination of this serotype on farms as well as the increasing transfer from cattle to
cattle. The ability of it to survive outside the host reservoir also increases the risk that
the pathogen can contaminate crops and produce via bovine manure contamination,
irrigation using contaminated water and direct contact with infected animals (Maule,
14
2000). These sources of contamination help to demonstrate how fresh produce can
become a source of a high enough dose of E. coli O157:H7 to cause infection.
Achievement of a 5-Log Reduction: How do various foodborne pathogens compare?
Breidt and others determined conditions needed for 5-log reductions in
individual foodborne pathogen cocktails of E. coli O157:H7, Salmonella enterica, and
Listeria monocytogenes (Breidt et al, 2013). Individual colonies of each pathogen strain
were grown statically to induce acid resistance and were incubated at 37 °C for 16
hours. Individual cultures for each pathogen were combined resulting in three different
cocktails for testing. Inoculation was done in cucumber juice medium. Inoculated
cucumber juice had an approximate initial cell count of 108 CFU/ml for each pathogen.
There were 15 different acid-pH combinations for cucumber juice medium with a pH of
either 3.5 or 3.8. Acid conditions were more varied and ranged from 0.0%-2.5%
depending on the acid used. Acids used included benzoic and acetic, which are
commonly seen in acidified products processed commercially.
It was found that E. coli O157:H7 was more acid resistant than Listeria
monocytogenes and Salmonella enterica under certain conditions. Among the different
acid conditions tested, a 5-log reduction was seen in an average of less than 4 days for
all pathogens at pH 3.5 with 2.5% acetic acid or at pH 3.8 with 2.5% acetic acid
containing 0.1% benzoic acid. In addition, regardless of pH-acid combination, Salmonella
enterica and Listeria monocytogenes samples specifically had mean 5-log reduction
times of less than 2 days. In contrast, some E. coli samples were shown to have 5-log
reduction times of longer than 10 days. For example, the pH 3.5 and 2.0% acetic acid

15
sample had a mean 5-log reduction time of 11.7 days. This was also seen when benzoic
acid was used. The pH 3.8 and 1.5% acetic acid, 0.1% benzoic acid sample had a mean 5-
log reduction time of 13.5 days.
This suggests that E. coli is more acid resistant, based on the extended time until
a 5-log reduction was seen. In addition, this research demonstrated that acid killing was
dependent on both the acid concentration and acid type. It was also concluded that,
overall, benzoic acid significantly reduced the time needed for a 5-log reduction when it
was the sole acid used or in combination with acetic acid. A pH value of 3.5, as expected,
also resulted in overall quicker 5-log reduction (Breidt et al., 2013).
This research also supported earlier findings that found E. coli O157:H7 to have a
longer predicted time for achievement of a 5-log reduction (5.7 days or 138 hours)
compared to Listeria monocytogenes (0.5 days or 11.2 hours) and Salmonella enterica
(2.1 days or 51 hours) respectively. Specific conditions in this particular study included
holding temperatures of either 10 C or 25 C and addition of acetic acid to achieve a
cucumber juice medium pH of 3.3 (Breidt et al., 2007). This helps demonstrate that E.
coli O157:H7 is also more acid resistant across several pH measures when compared to
S. enterica and L. monocytogenes.

16
Survival of Escherichia coli O157:H7 in Cucumber Brines
To answer the question of survival in a specific medium, Breidt and Caldwell
have assessed E. coli O157:H7 survival in fermented cucumber brines specifically. Their
methods for bacterial survival determination are widely used in cucumber fermentation
research. Key points are outlined below (Breidt, F. and J.M. Caldwell 2011).
To obtain cucumber juice medium for inoculation, size 2B (3.5-3.8 cm in
diameter) pickling cucumbers were processed to a cucumber slurry and then
centrifuged. Sodium chloride was added to a final concentration of 2%. To create
fermented brines, each sample medium was either inoculated with a single colony of
Lactobacillus plantarum or Leuconostoc mesenteroides and incubated at 30°C for 96
hours followed by centrifugation and filtration. Brines were obtained at different stages
of fermentation. Survival of E. coli O157:H7 in non-fermented cucumber juice medium
was also studied. Samples of non-fermented cucumber juice medium (CJ), fermented
cucumber juice medium (FCJ), and commercially obtained cucumber brines were each
inoculated with a 5-strain E. coli O157:H7 cocktail. Strains were statically grown at 37 °C
for 16 hours in LB broth supplemented with 1% glucose to induce acid resistance. E. coli
cocktail was inoculated at 106, 108, and 108 CFU/ml for CJ, FCJ, and commercial brines.
0.5 ml samples were removed and diluted followed by plating with a spiral plater (Spiral
Biotech Inc. Norwood, MA). Plates were stored at 37°C for 24 hours. Colonies were then
counted with an automated spiral plate counter (Q-Count, Spiral Biotech Inc. Norwood,
MA).

17
It was shown through death curves (utilizing polynomial functions) that E. coli
O157:H7 strains required more than two weeks before a 5-log reduction could be
achieved in brine fermented by L. mesenteroides and incubated at 10 °C. In brine
fermented by L. mesenteroides but incubated at 30 °C, 5-log reduction was achieved
more rapidly at less than two days. Interestingly, brine fermented by L. plantarum and
incubated at 10 °C showed accelerated 5-log reduction time (about 4 days) compared to
brine fermented by L. mesenteroides at the same incubation temperature. At an
incubation temperature of 30 °C, 5-log reduction was seen in less than 1 day.
Analysis of commercially obtained brine samples showed a positive correlation
between pH and 5-log reduction time specifically (R2 = 0.71). It was also noted that
protonated acid concentrations also correlated well; however, because pH is much
easier to measure than protonated acid concentrations, only the correlation with pH
was reported.
Overall conclusions from this body of research include: observation of a positive
correlation between pH and E. coli O157:H7 5-log reduction time (in inoculated
commercial brines) and prolonged survival of E. coli O157:H7 in cucumber juice
fermented with L. mesenteroides and L. plantarum when incubation temperature was
lower (10 °C). Higher incubation temperature (30 °C) resulted in accelerated 5-log
reduction of E. coli O157:H7, with brine fermented by L. plantarum showing the quickest
reduction at less than 1 day based on the death curve calculated utilizing a polynomial
function (Breidt and Caldwell, 2011).
18
Treatment Determination for a 5-Log Reduction of Escherichia coli in Refrigerated
Pickle Products
Lu et al. (2013) developed a method to assure a 5-log reduction of pathogenic E.
coli in refrigerated pickle products. This research was conducted as a response to
concerns of survival of E. coli at 4 °C in brines typical of commercial refrigerated
products. Prior research demonstrated that E. coli strains were acid resistant and better
survived in refrigerated acid solutions. A brine formulation of 25 mM fumaric acid, 5
mM benzoic acid, 70 mM acetic acid, and 342 mM (2%) NaCl was tested. This
formulation is unique in that it contains fumaric acid and less acetic acid than what is
typical of commercial brines. This formulation assured a 5-log reduction in cell numbers
of E. coli O157:H7 without heat processing. Specifically, a 5-log reduction was seen for E.
coli O157:H7 at 30 °C for 1.52 ± 0.15 d, at 20 °C for 3.12 ± 0.34 d, or at 10 °C for 8.83 ±
0.56 d (Lu et al., 2013).
Characteristics of Genus Lactobacillus
What are Lactobacillus species?
The lactic acid bacteria genus Lactobacillus includes a variety of gram-positive
microaerophilic species capable of survival in a variety of environments, including
nutrient-rich dairy environments, host habitats (such as the human gut), and natural
ecological niches such as plants and soil. The genus Lactobacillus comprises over a
hundred different species, including commercially relevant species such as L.
acidophilus, L. casei, L. bulgaricus, and L. plantarum. For example, L. plantarum is a

19
naturally occurring species that has been reported to dominate on vegetable surfaces
such as cabbage and lettuce (Yang et al., 2010a).
In addition to naturally occurring in produce, members of the genus Lactobacillus
are widely used in food and feed manufacturing and commercially as health-promoting
microbes in probiotic containing foods. Lactic acid bacteria, including genus
Lactobacillus, are also known for their role in the process of carbohydrate fermentation.
Fermentation may proceed relying solely on naturally occurring LABs or as a starter
culture (addition of the individual LAB strain to already occurring natural LABs) to ensure
a controlled, complete fermentation is accomplished. This is common commercially and
is particularly important in the fermentation of vegetable products, such as sauerkraut,
pickles, and kimchi, which have raw vegetables as a starting ingredient (Lahtinen et al.,
2012).
Function of Lactic Acid Bacteria in Carbohydrate Fermentation
Lactic acid bacteria (LAB) obtain their energy through substrate-level
phosphorylation. There are two basic fermentative pathways occurring in LAB. The
homofermentative pathway (Embden-Meyerhof-Parnas pathway) produces only lactic
acid. The heterofermentative pathway (pentose phosphoketolase pathway) produces
lactic acid, ethanol, and significant amounts of carbon dioxide. Lactobacillus favors the
homofermentative pathway. It nets 2 lactate molecules and 2 ATP molecules per 1
glucose molecule. The Embden-Meyerhof-Parnas pathway (glycolysis) oxidizes one
glucose molecule to 2 pyruvates, 2 ATP, and 2 NADH. Both pyruvates are reduced to
NADH, which is oxidized to NAD+. The lactate is then excreted into the surrounding

20
environment. Fermentation is generally regarded as a fast process. Although
fermentation only generates 3% to 7% of the 38 ATPs that oxidative phosphorylation
can potentially produce, fermentation actually produces ATP at about 100 times the
rate of oxidative phosphorylation by comparison. Due to this accelerated rate, many
cells ferment in the presence of glucose instead of respire, even if oxygen is present.
This is known as the Crabtree effect, and it occurs in many bacteria in nature, including
Escherichia coli when presented with high concentrations of glucose (Wright and
Axelson, 2012).
Objective, Hypotheses and Specific Aims
The objective of this research was to determine 5-log reduction times in 50%
cucumber juice media for two separate bacterial cocktails: Escherichia coli O157:H7 and
Lactobacillus. Media differed by salt type and concentration: 2% NaCl, 6% NaCl, and
1.1% CaCl2.
Hypotheses
1. The fastest 5-log reduction, regardless of bacterial cocktail, will be seen in media with
a salt type of NaCl and a concentration of 6%.
2. The slowest 5-log reduction, regardless of bacterial cocktail, will be seen in media
with a salt type of CaCl2 and concentration of 1.1%.
Specific Aims
The specific aims of this project were to:
1. Determine 5-log reduction times of Escherichia coli O157:H7 in cucumber juice media
that varied by salt type and concentration.

21
2. Determine 5-log reduction times of Lactobacillus in cucumber juice media that varied
by salt type and concentration.

22
CHAPTER 3
METHODS
Pickling cucumbers were obtained and processed to a cucumber juice medium to
be used in studying characteristics of E. coli O157:H7 and Lactobacillus species (spp.)
survival in the presence of certain salt concentrations. Samples of cucumber juice had
the addition of either 2% NaCl, 6% NaCl or 1.1% CaCl2. Lactic acid was also added to
samples. Samples of these cucumber juice media were then inoculated with one of two
5-strain cocktails: Lactobacillus spp. or Escherichia coli O157:H7. Three replications of
each treatment were performed. Samples were serially diluted, auto-plated, and
counted at specific time points to determine log reduction times.
Cucumber Juice Preparation
Size 2B (3.5-3.8 cm in diameter) fresh cucumbers were obtained from Mt. Olive
Pickle Company in Mount Olive, NC. Cucumbers were covered in aluminum foil and
stored in a walk-in refrigerator unit at 4 °C for up to 1 week. Cucumbers were scrubbed
with warm water to remove any dirt and debris. Visual inspection of cucumbers for
mold was also done; those with signs of mold were removed. Cucumbers were chopped
and blended in an industrial blender to make a slurry. The cucumber slurry was then
poured into clean, empty gallon jars and frozen in a walk-in freezer maintained at 0 °C
for 2-3 weeks.

23
To prepare cucumber juice, frozen slurry was pulled from walk-in freezer and
thawed at room temperature overnight. Thawed slurry was strained through a
cheesecloth to separate the pulp from the juice. Equal amounts of cucumber juice were
separated into 250 ml centrifuge bottles. Bottles were only filled 2/3 full to prevent
accidental spillover. Bottles were placed into the centrifuge in a balanced configuration.
The Sorvall GSA rotor head was closed and the centrifuge (Sorvall RC-5B refrigerated
superspeed centrifuge, DuPont Instruments, Wilmington, DE) was set to 5x1000 rpm for
45 minutes to further separate the pulp and cucumber juice.
After centrifugation, the cucumber juice was carefully removed and pelleted
pulp and debris were discarded. Cucumber juice was passed through a vacuum filtration
unit with a 40 µm filter (Millipore SteriFlip vacuum-driven filtration system 50 ml,
Millipore Corporation, Billerica, MA) to remove final remaining particulates. Bottles
were labeled and stored in a refrigerator at 4 °C until ready for use. Storage can be from
2-3 months. Visual inspection of juice should be performed before use. Juice should
remain clear of any particulates and should not have a clouded appearance.
Bacterial Strains and Growth Conditions
Five strains each of Escherichia coli O157:H7 and Lactobacillus spp. were
obtained from stock cultures in a -80 °C freezer. E. coli strains included: B0200 (human
feces), B0201 (apple cider outbreak), B0202 (salami outbreak), B0203 (ground beef), and
B0204 (pork). Lactobacillus spp. strains included: LA0471, LA0023, LA0513, LA0516, and
LA0445 (all pickle isolates from cucumber fermentation). E. coli strains were streaked on
Luria Bertani (LB) plates (Becton, Dickinson and Company, Franklin Lakes, NJ) and

24
incubated at 37 °C for 17 hours. Lactobacillus strains were streaked on Lactobacilli
deMan Rogosa and Sharpe (MRS) plates (Becton, Dickinson and Company, Franklin
Lakes, NJ) and stored at 30 °C for 36 hours.
Once colony growth was seen on plates, a colony for each individual strain was
removed with a disposable wire loop and deposited in 15 ml screwcap tubes (Corning
CentriStar that contained 5 ml of MRS broth (if a Lactobacillus spp. strain) or LB broth (if
an E. coli strain) (Becton, Dickinson and Company, Franklin Lakes, NJ). E. coli strains
were grown statically at 37 °C for 18 hours to induce acid resistance. Lactobacillus was
also grown statically at 30 °C for 36 hours.
Making Cucumber Juice Treatments
Three different test treatments and one control were made for both E. coli and
Lactobacillus spp. cocktails. All treatments were 50 milliliters total volume, with 25
milliliters being cucumber juice and 25 milliliters being filtered deionized water. See
Tables 3.1 and 3.2 for test conditions for each treatment. All conditions consisted of a
controlled mM acid content and differed by salt amount and/or type only. All
treatments were stored in an anaerobic chamber (Coy Laboratory Products Inc., Grass
Lake, MI) at 30 °C for 48 hours to equilibrate before inoculation with bacterial strains.

25
Table 3.1. Cucumber Juice Treatments for Escherichia coli O157:H7
Code Treatment Acidc pHd
D 2% NaCla 50 mM 3.2
E 6% NaCl 50 mM 3.2
F 1.1% CaCl2b 50 mM 3.2
control -- 50 mM 3.2
a Sodium chloride (Fischer Scientific, Pittsburgh, PA) b Calcium chloride dehydrate (Aldrich Chemical Company, St. Louis, MO) c Sodium L-lactate (Aldrich Chemical Company, St. Louis, MO) d pH was tested in all treatments (Accumet AB150, Fischer Scientific, Pittsburgh, PA) and adjusted as needed to target of 3.2 with hydrochloric acid (Aldrich Chemical Company, St. Louis, MO)
Table 3.2. Cucumber Juice Treatments for Lactobacillus spp.
Code Treatment Acidc pHd
A 2% NaCla 350 mM 3.2
B 6% NaCl 350 mM 3.2
C 1.1% CaCl2b 350 mM 3.2
control -- 350 mM 3.2
a Sodium chloride (Fischer Scientific, Pittsburgh, PA) b Calcium chloride dehydrate (Aldrich Chemical Company, St. Louis, MO) c Sodium L-lactate (Aldrich Chemical Company, St. Louis, MO) d pH was tested in all treatments (Accumet AB150, Fischer Scientific, Pittsburgh, PA) and adjusted as needed to target of 3.2 with hydrochloric acid (Aldrich Chemical Company, St. Louis, MO)

26
Making 5-Strain Cocktails
E. coli O157:H7 and Lactobacillus spp. cocktails were made by combining
individual strains. All strains were obtained from the culture collection of the Food
Safety and Foodborne Disease Prevention laboratory at North Carolina State University.
15 ml screwcap tubes with strains were placed into the centrifuge rotor balanced.
Individual strains were centrifuged (Sorvall RC-5B, SS-34 rotor, refrigerated superspeed
centrifuge, DuPont Instruments, Wilmington, DE) for 10 minutes at 5x1000 rpm. Cells
were then resuspended in 1 ml of sterile saline (0.85 NaCl) using pipette (SL1000, Rainin
Instruments, Oakland, CA) and disposable pipette tips. Cell cultures of the same species
were then combined in a 50 ml screwcap tube. All screwcap tubes were vortexed
(Daigger Vortex Genie 2, Scientific Industries Inc., Bohemia, NY) before and after cell
culture combination to ensure adequate mixing. All work was performed in a class II,
type A2 laminar flow biological safety cabinet (NU425-500, NuAire Inc., Plymouth,
Minnesota).
Treatment Inoculation Procedures
Inoculation of all test treatments was performed in an anaerobic chamber (Coy
Laboratory Products Inc., Grass Lake, MI). 10 ml Vacutainer tubes containing prepared
cucumber juice + salt media were inoculated with bacterial cocktails. Vacutainer tubes
were used because sampling can be done without introducing oxygen to the
treatments, sustaining an anaerobic environment within the tubes. Use of Vacutainer
tubes acts as a control, affirming that cell death is likely occurring due to the effects of
salt and acid, not the combined effects of dissolved oxygen and organic acid/pH. 9 ml of

27
each equilibrated treatment were inserted into separate Vacutainer tubes using a 10 ml
syringe with a 21G x 2 needle (Becton, Dickinson and Company, Franklin Lakes, NJ). 1 ml
of cocktail was then added to Vacutainer tubes with treatments and vortexed. Control
Vacutainer tubes were not inoculated with either cocktail.
Sampling of Treatments
Original inoculation cell counts were determined by withdrawing 1 ml of each
bacterial cocktail with 1 ml TB syringe with intradermal bevel needle (Becton, Dickinson
and Company, Franklin Lakes, NJ). Original cell inoculation counts were determined to
be approximately 109 CFU/ml for all treatments.
Serial dilutions were done for all inoculated cucumber juice treatments and are
specified in Tables 3.3 and 3.4. Dilutions were consistent across reps. Dilutions were
made into vials containing 900 µl 1% MOPS-Saline (0.85%) for each subsequent sample.
0.3 ml for each treatment was withdrawn with 1 ml TB syringe with intradermal bevel
needle (Becton, Dickinson and Company, Franklin Lakes, NJ) into a blank vial. 100 µl was
then pipetted (P200, Rainin Instruments, Oakland, CA) for each dilution with disposable
pipette tips.

28
Table 3.3. Serial Dilutions for Escherichia coli O157:H7 Samples.
Time Perioda Sampleb Dilution (1/10)
T0 D 5.00
T0 E 5.00
T0 F 5.00
T1 D 2.00
T1 E 2.00
T1 F 2.00
T2 D 2.00
T2 E 2.00
T2 F 2.00
T3 D 0.00
T3 E 0.00
T3 F 0.00
T4 D 0.00
T4 E 0.00
T4 F 0.00
T5 D 0.00
T5 E 0.00
T5 F 0.00
a Time periods: T0= 1 hour, T1= 4 hours, T2= 7 hours, T3= 10 hours, T4= 14 hours, T5= 18 hours b Samples: D= 2% NaCl sample, E= 6% NaCl sample, F= 1.1% CaCl2 sample

29
Table 3.4. Serial Dilutions for Lactobacillus spp. Samples.
Time Period Sample Dilution (1/10)
T0 A 5.00
T0 B 5.00
T0 C 5.00
T1 A 3.00
T1 B 2.00
T1 C 3.00
T2 A 3.00
T2 B 2.00
T2 C 3.00
T3 A 2.00
T3 B 1.00
T3 C 2.00
T4 A 1.00
T4 B 0.00
T4 C 2.00
T5 A 0.00
T5 B 0.00
T5 C 2.00
a Time periods: T0= 1 hour, T1= 6 hours, T2= 20 hours, T3= 26 hours, T4= 40 hours, T5= 46 hours b Samples: D= 2% NaCl sample, E= 6% NaCl sample, F= 1.1% CaCl2 sample

30
Plating Treatments
Plates used for experiments were sterile, polystrene 100 mm x 15 mm (Fischer
Scientific, Pittsburgh, PA). MRS and LB agar (Becton, Dickinson and Company, Franklin
Lakes, NJ) were mixed separately, autoclaved, poured into petri dishes, and allowed to
cool and set overnight at room temperature. Culture populations in inoculated media
were determined by plating serial dilutions using a spiral plater (Spiral Biotech Inc.,
Norwood, MA) and either MRS or LB pre-made plates. E. coli plates were incubated at
37 °C for 18 hours. Lactobacillus spp. plates were incubated at 30 °C for 36 hours.
Serial dilutions were plated at specific time intervals. Samples of E. coli were
plated at 1, 4, 7, 10, 14, and 18 hours. Samples of Lactobacillus spp. were plated at 1, 6,
20, 26, 40, and 46 hours. Hours of plating were based on prior unpublished pilot
research that showed when adequate log reduction and colony growth would occur.
Colony Counting
After storing plates to allow for colony growth, colony counting was performed
using a Q-Count 510 colony counter (Spiral Biotech, Norwood, MA). A shutter speed of
1/60 was used for all plates. Data generated from Q-Count is cfu/ml, which was then
transformed to logarithmic values for statistical analysis.

31
CHAPTER 4
RESULTS
Raw data collected for microbial counts were expressed as CFU/ml which were
then converted to common logarithmic units for analysis. The main independent
variable was salt concentration. Log reduction was considered the dependent variable.
This is true for both data sets: log reductions in E. coli O157:H7 and Lactobacillus species
(spp.). Results for E. coli O157:H7 and Lactobacillus data will be presented separately.
Repeated-measures analysis of variance (ANOVA) was used to test statistical
significance among salt treatments (SAS Version 9.3, Cary, NC) for both sets of data,
with each set of data representative of 3 repetitions (reps) per salt level. This approach
was selected based on factors including: type of observations, number of samples, and
nature of variables for the study. The following table (Figure 1) from Ilstrup (1990) was
used to confirm the approach. Repeated-measures ANOVA was shown to be
appropriate based on the study’s design which included: dependent observations, 3
samples (treatments), and continuous variables.

Figure 4.1. Univariate Methods for Statistical Analysis in Microbiology.
Source: Ilstrup, D.M. 1990. Statistical methods in microbiology. Clinical Microbiology Reviews 3:219-226.
32
43

33
Two different models were generated: one model for E. coli O157:H7 cocktails
and one for Lactobacillus spp. cocktails. It is worth noting that this is not the only
approach for statistical analysis with this type of microbial data. Additional approaches
have been generated by statisticians in the field. For example, the Weibull model, a
parametric survival model, was utilized in selected studies referenced in chapter 2
(Breidt et al., 2013; Breidt et al., 2011). Repeated-measures ANOVA was ultimately
chosen for analysis based on the number of dependent samples in this study and the
allowance for reproducibility of results.
E. coli O157:H7 Results
SAS generated the following General Linear Model (GLM) for comparing significance in
E. coli O157:H7 log reductions:
𝑳𝒐𝒈𝑪𝑭𝑼𝒊𝒋𝒕=𝜶+𝜷𝟏𝑰𝒔𝒂𝒍𝒕𝒍𝒆𝒗𝒆𝒍(𝒊=𝟏)+𝜷𝟐𝑰𝒔𝒂𝒍𝒕𝒍𝒆𝒗𝒆𝒍(𝒊=𝟐)+𝜸𝟏𝑰𝑻𝒊𝒎𝒆𝑯𝒐𝒖𝒓(𝒕=𝟒) +𝜸𝟐𝑰𝑻𝒊𝒎𝒆𝑯𝒐𝒖𝒓(𝒕=𝟕)+𝜸𝟑𝑰𝑻𝒊𝒎𝒆𝑯𝒐𝒖𝒓(𝒕=𝟏𝟎)+𝜸𝟒𝑰𝑻𝒊𝒎𝒆𝑯𝒐𝒖𝒓(𝒕=𝟏𝟒)+𝜸𝟓𝑰𝑻𝒊𝒎𝒆𝑯𝒐𝒖𝒓(𝒕=𝟏𝟖)+𝜹𝟏𝑰𝒔𝒂𝒍𝒕𝒍𝒆𝒗𝒆𝒍(𝒊=𝟏)×𝑰𝑻𝒊𝒎𝒆𝑯𝒐𝒖𝒓(𝒕=𝟒) +𝜹𝟐𝑰𝒔𝒂𝒍𝒕𝒍𝒆𝒗𝒆𝒍(𝒊=𝟏)×𝑰𝑻𝒊𝒎𝒆𝑯𝒐𝒖𝒓(𝒕=𝟕) +𝜹𝟑𝑰𝒔𝒂𝒍𝒕𝒍𝒆𝒗𝒆𝒍(𝒊=𝟏)×𝑰𝑻𝒊𝒎𝒆𝑯𝒐𝒖𝒓(𝒕=𝟏𝟎) +𝜹𝟒𝑰𝒔𝒂𝒍𝒕𝒍𝒆𝒗𝒆𝒍(𝒊=𝟏)×𝑰𝑻𝒊𝒎𝒆𝑯𝒐𝒖𝒓(𝒕=𝟏𝟒) +𝜹𝟓𝑰𝒔𝒂𝒍𝒕𝒍𝒆𝒗𝒆𝒍(𝒊=𝟏)×𝑰𝑻𝒊𝒎𝒆𝑯𝒐𝒖𝒓(𝒕=𝟏𝟖) +𝜹𝟔𝑰𝒔𝒂𝒍𝒕𝒍𝒆𝒗𝒆𝒍(𝒊=𝟐)×𝑰𝑻𝒊𝒎𝒆𝑯𝒐𝒖𝒓(𝒕=𝟒) +𝜹𝟕𝑰𝒔𝒂𝒍𝒕𝒍𝒆𝒗𝒆𝒍(𝒊=𝟐)×𝑰𝑻𝒊𝒎𝒆𝑯𝒐𝒖𝒓(𝒕=𝟕) +𝜹𝟖𝑰𝒔𝒂𝒍𝒕𝒍𝒆𝒗𝒆𝒍(𝒊=𝟐)×𝑰𝑻𝒊𝒎𝒆𝑯𝒐𝒖𝒓(𝒕=𝟏𝟎) +𝜹𝟗𝑰𝒔𝒂𝒍𝒕𝒍𝒆𝒗𝒆𝒍(𝒊=𝟐)×𝑰𝑻𝒊𝒎𝒆𝑯𝒐𝒖𝒓(𝒕=𝟏𝟒) +𝜹𝟏𝟎𝑰𝒔𝒂𝒍𝒕𝒍𝒆𝒗𝒆𝒍(𝒊=𝟐)×𝑰𝑻𝒊𝒎𝒆𝑯𝒐𝒖𝒓(𝒕=𝟏𝟖) +𝜺𝒊𝒋𝒕, 𝒇𝒐𝒓 𝒊=𝟏,𝟐;𝒕=𝟒,𝟕,𝟏𝟎,𝟏𝟒,𝟏𝟖;𝒋=𝟏,𝟐,𝟑
Where α indicates the baseline, which corresponds to an observation under the condition that the salt level to be (NaCl, CaCl)=(0, 1.1) and time of observation to be 0 hours; 𝑖=1 and 𝑖=2 indicate the salt level to be (NaCl, CaCl)=(2, 0.0) and (NaCl, CaCl)=(6, 0.0); 𝑡=4,𝑡=7,𝑡=10,𝑡=14 and 𝑡=18 indicate the time of observation to be 4, 7, 10, 14 hours. 𝐼𝑠𝑎𝑙(𝑖)×𝐼𝑇𝑖𝑚𝑒𝐻𝑜𝑢𝑟(𝑡) represents the interaction effect between salt level of 𝑖 and time 𝑡.

34
When looking at overall log reductions in E. coli O157:H7 samples, a 5-log
reduction was reached in 6% NaCl by 14 hours and in 1.1% CaCl2 by 18 hours (Table 4.1).
The log reductions in 2% NaCl proceeded at the slowest rate overall. At 18 hours only a
4.43 log reduction was reached.
Table 4.1. Surviving Populations of E. coli O157:H7 in log CFU/mla in Varied Salt Types and Concentrations over Time and Time Required to Achieve a 5-Log Reduction.
Time (Hours) Salt Type and Concentration
2% NaCl 6% NaCl 1.1% CaCl2
1 8.34 8.30 8.42
4 7.07 7.03 7.04
7 6.65 5.08 5.89
10 5.78 4.13 4.99
14 4.66 3.26b 4.04
18 3.91 2.95 3.21b
Total log reduction by
18 hours
4.43
5.35
5.21
a Values in a column represent the average of 3 reps b Represents the time point a 5-log reduction is first observed
A Type III Test of Fixed Effects was run (Table 4.2). All effects including salt level F(2, 34)
= 655.50, Pr > F= <.001, time of observation F(5,34) = 5249.00, Pr > F= <.001, and
interaction (salt level x time of observation) F(10,34)= 69.38, Pr > F= <.001 are significant
at significance level ɑ = .01. Since the interaction effects were significant, these will be
the focus of interpretation rather than the main effects of salt level and time of
observation. This significance demonstrates that the interaction of these two variables is
an important predictor for the dependent variable (log reduction).

35
Table 4.2. Type III Test: Results of Fixed Effects Analysis in Log Reductions of E. coli O157:H7 in Media with Varying Salt Types and Concentrations.
Effect Numerator DF
Denominator DF
F Value Pr > F
Salt level 2 34 655.50 <.001
Time 5 34 5249.00 <.001
Salt level x time 10 34 69.38 <.001
To interpret if there were significant differences across the interaction effects
specifically, differences of least square means was calculated at the significance level ɑ =
.01 (Table 4.3). A few trends were revealed through the statistical model: 1) no
significant difference exists between log reductions for all salt concentrations at a time
point of zero hours, 2) no significant difference exists between log reductions for all salt
concentrations at a time point of four hours, and 3) a significant difference in log
reductions exists between all salt concentrations at all other time points.

36
Table 4.3. Equality Test: Differences of Least Square Means of Log Reductions in E. coli O157:H7 Cocktail Population When Comparing Salt Levels at Various Time Points.
Time Point (Hours)
Salt Levels Compareda
Estimate Standard Error (SE)
DF t value Pr > l t lb
1 1, 2 0.04000 0.06378 34 0.63 0.5347
1 1, 3 -0.07667 0.06378 34 -1.20 0.2377
1 2, 3 -0.1167 0.06378 34 -1.83 0.0762
4 1, 2 0.03667 0.06378 34 0.57 0.5691
4 1, 3 0.03333 0.06378 34 0.52 0.6046
4 2, 3 -0.00333 0.06378 34 -0.05 0.9586
7 1, 2 1.5667 0.06378 34 24.56 <.0001*
7 1, 3 0.7600 0.06378 34 11.92 <.0001*
7 2, 3 -0.8067 0.06378 34 -12.65 <.0001*
10 1, 2 1.6467 0.06378 34 25.82 <.0001*
10 1, 3 0.7867 0.06378 34 12.33 <.0001*
10 2, 3 -0.8600 0.06378 34 -13.48 <.0001*
14 1, 2 1.4033 0.06378 34 22.00 <.0001*
14 1, 3 0.6233 0.06378 34 9.77 <.0001*
14 2, 3 -0.7800 0.06378 34 -12.23 <.0001*
18 1, 2 0.9633 0.06378 34 15.10 <.0001*
18 1, 3 0.7033 0.06378 34 11.03 <.0001*
18 2, 3 -0.2600 0.06378 34 -4.08 <.0001*
a Where salt level is denoted as 1= 2% NaCl, 2= 6% NaCl, and 3= 1.1% CaCl2 b Results with * indicate significant difference at significance level ɑ = .01
37
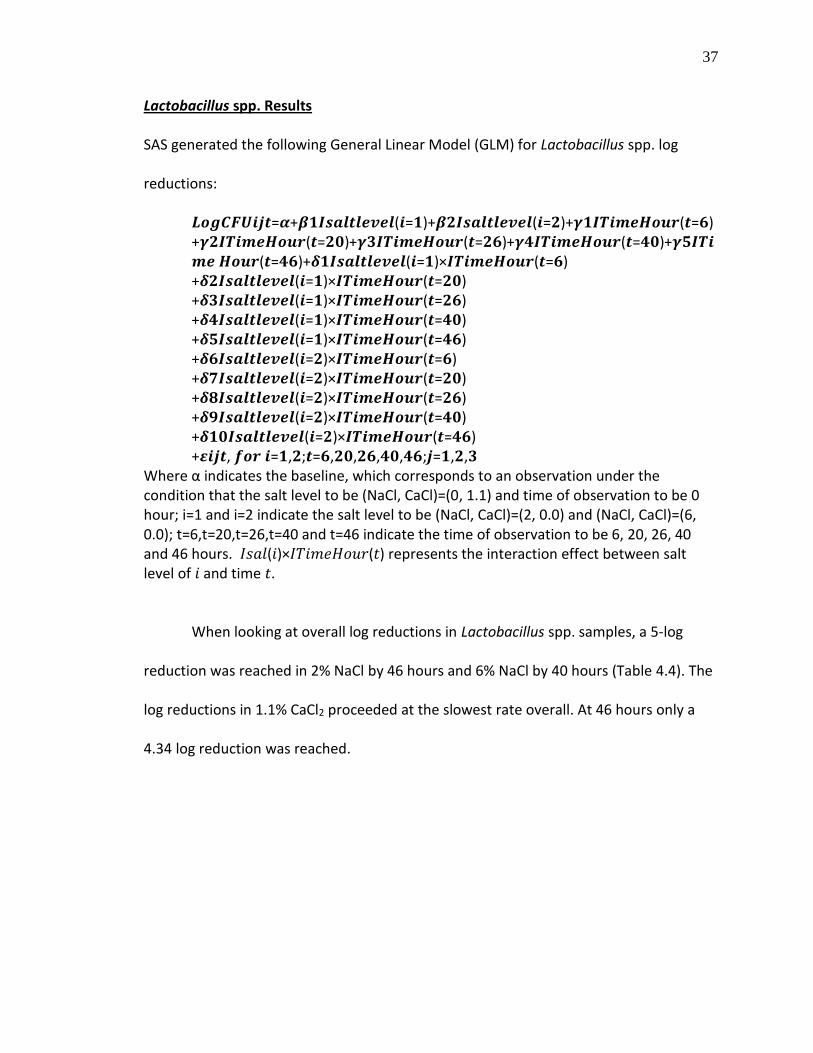
Lactobacillus spp. Results
SAS generated the following General Linear Model (GLM) for Lactobacillus spp. log
reductions:
𝑳𝒐𝒈𝑪𝑭𝑼𝒊𝒋𝒕=𝜶+𝜷𝟏𝑰𝒔𝒂𝒍𝒕𝒍𝒆𝒗𝒆𝒍(𝒊=𝟏)+𝜷𝟐𝑰𝒔𝒂𝒍𝒕𝒍𝒆𝒗𝒆𝒍(𝒊=𝟐)+𝜸𝟏𝑰𝑻𝒊𝒎𝒆𝑯𝒐𝒖𝒓(𝒕=𝟔) +𝜸𝟐𝑰𝑻𝒊𝒎𝒆𝑯𝒐𝒖𝒓(𝒕=𝟐𝟎)+𝜸𝟑𝑰𝑻𝒊𝒎𝒆𝑯𝒐𝒖𝒓(𝒕=𝟐𝟔)+𝜸𝟒𝑰𝑻𝒊𝒎𝒆𝑯𝒐𝒖𝒓(𝒕=𝟒𝟎)+𝜸𝟓𝑰𝑻𝒊𝒎𝒆 𝑯𝒐𝒖𝒓(𝒕=𝟒𝟔)+𝜹𝟏𝑰𝒔𝒂𝒍𝒕𝒍𝒆𝒗𝒆𝒍(𝒊=𝟏)×𝑰𝑻𝒊𝒎𝒆𝑯𝒐𝒖𝒓(𝒕=𝟔) +𝜹𝟐𝑰𝒔𝒂𝒍𝒕𝒍𝒆𝒗𝒆𝒍(𝒊=𝟏)×𝑰𝑻𝒊𝒎𝒆𝑯𝒐𝒖𝒓(𝒕=𝟐𝟎) +𝜹𝟑𝑰𝒔𝒂𝒍𝒕𝒍𝒆𝒗𝒆𝒍(𝒊=𝟏)×𝑰𝑻𝒊𝒎𝒆𝑯𝒐𝒖𝒓(𝒕=𝟐𝟔) +𝜹𝟒𝑰𝒔𝒂𝒍𝒕𝒍𝒆𝒗𝒆𝒍(𝒊=𝟏)×𝑰𝑻𝒊𝒎𝒆𝑯𝒐𝒖𝒓(𝒕=𝟒𝟎) +𝜹𝟓𝑰𝒔𝒂𝒍𝒕𝒍𝒆𝒗𝒆𝒍(𝒊=𝟏)×𝑰𝑻𝒊𝒎𝒆𝑯𝒐𝒖𝒓(𝒕=𝟒𝟔) +𝜹𝟔𝑰𝒔𝒂𝒍𝒕𝒍𝒆𝒗𝒆𝒍(𝒊=𝟐)×𝑰𝑻𝒊𝒎𝒆𝑯𝒐𝒖𝒓(𝒕=𝟔) +𝜹𝟕𝑰𝒔𝒂𝒍𝒕𝒍𝒆𝒗𝒆𝒍(𝒊=𝟐)×𝑰𝑻𝒊𝒎𝒆𝑯𝒐𝒖𝒓(𝒕=𝟐𝟎) +𝜹𝟖𝑰𝒔𝒂𝒍𝒕𝒍𝒆𝒗𝒆𝒍(𝒊=𝟐)×𝑰𝑻𝒊𝒎𝒆𝑯𝒐𝒖𝒓(𝒕=𝟐𝟔) +𝜹𝟗𝑰𝒔𝒂𝒍𝒕𝒍𝒆𝒗𝒆𝒍(𝒊=𝟐)×𝑰𝑻𝒊𝒎𝒆𝑯𝒐𝒖𝒓(𝒕=𝟒𝟎) +𝜹𝟏𝟎𝑰𝒔𝒂𝒍𝒕𝒍𝒆𝒗𝒆𝒍(𝒊=𝟐)×𝑰𝑻𝒊𝒎𝒆𝑯𝒐𝒖𝒓(𝒕=𝟒𝟔) +𝜺𝒊𝒋𝒕, 𝒇𝒐𝒓 𝒊=𝟏,𝟐;𝒕=𝟔,𝟐𝟎,𝟐𝟔,𝟒𝟎,𝟒𝟔;𝒋=𝟏,𝟐,𝟑
Where α indicates the baseline, which corresponds to an observation under the condition that the salt level to be (NaCl, CaCl)=(0, 1.1) and time of observation to be 0 hour; i=1 and i=2 indicate the salt level to be (NaCl, CaCl)=(2, 0.0) and (NaCl, CaCl)=(6, 0.0); t=6,t=20,t=26,t=40 and t=46 indicate the time of observation to be 6, 20, 26, 40 and 46 hours. 𝐼𝑠𝑎𝑙(𝑖)×𝐼𝑇𝑖𝑚𝑒𝐻𝑜𝑢𝑟(𝑡) represents the interaction effect between salt level of 𝑖 and time 𝑡.
When looking at overall log reductions in Lactobacillus spp. samples, a 5-log
reduction was reached in 2% NaCl by 46 hours and 6% NaCl by 40 hours (Table 4.4). The
log reductions in 1.1% CaCl2 proceeded at the slowest rate overall. At 46 hours only a
4.34 log reduction was reached.

38
Table 4.4. Surviving Populations of Lactobacillus in log CFU/mla in Varied Salt Types and Concentrations over Time and Time Required to Achieve a 5-log Reduction.
Time (Hours) Salt Type and Concentration
2% NaCl 6% NaCl 1.1% CaCl2
1 8.53 8.49 8.54
6 6.83 6.71 6.97
20 4.78 4.45 5.55
26 3.87 3.60 4.70
40 3.62 3.31b 4.37
46 2.57b 2.71 4.20
Total log reduction by 46
hours
5.96
5.78
4.34
a Values in a column represent the average of 3 reps b Represents the time point a 5-log reduction is first observed
A Type III Test of Fixed Effects was run (Table 4.5). All effects including salt level
F(2, 34) = 223.87, Pr > F= <.001, time of observation F(5,34) = 2354.71, Pr > F= <.001,
and interaction (salt level x time of observation) F(10,34)= 21.06, Pr > F= <.001 are
significant at significance level ɑ = .01. Since the interaction effects were significant,
these will be the focus of interpretation rather than the main effects of salt level and
time of observation. This significance demonstrates that the interaction of these two
variables is an important predictor for the dependent variable (log reduction).
Table 4.5. Type III Test: Results of Fixed Effects Analysis in Log Reduction of Lactobacillus spp. in Media with Varying Salt Types and Concentrations.
Effect Numerator DF Denominator DF F Value Pr > F
Salt level 2 34 223.87 <.001
Time 5 34 2354.71 <.001
Salt level x time 10 34 21.06 <.001

39
To interpret if there were significant differences across the interaction effects
specifically, differences of least square means was calculated at the significance level
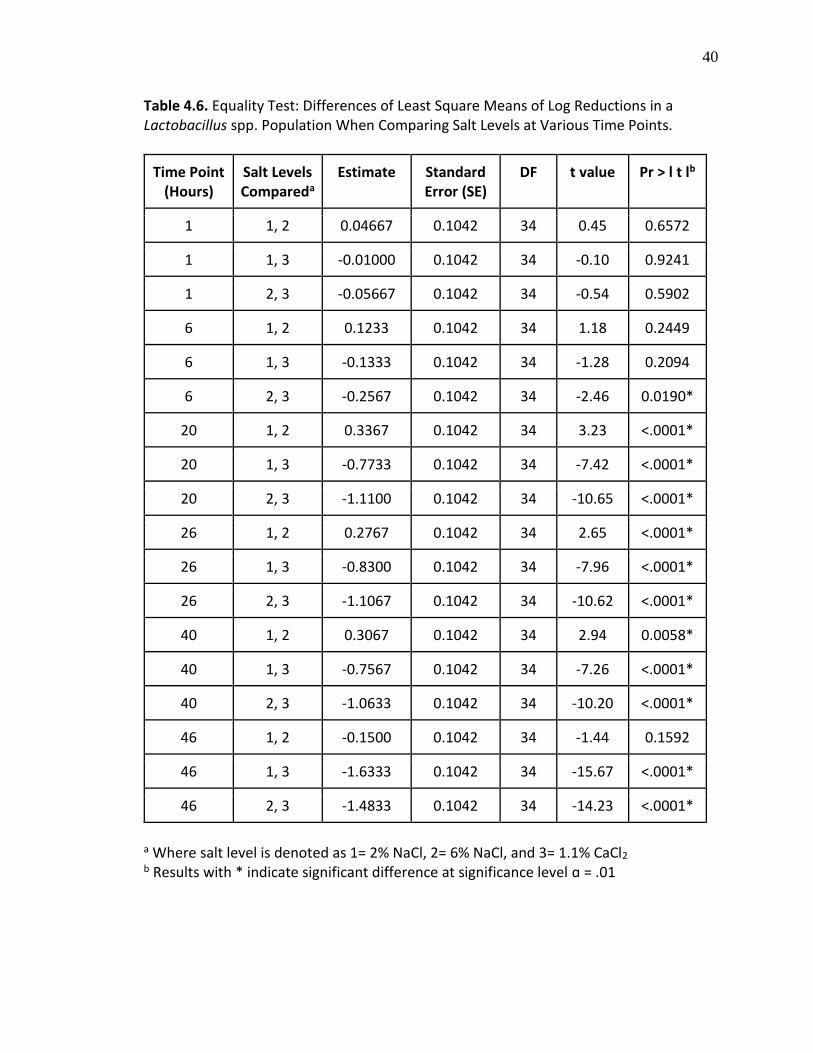
ɑ = .01 (Table 4.6). A few trends were revealed through the statistical model: 1) no
significant difference exists between log reductions for all salt concentrations at a time
point of zero hours, 2) no significant difference exists between log reductions for salt
concentrations of 2% NaCl and 6% NaCl and 2% NaCl and 1.1% CaCl at a time point of six
hours, 3) no significant difference exists between log reductions for salt concentrations
of 2% NaCl and 6% NaCl at 46 hours, and 4) a significant difference in log reductions
exists between all salt concentrations at all other time points.
40
Table 4.6. Equality Test: Differences of Least Square Means of Log Reductions in a Lactobacillus spp. Population When Comparing Salt Levels at Various Time Points.
Time Point (Hours)
Salt Levels Compareda
Estimate Standard Error (SE)
DF t value Pr > l t lb
1 1, 2 0.04667 0.1042 34 0.45 0.6572
1 1, 3 -0.01000 0.1042 34 -0.10 0.9241
1 2, 3 -0.05667 0.1042 34 -0.54 0.5902
6 1, 2 0.1233 0.1042 34 1.18 0.2449
6 1, 3 -0.1333 0.1042 34 -1.28 0.2094
6 2, 3 -0.2567 0.1042 34 -2.46 0.0190*
20 1, 2 0.3367 0.1042 34 3.23 <.0001*
20 1, 3 -0.7733 0.1042 34 -7.42 <.0001*
20 2, 3 -1.1100 0.1042 34 -10.65 <.0001*
26 1, 2 0.2767 0.1042 34 2.65 <.0001*
26 1, 3 -0.8300 0.1042 34 -7.96 <.0001*
26 2, 3 -1.1067 0.1042 34 -10.62 <.0001*
40 1, 2 0.3067 0.1042 34 2.94 0.0058*
40 1, 3 -0.7567 0.1042 34 -7.26 <.0001*
40 2, 3 -1.0633 0.1042 34 -10.20 <.0001*
46 1, 2 -0.1500 0.1042 34 -1.44 0.1592
46 1, 3 -1.6333 0.1042 34 -15.67 <.0001*
46 2, 3 -1.4833 0.1042 34 -14.23 <.0001*
a Where salt level is denoted as 1= 2% NaCl, 2= 6% NaCl, and 3= 1.1% CaCl2 b Results with * indicate significant difference at significance level ɑ = .01

41
CHAPTER 5
DISCUSSION
The objective of this research was to determine 5-log reduction times in 50%
cucumber juice medium for two separate bacterial cocktails: Escherichia coli O157:H7
and Lactobacillus species (spp.). Media differed by salt type and concentration: 2% NaCl,
6% NaCl, and 1.1% CaCl2. The results of this study showed a significant interaction effect
for time and salt level for both E. coli O157:H7 and Lactobacillus spp. cocktails. This
indicates that the interaction between these two variables is an important predictor for
the outcome variable of log reduction.
Escherichia coli O157:H7 Log Reductions
Overall, E. coli O157:H7 log reduction was fastest in the cucumber juice medium
with 6% NaCl compared to the other two media. This was expected based on prior
literature and the known osmotic stress of NaCl salt in bacteria (Breidt et al., 2013). This
confirmed one of the key hypotheses generated prior to the study. In contrast, E. coli
O157:H7 log reduction was slowest in the cucumber juice medium with 2% NaCl. This
was an unexpected finding. It was hypothesized that log reduction would be slowest in
the cucumber juice medium with 1.1% CaCl2. This appears to be evidence that lower
concentrations of CaCl2 could be effective in promoting log reductions. Average log
reductions of >5 CFU/ml were achieved within 18 hours in both 6% NaCl and 1.1% CaCl2.
At 18 hours, the log reduction reached in 2% NaCl was only an average of 4.43 CFU/ml

42
(Figure 5.1). Figure 5.1 depicts the reduction of E. coli in the three salt media used. The
equations used to generate these lines were: y = 0.0013x2 - 0.2691x + 8.3005 (2% NaCl),
y = 0.0063x2 - 0.4043x + 8.4543 (1.1% CaCl2), and y = 0.0137x2 - 0.5626x + 8.5282 (6%
NaCl).
Differences of Least Square (LS) means of log reductions were also determined
through a repeated measures analysis of variance (ANOVA) general linear model (GLM).
Across all salt levels at a time point of 1 and 4 hours, no significant difference was seen
in log reduction. At all other time points sampled, significant differences were seen
across all salt levels. With a significant difference noted at time points of 7, 10, 14, and
18 hours, comparisons can be made on pace of log reduction based on salt level.

Where R2 is the coefficient of determination. Correlations between salt concentrations and log reductions are all strong, positive. The equations used to generate these lines were: y = 0.0013x2 - 0.2691x + 8.3005 (2% NaCl), y = 0.0063x2 - 0.4043x + 8.4543 (1.1% CaCl2), and y = 0.0137x2 - 0.5626x + 8.5282 (6% NaCl).
Figure 5.1. Mean Log Numbers of E. coli O157:H7 in a Cucumber Juice Medium over Time in Varied Salt Treatments Stored at 30 °C.
R² = 0.9939
R² = 0.9823
R² = 0.9992
0
1
2
3
4
5
6
7
8
9
10
1 3 5 7 9 11 13 15 17 19
Lo
g C
FU
/ml
Time (Hours)
2% NaCl
6% NaCl
1.1% CaCl
43
43

44
Lactobacillus spp. Log Reductions
Overall, in the medium with 1.1% CaCl2, log reduction proceeded at a slower rate
when compared to medium with 2% and 6% NaCl. This confirmed one of the key
hypotheses generated at the study. In contrast, log reduction in the medium with 6%
NaCl proceeded at a faster rate, although it is important to note there was no significant
difference between it and 2% NaCl at the final sampling time period of 46 hours. Again,
this finding supported the original hypothesis generated at the start of the study that
log reduction would proceed fastest in the medium with 6% NaCl. Average log
reductions of >5 CFU/ml were achieved within 46 hours in both 6% NaCl and 2% NaCl. At
46 hours, the log reduction reached in 1.1% CaCl2 was only an average of 4.34 CFU/ml
(Figure 5.2). As with E. coli O157:H7, the effective concentration of salt will vary based
on salt type. Figure 5.2 depicts the reduction of Lactobacillus spp. in the three salt
media used. The equations used to generate these lines were: y = -1.161ln(x) + 8.7333
(1.1% CaCl2), y = -1.494ln(x) + 8.9082 (2% NaCl), and y = -1.518ln(x) + 8.8164 (6% NaCl).
Differences of Least Square (LS) means of log reductions were determined
through a repeated measures analysis of variance (ANOVA) general linear model (GLM).
Across all salt levels at a time point of 1 hour, no significant difference was seen in log
reductions. At a time point of 6 hours, no significant difference was seen between log
reduction in this cucumber juice medium when comparing 2% NaCl and 6% NaCl or
when comparing 2% NaCl and 1.1% CaCl2. A significant difference was seen at a time
point of 6 hours when comparing 6% NaCl and 1.1% CaCl2, however. Log reduction
began to be significantly less in the cucumber juice medium with 1.1% CaCl2 compared

45
to the medium with 6% NaCl. At time points of 20, 26, and 40 hours, there is a
significant difference across all salt levels. At these time points, log reduction proceeded
faster in the cucumber juice medium with 6% NaCl, while log reduction proceeded
slower in the medium with 1.1% CaCl2. Log reduction times for the medium with 2%
NaCl is between these two. Interestingly, at the final time point of 46 hours, no
significant difference was seen in log reduction between 2% NaCl and 6% NaCl. The
medium with 1.1% CaCl2 remained significantly different from both media with 2% and
6% NaCl, consistent with the findings in previous time points sampled.

46
Where R2 is the coefficient of determination. Correlations between salt concentrations and log reductions are all strong, positive. The equations used to generate these lines were: y = -1.161ln(x) + 8.7333 (1.1% CaCl2), y = -1.494ln(x) + 8.9082 (2% NaCl), and y = -1.518ln(x) + 8.8164 (6% NaCl).
Figure 5.2. Mean Log Numbers of Lactobacillus spp. in a Cucumber Juice Medium over Time in Varied Salt Treatments Stored at 30 °C.
R² = 0.9566R² = 0.9729
R² = 0.9795
2
3
4
5
6
7
8
9
10
1 11 21 31 41 51
Lo
g C
FU
/ml
Time (Hours)
2% NaCl
6% NaCl
1.1% CaCl
46
43

47
Limitations
Several key limitations exist in regards to the experiments conducted. Most
notably, results apply only to the specific salt concentrations studied: 2% NaCl, 6% NaCl,
and 1.1% CaCl2. Results cannot be generalized to other concentrations, though general
trends can be predicted. This is important to note particularly when it comes to newer
technologies involving CaCl2.
It is seen that E. coli reduction is potentially achieved fastest based in this model
with 1.1% CaCl2 compared to 2% NaCl which is a standard salt amount in some acidified
food processing. Lactobacillus log reduction seems to proceed slowest in the context of
this model with 1.1% CaCl2 when compared to both 2% and 6% NaCl. Lactobacillus spp.
itself are not foodborne pathogens like E. coli O157:H7, however. They are considered
probiotic bacteria with potential health effects. This research provides evidence to use
CaCl2 as a salt for preservation when E. coli populations are desired to be reduced
significantly, while Lactobacillus spp. are not. This is a primary goal in both home and
commercial fermentations.
Results were also obtained for these two microorganisms separately.
Competition studies with both microorganisms in a cucumber juice medium could yield
different results for both times in log reduction and for differences in reduction based
on salt type/level in the medium. Lactic acid was also considered a control in both parts
of this research. Amount and type of acid did not vary as salt did in these experiments. If
a different acid were to be used, e.g. acetic or benzoic, log reduction times could also be
different as a result.

48
CHAPTER 6
SUMMARY AND CONCLUSIONS
Survival of pathogenic bacteria in acidified and fermented vegetable products
continues to be an area of concern in the processed vegetable industry. The pathogenic
bacteria Escherichia coli O157:H7 particularly is considered to be the most acid resistant
pathogen of concern for non-fermented acidified foods. While determining methods to
eliminate E. coli O157:H7, it is also useful to characterize Lactobacillus species (spp.)
survival independently. Lactobacillus spp. are naturally occurring on the vegetable
surface as well and are important for successful fermentations of vegetables. Therefore,
methods used to reduce or eliminate pathogens need to, at the same time, preserve
necessary Lactobacillus spp. for fermentations.
It also possible that competition among these microorganisms could influence
survival. Before competition studies can be considered between these two
microorganisms, however, it is fundamental to understand and characterize their
behavior in media independently. With this consideration in mind, this research sought
to determine log reduction times for E. coli O157:H7 and Lactobacillus spp. cocktails
separately. A repeated measures analysis of variance (ANOVA) showed that, overall,
both E. coli O157:H7 and Lactobacillus spp. log reduction proceeded fastest in a
cucumber juice medium with 6% NaCl compared to either a 2% NaCl or 1.1% CaCl2
concentration. E. coli O157:H7 in cucumber juice medium with 2% NaCl showed the

49
slowest log reduction. This differed from the Lactobacillus spp. cocktail where log
reduction progressed slowest in 1.1% CaCl2.
Differences of Least Squares (LS) means of log reductions showed if there were
significant differences across salt treatments for E. coli O157:H7 and Lactobacillus spp.
cocktails. Across all salt levels at a time point of 1 and 4 hours, no significant difference
was seen in log reduction for E. coli O157:H7. At all other time points sampled,
significant differences were seen across all salt levels for E. coli O157:H7.
Across all salt levels at a time point of 1 hour, no significant difference was seen
in log reduction for Lactobacillus spp. At a time point of 6 hours, no significant
difference was seen between log reduction in cucumber juice medium when comparing
2% NaCl and 6% NaCl nor 2% NaCl and 1.1% CaCl2 for Lactobacillus spp. A significant
difference was seen at a time point of 6 hours when comparing 6% NaCl and 1.1% CaCl2,
however in Lactobacillus spp., Log reduction began to be significantly less in cucumber
juice medium with 1.1% CaCl2 compared to medium with 6% NaCl. At time points of 20,
26, and 40 hours, there is a significant difference across all salt levels for Lactobacillus
spp. Additional research is needed, but there is some evidence from this study that
calcium chloride could be useful for both reducing E. coli O157:H7 populations while
allowing prolonged survival of desirable Lactobacillus spp.
An additional concept that still demands exploration is the “hurdle effect” in
minimally processed foods. This refers to the combination of two or more inhibitory
agents (such as acid and salt) in processing to reduce the risk of foodborne illness.
Researchers have observed that a combination of effects is not always more inhibitory

50
to foodborne pathogens, however. Some work has demonstrated that E. coli can use 4%
NaCl to counteract acidification of its cytoplasm by organic acids, demonstrating that
the combination of salt and acid cannot always achieve an additive antimicrobial effect
(Casey, P.G. and S. Condon, 2002). Other work showed that the addition of varied
concentrations of NaCl significantly reduced the inhibitory effect of acetic acid on E. coli
O157:H7 in laboratory media and pickled cucumbers. This suggests that the addition of
salt at a certain concentration may actually increase the acid resistance response of E.
coli O157:H7 (Bae, Y. and S. Lee, 2017). Not all researchers exploring this idea have
utilized the same salt and acid concentrations and types though.
Suggestions for Future Research
There are several opportunities for future research related to determination of
log reduction times in acidified vegetable products. For example, a fixed temperature of
30 °C was used for the cucumber juice media in these experiments. This served as an
important control variable throughout. Repeat of experiments utilizing other
temperatures as controls could provide useful information for processors. 30 °C was
initially chosen because most acidified vegetable processing (including commercial
fermentations) occurs at ambient temperatures. Testing with temperatures such as 20
°C would provide for a lower end to an ambient temperature range. In addition, it is
important to consider testing extremes of 10 °C and 40 °C. Temperature extremes are
known to occur during commercial fermentations, for example.
As mentioned in Chapter 5, log reduction times will vary when E. coli O157:H7
and Lactobacillus spp. are studied in competition. Determination of these log reduction

51
times in competition will be particularly impactful for formulation of industry
recommendations, which rely on determinations of 5-log reductions as an industry
performance standard (FDA, 2003).
An additional consideration is that this study explored log reductions of a
population. Future research could also address growth patterns of these
microorganisms in certain acid conditions. This study did not explore bacterial growth
and death during a time of fermentation. Characterization of growth and death in
fermentative conditions (including before lactic acid production) is warranted.
pH was also used as a control variable throughout these experiments. A pH of
3.2 was used for all media. Processing of acidified vegetables, as well as commercial
fermentations, can be carried out across a range of pH values (such as 3.0-3.8), however
(Breidt et al., 2013). Future research can be performed using similar protocols, but
altering the control pH based on values in this range. In addition, different acid types
and concentrations can also be compared in future studies.
While E. coli O157:H7 has been shown to be an acid resistant pathogen of
concern, other pathogens such as Salmonella and Listeria are worth studying in terms of
competition with Lactobacillus spp. These pathogenic microorganisms can occur on the
surface of vegetables as well. Although they are widely considered to be less acid
resistant (compared to E. coli O157:H7), there is a need for evaluating Salmonella and
Listeria behavior in media supplemented with CaCl2, considering this is still an
innovative preservation technology (Kim et al., 2015).

52
REFERENCES
Bae, Y. and Lee, S. 2017. Effect of salt addition on acid resistance response of Escherichia coli O157:H7 against acetic acid. Food Microbiology 65: 74-82. Bower, C.K. and Daeschel, M.A. 1999. Resistance responses of microorganisms in food environments. International Journal of Food Micriobiology 50:33-34. Breidt, F. and Caldwell, J.M. 2011. Survival of Escherichia coli O157:H7 in cucumber fermentation brines. Journal of Food Science 76:M198-M203. Breidt, F., Hayes J.S., McFeeters R.F. 2007. Determination of a 5-log reduction times for food pathogens in acidified cucumbers during storage at 10 and 25°C. Journal of Food Protection 70(11):2638-41. Breidt, F., Kay K., Cook J., Osborne J., Ingham B., Arritt F. 2013. Determination of 5-log reduction times for Escherichia coli O157:H7, Salmonella enterica, or Listeria monocytogenes in acidified foods with pH 3.5 or 3.8. Journal of Food Protection 76(7):1245-1249. Casey, P.G. and Condon, S. 2002. Sodium chloride decreases the bacteriocidal effect of acid pH on Escherichia coli O157:H45. International Journal of Food Microbiology 76:199-206. Chung, H.J., Bang W., Drake M.A. 2006. Stress response of Escherichia coli. Comprehensive Reviews in Food Science and Food Safety 5:52-64. Diaz, I.M., F. Breidt, R.W. Buescher, F.N. Arroyo-Lopez, R. Jimenez-Diaz, A.G. Fernandez, J.B. Gallego, S.S. Yoon, and S.D. Johanningsmeier. 2013. Compendium of methods for the microbiological examination of foods. Fermented and acidified vegetables. APHA Press, Washington, D.C. Dunn JR, Keen JE, Thompson RA. Prevalence of Shiga-toxigenic Escherichia coli O157:H7 in adult dairy cattle. 2004. Journal of the American Veterinary Medical Association 224:1151–1158. Fan, X., Niemira, B.A., Doona, C.J., Feeherry, F.E., and R.B. Gravani (ed). 2009. Microbial safety of fresh produce. IFT Press, Ames, Iowa.

53
Food and Drug Administration (FDA). 2003. Guidance for industry: the juice HACCP regulation- questions & answers. Available at: http://www.fda.gov/food/guidanceregulation/guidancedocumentsregulatoryinformation/ucm072981.htm#F. Accessed 14 February 2017. Food and Drug Administration (FDA). 2010. Processing acidified foods. Draft guidance for industry: acidified foods. Available at: http://www.fda.gov/Food/GuidanceRegulation/GuidanceDocumentsRegulatory-Information/ucm222618.htm. Accessed 24 February 2017. Frenzen, P.D., Drake, A., Angulo, F.J. 2005. Economic cost of illness due to Escherichia coli O157 infections in the United States. Journal of Food Protection 68:2623-2630. Hutkins, R.W. 2006. Microbiology and technology of fermented foods. Blackwell Publishing, Iowa. Ilstrup, D.M. 1990. Statistical methods in microbiology. Clinical Microbiology Reviews 3:219-226. Ingham, G.A., Pan, M., Ranelli, F., and Ingham, B.H. 2017. Efficacy of a hold-time at 10 °C for achieving a 5-log reduction of Escherichia coli O157:H7, Salmonella enterica, and Listeria monocytogenes in prepared mustard. Food Protection Trends 37:8-15. Jiang X, Morgan J, Doyle MP. Fate of Escherichia coli O157:H7 in manure-amended soil. 2002. Applied and Environmental Microbiology 68:2605–2609. Kaper, J.B., Nataro, J.P., Mobley, H.L. 2004. Pathogenic Escherichia coli. Nature Reviews Microbiology 2:123-140. Katz, S.E. 2012. The art of fermentation: an in-depth exploration of essential concepts and processes from around the world. White River Junction, VT: Chelsea Green Publishing. Kim, G., Breidt F, Fratamico P.M., Oh D. 2015. Acid resistance and molecular characterization of Escherichia coli O157:H7 and different Non-O157 shiga toxin-producing E. coli serogroups. Journal of Food Science 80(10):M2257-M2264. Kumar C.G. and Anand, S.K. 1998. Significance of microbial biofilms in food industry: a review. International Journal of Food Microbiology 42:9-27. LeJeune JT, Besser TE, Hancock DD. Cattle water troughs as reservoirs of Escherichia coli O157. 2001. Applied and Environmental Microbiology 67:3053–3057.

54
Lim, J.Y., Yoon, J.W., Hovde, C.J. 2010. A brief overview of Escherichia coli O157:H7 and its plasmid O157. Journal of Microbiology Biotechnology (20)1:5-14. Lu, H.J., F Breidt, and I Perez-Diaz. 2013. Development of an effective treatment for a 5-log reduction of Escherichia coli in refrigerated pickle products. Journal of Food Science 78:M264-M269. Mead, P.S., Slutsker, L., Dietz, V., McCaig, L.F., Bresee, J.S., Shapiro, C., Griffin, P.M., Tauxe, R.V. 1999. Food-related illnesses and death in the United States. Emerging Infectious Disease 5:607-625. Mehta, B.M., A Kamal-Eldin, and R Iwanski. 2012. Fermentation effects on food properties. CRC Press, Florida. Michino H, Araki K, Minami S, Takaya S, Sakai N, Miyazaki M, Ono A, Yanagawa H. Massive outbreak of Escherichia coli O157:H7 infection in school children in Sakai City, Japan, associated with consumption of white radish sprouts. 1999. American Journal of Epidemiology 150:787–796. National Food Lab. 2015. A guide to acidified foods: thermal processing, microbiology and regulatory compliance. Available at: http://www.thenfl.com/wp-content/uploads/A-Guide-To-Acidified-Foods-Thermal-Processing-Microbiology-and-Regulatory-Compliance.pdf. Accessed 20 February 2017. Pickle Packers International, Inc. 2017. Pickle and Pickled Pepper Fact Sheet. Available at: http://ilovepickles.org/book/export/html/219. Accessed 15 February 2017. Rangel, J.M., Sparling, P.H., Crowe, C., Griffin, P.M., Swerdlow, D.L. 2005. Epidemiology of Escherichia coli O157:H7 outbreaks, United States, 1982-2002. Emerging Infectious Disease 8:1409-1414. Riordan, D.R., Sapers, G.M., Hankinson, T.R., Magee M., Mattrazo, A.M., Annous, B.A. 2001. A study of U.S. orchards to identify potential sources of Escherichia coli O157:H7. Journal of Food Protection 64:1320-1327. Sapers, G.M. 2001. Efficacy of washing and sanitizing methods for disinfection of fresh fruit and vegetable products. Food Technology and Biotechnology 39:305-311. Thompson, J.S., Hodge D.S., Borczyk, A.A. 1990. Rapid biochemical test to identify verocytoxin-positive strains of Escherichia coli serotype O157. Journal of Clinical Microbiology 28:2165-2168.
55
United States Department of Agriculture (USDA). 2015. Complete guide to home canning, AIB No. 539. Washington, DC: National Institute of Food and Agriculture, United States Department of Agriculture. United States Department of Agriculture (USDA). 2011. Disposition/food safety: overview of food microbiology. Entry training for PHV. Available at: https://www.fsis.usda.gov/wps/wcm/connect/dcbfde80-3d65-4b21-9685-9d6676367aac/PHVt-Food_Microbiology.pdf?MOD=AJPERES. Accessed 11 January 2017. United States Department of Agriculture (USDA). 2008. Microbial data program data summaries, 2002-2006. Available at: https://www.ams.usda.gov/datasets/mdp/mdp-program-data-and-reports. Accessed 16 January 2017. Accessed 11 January 2017. United States Department of Agriculture (USDA). 2016. Research project: intervention strategies for controlling human pathogens associated with fermented and acidified vegetables. Available at: https://www.ars.usda.gov/research/project/?accnNo=430619. Accessed 20 February 2017. Wright, A.V., L. Axelsoon. 2012. Lactic acid bacteria: an introduction, p. 1–14. In S. Lahtinen, A.C. Ouwehand, S. Salminen, and A.V. Wright (ed.), Lactic acid bacteria microbiological and functional aspects, 4th ed. CRC Press Taylor and Francis, Boca Raton, FL. Yuk HG, Marshall DL. Adaptation of Escherichia coli O157:H7 to pH alters membrane lipid composition, verotoxin secretion, and resistance to simulated gastric fluid acid. 2004. Applied and Environmental Microbiology 70:3500–3505.