determinants of venezuela’s equilibrium real exchange … · underlying venezuela’s equilibrium...
TRANSCRIPT
WP/06/74
Determinants of Venezuela’s Equilibrium Real Exchange Rate
Juan Zalduendo


© 2006 International Monetary Fund WP/06/74
IMF Working Paper
Western Hemisphere Department
Determinants of Venezuela’s Equilibrium Real Exchange Rate
Prepared by Juan Zalduendo1
Authorized for distribution by Adrienne Cheasty
March 2006
Abstract
This Working Paper should not be reported as representing the views of the IMF. The views expressed in this Working Paper are those of the author(s) and do not necessarily represent those of the IMF or IMF policy. Working Papers describe research in progress by the author(s) and are published to elicit comments and to further debate.
The Venezuelan Bolivar is pegged to the U.S. dollar and supported by foreign exchange restrictions. To assess the appropriateness of the peg during the current period of high oil export earnings and the likely consequences of a liberalization, this paper attempts to disentangle the effects of oil prices from other factors underlying the equilibrium real exchange rate, and examines the role of foreign exchange controls by extending the application of a vector error correction (VEC) model to parallel market exchange rates. Several findings are worth noting. First, oil prices have indeed played a significant role in determining a time-varying equilibrium real exchange rate path. Second, oil prices are not theonly important determinant of the real effective exchange rate: declining productivity is also a key factor. Third, appreciation pressures are rising. Finally, the speed of convergence of a VEC model using parallel rather than official rates is higher, suggesting that the government has been able to maintain sharp deviations between the official and equilibrium rates becauseof Venezuela’s oil dependency and the concentration of oil income in government hands. JEL Classification Numbers: F31, F41 Keywords: Equilibrium real exchange rate, Venezuela Author(s) E-Mail Address: [email protected]
1 I wish to acknowledge the comments and suggestions received from Adrienne Cheasty and Rodolphe Blavy. The usual disclaimer applies.

- 2 -
Contents Page
I. Introduction ........................................................................................................................... 3 II. The Framework .................................................................................................................... 4
A. Determinants of Venezuela’s Equilibrium Real Exchange Rate ............................. 4 B. Methodology and Data ............................................................................................. 5 C. Estimation Results.................................................................................................. 10
III. Adjusting for the Parallel Exchange Market..................................................................... 12 IV. Assessment of Over- or Under-Valuation ........................................................................ 15 V. Conclusions........................................................................................................................ 16 Tables 1. Augmented Dickey Fuller Unit Root Tests .........................................................................10 2. Results from VEC Model using Official Exchange Rates...................................................11 3. Venezuela: History of Exchange Rate Regimes ..................................................................13 4. Results from VEC Model using Parallel Market Exchange Rates ......................................14 Figures 1. Real Effective Exchange Rates and Oil Prices ......................................................................6 2. Venezuela: REERs and the Determinants of the Equilibrium Real Exchange Rate..............9 3. Venezuela: Determinants of the Equilibrium Real Exchange Rate .....................................12 4. Venezuela: Parallel Market Equilibrium Real Exchange Rate ............................................14 5. Venezuela: Equilibrium Real Effective Exchange Rates at end-2004 (left panel) and Actual minus Equilibrium Real Effective Exchange Rates (right panel) ................................15 References................................................................................................................................17

- 3 -
I. INTRODUCTION
The Venezuelan Bolivar is pegged to the U.S. dollar and supported by comprehensive foreign exchange restrictions. The controls, together with the sharp rise in Venezuela’s oil revenues since 2002, could mean that Venezuela’s equilibrium real exchange rate has diverged from the observed rate. Many analysts have argued that Venezuela should take advantage of its comfortable external position to liberalize the exchange regime. However, before doing so, it would be important to have a clearer sense of the underlying equilibrium rate; and hence of the likely exchange rate movement in the wake of liberalization.
To this end, the paper’s main goal is to disentangle the effects of oil prices from other factors underlying Venezuela’s equilibrium real exchange rate, with a view to assessing the appropriateness of the current peg and the likely consequences of a liberalization. In this regard, it is generally accepted that commodity price increases lead to appreciation pressures in real effective exchange rates (REERs). Hence, a purchasing power parity framework, with a constant real exchange rate, is an inadequate guide to the impact of liberalization. Instead, the paper establishes that a time-varying equilibrium real exchange rate exists by estimating a vector error correction model (VEC) using official exchange rates and showing the importance of oil price developments in determining this rate—appreciation pressures build during oil price driven windfalls and subside as oil prices decline.
A second goal is to examine the role of the foreign exchange controls in supporting the official exchange rate. Venezuela has had numerous exchange rate regimes and foreign exchange controls over the past several decades, often with large premia between the official and parallel market exchange rates. To examine the role these arrangements may have played, the VEC model is reestimated using parallel market exchange rates.
Several results are worth highlighting. First, the paper provides evidence that, indeed, oil prices have played a significant role in determining a time-varying equilibrium real exchange rate path. Second, oil prices have not been the only important determinant of the REER: the estimated VEC models identify declining productivity as a key factor behind the depreciating trend in the real exchange rate of the past several decades. Third, the paper finds evidence that appreciation pressures are building up—and even more so given oil price increases in 2005. Finally, the speed of convergence of the real exchange rate to its equilibrium is higher if the VEC model is estimated using parallel (rather than official) market rates—suggesting that the government has been able to maintain sharp deviations between the official and the equilibrium rate because of the country’s oil dependency and the fact that oil export earnings are largely in government hands.
The paper is organized as follows. The next section describes the framework that applies to the calculation of Venezuela’s equilibrium real exchange rate. This is followed by the presentation of the results of the estimated VEC model, including robustness tests, and a section that applies a VEC model to the parallel market REER. Section IV presents an assessment of the adequacy of the current exchange rate level. Some conclusions follow.
- 4 -
II. THE FRAMEWORK
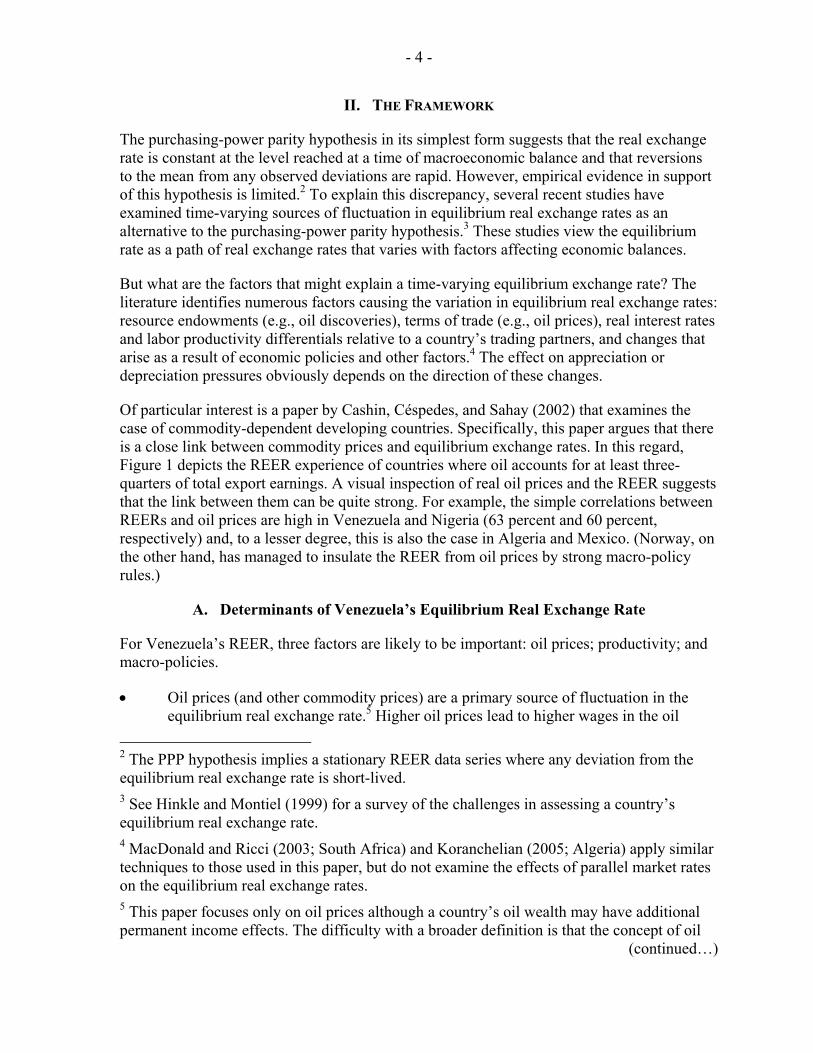
The purchasing-power parity hypothesis in its simplest form suggests that the real exchange rate is constant at the level reached at a time of macroeconomic balance and that reversions to the mean from any observed deviations are rapid. However, empirical evidence in support of this hypothesis is limited.2 To explain this discrepancy, several recent studies have examined time-varying sources of fluctuation in equilibrium real exchange rates as an alternative to the purchasing-power parity hypothesis.3 These studies view the equilibrium rate as a path of real exchange rates that varies with factors affecting economic balances.
But what are the factors that might explain a time-varying equilibrium exchange rate? The literature identifies numerous factors causing the variation in equilibrium real exchange rates: resource endowments (e.g., oil discoveries), terms of trade (e.g., oil prices), real interest rates and labor productivity differentials relative to a country’s trading partners, and changes that arise as a result of economic policies and other factors.4 The effect on appreciation or depreciation pressures obviously depends on the direction of these changes.
Of particular interest is a paper by Cashin, Céspedes, and Sahay (2002) that examines the case of commodity-dependent developing countries. Specifically, this paper argues that there is a close link between commodity prices and equilibrium exchange rates. In this regard, Figure 1 depicts the REER experience of countries where oil accounts for at least three-quarters of total export earnings. A visual inspection of real oil prices and the REER suggests that the link between them can be quite strong. For example, the simple correlations between REERs and oil prices are high in Venezuela and Nigeria (63 percent and 60 percent, respectively) and, to a lesser degree, this is also the case in Algeria and Mexico. (Norway, on the other hand, has managed to insulate the REER from oil prices by strong macro-policy rules.)
A. Determinants of Venezuela’s Equilibrium Real Exchange Rate
For Venezuela’s REER, three factors are likely to be important: oil prices; productivity; and macro-policies.
• Oil prices (and other commodity prices) are a primary source of fluctuation in the equilibrium real exchange rate.5 Higher oil prices lead to higher wages in the oil
2 The PPP hypothesis implies a stationary REER data series where any deviation from the equilibrium real exchange rate is short-lived. 3 See Hinkle and Montiel (1999) for a survey of the challenges in assessing a country’s equilibrium real exchange rate. 4 MacDonald and Ricci (2003; South Africa) and Koranchelian (2005; Algeria) apply similar techniques to those used in this paper, but do not examine the effects of parallel market rates on the equilibrium real exchange rates. 5 This paper focuses only on oil prices although a country’s oil wealth may have additional permanent income effects. The difficulty with a broader definition is that the concept of oil
(continued…)

- 5 -
sector and to increases in government spending, both of which in turn result in higher prices for nontradables—with a consequent real appreciation. Over time these developments siphon resources out of the non-oil export sectors. Numerous studies find such a link among countries highly dependent on one or two commodities for most of their foreign exchange earnings (see Samiei, 1998, and Cashin, Céspedes, and Sahay, 2002).
• Another potential source of systematic fluctuations in the equilibrium real exchange rate originates from developments in productivity differentials vis-à-vis Venezuela’s main trading partners—the Balassa-Samuelson effect. When a country registers an increase in productivity in the tradable sector vis-à-vis the nontradable sector, then, since the price of tradables is given, the higher wages in the tradable sector will increase the price of nontradables and the equilibrium real exchange rate. In contrast, depreciation pressures can emerge if the nontradable sector is the source of productivity gains relative to a country’s main trading partners.
• In Venezuela, policy choices are likely to have an important effect on the REER, not least because two-thirds of oil production is by a state enterprise and oil is a key source of government revenue. Thus, fiscal and monetary policies should help to explain the equilibrium real exchange rate. However, the direction of the impact of macro-policies is unclear and depends on what effect dominates.6
B. Methodology and Data
Against this background, the estimated VEC model can be represented by
REER = f(loil, lrgdpc, gexp, irate)
sector wealth is debatable. Oil wealth may be seen as unrelated to its location (i.e., as foreign exchange reserves or unexploited oil reserves), or it may be argued that greater uncertainty surrounds oil reserves. Those who argue that the effects on the economy can be limited by saving foreign exchange generated from oil exports implicitly believe that wealth location—above or below ground—is irrelevant. But this assumes zero Ricardian equivalence behavior among economic actors. In reality, the extent to which Ricardian factors play a role is likely to depend partly on past fiscal prudence and on whether oil sector developments are temporary or permanent. 6 For instance, a deterioration in the fiscal balance is unlikely to be matched by a one-to-one improvement in private savings and, given that net domestic demand increases, appreciation pressures will emerge. This depends, however, on the import content of the spending. Similarly, high real interest rates could attract resource inflows, thus strengthening the value of the currency. But higher rates could also discourage domestic demand, slowing down the rate of increase in the price of nontradables and depreciating the exchange rate.

- 6 -
Figure 1. Real Effective Exchange Rates and Oil Prices (Selected group of oil producing countries; 1990=100)
Source: International Financial Statistics , World Economic Outlook , and IMF staff estimates.1/ All charts are restricted to the vertical scale 0-300 to facilitate cross-country comparisons.
Algeria
REER
Oil (real)
0
50
100
150
200
250
300
1980 1983 1986 1989 1992 1995 1998 2001 2004
Correlation coefficient = 0.42
Mexico
REER
Oil (real)
0
50
100
150
200
250
300
1980 1983 1986 1989 1992 1995 1998 2001 2004
Correlation coefficient = 0.38
Nigeria
REER
Oil (real)
0
50
100
150
200
250
300
1980 1983 1986 1989 1992 1995 1998 2001 2004
Correlation coefficient = 0.60
Norway
REER
Oil (real)
0
50
100
150
200
250
300
1980 1983 1986 1989 1992 1995 1998 2001 2004
Correlation coefficient = 0.34
Syria
REER
Oil (real)
0
50
100
150
200
250
300
1980 1983 1986 1989 1992 1995 1998 2001 2004
Correlation coefficient = 0.16
Venezuela
REER
Oil (real)
0
50
100
150
200
250
300
1980 1983 1986 1989 1992 1995 1998 2001 2004
Correlation coefficient = 0.63

- 7 -
where the REER is the real effective exchange rate, loil is the U.K. Brent oil price deflated by the unit price of manufacturing exports (MUV) in logs, lrgdpc is the differential in PPP- based real GDP per capita between Venezuela and its main trading partners (in logs), gexp is government expenditure as a share of GDP, and irate is the differential in real interest rates, again vis-à-vis the country’s main trading partners. The inclusion of gexp and irate is motivated by the interest in assessing the role, if any, of macroeconomic policies.
The estimation uses annual data series on real effective exchange rates covering the period 1950–2004.7 This CPI-based REER is obtained from the IMF’s International Financial Statistics (IFS) database for 1980–2004 and the trade weights from this database are used in constructing the series backwards until 1950.8 Keeping trade weights constant is a rather strong assumption that is justified in this case by the fact that Venezuela’s economy has changed little over time.9 A REER based on parallel market exchange rates is constructed using primarily the Reinhart and Rogoff (2002) data on parallel market rates; namely, exchange rate premia are used to adjust the official REER to its more depreciated parallel market rate.
The weights used in the REER series are also used in the calculation of other series reflecting differences with trading partners. Specifically, they are used in productivity differentials which are proxied by PPP-based real GDP per capita.10 Data on industrial productivity (for both traded and nontraded sectors) would be preferable, but definitional differences across countries are a limitation to their use. Also, even though PPP-based real GDP per capita is second-best for the task at hand, it is the approach typically followed in the literature. These trade weights are also applied to real interest rate differentials.
7 An alternative would have been to use quarterly data. However, although quarterly data would provide more degrees of freedom, they are not readily available for some of the time series used. Moreover, they do not necessarily add much new information, as the primary interest is to examine long-term (rather than seasonal) factors that affect the equilibrium rate. 8 Several data sources were used, including the IMF’s International Financial Statistics and World Economic Outlook, the World Development Indicators prepared by the World Bank, and the Penn tables for the PPP-based GDP per capita data. 9 Both PPP-based GDP per capita, which averaged US$5,600 in 1950–54 and US$5,300 in 2000–04, and the share of trade with the U.S., Venezuela’s largest trading partner, have remained largely unchanged. In addition, the oil share in total exports (about 85-90 percent) is quite stable, as is also the share of the oil sector in total GDP—currently the sector accounts for 20 percent of GDP, compared to about 25 percent in the early 1950s. 10 The largest trade weights in the IFS database (accounting for 88 percent of Venezuela’s total trade) correspond to: United States, 37 percent; Germany, 10 percent; Italy, 8 percent; Japan, 8 percent; France, 6 percent; United Kingdom, 5 percent; Brazil, 4 percent; Canada, 4 percent; Spain, 3 percent; and Belgium, 3 percent.
- 8 -
The estimation includes the real oil price—the spot U.K. Brent price of oil deflated by the MUV11—and government expenditures as a share of GDP. Venezuela’s high dependency on oil limits the usefulness of focusing on fiscal balances unless non-oil primary balance data were available for the full period covered in the paper, which is not the case. Hence, we opt to use central government expenditure mindful of its limitations—such as the fact that such a fiscal variable neglects developments in tax revenue. Though the government spending series is not immune to problems (since spending is also affected by developments in the oil sector), focusing on central government partially diminishes the links to the oil sector.12
The time series discussed are represented in Figure 2 together with their “smoothed versions”, which are derived by applying a Hodrick-Prescott filter to each data series—the filtered series are identified by the suffix HP. The purpose of applying an HP filter is to control for short-run fluctuations. Several aspects of these charts are worth highlighting.
• Figure 2, panels A and B, portray many instances of sharp differences between the official and the parallel market rate and reveal an increase in volatility since 1980.
• The volatility of interest rate differentials has also increased (Figure 2, panel C); namely, sharp swings in interest differentials have taken place since the mid-1980s.
• Oil prices have varied sharply since the 1970s—Figure 2, panel D.
• Government expenditure (Figure 2, panel E) mirrors to some degree developments in oil prices. For example, oil price developments in the 1970s and 1990s have a quasi-contemporaneous effect on spending. Although a more definite assessment would require a long series of non-oil related government spending and GDP, which are not available, this pro-cyclical history suggests that fiscal policy might not play the smoothing role that would be desirable in the present context of high oil prices.
• Finally, and perhaps most importantly, there has been a striking and steady decline in Venezuela’s productivity differentials (i.e., relative to main trading partners; Figure 2, panel F). In fact, while Venezuela’s income per capita was about 50 percent of U.S. per capita income in the early 1950s, this has now declined to 12½ percent.13
11 Venezuela’s oil sells for 90 percent of the U.K. Brent spot price; this share has been stable. 12 A large share of oil resources is spent outside the central government budget. Besides its own spending, the state oil company finances some social programs directly. 13 Growth per capita (measured in PPP terms) peaked in the 1950s, but has been declining ever since. Specifically, per capita growth rates since the 1970s have been negative, declining at an annual average of about (i) 2 percent in the 1970-89 period; (ii) 1 percent during the 1990s; and (iii) ¼ percent in 2000-04. A similar pattern is observed among other trading partners and is not atypical of commodity-dependent countries—Koranchelian, and MacDonald and Ricci, identify similar declines in Algeria and South Africa, respectively.

- 9 -
Figure 2. Venezuela: REERs and the Determinants of the Equilibrium Real Exchange Rate 1/
2.8
3.2
3.6
4.0
4.4
4.8
5.2
50 55 60 65 70 75 80 85 90 95 00
Ln OIL (real) Ln OIL HP
3.0
3.5
4.0
4.5
5.0
5.5
6.0
50 55 60 65 70 75 80 85 90 95 00
Ln REER (official market rate)Ln REER HP
0.0
0.4
0.8
1.2
1.6
2.0
50 55 60 65 70 75 80 85 90 95 00
Ln RGDP per capita (differential)Ln RGDP per capita HP
-40
-30
-20
-10
0
10
20
30
50 55 60 65 70 75 80 85 90 95 00
Real interest rate (differential; in %)Real interest rate HP
3.0
3.5
4.0
4.5
5.0
5.5
6.0
50 55 60 65 70 75 80 85 90 95 00
Ln REER (parallel market rate)Ln REER HP
14
16
18
20
22
24
26
28
30
50 55 60 65 70 75 80 85 90 95 00
Govt. expenditure (in % of GDP)Govt. expenditure HP
Source: Penn tables, World Economic Outlook, and IMF staff estimates.
1/ Actual data is smoothed using a HP filter; the suffix HP is added to the name of each filtered series.Panels A, B, D, and F are logs series.
Panel A: Official market rate Panel B: Parallel market rate
Panel C: Real interest rate differentials Panel D: Real oil prices
Panel E: Central government spending Panel F: Productivity differentials
- 10 -
In sum, most of the variables reflect a high degree of volatility. This has been the backdrop since the 1980s for Venezuela’s uneven economic performance and worsening productivity.
C. Estimation Results
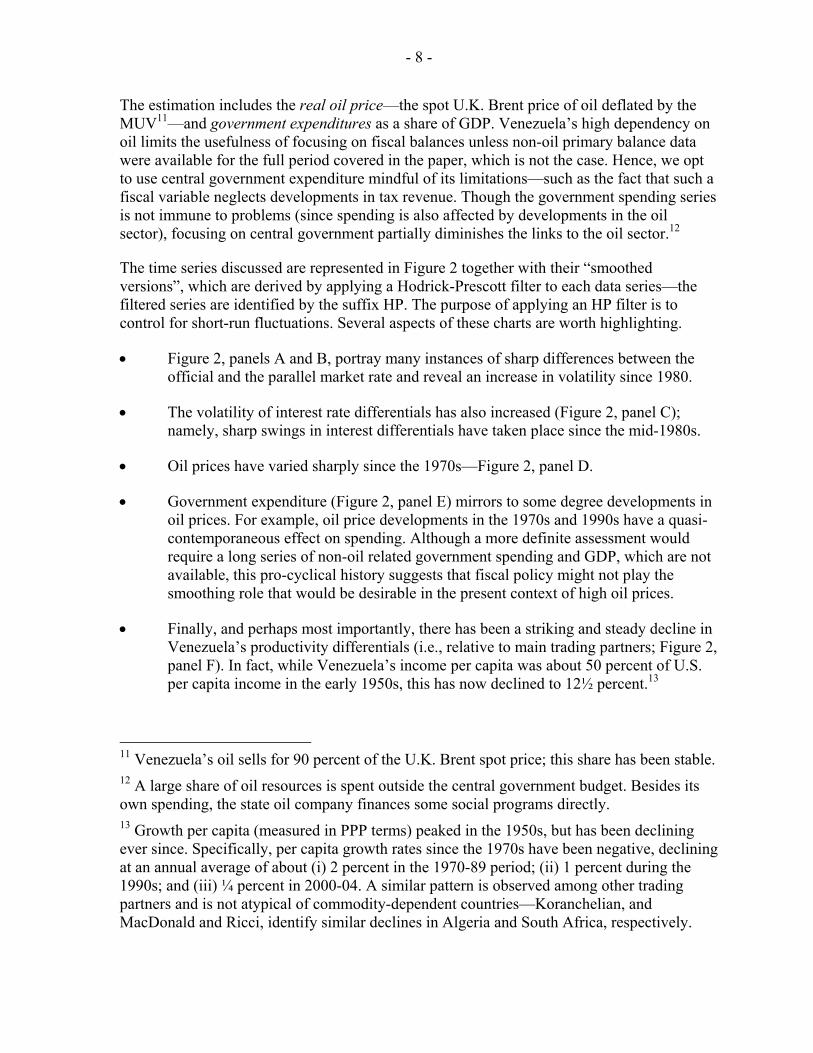
As in other applications of VEC models, the first step is to test for the presence of unit roots in the macroeconomic series being examined. Augmented Dickey-Fuller unit tests for stationarity are calculated and reported in Table 1. The lag structure was determined using the Schwarz criterion. The main data series are found to be (i) nonstationary in levels (have unit roots) and (ii) stationary in first differences.
Table 1. Augmented Dickey Fuller Unit Root Tests 1/ (1950–2004; annual data)
Level Firstseries difference
seriest-ADF t-ADF
REER official market rate (in logs; LREER OFF MKT) -1.16 -6.71 ***REER parallel market rate (in logs; LREER PAR MKT) -1.55 -6.04 ***Real oil prices (in logs; LOIL) -1.24 -7.55 ***Real GDP per capita differentials (in logs; LRGDPC) 0.64 -5.63 ***Government expenditures as a share of GDP (GEXP) -2.27 -6.99 ***Real interest rate differentials (IRATE) -2.80 * -7.20 ***
1/ * and *** denote rejection at, respectively, 10 and 1 percent level. Lags chosen using Schwarz criterion.
The results of the VEC model (Table 2, regression 1) confirm the existence of a cointegrating relationship between the REER and the specified determinants of Venezuela’s equilibrium real exchange rate. Specifically, the trace and maximum eigenvalue statistics confirm the existence of at most one cointegrating vector. The coefficient estimates for regression 1 suggest that the REER appreciates as oil prices increase. Venezuela’s productivity differentials also have a direct effect on the REER, in this instance a reverse Balassa-Samuelson effect—that is, there is a steady worsening in productivity differentials rather than the expected improvement owing to catch-up growth effects. Increases in real interest rate differentials also appear to be linked to appreciation pressures. Finally, government spending is inversely related to the REER, but the estimated coefficient is not statistically significant.14
A specification excluding government expenditures is presented in regression 2. The results of this VEC estimation suggest that:
14 The usual tests for VEC models are conducted. The null hypothesis on the normality of the residuals (Jarque-Bera) is rejected at the 1 percent level owing to excess kurtosis—that is, the VEC results are not affected (Paruolo, 1997). The test for the lag structure supports the use of three lags; specifically, adding another lag results in the rejection of joint significance tests.

- 11 -
• a 1 percent increase in oil prices has almost a one-to-one effect on the real effective exchange rate (i.e., a 1¼ percent appreciation);
• a 1 percent worsening in Venezuela’s productivity differential has more than a one-to-one effect on the exchange rate (i.e., a 1½ percent depreciation effect); and
• a 1 percent increase in real interest rate differentials leads to real appreciation pressures of just over 10 percent—this is higher than in studies for other countries.15
However, although the cointegrating coefficient is statistically significant, the speed of adjustment of the official rate to deviations from the equilibrium rate is slow—specifically, it takes a decade to reduce by half any deviation between the official and the equilibrium rate.16 This slow adjustment suggests that the official rate can remain exceptionally far from the equilibrium real exchange rate in Venezuela.
Table 2. Results from VEC Model using Official Exchange Rates Regression 1 Regression 2
1. Number of cointegrating vectors 1 1
Trace statistic 98.7 *** 75.1 ***Maximum eigenvalue statistic 59.4 *** 54.0 ***
2. Estimates of the cointegrating relationship
LREER OFF MKT (-1) 1 1
LOIL (-1) -1.298 *** -1.022 ***(-3.80) (-4.26)
LRGDPC (-1) -1.572 *** -1.407 ***(-5.34) (-5.19)
GEXP (-1) 0.040(0.68)
IRATE (-1) -0.144 *** -0.138 ***(-8.85) (-8.76)
C 0.613 0.233
3. Estimates of the speed of adjustment based on the
cointegrating equation for the REER 0.049 *** 0.054 ***(3.80) (2.68)
4. Time required to adjust by 50 percent any deviationfrom the equilibrium REER 13.8 12.5
1/ t-statistics between parethesis.
15 MacDonald and Ricci find that a 1 percentage point increase in real interest rates is associated with an appreciation of South Africa’s REER of about 4 percent. 16 The cointegrating equation provides a means to assess the speed of adjustment; namely, the time in years, t, necessary to reduce the initial deviation from equilibrium can be calculated by estimating t(1 ) (1 )=− γ −δ , where γ is the estimated cointegrating coefficient and δ is the share of the catch-up being targeted (e.g., 0.5 for a half-life reduction).

- 12 -
From the long-run relationship described in Table 2, an equilibrium real exchange rate can be calculated. This is done by applying the coefficient estimates of the cointegrating relationship on the determinants of the equilibrium real exchange rate. To disregard variations that arise from the short-run fluctuations in these determinants, the HP-filtered series of each of these determinants is used to calculate the equilibrium rate. Two conclusions are derived. First, the deterioration in productivity differentials is an important factor in explaining the downward trend in Venezuela’s REER (Figure 3, left panel). Second, this downward trend has been interrupted twice. In both cases these interruptions occurred more or less contemporaneously with sharp changes in oil prices; namely, the effect of oil price increases in the mid-1970s and mid-1990s on the equilibrium rate leads to an upward (albeit temporary) trend in the equilibrium real exchange rate (Figure 3, right panel).17
Figure 3. Venezuela: Determinants of the Equilibrium Real Exchange Rate (Based on the official REER)
0
50
100
150
200
250
300
350
400
1950 1960 1970 1980 1990 20000
1
2
3
4
5
6REER (official rate); leftaxis
REER (equilibrium rate;official); left axis
Real GDP per capita(differentials); right axis
0
50
100
150
200
250
300
350
400
1950 1960 1970 1980 1990 20000
50
100
150
200
250REER (official rate); left axis
REER (equilibrium rate;official); left axis
Oil real; right axis
Source: World Economic Outlook and IMF staff estimates.
III. ADJUSTING FOR THE PARALLEL EXCHANGE MARKET
The main concern with the VEC model estimation above is the slow speed of adjustment of the official exchange rate to deviations from its equilibrium rate. Venezuela has had numerous instances of prolonged and large differences between the official and the parallel market exchange rates. These differences were, presumably, made possible by the government’s control over oil export earnings and over internal and external trade.
17 Figure 3 also shows that in certain periods the differences between the official and the equilibrium rate are more marked. To eliminate the possible effects of outliers on the estimation results, a dummy variable can be added that takes a value of one whenever the equilibrium exchange rate deviates from the official rate by two or more standard deviations. Three years during the mid-1980s meet this criteria. The estimation of the VEC model including this dummy (not shown) leads only to minor changes in the estimated coefficients, suggesting that the model is not driven by the effects of data outliers.

- 13 -
To assess if taking Venezuela’s multiple foreign exchange regime experiences into account could help explain the time-varying equilibrium real exchange rate path, a VEC model is applied to the same dataset except that the REER exchange rate data are adjusted by the parallel market exchange rate premia compiled by Reinhart and Rogoff—Table 3 briefly describes the history of Venezuela’s foreign exchange arrangements.
Table 3. Venezuela: History of Exchange Rate Regimes 1/ Period Classification: Comments Parallel market
premium 2/July 23, 1941–July 1, 1976 Peg to U.S. Dollar There are multiple exchange rates. 1.09July 1, 1976–February 28, 1983
Peg to U.S. Dollar/Dual Market Up until lawe 1982 free market premia is in single digits.
1.02
February 28, 1983–November 1986
Managed floating/Parallel market There are multiple exchange rates officially linked to the U.S. Dollar. In July 1983 parallel market premia rose to 319%.
2.48
December 1986–March 13, 1989
Freely falling/Managed floating There are multiple exchange rates. Parallel market premia are consistently above 100%.
2.49
March 13, 1989–March 1990 Freely falling/Managed floating 1.12April 1990–September 1992 Managed floating 1.09October 1992–May 4, 1994 Freely falling/Managed floating 1.05May 4, 1994–April 22, 1996 Freely falling/Dual market/De facto
crawling band around U.S. DollarBand width is +/-5%. Parallel market premium jumped to 100% ion November 1995.
1.26
April 22, 1996–July 8, 1996 Freely falling/De facto crawling band around U.S. Dollar
Band width is +/-5%. 1.01
July 8, 1996–July 1997 Pre announced crawling band around U.S. Dollar/Freely falling
Official band is +/- 7.5%, de facto band is +/-2%. Parallel market premium declines to single digits during this period.
1.01
AugU.S.t 1997–January 2002 Pre announced crawling band around U.S. Dollar
Official band is +/- 7.5%, de facto band is +/-2%. 1.01
February 2002–February 2003 Managed floating 1.06
Since February 2003 Peg to U.S. Dollar Step devaluations every year and numeroU.S. controls of FX transactions and prices.
1.43
Source: Reinhart and Rogoff (2002) and other sources.
1/ Reference currency is the U.S. Dollar.2/ The parallel market premium is defined as the parallel market exchange rate divided the official exchange rate. Between 1960 and 1998 it is based on a database compiled by Reinhart and Rogoff. Data for the 1950s and since the late 1990s is based on other sources. The results are encouraging (Table 4):
• Coefficient estimates are smaller, but the conclusions remain largely unchanged—oil price increases cause an appreciation of the equilibrium exchange rate (by ½ percent for every 1 percent rise in oil prices) and increases in productivity and real interest rate differentials are also associated with appreciation pressures (albeit slightly smaller than those reported in Table 2).
• The speed of adjustment is higher than in the model based on official exchange rates—about 2.5 years compared to over a decade when official rates are used—and in line with those in other countries; see, for example, MacDonald and Ricci, and Cashin et al. The coefficient of the cointegrating equation is statistically significant.
As before, the equilibrium real exchange rate can be calculated by applying the coefficient estimates of the cointegrating relationship on the series for each determinant of the equilibrium real exchange rate. Once again the Hodrick-Prescott filter is used to abstract from short-run fluctuations in these determinants. The conclusions from Figure 4 are in line with those derived when using official REERs. Specifically, periods of oil price increases

- 14 -
have an appreciation effect in the parallel-rate model, though this effect appears to be less marked than when official REERs are used—that is, the swings in the equilibrium rate are less abrupt. In addition, there is a steady decline in the REER that can again be traced to the deterioration in Venezuela’s productivity differentials. This deterioration is quite intriguing and, while this paper does not attempt to explain its source, it may be noted that the decline has occurred against the backdrop of increased volatility in various spheres of the economy.
Table 4. Results from VEC Model using Parallel Market Exchange Rates 1/ 1. Number of cointegrating vectors 1 5. Normality Test df Prob.
Trace statistic 86.5 *** Skewness 4 0.018Maximum eigenvalue statistic 60.2 *** Kurtosis 4 0.001
Normality 8 0.0002. Estimates of the cointegrating relationship
LREER PARALLEL MKT (-1) 1 6. VEC lag exclusion Wald testsLOIL (-1) -0.442 *** Dlag1 Statistic 58.0
(-3.95) Prob. 0.000LRGDPC (-1) -1.159 *** Dlag2 Statistic 67.1
(-7.85) Prob. 0.000IRATE (-1) -0.077 *** Dlag3 Statistic 49.6
(-13.54) Prob. 0.001C -2.059 df 25
3. Estimates of the speed of adjustment based on the cointegrating equation for the REER 0.243 **
(2.31)4. Time required to adjust by 50 percent any deviation
from the equilibrium REER that may exist 2.51/ t-statistics between parethesis.
Figure 4. Venezuela: Parallel Market Equilibrium Real Exchange Rate
0
50
100
150
200
250
300
50 55 60 65 70 75 80 85 90 95 00
REER EQUILIBRIUM (PAR. MKT RATE)REER PARALLEL (PAR.) MARKET
Source: IMF staff estimates.

- 15 -
It is also worth highlighting that the actual parallel and equilibrium rates in Figure 4 appear to be a closer match than was the case in Figure 3, reflecting the quicker adjustment of the parallel market towards its equilibrium. This suggests that financial markets incorporate information on economic developments—for example, oil price changes—more rapidly than is the case in the official market. It also supports the conjecture that the government has been able to maintain sharp deviations between the official and the equilibrium rate because of (i) the country’s oil dependency and the fact that these resources are largely in government hands, (ii) the important role played by government in different spheres of domestic and external trade, and (iii) the effectiveness of foreign exchange controls.
IV. ASSESSMENT OF OVER- OR UNDER-VALUATION
The next step is to assess the extent of over- or under-valuation of the Bolivar. The panel on the left of Figure 5 depicts the official and parallel market exchange rates at end-2004 (horizontal lines) and the equilibrium real exchange rates derived from the official and the parallel market VEC models. It is worth noting that both the parallel and official market equilibrium rates lie, as of end-2004, above their corresponding actual rates. Hence, while the assessment of overvaluation depends on the VEC model that is judged to be more adequate—the official or the parallel market VEC model—in both cases there is some under-valuation.
Figure 5. Venezuela: Equilibrium Real Effective Exchange Rates at end-2004 (left panel) and Actual minus Equilibrium Real Effective Exchange Rates (right panel) 1/
0
50
100
150
200
250
300
350
400
50 55 60 65 70 75 80 85 90 95 00
REER EQ. PAR. MKT.REER EQ. OFF.
REER OFF. 2004REER PAR. MKT. 2004
-50
0
50
100
150
50 55 60 65 70 75 80 85 90 95 00
OFFICIAL RATE PAR. MKT. RATE
UNDERVALUATION
OVERVALUATION
1/ The left panel depicts the equlibrium exchange rates based on regression 2 for the official rate and the regression in Table 4 for the parallelmarket rate. This panel also depicts the 2004 actual real effective exchange rates (average official and average parallel market rates). Theright panel shows the over- and under-valuations of the official and the parallel market rates relative to their own equilbrium levels.
Source: IMF staff estimates.
Relatedly, the panel on the right depicts the extent of over-valuation (above zero in the vertical scale; i.e., depreciation pressures) or under-valuation (below zero in the vertical
- 16 -
scale; i.e., appreciation pressures) that is determined by the VEC models, in each case as a share of the corresponding equilibrium rate.
What can be concluded regarding the level of the equilibrium exchange rate? Given the better fit of the parallel market VEC model because of its quicker speed of adjustment, it can be argued that the shift to a floating exchange rate regime in 2004 would have left a fully market-determined rate situated somewhere between the official and the parallel rates. Moreover, since events in 2005 have been on the upside (activity remained buoyant, which presumably also implies a pick-up in productivity, and oil prices were 42 percent higher, on average, than in 2004), real appreciation pressures are likely to have grown even further.
V. CONCLUSIONS
This paper finds evidence that Venezuela has a time-varying equilibrium real exchange rate. Specifically, increases in oil prices are associated with the emergence of appreciation pressures (and vice versa for price declines). There is also, however, a trend decline in the equilibrium rate that appears to be explained by depreciating pressures arising from the sharp decline in productivity differentials recorded by the Venezuelan economy, against the backdrop of a marked increase in economic volatility. These declines represent a sort of reverse Balassa-Samuelson effect, and are not consistent with the hoped-for catch-up effects underlying neoclassical growth theory.
As regards the current equilibrium real exchange rate, the paper argues that the VEC modeling approach provides more sensible results when applied to parallel market exchange rates. A VEC model applied to official REER rates indicates the equilibrium real exchange rate is more appreciated than the official rate. The speed of adjustment of this VEC model is too slow, however, suggesting that the government’s comprehensive set of foreign exchange restrictions enable sharp and persistent departures from the equilibrium rate. To assess the possible effect of these restrictions, the equilibrium real exchange rate was reestimated using parallel market rates. These results suggest that the parallel market rate is 15 percent more appreciated than its equilibrium rate (but still below the official rate) and that the speed of adjustment to this equilibrium is much higher. In sum, the paper finds some degree of undervaluation was evident at end-2004. Moreover, given that developments since 2004 are on the upside (non-oil activity remains buoyant and oil prices are, on average, 42 percent higher than in 2004), real appreciation pressures are likely to have built up even further during 2005. Unsurprisingly, the parallel market rate at end-2005 has a smaller premium than in 2004.
The paper’s results also have implications for the choice of exchange rate regime. Since oil price increases are likely to generate appreciation pressures, the current peg regime needs to be reassessed in light of this long-run determinant of the equilibrium rate. If recent oil price increases are here for the long haul, then the current peg might have to rely excessively on monetary policy to restrain inflationary pressures and, ultimately, is likely to fail in preventing an appreciation of the real exchange rate.

- 17 -
References
Cashin, P., L. Céspedes, and R. Sahay, 2002, “Keynes, Cocoa, and Copper: In Search of Commodity Currencies,” IMF Working Paper 02/223 (Washington: International Monetary Fund).
Corden, W., 1984, “Booming Economic Sector and Dutch Disease Economics: Survey and Consolidation,” Oxford Economic Papers, Vol. 36, pp. 359–80.
Hinkle, L., and P. Montiel, 1999, Exchange Rate Misalignment: Concepts and Measurement for Developing Countries (New York: Oxford University Press).
Koranchelian, T., 2005, “The Equilibrium Real Exchange Rate in a Commodity Exporting Country: Algeria’s Experience,” IMF Working Paper 05/135 (Washington: International Monetary Fund).
MacDonald, R., and L. Ricci, 2003, “Estimation of the Equilibrium Real Exchange Rate for South Africa,” IMF Working Paper 03/44 (Washington: International Monetary Fund).
Paruolo, P., 1997, “Asymptotic Inference on the Moving Average Impact Matrix in Cointegrated I(1) VAR Systems,” Econometric Theory, Vol. 13, pp. 79–118.
Reinhart, C., and K. Rogoff, 2002, “The Modern History of Exchange Rate Arrangements: A Reinterpretation,” NBER Working Paper Series 8963 (Cambridge, Massachusetts: National Bureau of Economic Research).
Samiei, H., 1998, “Determinants of the Real Exchange Rate in Norway: Does Policy Matter?” Norway—Selected Issues (Washington: International Monetary Fund).