determinants of regional headquarters of mncs in …determinants of regional headquarters of mncs in...
TRANSCRIPT

Determinants of
Regional Headquarters of MNCs
in Asia
Taiki IIDANI
Tokyo University of Foreign Studies

Introduction 1
・Foreign Direct Investment
An investment made to acquire lasting interest in
enterprises operating outside of the economy of the
investor:
cross border mergers and acquisitions, establishment of
corporations, acquiring real estates, etc…
What’s FDI?

Introduction 2
・Mergers and Acquisitions (M&A)
Combining of different companies that can help an
enterprise grow rapidly in its sector.
Often occur in service, IT, finance sectors.
・Greenfield Investment (GFI)
Establishing of new companies abroad. Investor obtains
their labors, facilities and clients all by themselves.
Often occur in manufacturing sector.
What’s FDI?

Introduction 3
FDI trend:
The whole world
Introduction 4
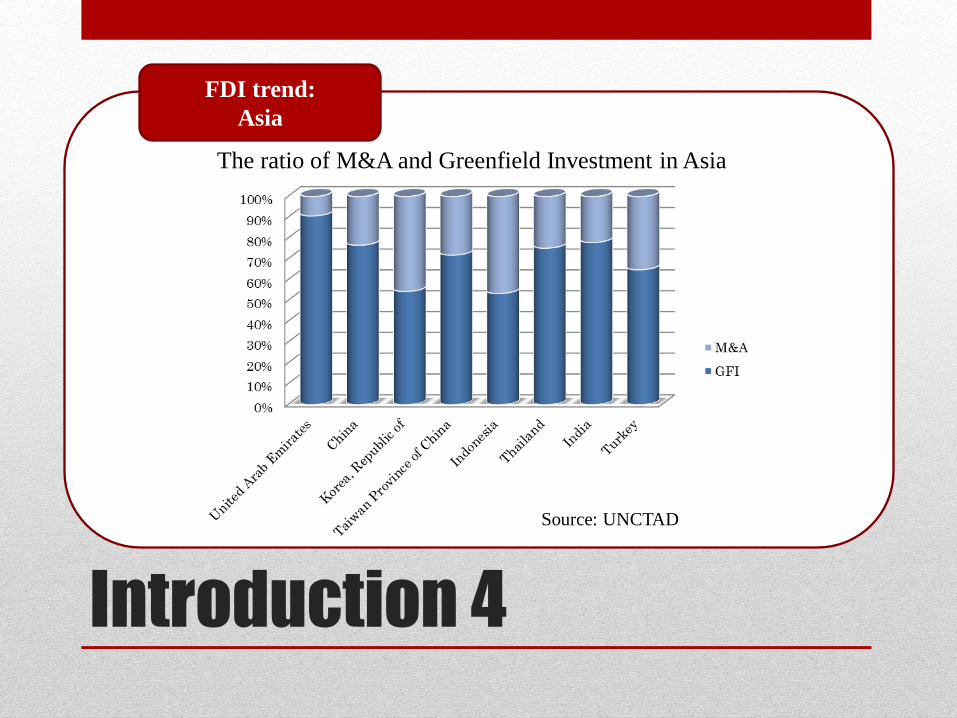
FDI trend:
Asia
The ratio of M&A and Greenfield Investment in Asia
Source: UNCTAD
Introduction 5
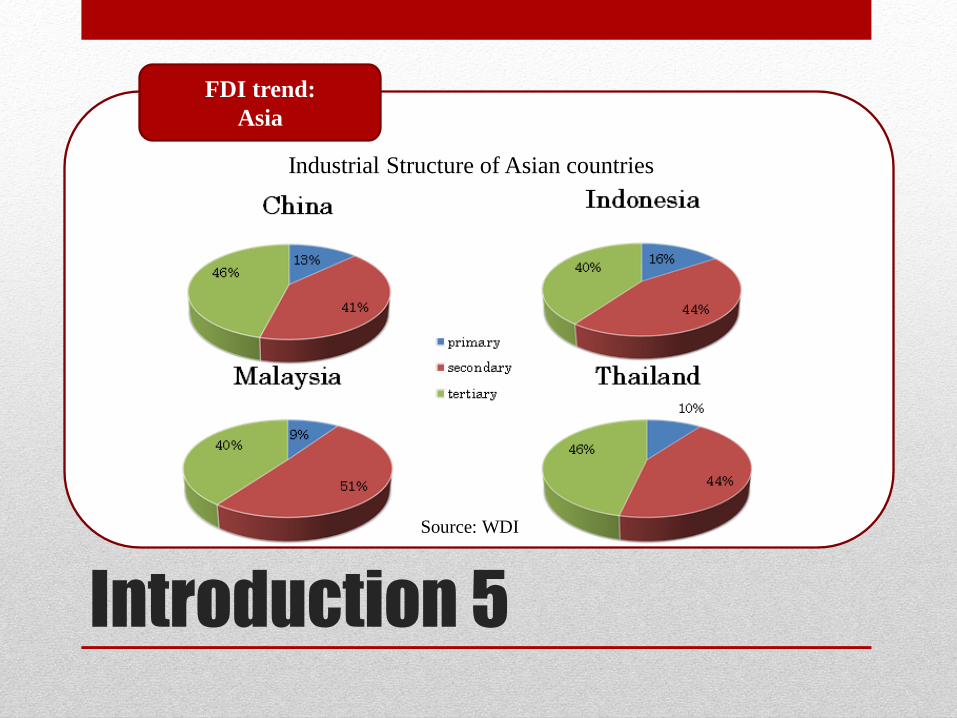
FDI trend:
Asia
Industrial Structure of Asian countries
Source: WDI

Introduction 6
FDI trend:
Asia
Industrial Structure of Hong Kong and Singapore
Source: WDI

Introduction 7
FDI trend:
Asia
The ratio of M&A and Greenfield Investment
in Hong Kong and Singapore
Source: UNCTAD
Introduction 8
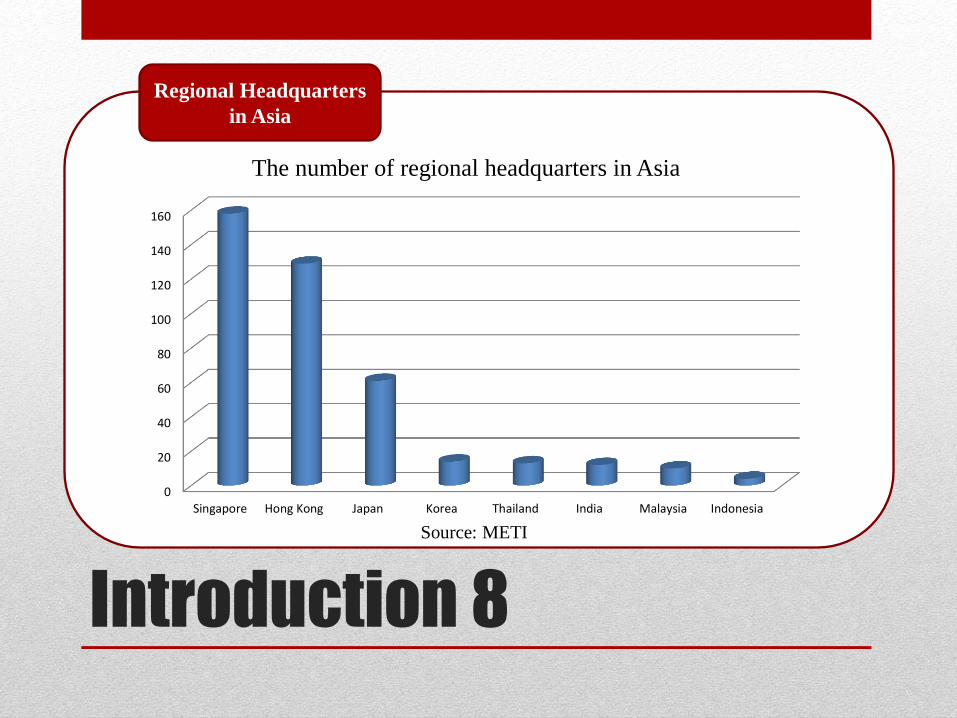
Regional Headquarters
in Asia
0
20
40
60
80
100
120
140
160
Singapore Hong Kong Japan Korea Thailand India Malaysia Indonesia
The number of regional headquarters in Asia
Source: METI

Introduction 9
An institution established to integrate decision-making of
its subsidiary companies existing in the region.
What’s RHQs?
parent
RHQ
subsidiary
subsidiary
subsidiary

Introduction 10
For Investor:
Promote efficient management of its subsidiary companies.
-capital transfer
-decision making
For Host:
Jobs for higher educated people are created.
Business information are concentrated.
Merits for
Investor & Host
Introduction 11
What aspects of Asian countries determine the inflow of
RHQs?
METI (2010):
As determinants of RHQs, 3 aspects play important roles:
education, infrastructure, tax rate.
Question &
Previous works

Introduction 12
・Testify the theory of METI (2010) quantitatively.
・Sectoral analysis
・Newest data
Value Added

Model & Method 1
i … host country
t … time
RHQ … the number of regional
headquarters flowing to country i
1. All industory
2. Manufacturing sector
3. Service sector
GDP … Gross Domestic Product
TAX … corporate tax rate
EDUT … the ratio of tertiary
educated workers
EDUL … the ratio of English
speaker
INFC … the number of containers
carried from the port
INFA … the number of airport
INFR … Road density (km of road
per 100 sq. km of land area)
Model
RHQit = β0 + β1lnGDPit + β2TAXit + β3EDUTit + β4EDULit +
β5INFCit + β6INFAit + β7INFRit + εit

Model & Method 2
Countries:
Japan, Hong Kong, Korea, India, Thailand, Malaysia, Singapore,
Indonesia
Period:
1990~2009
Sector:
1. All industry 2. Manufacturing sector 3. Service sector
Targets

Results 1
All industry
Dependent variable: HQ
Independent
variables
Estimate t-value Pr(>|t|)
(Intercept) 37.065744 0.4622 0.64810
lnGDP -0.330767 -0.0780 0.93845
TAX -0.767855 -2.0168 0.05504
EDUt 0.707910 2.2787 0.03188
EDUl 0.192671 0.8923 0.38108
lnINFc -0.338868 -0.1139 0.91030
lnINFa -0.065252 -0.0100 0.99207
INFr 0.041060 1.2198 0.23440
Adj. R-Squared : 0.62801
Observations : 32
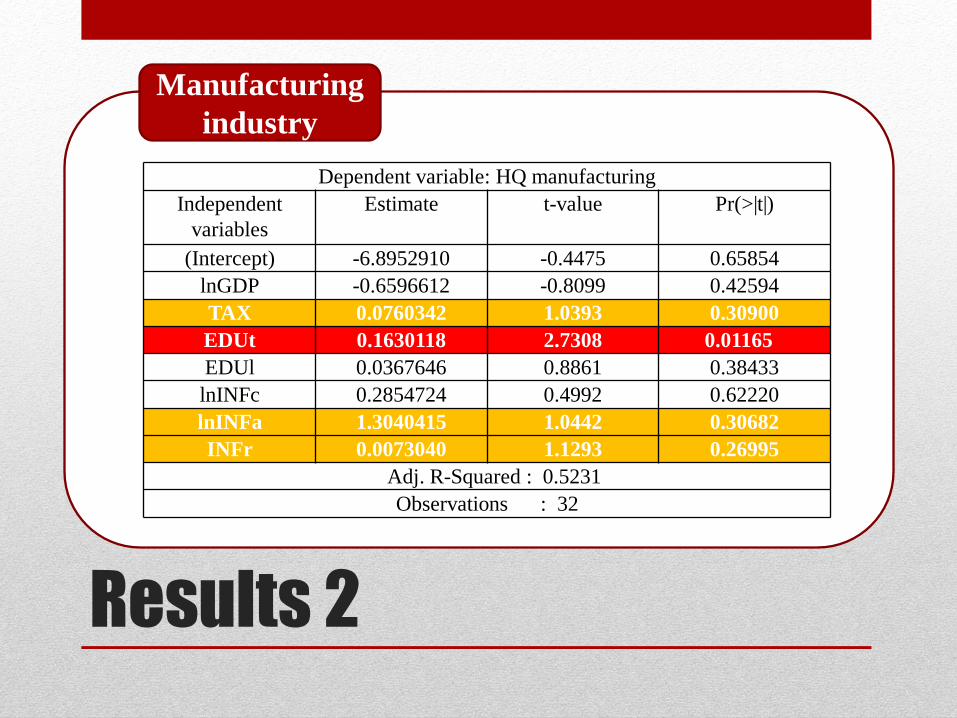
Results 2
Manufacturing
industry
Dependent variable: HQ manufacturing
Independent
variables
Estimate t-value Pr(>|t|)
(Intercept) -6.8952910 -0.4475 0.65854
lnGDP -0.6596612 -0.8099 0.42594
TAX 0.0760342 1.0393 0.30900
EDUt 0.1630118 2.7308 0.01165
EDUl 0.0367646 0.8861 0.38433
lnINFc 0.2854724 0.4992 0.62220
lnINFa 1.3040415 1.0442 0.30682
INFr 0.0073040 1.1293 0.26995
Adj. R-Squared : 0.5231
Observations : 32

Results 3
Service
Industry
Dependent variable: HQ service
Independent
variables
Estimate t-value Pr(>|t|)
(Intercept) 47.209069 0.6308 0.53414
lnGDP 0.143383 0.0362 0.97139
TAX -0.851661 -2.3969 0.02468
EDUt 0.571312 1.9705 0.06042
EDUl 0.163840 0.8131 0.42417
lnINFc -0.915405 -0.3296 0.74459
lnINFa -0.886142 -0.1461 0.88507
INFr 0.033648 1.0711 0.29479
Adj. R-Squared : 0.61981
Observations : 32
Results 4
・Consistently, TAX has significant negative correlation and
EDUT has significant positive correlation with dependent
variables.
・EDUT in service sector has more strong correlation rather
than that of manufacturing.
・INFR and INFA in manufacturing sector have more strong
correlation rather than that of service.
Speculation
Concluding Remarks 1
TAX:
Low rate of corporate tax can attract RHQs strongly, because
parent companies can cut tax cost largely.
Countries whose tax rates are high can catch up with low-taxed
countries by introducing special tax measures.
EDUCATION:
Highly educated workers are necessary for managing RHQs and
whole subsidiary companies in the region. Rather than workers
who speak English, those with higher academic degree are
required.
Conclusion
Concluding Remarks 2
INFRASTRUCTURE:
Basically RHQs undertake the role of management, thus the
ability of transporting containers does not have any effects.
RHQs tend to be placed close to the major market, thus road
needs to be provided sufficiently which enables easy access to
the market from RHQs.
Conclusion

Data
RHQ Ministry of Economy, Trade and Industry
GDP WDI, World Bank
TAX WDI, World Bank
JETRO
JBIC
EDUT WDI, World Bank
EDUL WDI, World Bank
INFC WDI, World Bank
INFA WDI, World Bank
INFR WDI, World Bank
Data

References
・TRENDS AND DRIVERS OF BILATERAL FDI FLOWS IN DEVELOPING
ASIA:EXTENT OF DE FACTO INTEGRATION (Hattari and Rajan, 2008)
・Taxes and agglomeration: determinants of FDI in an enlarged European Union
(Åsa and Karin, 2009)
・Institutional Determinants of Foreign Direct Investment
(Agnès, Maylis and Mayer, 2005)
・The Determinants of Bilateral FDI: Is Asia Different?
(Petri, 2010)
・Determinants of bilateral foreing direct investment flows in the OECD, with a closer
look at the former coummunist countries (Martín and Francisco, 2000)
・What Determines Inward FDI in China? -An empirical study using firm-level data
(Bin, 2013)
・The Macroeconomic Determinants of Cross Border Mergers and Acquisitions and
Greenfield Investments (Neto, Brandão and Cerqueira, 2008)
References

References
・Factors influencing the FDI Location choice for knowledge intensive services and
headquarters within the EU and Austria (Falk, 2012)
・DETERMINANTS OF FOREIGN DIRECT INVESTMENT FLOWS TO
DEVELOPING COUNTRIES: A CROSS-SECTIONAL ANALYSIS
(Demirhan and Mahmut, 2008)
・What Drives FDI from Non-traditional Sources? A Comparative Analysis of the
Determinants of Bilateral FDI Flows (Maximiliano, Nunnenkamp and Busse, 2013)
・The determinants of foreign direct investment into European transition economies
(Bevan and Estrin, 2004)
・開発援助は直接投資の先兵か?重力モデルによる推計 (RIETI, 2007)
・East Asian Production Networks and Global Imbalances
(Thorbecke and Nimesh, 2013)
・http://www.rieti.go.jp/users/tanaka-ayumu/serial/013.html
・http://www.censtatd.gov.hk/hkstat/sub/sp360.jsp?tableID=133&ID=0&productType=8
・http://www.hkpost.com.hk/index2.php?id=4058#.VKegbyuDmm5
References