determinants of profitability: empirical evidence from the ... · determinants of profitability:...
TRANSCRIPT
Determinants of Profitability: Empirical Evidence from
the Largest Global Banks
Antonio Iacobelli
Abstract
This paper examines the factors determining the profitability of the top sixteen global banks
according to market capitalization. Using panel data spanning the period 1980 to 2015, this study
estimates several specifications to examine the impact of bank-level and country-level variables
on profitability. Fixed effects and GMM results show that bank characteristics, industry structure
and macroeconomics variables are important in explaining global banks’ profitability. Bank capital
and productivity increase a bank’s profitability whereas credit risk and operating efficiency reduce
it. With respect to the macroeconomic indicators, higher economic growth and inflation spur
banks’ profitability. The study also provides evidence on the positive impact of the business cycle
on global banks’ profitability. In sum, this study concludes that bank-level factors are the most
significant determinant of bank profitability. The result should be that bank managers focus greater
on adjusting internal factors while adapting to external factors.

2
Determinants of Profitability: Empirical Evidence from
the Largest Global Banks
1. Introduction
Banks constitute one of the most important groups of financial intermediaries. As financial
intermediaries, banks play a crucial role in the functioning of most economies; they channel funds
from savers to spenders. Studies have attempted to identify the major determinants of bank
profitability. Profitability is important in understanding the causes of threatening situations such
as the Plaza Accord of 1987 regarding bank capital standards, the recession of the 1990s, and the
financial recession of 2008. Bank managers need to understand which determinants are under their
control and which determinants are exogenous and they need to adapt to.
The efficiency of financial intermediation can also affect economic growth. Economies
that have a profitable banking sector are better able to withstand negative shocks and contribute to
the stability of the financial system. Therefore, it is important to understand the determinants of
banking sector profitability.
The main focus of this study is to identify different bank-specific, industry-specific, and
macroeconomic determinants to see what effects they have on the profitability of global banks. To
be more specific, the variables used to measure profitability are the Return on Equity (ROE) and
Return on Assets (ROA). ROA and ROE will hold still as the dependent variables that are used in
evaluating bank profitability. The determinant variables include capital, credit risk, productivity
growth, operating expenses, size, ownership, concentration, inflation expectations, and cyclical
output. These data are collected for the top sixteen global banks and the sample spans 35 years
(1980 to 2015).

3
As the macroeconomic and legal environment changes, determinants of profitability
banking sector might change as well. The significance of this research is manifold. It will help
identify what events in the past caused bank profitability to decline so that managers can avoid
future declines. This research also contributes to the main body of banking literature providing
further empirical evidence on the issue of bank profitability.
2. Theoretical Background and Prior Empirical Evidence
2.1 Mixed Evidence
The banking industry is critical to the success of many global economies. In the academic
literature so far, there is great emphasis on research that would help keep banks profitable and with
that keep their countries’ economies healthy. Bank profitability can be attributed to many factors,
some internal and some external to the bank. The internal factors are said to be variables that are
tied to management decisions. External determinants are those factors that management has no
control over. Previous studies (cite 1 or 2) shed light on which of these variables have the greatest
influence on bank profitability.
The volatility of bank profitability in recent years has prompted a lot of research in this
field. The literature can be categorized into two broad strands: studies focusing primarily on
domestic banking systems and studies on global banking systems. The more recent studies build
on and include more factors. Older studies on bank profitability, like Sufian & Habibullah (2009),
and Anbar & Alper (2011) do not include industry specific variables which can have a significant
influence on a bank’s profitability. Recent studies such as Hashem (2016), Vu & Nahm (2013),
and Garcia & Guerreiro (2016) do not use long enough time periods to gain a perspective on the
effects of macro level events such as business cycles or inflation.

4
2.2 Theories
Most research credits Berger (1995) as being one of the first studies to distinguish between
internal and external determinants and develop a theory of bank profitability. In his study, Berger
focuses on which factors affect profitability. However, most of the results vary due to the
differences in the global environments within which the banks operate. The main hypotheses that
have emerged from the literature are described below. The market power hypothesis (MP), also
referred to as the structure-conduct-performance hypothesis (SCP), identifies correlation between
industry structure and performance. Firms will attempt to differentiate themselves but ultimately
it is the industry structure that will dictate a company’s profits. Different industry structures
include but are not limited to the regulatory environment, industry culture, and concentration.
Karim, Sami, & Hichem (2010) also support the SCP hypothesis because based on their empirical
results there is a significant positive relationship between industry structure and bank profitability.
Some studies have refuted this hypothesis by referencing the relative-market-power hypothesis
(RMP). This hypothesis states that as banks become bigger and more dominating in an industry,
the greater their yield will be. Large market shares and a wide range of the source of profits cause
higher profits for individual banks (Berger 1995). The third hypothesis, is commonly referred to
in the literature as the ESX hypothesis. This hypothesis, also created by Berger, states that better
managerial efficiency in banks cause higher profits. This theory is not as commonly used as the
first two hypotheses because as Berger (1995) states, the ESX hypothesis cannot be tested
empirically due to the fact that increased profits may be caused by other correlated variables and
it is hard to isolate the impact of managerial efficiency.
5
2.3 Bank-level Determinants
The internal determinants this study uses are capital, credit risk, productivity growth,
operating expenses, and size. Hashem (2016), finds that capital adequacy is inversely related to
profitability. In short, maintaining high capital levels is associated with lower risk taking activities
and hence lower profitability in the short run. The U.S banks especially have seen an increase in
their capital requirements which has caused their capital ratios to increase. In turn banks have a
buffer by maintaining higher capital reserves, however, the outcome is lower returns on that
capital. This is due to lack of interest being earned on money that is locked up as capital reserves.
In the Greek banking system, Athanasoglou, Brissimis, & Delis (2008) found that as the capital
ratio, also known as the ratio of Stockholders’ Equity over Total Assets, increased, profitability
also increased. So this meant as Greek banks took on more risk, their exposure to greater risk
would result in lower profits. The Greek evidence is mixed liked many other studies because of
the environments in which the Greek banks operate in. When looking at the banking environment
for U. S banks, a higher capital ratio actually increases profitability the lower it is (Berger 1995).
It is very important that banks adjust their risk-taking approaches carefully. Most agree that
poor asset quality and low levels of liquidity are the two major causes of bank failures
(Athanasoglou, Brissimis, & Delis, 2008.) For banks with high-risk loans, there is an increased
chance that the loans will not be paid back. This then implies that loan losses will produce lower
returns (Hashem, 2016.) Liquidity is also assumed to have a strong negative relationship with
banking profitability. This is why the need for risk management is so important in the banking
sector.

6
Another factor identified in the literature is operating expenses. This is frequently referred
to as how well management implements the use of its assets. This ratio is closely related to the
notion of efficient management. In other words, the more efficient a bank’s management is at
keeping operating costs low, the greater its profitability will be. In Hashem (2016) the empirical
evidence they found was that the lower the expenses were for the bank, the more efficient was the
bank as evidenced by higher profits. However, Karim, Sami, & Hichem (2010) show that certain
higher expenses, such as in payroll, had a positive effect on profitability. This study analyzes the
results gathered from banks with large commissions and banks with low commissions. This is
thought to be because the higher the payroll for employees, the greater the employees’ incentive
for making profits.
2.4 Industry-level and Macro-level Determinants
There are certain exogenous determinants that can alter a bank’s profitability. Most of the
research studies use a common set of macroeconomic determinants. The most frequently used are
inflation, business cycles, and interest rates. Other variables include industry size, ownership, and
market concentration.
A factor that seems like it would not have that great of an effect on profitability is
ownership. Ownership is an industry-level determinant and is controlled by using a dummy
variable equal to one for privately-owned banks. Many other researchers have done reports to show
that in fact ownership status is irrelevant for explaining profitability (Athanasoglou, Brissimis, &
Delis, 2008.) What is also important to note is that for banks in the U.S and overseas, state
sponsored banks routinely do better than private banks in poor economic times.

7
The inflation rate of a country can have a significant effect on the profitability of its banks.
This is typically represented in the literature by the long-term interest rate or the growth rate of the
money supply. Researchers find that if a bank can grow its revenues fast enough to keep up with
costs, inflation will have a positive effect on banks. Most studies (cite at least one) reveal that
inflation and long-term interest rates have a positive relationship with profitability. This is the case
in a mature economy where inflation can be forecasted out and banks can properly adjust for these
anticipated changes. However, these factors cannot be as easily controlled in countries such as
Vietnam (Vu & Nahm 2013) or Bangladesh (Sufian & Habibullah 2009) where economies are not
as structured and stable enough to allow for systematic prediction of an extremely volatile inflation
path.
A business cycle is a cycle of economic expansion and contraction. The macroeconomic
business cycle was also studied by many to see if it had an effect on the profitability of banks. The
findings suggest that there is a correlation between a bank’s profitability and the business cycle of
its primary business environment. The business cycle has a positive effect on bank profitability,
the significance of which is only in the upward phase of the cycle (Garcia & Guerreiro 2016.) This
means that banks are more profitable at the peak of a business cycle.
Previous research provides evidence on the effects of bank-specific, industry-specific, and
macro-specific determinants of bank profitability. However, the regulatory, institutional and
macro-level environment in which banks conduct their business operations vary greatly across
countries and over time, affecting bank profitability. Most of the existing studies centered in a
specific location and did not conduct research across countries. To see strong macroeconomic
effects on bank profitability, there needs to be data and analysis that ranges for a long period of
time, though one has to control for other influencing factors. Previous studies have also not used

8
sample periods long enough to capture the effects of the changing macro-environment; for
instance, (Athanasoglou, Brissimis, & Delis, 2008) uses a sample period of 1985 to 2001 and
(Karim, Sami, & Hichem 2010) uses a sample period of 1999 to 2009.
3. Hypotheses
One interesting aspect about the profitability of banks is that the sector has undergone
massive shifts since the 1980s. Banks globally have felt the macro changes that involve inflation,
business cycles, deregulation, and heightened regulation. The thirty-five-year span from 1980 to
2015 has also seen shifts in areas such as the concentration of banks and the overall size of banks.
All these shifts can be seen in the banking industry in the United States. Banks such as JP Morgan
Chase and Bank of America have adopted the policy of acquiring other big entities to grow even
larger to compete against banks overseas. JP Morgan has merged with over ten banks since 1980,
this includes, Chase Manhattan, Chemical Bank, Washington Mutual, and Bear Stearns.
The literature states that the structure-conduct-performance hypothesis (SCP) is the
dominant theory that relates industry structure to bank profitability. This theory states that
favorable banking conditions such as deregulation and higher interest rates yield greater profits for
banks. Alongside this, there is the relative-market-power hypothesis (RMP) which states that only
firms with large market shares and a wide range of products are able to earn non-competitive
profits. Literature also suggests the X-efficiency version of the ES hypothesis referred to as (ESX),
proposing that increased supervision and control by management is a greater determinant than
scale efficiency and will lead to higher profits.
1. The study is restricted to analysis of privately held banks. This is why a dummy test for ownership is not considered in the
study.

9
This is slightly different from the two prior theories because this says it is more beneficial for a
bank to have greater management efficiency than increasing their size to gain market
concentration.
Hypotheses:
Motivated by the existing literature, this study will test the following hypotheses:
H1: Bank-level factors affect bank profitability
H1: Industry-level factors affect bank profitability
H1: Macro-level factors affect bank profitability
H1: Bank-level factors have the greatest impact on profitability
Based on the results from past studies and preliminary data analysis the greatest effect on
profitability will be from bank-level determinants (Hashem 2016), (Vu & Nahm 2013), and
(Garcia & Guerreiro 2016). The capital ratio is said to be positively related to profitability because
a bank with high capital reserves can pursue business deals and remain flexible to make multiple
transactions. We use the ratio of equity to assets (Capital) to act as a proxy for capital adequacy.
A higher value of this ratio implies that the bank is more capable to absorb shocks since higher
equity reduces the need for external funding. The credit risk ratio will have a negative relationship
to bank profitability. This means as the ratio decreases and the loans become greater than the
provision for loan losses, there will be decreasing profits because of it. The third bank level
determinant this study will include is the productivity growth. This is defined as measured
by real gross total revenue over the number of employees. This ratio will have a positive effect on
profitability.
Many researchers also refer to operating expenses as an important part of determining profitability.
This ratio has a negative effect on profitability; however, unlike other determinants it has a
decreasing effect. This is primarily because of the way banks pass their costs to customers. Finally,

10
researchers are divided on the effect size has on bank profitability. Bank size is a determinant that
is highly controversial, but worth mentioning when discussing bank profitability determinants.
Banks in short in order to be considered effective as a large bank should be just as efficient as it
would be if it were broken up in to smaller entities. Also if the intrinsic value of having a large
bank outweighs a group of small banks than banks should remain large.
Past studies refer to concentration as having a mixed effect on bank profitability. In some
countries the high concentration of an industry will force banks to undercut each other to make
money. In other countries a high concentration forces banks to collude with each other to set
standard prices. Inflation can also make a difference in bank profitability.
Inflation is important to profitability because it is determined that as long as banks outpace
inflation by growing their income, their profitability will always continue to increase. The same
works for inflation decreases. If income decreases at a rate lower than inflation banks will continue
to remain profitable.
4. Model Specification and Data
Following XXX, we test the two models presented below:
Fixed Effects and Generalized Method of Moments are used to find what determinants
have the greatest changes on bank profitability.
2. The ratio used to measure credit risk was provision for loan loss divided by total loans. This was chosen because of data
availability. This ratio is different from the suggested ratio of reserve for loan loss / total loans.

11
it is the profitability of bank I at time t. c is a constant term, Xit’s are the explanatory
variables and it is the disturbance. The Xit’s are grouped into bank-specific XJit, industry-specific
XLit, and macroeconomic variables XMit. This study also tests a dynamic model which includes a
lagged dependent variable among the regressors. This is represented as it-1; the one-period lagged
profitability. This process of including a lagged dependent variable of profitability at one-period
lagged is to account for profit persistence. This t-1 represents the role of the profitability of the
prior year in determining the current year’s ROA or ROE.
The present study does preliminary tests with the data acquired from the top sixteen banks.
Exhibit 1 shows the average return on assets and Exhibit 2 shows the average return on equity for
various major banks during the sample period. Exhibits 1 and 2 show the average of each
individual company’s ROA and ROE. These charts also take the averages of the companies and
find the industry average for the thirty-five-year period. The significance of these two exhibits is
to see what the average profitability was for each individual bank for the thirty-five-year period.
The average industry also gives a view of where the industry is relative to other corporations.

12
Exhibit 1: Return on Assets Average 1980-2015
Return on Assets Average from 1980-2015
JP Morgan Chase 0.63%
Wells Fargo 1.07%
HSBC Holdings 0.81%
Citigroup 0.99%
Bank of America 0.80%
Banco Santander 0.70%
Mitsubishi UFJ Financial 0.32%
Commonwealth Bank 1.03%
Royal Bank of Canada 0.63%
Westpac Banking Group 0.79%
Banco Bradesco 1.71%
Toronto Dominion Bank 0.71%
UBS 0.25%
Australia & NZ Bank 0.90%
Sumitomo Mitsui Financial 0.05%
National Australia Bank 0.69%
Average Industry 0.75%
Exhibit 2: Return on Equity Average 1980-2015
Return on Equity Average from 1980-2015
JP Morgan Chase 9.47%
Wells Fargo 13.26%
HSBC Holdings 13.16%
Citigroup 9.83%
Bank of America 11.82%
Banco Santander 12.99%
Mitsubishi UFJ Financial 0.21%
Commonwealth Bank 17.06%
Royal Bank of Canada 13.33%
Westpac Banking Group 14.16%
Banco Bradesco 20.63%
Toronto Dominion Bank 12.72%
UBS 6.77%
Australia & NZ Bank 14.53%
Sumitomo Mitsui Financial 0.06%
National Australia Bank 9.82%
Average Industry 11.24%
13
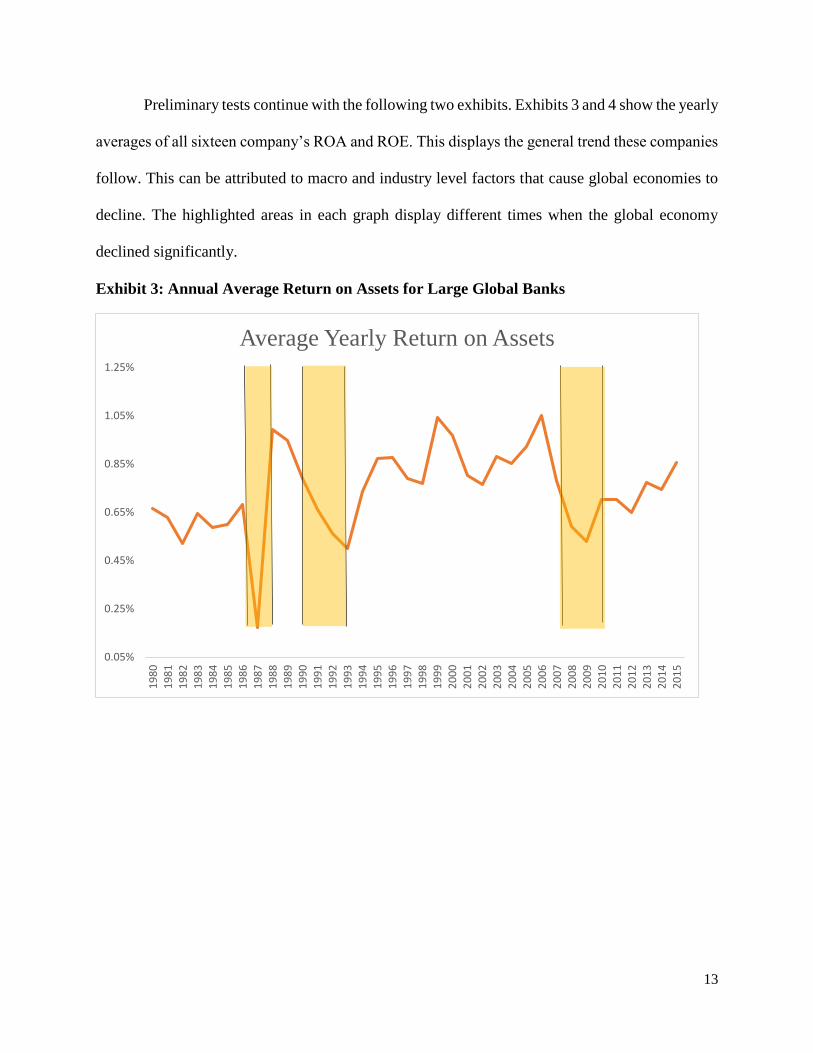
Preliminary tests continue with the following two exhibits. Exhibits 3 and 4 show the yearly
averages of all sixteen company’s ROA and ROE. This displays the general trend these companies
follow. This can be attributed to macro and industry level factors that cause global economies to
decline. The highlighted areas in each graph display different times when the global economy
declined significantly.
Exhibit 3: Annual Average Return on Assets for Large Global Banks
0.05%
0.25%
0.45%
0.65%
0.85%
1.05%
1.25%
19
80
19
81
19
82
19
83
19
84
19
85
19
86
19
87
19
88
19
89
19
90
19
91
19
92
19
93
19
94
19
95
19
96
19
97
19
98
19
99
20
00
20
01
20
02
20
03
20
04
20
05
20
06
20
07
20
08
20
09
20
10
20
11
20
12
20
13
20
14
20
15
Average Yearly Return on Assets

14
Exhibit 4: Annual Average Return on Equity for Large Global Banks
5. Data and Methodology
This research used an unbalanced panel dataset of 16 global banks over the period of 1980-
2015 and spanning eight countries. This researched produced approximately 576 observations and
the data is collected on an annual basis. The bank-specific variables are obtained from two sources,
Compustat and Thomson Reuters’ DataStream. Compustat was used primarily for the four U.S
based companies and DataStream was used for the remaining foreign banks. Mergent Online was
used to confirm values and offer a second source of verification. Industry-specific variables are
obtained using websites to gather information. These websites include World Bank, International
Monetary Fund, and Bank for International Settlements. This research did not need to obtain
private versus public ownership data because the sixteen banks in the sample were all privately
held. We could remove the variable of ownership because there was no state held entity in the
sample. The concentration variable used the Herfindahl-Hirschman index. The measures which
4%
6%
8%
10%
12%
14%
16%
18%
20%
19
80
19
81
19
82
19
83
19
84
19
85
19
86
19
87
19
88
19
89
19
90
19
91
19
92
19
93
19
94
19
95
19
96
19
97
19
98
19
99
20
00
20
01
20
02
20
03
20
04
20
05
20
06
20
07
20
08
20
09
20
10
20
11
20
12
20
13
20
14
20
15
Average Yearly Return on Equity

15
had to be obtained to create this index was total assets of each individual company over the 35-
year period and total assets of the industry sector of the country the firm operated in. This total
assets of the company information was gathered from Compustat and DataStream while the sector
total assets were gathered from the International Monetary Fund, World Bank and country-specific
agencies. The macro-level variables are obtained from governmental websites for each specific
country and the International Monetary Fund. Inflation and Cyclical output were each taken from
different websites from each specific country’s government agencies. Most of this data can also
be obtained through Bloomberg and Morningstar.
The exhibit 5 to follow shows all the expected effects of the explanatory variables and a brief
description of each variable. This provides the ability to see all the explanatory variables in a
single place for an easy look at what is used and collected in the research.
3. The panel is unbalanced since it does not have exactly the same number of data points for each bank. Companies do not
report uniformly across all countries.
4. The United States of America, Brazil, Switzerland, Australia, United Kingdom, Spain, Japan, and Canada.

16
Exhibit 5: Definitions, notations, and the expected effect of explanatory variables
Description of the Variables
Dependent Variables:
Profitability: Net profits before taxes divided by total assets or net profits before taxes divided by
total stockholder equity.
Independent Variables:
Bank-level Variables
Capital Risk: This is a measure proxied by total stockholder equity divided by total assets.
Credit Risk: Can be calculated by taking loan loss provision divided by total loans.
Productivity Growth: This is a measure of total revenue divided by inflation. This number is then
divided by total personnel of the company.
Operating Expenses Management: Can be calculated by taking operating expenses of a company
and dividing it by the total assets.
Size: Size is a measured by the real assets of a company and squaring them and then taking the
logarithmic value.
Industry-specific Variables
Concentration: This is a measure of the concentration of the industry in which the bank operates
primarily. This is calculated by taking the total assets of a company and dividing it by the industry’s
or sector’s total assets.
Macro-level Variables
Inflation Expectations: This is proxied by the current period’s inflation rate.
Government Yield: This is the 10-year government bond yield.
Cyclical Output: This is the deviation of actual output from segmented trend. This was calculated
by using the Hodrick Prescott (HP) filter.

17
Exhibit 6 presents descriptive statistics for the variables used in this study for overall sample
and by company. The summary statistics has been influenced by extreme outliers. The maximum
and minimum for ROA and ROE can be noticed easily because certain years caused companies
to have far greater or less ROE or ROA when compared to the rest of the companies in the
sample.
Exhibit 6: Summary Statistics for all the sample separated by level factors
Mean Median Maximum Minimum Std. Dev.
Return on Assets 0.007 0.007 0.031 -0.014 0.005
Return on Equity 0.116 0.134 0.359 -0.600 0.090
Bank-Level
Capital 0.062 0.058 0.195 0.016 0.023
Credit 0.013 0.007 0.426 0.000 0.026
Log(Productivity) 4.312 4.157 8.921 2.761 0.897
Operating Expense 0.066 0.060 0.233 0.011 0.032
Log(Size) 10.171 10.057 15.002 7.574 1.254
Industry-Level
Concentration 0.108 0.098 0.435 0.002 0.075
Macro-Level
Government Yield 5.764 5.174 16.512 -0.320 3.422
Inflation
Expectations
0.035 0.027 0.180 -0.014 0.030
Log (Cyclical
Output)
4.999 5.000 5.094 4.888 0.025
The study uses an unbalanced panel of global banks spanning the period of 1980-2015. In
the literature most researchers prefer the least squares estimation method with fixed effects or
random effects models. To try and remove the inconsistency of these estimates, this research uses
a dynamic relationship method as well (Baltagi 2001).
5. An important issue, when running the factors through E-Views, the log needed to be taken for certain factors. Productivity
and Concentration needed to be used as logs because of scaling issues with their coefficients. Ownership was excluded
because all the referenced banks are privately owned.

18
There were multiple issues with the methodology and deciding which one to use. The first
was the choice between a Fixed Effects (FE) Model and a Random Effects (RE) model. The
Hausman test was used to test which model was best for the model. The software that runs the data
and calculates the results for the research is E-Views. E-Views was used because it could run panel
regressions with the data. When running the test through E-Views, the results showed that the
difference between coefficients between FE and RE is systematic. This enhanced the previous
thought that the Fixed Effects approach would be best. The P-Value was below the necessary
threshold of one percent indicating that the Fixed Effects Model was appropriate to use over the
Random Effects Model. This being said, using a Generalized Method of Moments (GMM) is even
better because it controls for both biased and inconsistent estimates, especially in the presence of
lagged dependent variables.
6. Empirical Analysis
The regression results are shown in Table #. This table provides the empirical results of the
effects of bank-specific, industry-specific and macroeconomic variables on bank profitability
(ROA). There are several variables that are statistically significant at the 1, 5, and 10 percent level.
The estimation results show that capital has a positive and statistically significant impact at 1
percent level on profitability, as measured by ROA. Further, when testing during different sample
periods or using GMM this result holds true. Credit Risk has a significant negative impact at the 1
percent level over all the different time periods and also when using the GMM results. The results
provide mixed support for productivity growth. The results showed a positive impact at 10 percent
level for the time period 1980 to 2015. However, the three stage period experienced a negative
impact at the 5 percent level. These results seem to confirm that the more capitalized banks are,
the greater their profitability is over the long run. In addition, these results also confirm that
increased loan loss provisions result in lower profits for banks. This reflects that the quality of

19
credit is important to have higher profitability levels. According to this evidence, U.S banks show
that they are well capitalized, and because of this fact, are becoming more profitable. The
coefficient of the measure of operational efficiency is negative and highly significant at the 5
percent level over the period 1980 to 2015 and over the two sub-sample periods of 1985 to 1996
and 1996 to 2015. However, in the two stage period, operating efficiency has a positive impact
from 1980 to 1997 and 2008 to 2015. Given the negative impact on banks’ profitability, we can
conclude that efficiency does matter for profitability. The coefficient of size of a bank is
insignificant in these tests. The results are mixed and coefficients shift from positive to negative
over the different time periods. These results show that size and robustness of a bank’s balance
sheet does not necessarily lead to greater profits.
The coefficient of concentration has a statistically negative impact at 5 percent level on
ROA over the period 1980 to 1997 and 1998 to 2015., The results confirm that banks earn higher
incomes when industry concentration decreases. The results for the coefficient of inflation
expectations are mixed. The results show a positive but statistically significant impact on global
banks’ profitability over the period from 1980 to 2007 and a negative impact from 2008 to 2015.
Inflation expectations has had a negative impact, at 10 percent level, on ROA for both periods.
When inflation is proxied by 10-year government bond yields, the results show that inflation has
a significant impact on global banks’ profitability. Interest rates had a negative impact, at 1 percent
level, on ROA for all the time periods. Lastly the cyclical output factor which represents business
cycles made a small positive change in profitability.
6. An important issue, relevant to the estimation of the inflation regressions, is the potential co-linearity between the
regressors. For instance, the GDP variable is very likely to be highly correlated with inflation.

20
The cyclical output had a positive impact, at 10 percent level, on ROA for the time period between
1980 to 1987 and 1998 to 2015. These results are in line with previous findings by Athanasoglou,
Brissimis, & Delis, (2008), and in line with our expectations, based on our hypotheses.
The regression results in exhibits 7 through 11 show the coefficient and t-Statistic for each
of the tests run. The tests are done for return on assets for the sample and return on equity for the
sample.

Regression Results
***p <0.01; **p<0.05; *p<0.1
Exhibit 7: Dependent Variable: ROA Panel Regression (Current Inflation rate as a Proxy for Inflation Expectations)
1 2 3 4 5 6
Tests using 10YR country yield
1980-2015 1980-1997 1998-2015 1985-1995 1996-2007 2008-2015
Coefficient t-Statistic Coefficient
t-
Statistic Coefficient t-Statistic Coefficient
t-
Statistic Coefficient
t-
Statistic Coefficient
t-
Statistic
Bank-level
Capital *** 0.066 5.351 *** 0.096 4.523 *0.038 1.675 *** 0.142 4.637 *** 0.089 3.737 *** 0.175 4.511
Credit Risk *** -0.021 -2.701 *** -0.285 -7.009 -0.007 -0.974 *** -0.396 -6.765 -0.004 -0.740 ** -0.086 -2.090
Log(Productivity) *** 0.003 3.188 -0.003 -1.448 *** 0.006 4.004 -0.004 -1.591 ** 0.003 1.788 *** 0.004 2.859
Operating Expenses -0.009 -0.797 ** 0.029 2.027 *** -0.110 -3.840 ** 0.042 2.482 *** -0.084 -3.377 -0.057 -1.542
Log(Size) ** -0.002 -2.296 ** 0.004 2.236 *** -0.006 -3.954 ** 0.004 1.874 ** -0.003 -1.882 **-0.004 -2.600
Industry-level
Concentration -0.001 -0.159 -0.012 -0.519 0.011 1.433 -0.016 -0.407 -0.009 -0.785 0.007 0.571
Macro-level
Government Yield
Inflation
Expectations -0.010 -0.703 0.010 0.448 *** 0.107 4.348 0.005 0.144 0.042 1.327 0.016 -0.758
Log (Cyclical
Output) 0.009 1.270 0.012 1.498 -0.018 -1.406 ** 0.020 1.940 0.004 0.337 -0.009 0.553

22
Exhibit 8: Dependent Variable: ROA Panel Regression (Government Yields as a Proxy for Inflation Expectations)
7 8 9 10 11 12
Tests using inflation
1980-2015 1980-1997 1998-2015 1985-1995 1996-2007 2008-2015
Coefficient
t-
Statistic Coefficient
t-
Statistic Coefficient
t-
Statistic Coefficient
t-
Statistic Coefficient
t-
Statistic Coefficient
t-
Statistic
Bank-level
Capital *** 0.066 6.065 *** 0.098 5.842 ** 0.042 1.874 *** 0.144 5.224 *** 0.1 3.971 *** 0.181 4.807
Credit Risk *** -0.024 -3.254 *** -0.260 -7.572 ** -0.015 -2.134 *** -0.394 -7.338 -0.005 -0.837 ** -0.099 -2.451
Log(Productivity) *** 0.002 2.536 -0.001 -0.562 *** 0.006 3.816 -0.001 -0.333 ** 0.004 2.248 *** 0.004 3.116
Operating
Expenses 0.002 0.203 *** 0.032 2.927 ** -0.049 -2.056 ** 0.034 2.107 ** -0.076 -3.613 -0.022 -0.633
Log(Size) ** -0.001 -2.063 ** 0.003 2.552 ** -0.007 -4.787 0.002 1.447 ** -0.004 -2.363 *** -0.005 -3.282
Industry-level
Concentration 0.003 0.476 -0.003 -0.145 0.007 0.906 -0.005 -0.165 -0.012 -1.050 0.016 1.267
Macro-level
Government Yield ** 0.009 -1.947 ** 0.02 1.911 ** -0.067 -3.247 0.034 1.339 -0.002 -0.080 ** -0.062 -2.041
Inflation
Expectations
Log (Cyclical
Output) -0.019 1.397 0.007 0.903 -0.001 -0.046 ** 0.018 1.843 0.004 0.297 -0.007 -0.612

23
Exhibit 9: Dependent Variable: ROA Generalized Method of Moments
13 14 15 16
Tests using GMM
1980-1997 1998-2015 1990-2007 2008-2015
Coefficient t-Statistic Coefficient t-Statistic Coefficient t-Statistic Coefficient t-Statistic
Bank-level
Πt−1 -0.085 -1.223 *** 0.524 2.251 -0.168 -1.451 *** -0.289 -7.121
Capital ** 0.147 1.959 ** 0.158 2.052 *** 0.168 4.469 -0.006 -0.051
Credit Risk *** -0.350 -4.458 -0.010 -0.220 -0.032 -0.420 *** -0.162 -5.762
Log(Productivity) -0.002 -0.346 0.008 1.413 0.006 0.793 0.001 0.100
Operating Expenses 0.025 0.693 ** -0.109 -3.584 *** -0.114 -2.675 0.038 0.582
Log(Size) 0.010 0.807 -0.009 -1.184 -0.007 -0.977 0.000 -0.055
Industry-level
Concentration -0.155 -1.154 -0.103 -1.525 0.040 0.749 0.026 0.470
Macro-level
Government Yield -0.040 -0.864
Inflation Expectations -0.054 -0.928 0.000 0.004 -0.011 0.729
Log (Cyclical Output) 0.030 0.855 -0.025 -2.455 0.068 1.524 0.029 -0.919

24
Exhibit 10: Dependent Variable: ROE Panel Regression (Current Inflation rate as a Proxy for Inflation Expectations)
1 2 3 4 5 6
Tests using Government Yield
1980-2015 1980-1997 1998-2015 1985-1995 1996-2007 2008-2015
Coefficient t-Statistic Coefficient t-Statistic Coefficient t-Statistic Coefficient t-Statistic Coefficient t-Statistic Coefficient t-Statistic
Bank-level
Capital -0.308 -1.180 0.233 0.593 -0.543 -0.981 * 0.927 1.773 -0.785 -1.195 1.575 1.298
Credit Risk ** -0.393 -2.468 *** -5.737 -7.986 -0.144 -0.861 *** -7.648 -7.846 -0.044 -0.286 -1.371 -1.069
Log(Productivity) *** 0.054 3.138 -0.011 -0.344 *** 0.119 3.254 -0.021 -0.468 ** 0.091 1.854 ** 0.099 2.331
Operating
Expenses * -0.455 -1.833 -0.053 -0.206 *** -1.838 -2.630 0.195 0.690 *** -1.957 -2.845 -0.890 -0.764
Log(Size) *** -0.042 -2.712 0.001 0.017 *** -0.116 -3.101 0.012 0.285 *** -0.133 -2.711 * -0.082 -1.784
Industry-level
Concentration -0.027 -0.184 -0.135 -0.235 0.042 0.230 0.247 0.268 0.482 1.522 0.421 1.092
Macro-level
Government Yield
Inflation
Expectations -0.183 -0.627 0.175 0.234 ** 1.254 2.068 0.184 0.316 0.288 0.323 -0.277 -0.313
Log (Cyclical
Output) 0.034 0.213 0.100 1.042 -0.501 -1.593 0.237 1.226 -0.227 -0.602 -0.305 -0.794

25
Exhibit 11: Dependent Variable: ROE Panel Regression (Government Yields as a Proxy for Inflation Expectations)
7 8 9 10 11 12
Tests using inflation
1980-2015 1980-1997 1998-2015 1985-1995 1996-2007 2008-2015
Coefficient
t-
Statistic Coefficient t-Statistic Coefficient t-Statistic Coefficient t-Statistic Coefficient t-Statistic Coefficient t-Statistic
Bank-level
Capital -0.297 -1.284 0.260 0.782 -0.523 -0.978 ** 1.096 2.258 -0.743 -1.157 1.638 1.367
Credit Risk *** -0.434 -2.842 *** -5.084 -8.042 -0.248 -1.470 *** -7.023 -7.739 -0.050 -0.328 -1.734 -1.342
Log(Productivity) *** 0.038 2.646 0.001 0.025 *** 0.112 3.133 0.021 0.564 * 0.089 1.961 ** 0.103 2.450
Operating
Expenses -0.299 -1.433 0.063 0.283 * -1.009 -1.775 0.091 0.329 ** -1.705 -2.958 -0.494 -0.439
Log(Size) *** -0.028 -2.376 0.014 0.678 *** -0.124 -3.472 0.016 0.485 ** -0.127 -2.864 -0.115 -2.226
Industry-level
Concentration -0.010 -0.076 -0.301 -0.650 -0.006 -0.034 0.033 0.044 0.427 1.368 ** 0.669 1.636
Macro-level
Government Yield -0.153 -0.661 0.456 1.533 -0.798 -1.637 0.869 1.647 0.052 0.088 -0.342 -1.345
Inflation
Expectations
Log (Cyclical
Output) 0.077 0.490 0.121 0.789 -0.306 -0.983 0.188 1.030 -0.215 -0.544 -1.296 -0.951

7. Conclusion
The objective of this study was to analyze which and how bank-specific, industry-specific,
and macro-specific factors affect global banks’ profitability. Banks are crucial in financing
economic activity and acting as financial intermediaries. Therefore, a profitable and sound banking
sector is an important goal for every economy. The analyses of bank profitability are important for
academic research as well as for bank management and bank supervisors. This paper focuses on
the global banking sector, distinct from previous research exclusively focused on specific
countries’ banking sectors.
This study is based on 16 banks from the top 25 top global bank holding companies as
determined by market capitalization over the period 1980 to 2015., The analysis was also
conducted using sub-sample periods: from 1980 to 1997, and 1998 to 2015. The second time period
ran the same tests from 1985 to 1995, 1996 to 2007, and 2008 to 2015. An unbalanced panel data
set sample is the basis for the econometric analysis. Overall, the results provide further empirical
support into the factors that determine the profitability of global banks. The results confirm to a
large extent the key results of recent literature that has been using the same profitability measures.
The key factors that affect profitability in the same direction, for the first two periods, are
capital, which has a significant positive impact on profitability; credit risk, which has a significant
negative impact on profitability; operating efficiency, which has a negative impact on profitability;
and productivity, which has a positive impact on profitability.
In addition, there are some variables that changed the sign of their impact on banks’
profitability from one period to another. Operating efficiency has a positive impact for the 1980 to
1997 period and a significant negative impact for the period 1998 to 2015. Size has a positive
impact in the first period under study and a negative impact in the second period. This different
impact might be explained by the fact that smaller and newer banks did not see their profitability

27
affected by the increase of loan loss provisions. However, bigger banks saw their profitability
affected by the higher volume of loan loss provisions.
Overall, the results provide evidence that the profitability of global banks is influenced by
bank-specific factors more than by macroeconomic variables. There are limitations within this
study. Depending on data availability, the sample could be extended to include all of the top 25
banks and given that most of the excluded banks were Chinese, this would entail including state-
versus-private ownership forms as one of the determinants.,. These issues could be addressed in
future work.
7. Semiparametric model is a model that has parametric and nonparametric components. They include both descriptive and
inferential statistics.

28
References
Anbar, A., & Alper, D. (2011). Bank Specific and Macroeconomic Determinants of Commercial Bank Profitability:
Empirical evidence from Turkey. Business and Economics Research Journal.
Arellano, M., & Bond, S. (1991). Some Tests of Specification for Panel Data: Monte Carlo evidence and an
application to employment equations. The Review of Economic Studies.
Athanasoglou, P. P., Brissimis, S. N., & Delis, M. D. (2008). Bank-specific, Industry-Specific and Macroeconomic
Determinants of Bank Profitability. Journal of International Financial Markets, Institutions and Money.
Baltagi, B. (2008). Econometric Analysis of Panel Data. John Wiley & Sons.
Berger, A. N. (1995). The Profit-Structure Relationship in Banking-Tests of Market-Power and Efficient-Structure
Hypotheses. Journal of Money, Credit and Banking.
Berger, A. N. (1995). The Relationship Between Capital and Earnings in Banking. Journal of Money, Credit and
Banking.
Berger, A. N., Bonime, S. D., Covitz, D. M., & Hancock, D. (2000). Why are bank profits so persistent? The roles
of product market competition, informational opacity, and regional/macroeconomic shocks. Journal of Banking &
Finance.
Demirgüç-Kunt, A., & Huizinga, H. (1999). Determinants of Commercial Bank Interest Margins and Profitability:
some International Evidence. The World Bank Economic Review.
Garcia, M. T. M., & Guerreiro, J. P. S. M. (2016). Internal and External Determinants of Banks’ Profitability: The
Portuguese Case. Journal of Economic Studies.
Hashem, H. Y. (2016). Determinants of Egyptian Banking Sector Profitability: Time-Series Analysis from 2004-
2014. International Journal of Business and Economic Sciences Applied Research.
Karim, B. K., Sami, B. A. M., & Hichem, B. K. (2010). Bank-specific, Industry-specific and Macroeconomic
Determinants of African Islamic Banks' Profitability. International Journal of Business and Management Science.
Shaffer, S. (1994). Bank Competition in Concentrated Markets. Federal Reserve Bank of Philadelphia Business
Review.
Sufian, F., & Habibullah, M. S. (2009). Determinants of Bank Profitability in a Developing Economy: Empirical
Evidence from Bangladesh. Journal of Business Economics and Management.
Vu, H., & Nahm, D. (2013). The Determinants of Profit Efficiency of Banks in Vietnam. Journal of the Asia Pacific
Economy.