determinants of household resilience to dry spells and drought in malawi: a case of salima district
TRANSCRIPT

DETERMINANTS OF HOUSEHOLD RESILIENCE TO DRY SPELLS AND DROUGHT IN MALAWI: A CASE OF
SALIMA DISTRICT
T.F BANDA, M.A.R PHIRI, L.D MAPEMBA and B.B MAONGALUANAR

Outline
• Statement of the problem• Definition: Resilience• Objectives• Data and methods• Results and Discussion• Conclusions • Policy Implications

Statement of the Problem
Agric. has been identified as the most severely affected by dry spells & drought
These have presented new challenges to smallholder farmers because they are exogenous.
For example, about 1.1 million people were reported to be food insecure due to unreliable rainfall patterns (FEWS NET,2013).

Definition: Resilience
The ability of a system, community or society exposed to hazards to resist, absorb, accommodate and to recover from the effects of a hazard in a timely and efficient manner, Phiri (2010: 19)
The ability of the community, society or even a household to “spring back” from a shock, UNDG (Undated:38).
The amount of change a system can undergo and still remain in the same state, Falkenmark and Rockstrom (2009:94)

Objectives
Main objective: To determine how prolonged dry spells and
droughts have affected the resilience of maize farming households in Salima district.
Specific Objectives: Determine factors that affect a household’s
resilience to dry spells and droughts in Chipoka EPA. Determine the effect of drought resilience on the
welfare of farming households in Chipoka EPA

Methods
• Principal Components Analysis (PCA) used to construct DRI
• Probit model used to identify determinants of resilience
• Stochastic frontier approach used to determine the effect of drought resilience on household output (proxy with welfare)
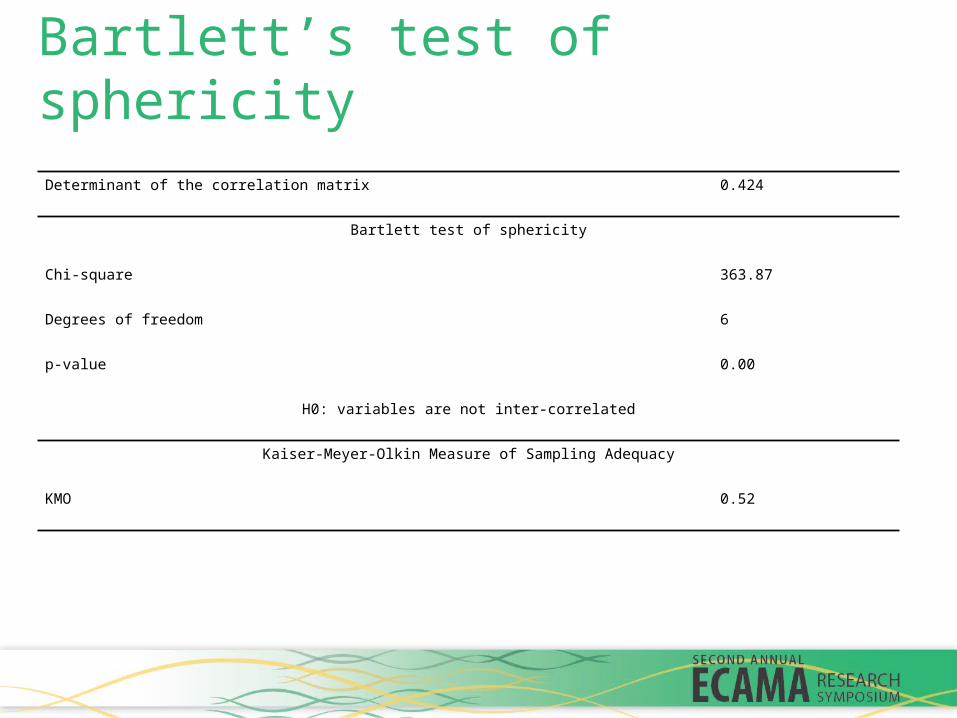
Bartlett’s test of sphericity
Determinant of the correlation matrix 0.424
Bartlett test of sphericity
Chi-square 363.87
Degrees of freedom 6
p-value 0.00
H0: variables are not inter-correlated
Kaiser-Meyer-Olkin Measure of Sampling Adequacy
KMO 0.52

Eigen values
Component Eigen value Difference Proportion Cumulative
Comp1 1.79 0.43 0.45 0.45
Comp2 1.36 0.87 0.34 0.79
Comp3 0.49 0.15 0.12 0.91
Comp4 0.35 . 0.09 1.00
n=427 Components = 4 Trace = 4 Rho = 1.0000

Principal components
Variable Comp1 Comp2 Comp3 Comp4 Unexplained
Production in good year 0.58 -0.40 0.12 -0.69 0
Production in bad year 0.57 -0.41 -0.07 0.70 0
Consumption months in good year 0.42 0.56 -0.71 -0.09 0
Consumption months in bad year 0.39 0.59 0.69 0.10 0

Results and DiscussionVariable n Mean Std. Dev. Min Max
DRI 427 -0.09 0 .88 -1.79 5.11
DRI >= 0 163 0.79 0.75 0.01 5.11
DRI< 0 264 -0.63 0.37 -1.79 -0.01

Results & Disc…

Results… Coefficient P-value Marginal Effects P-valueGender of household head -0.16
(0.17)0.35 -0.06
(0.06)0.34
Age of household head (years) 0.16**(0.07)
0.03 0.06**(0.02)
0.03
Size of household (number of people) 0.34***(0.07)
0.00 0.12***(0.02)
0.00
Years spent in school by household head 0.10(0.75)
0.14 0.04(0.03)
0.14
Land holding size (Acres) 0.39***(0.09)
0.00 0.15***(0.03)
0.00
Number of Chickens 0.07(0.08)
0.38 0.03(0.03)
0.38
Number of Goats 0.09(0.09)
0.26 0.04(0.03)
0.27
Number of Bicycles 0.01(0.07)
0.84 0.01(0.03)
0.84
Immediate family members in cities 0.07*(0.03)
0.06 0.02*(0.01)
0.06
Frequency of dry spells over 5 year period -0.03(0.07)
0.64 -0.01(0.03)
0.64
Participation in village savings and loans 0.23(0.15)
0.12 0.09(0.06)
0.12
Constant -0.33(0.23)
0.16
N = 427 Wald chi2(11) = 79.8 Prob. > chi2 = 0.00 Log pseudo likelihood = -236.25 Pseudo R2 = 0.17y = Pr(Resilience) = 0.37***1% level of significance, **5% level of significance and *10% level of significanceValues in Parentheses are robust standard errors

Results…
Variable Coefficient Z P-value
Land (log) 0.08** (0.04)
2.10 0.04
Seed (log) 0.18***(0.04)
4.55 0.00
Lab (log) 0.07(0.05)
1.41 0.16
Invest (log) 0.05**(0.01)
5.86 0.00
Resilience Index 0.45***(0.04)
12.69 0.00
Constant 5.78***(0.24)
23.78 0.00
Likelihood-ratio test of sigma_u=0: chibar2(01)= 92.61 Prob.>=chibar2 = 0.00Values in parentheses are robust standard errors***1% level of significance and **5% level of significance

Conclusions
62 percent are vulnerable to adverse effects Mean DRI of -0.0857 is below threshold of 0
for a household to be considered resilient. Determinants of resilience: age of Hh, Size of
Hh, Land and number of immediate family members living outside household
Resilience had a +ve effect on Hh welfare

Policy Implications
Govt. & non-state actors working in Chipoka to consider introducing productivity enhancing technologies such as irrigation in the study area.
Encourage farmers to diversify crop production and participate in off-farm livelihood activities.
Target beneficiaries to food aid and other relief programs.

Acknowledgements

END
Thank You!!!