determinants of foreign direct investment in india · determinants of foreign direct investment in...
TRANSCRIPT
TOKYO UNIVERSITY OF FOREIGN STUDIES
Determinants of Foreign
Direct Investment in
India Region-Sector-Wise Analysis
Yuki Tsuchiya (8211156)
February 12, 2015
Abstract : While there are a number of empirical s tudies on the impact and
the determinants of Foreign Direct Investment (FDI), few of the research
have been implemented in terms of India at the region level . In this
paper, the determinants of FDI towards India (data from the period 2008-
2013) would be examined region -wise, using s tate -wise data. Sector -wise
GDP would be used as a variable in order to analyze which market being
the significant determinant . It reveals that general ly FDI in India is
related posi t ively with GDP per capita , length of s tate and national
highways, GDP of service sector , number of telephones per 100
populations, and amount of natural gas produced. Especial ly the resul ts
revealed that the FDI inflows have a signif icant relation with the marke t
size of the service sector of the ini t ial year .

1
Table of Contents
For Acknowledgement . . . . . . . . . . . . . . . . . . . . . . . . . . . . . . . . . . . . . . . . . . . . . . . . . . . . . . . . . . . . . . . . . . . . . . . . . 3
1. Introduction . . . . . . . . . . . . . . . . . . . . . . . . . . . . . . . . . . . . . . . . . . . . . . . . . . . . . . . . . . . . . . . . . . . . . . . . . 4
1.1. Terminology . . . . . . . . . . . . . . . . . . . . . . . . . . . . . . . . . . . . . . . . . . . . . . . . . . . . . . . . . . . . . . . . . 5
1.1.1. Foreign Direct Investment (FDI) . . . . . . . . . . . . . . . . . . . . . . . . . . . . . . . . 5
1.1.2. Gross Domestic Product (GDP) . . . . . . . . . . . . . . . . . . . . . . . . . . . . . . . . . 6
1.2. Discussion on FDI . . . . . . . . . . . . . . . . . . . . . . . . . . . . . . . . . . . . . . . . . . . . . . . . . . . . . . . . 6
1.2.1. FDI as for India . . . . . . . . . . . . . . . . . . . . . . . . . . . . . . . . . . . . . . . . . . . . . . . . . . . . . . . 8
1.3. Discussion about FDI Impact on Economic Growth . . . . . . . . . 8
1.4. Government of India FDI Pol icies . . . . . . . . . . . . . . . . . . . . . . . . . . . . . . . . 10
1.5. Why region-sector-wise India is the Subject . . . . . . . . . . . . . . . . . 14
1.6. Literature Review . . . . . . . . . . . . . . . . . . . . . . . . . . . . . . . . . . . . . . . . . . . . . . . . . . . . . . . 19
2. Data . . . . . . . . . . . . . . . . . . . . . . . . . . . . . . . . . . . . . . . . . . . . . . . . . . . . . . . . . . . . . . . . . . . . . . . . . . . . . . . . . . . 24
2.1. Sample States , Union Terri tories , and Regions . . . . . . . . . . . . . . 24
2.2. Data Description and Theory . . . . . . . . . . . . . . . . . . . . . . . . . . . . . . . . . . . . . . . 26

2
3. Model and Method . . . . . . . . . . . . . . . . . . . . . . . . . . . . . . . . . . . . . . . . . . . . . . . . . . . . . . . . . . . . . . 29
3.1. Model Building . . . . . . . . . . . . . . . . . . . . . . . . . . . . . . . . . . . . . . . . . . . . . . . . . . . . . . . . . . 29
4. Resul ts and Analyses . . . . . . . . . . . . . . . . . . . . . . . . . . . . . . . . . . . . . . . . . . . . . . . . . . . . . . . . . . 32
4.1. Resul ts and Analyses on Explanatory Variables . . . . . . . . . . . . 32
4.2. Resul ts and Analyses on States , Union Terri tories , and
Regions 35
5. Conclusion . . . . . . . . . . . . . . . . . . . . . . . . . . . . . . . . . . . . . . . . . . . . . . . . . . . . . . . . . . . . . . . . . . . . . . . . . 40
6. References . . . . . . . . . . . . . . . . . . . . . . . . . . . . . . . . . . . . . . . . . . . . . . . . . . . . . . . . . . . . . . . . . . . . . . . . . 41

3
For Acknowledgement
I would l ike to express my great appreciation to Professor Kimiko Uno
for her valuable and constructive sugges tions and assis tance during the
work of this study.
I would also l ike to thank all the members in Professor Uno ’s seminar
for giving constructive feedbacks to this study. Discussions that were
done in the seminar were very insightful .

4
1. Introduction
In recent years , Foreign Direct Investment ( FDI) has been regarded as an
important factor for economic development . As for India, the amount of
FDI has an increasing t rend, and also the Gross Domest ic Product (GDP)
is increasing every year . In most empirical studies , i t is concluded that
FDI contributes to both factor productivity and income growth in host
countries , beyond what domestic investment would normally cause
(OECD, 2002) . This is considered to be also the same as for India
(Kundra, 2009) . With FDI and GDP ’s growing amount , the interest
towards India as a dest ination of FDI has been growing in Japan, and
recent ly India has assigned key agreements with Japan to share ‘Special
Strategic Global Partnership ’ (Chaudhury, 2014).
Under the consideration of previous empirical studies on the
relat ion of FDI and GDP, i t could be stated that FDI t r iggers economic
development in India. As ment ioned above, the amounts of FDI have an
increasing tendency. However, the amount of FDI widely var ies
depending on each s tate . If more states be able to call in a larger amount
of FDI, the economic gap among states would decrease. In addit ion, the
whole nation would be enabled to increase i ts GDP.
The purpose of this thesis is to examine the determinants of FDI
towards India. In this paper, FDI would be regarded as a posit ive factor
on economic development . By using regression model and region -wise
data, the determinants is to be observed. Finally to analyze how to
promote and increase the amount of FDI that will benefi t both the host
and invest ing nat ions.
5
1.1. Terminology
In order to clar i fy the main terms used in this paper, some of the most
important words would be defined in this section .
1.1.1. Foreign Direct Investment (FDI)
The term “FDI” is defined in the Balance of Payments Manual Fi f th
Edit ion ( IMF, 1993) and in Detai led Benchmark of Foreign Direct
Investment: Third Edi tion (OECD, 1996) . According to UNCTAD, “FDI
refers to an investment made to acquire last ing interest in enterprises
operat ing outs ide of the economy of the i nvestor. Further , in cases of
FDI, the investor´s purpose is to gain an effect ive voice in the
management of the enterprise. The foreign ent i ty or group of associated
ent i t ies that makes the investment is termed the "direct investor" . The
unincorporated or incorporated enterprise -a branch or subsidiary,
respectively, in which direct investment is made -is referred to as a
"direct investment enterprise" . Some degree of equity ownership is
almost always considered to be associated wi th an effective voice in th e
management of an enterprise; the BPM5 suggests a threshold of 10 per
cent of equity ownership to quali fy an investor as a foreign direct
investor.”1In short , FDI are investments that are done to directly gain
interests by adminis trat ing f i rms in host cou ntr ies, such as M&A and
1 UNCTAD “Foreign Direct Investment ” (1999)

6
green f ield investment . It does not include investments which are done
via securit ies (so called Foreign Portfolio Investment).
1.1.2. Gross Domestic Product (GDP)
The term “GDP” is defined in SNA 1.128 and 2.173-2.174 (OECD, 2001).
According to OECD, “Gross domestic product is an aggregate measure
of production equal to the sum of the gross values added of al l resident
inst i tut ional units engaged in product ion (plus any taxes, and minus any
subsidies , on products not in cluded in the value of their outputs). The
sum of the f inal uses of goods and services (al l uses except intermediate
consumption) measured in purchasers' prices , less the value of imports
of goods and services, or the sum of primary incomes dis tr ibuted by
resident producer uni ts .”2
1.2. Discussion on FDI
FDI towards developing countries has become an international t rend. In
2009, FDI by private equity funds and sovereign wealth funds together
accounted for over 10% of global FDI f lows. PE funds are also major
contributors to cross -border M&A which was the main factor of the
increase of global FDI (see Table 1). But in the recent years , a ccording
to UNCTAD3, a l though the global FDI rose by 11%, the developing
2 OECD “OECD Glossary of Statist ical Terms” (2008)
3 UNCTAD “Global Investment Trends Monitor No. 15 ” (2014)

7
nat ions are t rapped in a historical ly low share (39%). Despite the
information above, the amount towards developed countries increased by
12% to US$576 bil l ion . FDI to the European Union increased, whi le
flows to the United States decl ined. UNCTAD forecasts that the global
FDI f lows wil l r ise gradually in 2014 and 2015, to US$1.6 t r i l l ion and
US$1.8 t r i l l ion respectively.
Table 1. Cross-Border M&As by Private Equity Firms 2000 -2010 (ci ted
from “ India`s FDI Inflows Trends and Concepts ” by K.S. Chalapati Rao,
Biswaji t Dhar, 2011)

8
1.2.1. FDI as for India
India has been dist inguished among the world as a FDI dest inat ion in
recent years as wel l as i ts rapidly growing economy . According to
UNCTAD3, i t has experienced a 17% growth in FDI inflows, to US$28
bi l l ion. As a member nation of the BRICS, India has been cont inuing to
be a st rong performer in at t ract ing FDI. BRICS`s curr ent share of global
FDI f lows are 22%, which is as twice of i ts number before the financial
cr is is in 2007-08. In late 2012, 6 nat ions including India which are
ASEAN ’s FTA partners launched the negot iat ion of the Regional
Comprehensive Economic Partnership (RCEP) . According to UNCTAD4,
India has concluded negotiations with ASEAN on t rad e in services and
on investment on December 20, 2012. In addit ion, an FTA between EU
and India are under negotiation since 2007. This is expected to include a
substant ive investment protect ion chapter .
1.3. Discussion about FDI Impact on Economic
Growth
Although there are many theories about the FDI impact on economic
growth, many of them claim that FDI has a posit ive effect on host
countries ’ economic growth. Generally, FDI is considered to bring
various benefits such as technology development, increase of
employment , and expansion of internat ional networks and so on.
4 UNCTAD “ IIA Issues Note No. 3” (2013)

9
In the recent years , the posi t ive economic effect of FDI in both
host and home countries has come to be more and more appreciated.
According to Jun and Brewer5, The interest in the broader role of FDI in
sustainable development has been increased. As noted by Feldstein6,
there are several advantages that could be gained by the FDI host s tate.
Firs t ly, FDI would enable the t ransfer of technology. This type of
benefi t would especially work on technology that cannot be gained
through financial investments or t rade in goods and services. It would
also promote compet it ion in the domest ic input market . Secondly, the
recipients of FDI can gain employee t raining in terms of operating new
businesses that would contr ibute to human capital development . Thirdly,
the profits gained by FDI contr ibute to corporate tax revenues in the
host country.
It i s considered that the contribution of FDI to sustainable
development depend on combinat ions of project features and government
policies in any case. In order to improve the contributions , Jun and
Brewer7 s tate that a variety of publ ic sector inst i tut ions as well as
corporations could develop pol icies that wi ll increase the contr ibution.
5 Kwang W. Jun, Thomas L. Brewer and the World Bank “The Role of
Foreign Capi tal Flows in Sustainable Development ” (1997)
6 Martin Feldstein “Aspects of Global Economic Integrat ion : Out look for
the Future” (2000)
7 Kwang W. Jun, Thomas L. Brewer and the World Bank “The Role of
Foreign Capi tal Flows in Sustainable Development ” (1997)

10
This also includes host government policies . However, the host
government must be mindful of the potent ial ly harmful effects of FDI
projects . Jun and Brewer also ment ions as cited below. “ Improving the
contributions of foreign capital to sustainable development , however,
requires much more than simply increasing the amounts of foreign
investment in developing countries. I t also requires host government
policies that foster competi t ion (and control restr ict ive business
practices) wi thin the economy and that al low the diverse types of
internat ional transactions that are essential to the successful operat ion
of typical FDI projects . Such pol icies wi ll maximize the potent ially
benef icial contributions of FDI projects to sustainable development. ”7
1.4. Government of India FDI Policies
It could be said that FDI in India star ted with the establ ishment of East
India Company in 1600. After the Second World War, Japanese
companies s tarted to invest in the Indian market. Al though India has
been not iced as a huge market and dest inat ion of FDI, i ts government
policy towards FDI has went through many changes. The pol icy also
varies depending on each state government . After the independence of
India, the attention towards business of mult inational corporations
(MNCs) rose, especially for the policy makers . In 1965, an industr ial
policy was made allowing the MNCs to venture through technical
col laboration. Therefore, the government of India adopted a relat ively
l iberal stance by al lowing more equi ty.

11
The corruption has been considered as a major obstacle by the
MNCs when invest ing in India. As a whole nat ion, India ranked 142n d
out of 189 nations in the Ease of Doing Business Index8 in 2014. It i s
considered corrupt ion is st i l l large. In addi t ion, the federal ism is making
this issue more complex to the MNCs since the level of corruption
differs largely depending on each s tate (see Figure 1) . However, Aam
Aadmi Party (AAP), which is a s tate pol i t ical party based on Delhi
(NCR) put t ing up an ideology of anti -corruption, has won 28 out of 70
seats in the 2013 Delhi legislative assembly election. With no party
obtaining an overal l majority, the AAP emerged as the second largest
party in NCR. In the 2014 Indian general election (which was held to
consti tute the 16th Lok Sabha, elect ing members of parl iament for al l
543 parl iamentary const i tuencies of India. Run in nine phases from
Apri l 7 to May 12, 2014), the Bharat iya Janata Party (BJP) won 31.0%
of all votes and 282 (51.9%) of al l seats9. For resul ts of the national and
regional part ies by a ll iances , see the figure below (Figure 2) . It was the
fi rs t t ime s ince the 1984 Indian general elect ions that a s ingle party
winning enough seats without the support of other part ies. The BJP
parl iamentary leader Narendra Modi , who led a posit ive FDI policy as
the previous State Prime Minister of Gujarat , was sworn in as the 15th
Prime Minister of India on 26 May 2014.
8 World Bank “Doing Business 2015 Economy Profi le 201 5 India”
(2014)
9 Source: Election Commission of India “General Election to Lok Sabha
Trends & Result 2014”

12
Figure 1. State-Wise Corruption Index (2005)
Source: Transparency International Survey (2005)

13
Figure 2. Resul ts of the nat ional and regional part ies by al l iances
Source: Election Commission of India

14
Under the Foreign Exchange Management Act (FEMA), foreign
investment was introduced to India in 1991. The then Finance Minister
was Manmohan Singh (Singh was the previous Prime Minister) . In
September 2012, a new FDI pol icy in retail was introduced. This
allowed a ful l foreign investment in s ingle brand retai l , and 51% in
mult i brand retai l . Besides retai l , the government al lows FDI in
pharmaceut ical indust ry (100%), telecommunicat ion industry (100%),
and insurance industry (49%) amongst other industr ies . In the
Consolidated FDI Pol icy of the Department of Industrial Pol icy and
Promotion, Minist ry of Commerce and Industry, Government of India , i t
is wri t ten as below: “I t i s the intent and objective of the Government of
India to at tract and promote foreign direct investment in order to
supplement domestic capital , technology and skil ls , for accelerated
economic growth. Foreign Direct Investment , as dis t inguished from
port fol io investment , has the connotation of establ ishing a ‘ last ing
interest’ in an enterprise that is resident in an economy other than that
of the investor.”1 0
1.5. Why region-sector-wise India is the Subject
The Republ ic of India (see Figure 3) is a federat ion consist ing 29 states
(the 29t h
s tate Telangana was divided from Andhra Pradesh on June 2,
2014), and each of them owns a st rong autonomy. The divers if ication of
poli t ical part ies due to the rise of local part ies caused poli t ical
1 0
Government of India “Consol idated FDI Pol icy” [Chapter -1, 1 .1,
1.1.1] (Effective from Apri l 17, 2014)

15
decentralization of power. Therefore from 1990 onwards, the promotion
of industr ial policy, infrast ructure development , preparation of
educat ional facil i t ies, etc. has been carr ied out by each state government .
For instance in Gujarat , posi t ive FDI pol icies lead to a rapid economic
growth ( the then State Prime Minis ter was the current Federal Prime
Minister Narendra Modi) .
Figure 3. The Poli t ical Map of India
Source: www.mapsofindia.com (2014)

16
There are mainly two reasons why India was chosen as the subject
for this study. Firs t ly, India has been experiencing a rapid economic
growth since the 2000s (see Figure 4) . In the late 2000s, i t s growth rate
reached 7.5%, and this doubled the average income in a decade . As the
economy grew the FDI inflows have als o increased rapidly (see Figure
5). In addi t ion, a recent UNCTAD survey shows India as the second
most important FDI destination after China, especially for t ransnational
corporations from 2010 to 20121 1
. Therefore, India has been recognized
as a huge market and also as a destination of FDI among the world. It is
obvious that the s tudy about FDI towards India must be done further in
order to gain benefit for both the hos t and home invest ing countries .
Secondly, i t i s necessary to analyze the Indian FDI inflows region-wise
to implement an out -and-out develop of the Indian economy as a whole
nat ion. The current FDI towards India are concentrated to some regions
as shown in the table below (see Table 2) . As ment ioned in 1.4
Government of India FDI Pol icies and the previous paragraph , India`s
poli t ical s tatus is complex due to local pol i t ical part ies and corru ption.
Therefore, the Republ ic of India is recent ly experiencing a huge social -
economic t ransi t ion and development . This is why i t i s worth studying
on FDI towards India region -wise.
1 1
Source: Bhavya Malhotra “Foreign Direct Investment: Impact on
Indian Economy” (2014), p . 18

17
Figure 4. GDP per capi ta and GDP growth rate of India 1960-2012
Figure 5. Foreign Direct Investment net inflows 1960 -2012
-8-6-4-2024681012
0
200
400
600
800
1000
1200
1400
1600
18001
96
0
19
63
19
66
19
69
19
72
19
75
19
78
19
81
19
84
19
87
19
90
19
93
19
96
19
99
20
02
20
05
20
08
20
11
Source: World Development Indicators
GDP per capita (current US$)
GDP growth (annual %)
0
10000000000
20000000000
30000000000
40000000000
50000000000
Source: World Development Indicators
Foreign direct investment,net inflows (BoP, currentUS$)

18
Table 2. State-wise Number of Approvals and Amount Approved of FDI
August , 1991-December. 2004 (cited from “ Impact of FDI in India:
State-Wise Analysis in an Economic Framework ” by Vani Archana,
N.C.Nayak & P. Basu, 2014)
States/UTs No. of Approvals
FDI Approved (Rs. Mi l l ion)
Amt. of FDI Approved (US$. Mi l l ion)
Andhra. P 1296 116344.4 3055.12
Assam 19 14.95 0.48
Bihar 49 7397.05 180.18
Gujarat 1242 124625.1 3278.24
Haryana 882 38763.08 1020.38
Himachal . P 102 12266.45 309.43
J&K 5 84.1 2 .42
Karnataka 2649 190963.9 4837.22
Kera la 336 17815.42 446.69
Madhya . P 243 92714.08 2520.93
Maharashtra 5064 371077.9 9640.37
Manipur 2 31.85 0.89
Meghalaya 5 529.6 13.66
Naga land 2 36.8 1 .03
Or issa 141 82293.13 2355.78
Punjab 203 21303.54 534.98
Ra jasthan 344 29112.11 782.29
Tamil Nadu 2686 226512.9 5895.99
Tr ipura 4 30.88 0.74
Uttar . P 815 48365.63 1307.93
West Benga l 689 77971.3 2167.03
Chhatt i sgarh 48 6363.03 183.33
Jharkhand 81 1465.15 42.67
Uttaranchal 52 1256.49 38.66
Arunachal . P 2 110.6 3 .52
Chandigarh 86 3241.7 80.34
Delh i 2816 305226.3 8445.36
Goa 285 9993.78 251.93
Pondicherry 130 12861.53 313.74
Source: Minist ry of Commerce and Industry, Government of India

19
1.6. Literature Review
Although the studies on FDI determinants in the context of India
especially those which were analyzed s tate -wise are very l imited, there a
quite a few studies done on various regions. In this section, host
countries` economic determinants of FDI in previous studies would be
invest igated. Most of them conclude that the main determinants are
Market s ize (GDP), Labor cost , Infrast ructure, Currency value , Gross
Capital format ion (gross domestic investment), country r isk , inflat ion
rate, interest rate, growth rate, t rade openness rate (the percentage of
exports or imports in the nation ’s GDP), External debt , and so on. Below
are some of the major and recent s tudies.
Moosa (2002)1 2
surveys the theories of FDI, especially variables
that were not readi ly related to any of the theories at that t ime. Most of
the variables investigated in this s tudy could be included in the
UNCTAD`s classi f ication1 3
of the determinants of inward FDI shown in
the table below (Table 3) .
1 2
Imad A. Moosa “Foreign Direct Investment Theory, Evidence and
Practice” (2002)
1 3 UNCTAD “World Investment Report 2002 Transnational Corporations
and Export Compet it iveness ” (2002)

20
Table 3. The UNCTAD`s Classi fication of FDI Determinants
Determining var iables Examples
Po l ic y va r iables Tax pol ic y, t rade po l icy, p r iva t i za t ion pol ic y,
macroeconomic pol ic y
Business var iables Inves tment incent ives
Marke t - re la ted economic
de te rminants
Marke t s i ze , market g row th, marke t s t ruc ture
Resource - re la ted economic
de te rminants
Raw mate r ia ls , labor cos t , t echnolog y
Ef f ic ienc y- re la ted economic
de te rminants
Transport and communica t ion cos ts , labor
produc t ivi t y
Source: UNCTAD (2002)
Moosa and Cardak (2006)1 4
examined the determinants applying
analysis to cross -sectional data on 138 countries. The resul ts reveal
three robust determinants. Exports as a percentage of GDP, telephone
l ines per 1000 of the population, and country r i sk. As a conclusion, i t i s
stated that in developing countries with large economies, a high degree
of openness and low country r isk tend to be more successful that others
in at t racting FDI.
ÇEVIS and ÇAMURDAN (2007)1 5
developed an empirical
framework to es timate the economic determinants of FDI by adopting a
panel data set of 17 developing countries and t ransit ion economies for
1 4
Imad A. Moosa, Buly A. Cardak “The determinants of foreign direct
investment: An extreme bounds analysis” (2006)
1 5 Đsmail Çevis and Burak Çamurdan ”The Economic Determinants of
Foreign Direct Investment in Developing Countries and Transi t ion
Economies” (2007)

21
the period of 1989-2006. They used seven variables: the previous period
FDI ( the pull factor for new FDI), GDP growth (measures mar ket s ize) ,
wage (uni t labor costs) , t rade Rate (measures the openness of countr ies),
the real interest rates (measures macroeconomic policy) , inflation rate
(as country r isk and macroeconomic pol icy) , and domest ic investment
(business climate) . In this paper i t was found out that FDI of the
previous period which is di rect ly related to the hos countries` economic
resources is important as an economic determinant. In addi t ion, i t
revealed the main determinants are inflation rate, interest rate, growth
rate, and openness rate.
Azam and Lukman (2010)1 6
examined a various economic factors`
effects on FDI inflows in the context of Pakis tan, India, and Indonesia.
The study period ranged from 1971 -2005. The resul ts revealed that
market s ize, external debt , domestic investment , t rade openness , and
physical infrast ructure are the important determinants of FDI. It was
also concluded that the results of the determinants of India matched
those of Pakistan`s , excluding t rade openness and government
consumption. Finally, i t proposed that the management authori t ies of the
three countries need to ensure economic and pol i t ical s tabi l i ty,
provis ion of infrast ructure, peace and securi ty, law and order s i tuation,
encouragement of domest ic investment , curtail external debt , and equ al
importance be given to appropriate monetary and f iscal pol icy.
1 6
Muhammad Azam, Ling Lukman “Determinants of Foreign Direct
Investment in India, Indonesia and Pakis tan: A Quanti tat ive Approach”
(2010)
22
Vi jayakumar, Sridharan, and Rao (2010)1 7
implemented an
examinat ion concentrating on the FDI towards BRICs countr ies using
data from the period of 1975 -2007. The study f inds out that market s ize,
labor cost , infrast ructure, currency value and gross capital formation as
the potent ial determinants of FDI i nflows of BRICS countries. The
economic stabi l i ty and growth prospects (measured by inflat ion rate and
indust rial production respect ive ly) , t rade openness (measured by the
ratio of total t rade to GDP) seem ed to be the insignificant determinant
of FDI inflows of the BRICS countries.
In Maggon`s (2012)1 8
s tudy, i t is concluded that the boost FDI
inflows s ignificant ly depend on further l iberal izat ion of i ts foreign
investment regime.
The resul ts of the above mentioned empirical s tudies on the FDI
determinants are l isted in the fol lowing table (Table 4).
1 7
Narayanamurthy Vijayakumar, Perumal Sridharan, Kode Chandra
Sekhara Rao “Determinants of FDI in BRICS Countries: A panel
analysis” (2010)
1 8 Mohita Maggon “Economic and Pol icy Determinants of Foreign Direct
Investment : An Empirical Analysis in Context of India” (2012)

23
Table 4. The Resul ts of the Empirical Studies on the Determinants of
FDI
Empirical Studies The Determinants of FDI
UNCTAD (2002) Tax pol icy, t rade pol icy,
privat ization policy,
macroeconomic
policy, investment incent ives ,
market s ize, market growth,
market s t ructure, raw material s ,
labor cost , technology t ransport
and communicat ion costs , labor
product ivity.
Moosa and Cardak (2006) Exports as a percentage of GDP,
telephone l ines per 1000 of the
population, and country r isk.
ÇEVIS and ÇAMURDAN (2007) FDI inflows of the previous
period, inflat ion rate, interest
rate, growth rate, and openness
rate.
Azam and Lukman (2010) Market s ize, ex ternal debt ,
domest ic investment , t rade
openness , and physical
infrast ructure.
Vijayakumar, Sridharan, and Rao
(2010)
Market s ize, labor cost ,
infrast ructure, currency value
and gross capital format ion .
Maggon (2012) Liberal ization of i ts foreign
investment regime .
In this paper, the determinants of FDI towards India (data from the
period 2008-2013) would be examined region -wise, using s tate-wise data .
Sector-wise GDP would be used as a variable in order to analyze which
market being the s ignif icant determinant .
24
2. Data
2.1. Sample States, Union Territories, and Regions
24 states and Union Terri tories of the Republic of India were selected. It
consis ts Andhra Pradesh , Bihar , Chhatt isgarh , Goa, Gujarat , Haryana,
Himachal Pradesh, Jharkhand, Karnataka, Kerala, Madhya Pradesh,
Maharashtra, Odisha, Punjab, Rajasthan, Sikkim, Tamil Nadu, Uttar
Pradesh, Ut tarakhand, West Bengal , Andaman & Nicobar Is lands,
Chandigarh, Nat ional Capital Terri tory of India (Delhi ) , and Pondicherry.
12 states and Union Terri tories were excluded due to the reasons
mentioned below. The seven states of North -East India (Arunachal
Pradesh, Assam, Manipur, Meghalaya , Mizoram, Nagaland, and Tripura)
were excluded due to the lack of data. Jammu & Kashmir were
considered not appropriate for this s tudy because of the continuous
insecuri ty of the social s i tuation. Telangana, also due to the social
insecuri ty, but also since the s tate has just become independent from
Andhra Pradesh in 2014, currently no data ex is ts . In this paper, Andhra
Pradesh and Telangana would be considered as a s ingle state equal ly as
i t was unti l June 1, 2014. Three Union Terri tories (Dadra and Nagar
Havel i , Daman and Diu , and Lakshadweep) were considered that they do
not have a large s ize of economy enough to have an influence to FDI
inflows.
In order to implement the analysis , 15 s tates and Union Terri tories
among the selected 24 were divided into s ix groups as referred in the

25
fol lowing due to the form of FDI data compiled by the Department of
Industr ial Pol icy & Promotion, Government of India. 1 .Uttar Pradesh &
Uttarakhand, 2 .Tamil Nadu & Pondicherry, 3 .West Bengal , Sikkim, &
Andaman & Nicobar Is lands , 4 .Madhya Pradesh & Chhatt isgarh,
5.Punjab, Chandigarh, Haryana, & Himachal Pradesh, 6.Bihar &
Jharkhand. Thus, there are 15 target states , Union Terri tories and
regions as shown in the figure below . (Figure 6)
Figure 6. Geography of 15 Target States , Un ion Terri tories and Regions
(Nat ional Capi tal Terri tory of India: Delhi is not shown due to the s ize.)

26
2.2. Data Description and Theory
In this study, in order to analyze the determinants of FDI in India, ten
variables are included. Among them FDI is the explained variable, and
the other nine are explanatory variables. The ten variables are
considered as shown in Table 5 .
Table 5. List of Variables
Explanatory
Variable
Defini t ion The Direct ion
of Expected
Effect
Reasons for Inclusion
𝐺𝐷𝑃𝑖(𝑡−1) GDP (current
Indian Rupee in
crore)
None Indicates market s ize of
the whole s tate .
General ly i t i s considered
larger markets receive
more FDI.
GDPPC𝑖(𝑡−1) GDP per capi ta
(cur rent Indian
Rupee in crore)
+ Indicates ci t i zens ’
aff luence ( l iving
s tandard) and market
s ize .
𝐸𝑋𝑃𝐸𝑃𝐶𝑖(𝑡−6) Expendi ture on
educat ion per
capi ta (current
Indian Rupee in
crore)
None Indicates the qual i ty of
human capi tal . The
t ransfer of advanced
technology requires the
presence of human
capi tal .
𝐻𝐿𝑖(𝑡−1) Length of s tate
and nat ional
highways (km)
+ Indicates the s tate
capaci ty of FDI
acceptance in the context
of infrast ructure
development .
𝐻𝐷𝑖(𝑡−1) Highway dens i ty
(km per 100 sq .
km of land area )
+ Indicates infrast ructure
faci l i t ies , the ease of
implement ing business .
𝐺𝐷𝑃𝑆𝑖(𝑡−1) GDP of service
sector (current
Indian Rupee in
crore)
+ (expected to
have a
s ignif icant
effect . )
Indicates market s ize of
the te r t ia ry (serv ice)
sector.
𝐺𝐷𝑃𝑀𝑖(𝑡−1) GDP of mining
and quarrying
sector
+ or - ( in
resource - r ich
s tates )
Indicates market s ize of
the mining sec tor.

27
𝑇𝐸𝐿𝑖(𝑡−1) Number of
te lephones per
100 populat ions
+ Indicates infrast ructure
faci l i t ies , the ease of
implement ing business .
𝑁𝐺𝑃𝑖(𝑡−1) Amount of
natural gas
produced
(mi l l ion metr ic
s tandard cubic
meters)
+ Indicates resource related
economic de terminants .
Response Variable Defini t ion
𝐹𝐷𝐼𝑖𝑡 FDI (current Indian Rupee in crore)
e.g. : 𝐺𝐷𝑃𝑖(𝑡−1) s tand for the GDP of state s or Union Terri tory or region
(here, the states that were divided in s ix groups) i at t ime t -1 .
Data source
GDP: Ministry of Stat is t ics and Programme Implementat ion
GDP per capita: Ministry of Stat is t ics and Programme Implementat ion,
Minis try of Home Af fairs
Expendi ture on education per capita : Budget documents of the s tate
governments , Minis try of Home Affairs
Length of s tate and nat ional highways: Ministry of Road Transport &
Highways
Highway density: Ministry of Road Transport & Highways, Minis try of
Home Affairs
GDP of service sector: Planning Commission Government of India
GDP of mining and quarrying sector : Planning Commission Government
of India
Number of telephone per 100 populations: Department of
Telecommunications Ministry of Communicat ions & Information
Technology
Amount of natural gas produced: Ministry of Petroleum & Natural Gas
Economics and Statist ics Division
FDI: Department of Industrial Pol icy & Promotion Ministry of
Commerce & Industry

28
The used FDI data are of 2008-2013, while GDP, GDP per capi ta ,
Length of s tate and nat ional highways , Highway density, GDP of service
sector , GDP of mining and quarrying sector , Number of telephone per
100 populations , and Amount of natural gas produced are t ime lagged
for minus one year , thus these data are of 2007 -2012. Expendi ture on
educat ion per capi ta are t ime lagged for minus s ix years , from 2002 -
2007.

29
3. Model and Method
The objective of this study is to reveal which factors are the s ignificant
determinants to the FDI inflow, and to f igure out on which
ci rcumstances (on which s tates , or regions with what kind of
environment) those determinants could be appl ied. In this paper, a
mult iple regression model would be used for the analysis . It i s based on
cross-state analysis using ordinary least square method (OLS).
Since the purpose of this s tudy is to analyze the FDI determinants
in India region and sector wisely, the states and Union Terri tories are
grouped and analyzed in f ive ways mentioned below: 1.All India
2.Resource-r ich states (minerals) 3.Resource -rich s tates (natural gas)
4.BJP administ rating regions 5.State owned enterprises (SOEs) abundant
regions.
3.1. Model Building
The model could be wri t ten as below.
𝐹𝐷𝐼𝑖𝑡 = 𝑎0 + 𝑎1𝐺𝐷𝑃𝑖(𝑡−1) + 𝑎2 𝐺𝐷𝑃𝑃𝐶𝑖(𝑡−1) + 𝑎3𝐸𝑋𝑃𝐸𝑃𝐶𝑖(𝑡−6)
+ 𝑎4𝐻𝐿𝑖(𝑡−1) + 𝑎5𝐻𝐷𝑖(𝑡−1) + 𝑎6𝐺𝐷𝑃𝑆𝑖(𝑡−1) + 𝑎7𝐺𝐷𝑃𝑀𝑖(𝑡−1)
+ 𝑎8𝑇𝐸𝐿𝑖(𝑡−1) + 𝑎9𝑁𝐺𝑃𝑖(𝑡−1) + 𝑒𝑖𝑡
The model used by Moosa and Cardak (2006) is as the following.

30
FDIi = α0 + ∑ αjXji
n
j=1
+ εi
Where FDIi is foreign direct investment inflow to the country i as the
variable, Xji the jth variable of country i. In the Moosa and Cardak
(2006) model , variables such as GDP, GDP per capita , wages, t rade
barriers , growth rate, t rade defici t exchange rate, tax rate etc… In this
paper, the model includes nine explanatory economic variables . They are
GDP, GDP per capi ta, expendi ture on educat ion per capi ta , length of s tate
and nat ional highways , highway densi ty , GDP of service sector , GDP of
mining and quarrying sector , number of te lephones per 100 populat ions , and
amount of natural gas produced (among them one variable: NGP are used
only in analysis on r esource-r ich states <natural gas>).
In the Moosa and Cardak (2006) model , as for telecommunication
infrast ructure indicator telephone l ines per 1000 of the population are
used. In this model , the number of telephones per 100 populations would
be used instead. As for another indicator of infrast ructure , length of
state and national highways and highway d ensi ty would be used. Both
GDP and GDP per capi ta are included not only to measure the market
size, but also to indicate the individuals’ l iving standard. Expenditure
on educat ion per capi ta is t ime lagged for minus six years s ince the
effect of education take more t ime to affect the human capita l
economically. In order to analyze the determinants sector -wise, GDP of

31
service sector, GDP of mining and quarrying sector , and amount of
natural gas are included as an explanatory variable .

32
4. Results and Analyses
The resul t of the regression analysis (see Appendix) shows that the
coefficients are suff iced for al l the analysis done among all the groups.
Therefore, i t could be said that the equation is appropriate and
conclusive in explaining the determinan ts of FDI. The resul ts show that
in most cases , the variables used in this s tudy ( excluding expenditure on
educat ion per capi ta) could be regarded as determinants of FDI in the
context of India. In the fol lowing sect ion, the determinants would be
analyzed.
4.1. Results and Analyses on Explanatory Variables
GDP : In al l cases , the s tate ’s market size of the init ial year showed a
negat ive interrelation or had no correlation with the FDI. It could be
concluded that in the recent years , the FDI toward India are not focusing
on the whole Indian market .
GDP per capita : It showed a posit ive relat ion with the FDI excluding
the rich-resourced regions which produces a huge amount of natural gas .
From this result , i t i s revealed that in r ich -resourced regions, the FDI
are mainly focusing on the raw materials , rather than the market . In
other s tates , i t could be concluded that a large rat io of FDI are focused
on the local market .

33
Expenditure on education per capita : In all cases i t did not have any
relat ion with FDI. It reveals that FDIs which t ransfers advanced
technology only occupies a fraction of the whole FDI inflow.
Length of state and national highways : It showed a posit ive relation,
excluding the r ich -resourced region. This reveals that the capaci ty of
developing infrast ructure could be considered as a s ignif icant
determinant of FDI.
Highway density : It did not show any posit ive effect . This result could
be regarded as a resul t of the rapid growth of the tert iary sector , which
requires few transportat ion infrast ructures .
GDP of service sector : It showed a signif icant posi t ive relat ion in all
cases . It reveals that on al l regions in India, the FDI are focused on the
tert iary sector .
GDP of mining and quarrying sector : It showed a negat ive relat ion
only in the region which possess natural gas , and in other regions i t did
not have any correlation . It i s considered that this result i s caused by
India’s unique energy environment . In many r ich -resourced regions, the
government owned public corporations are the dominant actors. This
makes the foreign energy enterprises reluctant to advance to India.
Number of telephones per 100 populations : It showed a posi t ive
relat ion in most cases. This could be considered as a resul t of the rapid
growth of the GDP per capi ta and the GDP of service sector .

34
Amount of natural gas produced : Showed a posit ive relat ion (analyzed
only in r ich-resourced <natural gas> region). Combined with the result
of GDP of mining and quarrying sector , i t reveals that many foreign
enterprises focus on the resource, but does not invest di rectly to produce
materials.

35
概要
回帰統計
重相関 R 0.87311
重決定 R2 0.76232
補正 R2 0.738846
標準誤差 6233.438
観測数 90
分散分析表
自由度 変動 分散観測された分散比有意 F
回帰 8 1.01E+10 1.26E+09 32.47438 3.1E-22
残差 81 3.15E+09 38855749
合計 89 1.32E+10
係数 標準誤差 t P-値 下限 95%上限 95%下限 95.0%上限 95.0%
切片 -7971.66 2603.828 -3.06151 0.002988 -13152.5 -2790.86 -13152.5 -2790.86
GDP -0.08188 0.009514 -8.60615 4.78E-13 -0.1008 -0.06295 -0.1008 -0.06295
GDPPC 968351 474649.8 2.040138 0.044595 23946.72 1912755 23946.72 1912755
EXPEPC -6.6E+07 1.14E+08 -0.57819 0.56474 -2.9E+08 1.61E+08 -2.9E+08 1.61E+08
HL 0.684636 0.131923 5.189669 1.53E-06 0.422151 0.947121 0.422151 0.947121
HD -8037.95 2411.56 -3.33309 0.001297 -12836.2 -3239.7 -12836.2 -3239.7
GDPS 0.228197 0.023999 9.508404 7.87E-15 0.180445 0.275948 0.180445 0.275948
GDPM 0.027057 0.116934 0.23139 0.817595 -0.2056 0.259718 -0.2056 0.259718
TEL 59.63302 26.20715 2.275449 0.025521 7.489017 111.777 7.489017 111.777
4.2. Results and Analyses on States, Union
Territories, and Regions
All India analysis (see Table 6): It revealed that general ly in India, the
market s ize of the service sector in the init ial year has a signif icant
posi t ive relat ion with FDI inflows. On the contrary, the whole market
size of each state in the init ial year has a negat ive re lation. In addi t ion,
the highway length also had a posit ive relat ion while the highway
density had a negat ive relation. This could be explained by the foreign
enterprises’ focus on the service sector since i t does not require much
transport infrast ructure.
Table 6. Al l India analysis

36
概要
回帰統計
重相関 R 0.904179
重決定 R2 0.817539
補正 R2 0.788918
標準誤差 5603.063
観測数 60
分散分析表
自由度 変動 分散観測された分散比有意 F
回帰 8 7.17E+09 8.97E+08 28.564 2.8E-16
残差 51 1.6E+09 31394309
合計 59 8.78E+09
係数 標準誤差 t P-値 下限 95%上限 95%下限 95.0%上限 95.0%
切片 -8177.47 5134.316 -1.59271 0.117406 -18485 2130.103 -18485 2130.103
GDP -0.05278 0.020136 -2.62138 0.011514 -0.09321 -0.01236 -0.09321 -0.01236
GDPPC 919687.5 578333.4 1.590238 0.117962 -241365 2080740 -241365 2080740
EXPEPC -7.5E+07 1.39E+08 -0.53693 0.593648 -3.5E+08 2.04E+08 -3.5E+08 2.04E+08
HL 0.555429 0.178456 3.112407 0.003039 0.197163 0.913695 0.197163 0.913695
HD -2701.93 4925.482 -0.54856 0.5857 -12590.2 7186.388 -12590.2 7186.388
GDPS 0.170465 0.044727 3.811221 0.000374 0.080672 0.260259 0.080672 0.260259
GDPM -0.03725 0.369507 -0.10081 0.920096 -0.77907 0.704566 -0.77907 0.704566
TEL -28.5784 63.49682 -0.45008 0.654562 -156.054 98.89675 -156.054 98.89675
Resource-rich states (minerals) analysis (see Table 7): Although not as
significant as other analyses , i t showed a posi t ive relation with the
market s ize of the service sector . In addit ion, the i rrelativeness of the
market s ize of the mining sector and FDI inflow s is notable. This could
be explained by the dominance of the publ ic corporat ions that are owned
by the government of India as ment ioned above.
Table 7. Resource-rich states (minerals) analysis

37
概要
回帰統計
重相関 R 0.875855
重決定 R2 0.767121
補正 R2 0.662326
標準誤差 2238.099
観測数 30
分散分析表
自由度 変動 分散観測された分散比有意 F
回帰 9 3.3E+08 36667432 7.320181 0.000112
残差 20 1E+08 5009088
合計 29 4.3E+08
係数 標準誤差 t P-値 下限 95%上限 95%下限 95.0%上限 95.0%
切片 12755.51 8286.098 1.539386 0.139383 -4528.99 30040 -4528.99 30040
GDP 0.010354 0.02452 0.422286 0.677321 -0.04079 0.061502 -0.04079 0.061502
GDPPC -4307819 1884072 -2.28644 0.033268 -8237925 -377713 -8237925 -377713
EXPEPC 1.35E+08 2.63E+08 0.513456 0.613258 -4.1E+08 6.82E+08 -4.1E+08 6.82E+08
HL -0.29078 0.361281 -0.80485 0.430371 -1.04439 0.462841 -1.04439 0.462841
HD -6335.9 6423.39 -0.98638 0.335731 -19734.9 7063.059 -19734.9 7063.059
GDPS 0.024512 0.042935 0.57092 0.574414 -0.06505 0.114072 -0.06505 0.114072
GDPM -1.01678 0.568808 -1.78756 0.089012 -2.20329 0.169735 -2.20329 0.169735
TEL 257.5252 75.13689 3.427413 0.002667 100.7923 414.258 100.7923 414.258
NGP 8.823731 2.903508 3.038989 0.006481 2.767119 14.88034 2.767119 14.88034
Resource-rich states (natural gas) analysis (see Table 8): It is
remarkable that the amount of natural gas produced had a posit ive
relat ion with FDI inflows. As ment ioned above, i t could be considered
that many foreign enterprises focus on the resource.
Table 8. Resource-rich states (natural gas) analysis

38
概要
回帰統計
重相関 R 0.762284
重決定 R2 0.581077
補正 R2 0.456952
標準誤差 1762.957
観測数 36
分散分析表
自由度 変動 分散観測された分散比有意 F
回帰 8 1.16E+08 14549800 4.681374 0.001118
残差 27 83916513 3108019
合計 35 2E+08
係数 標準誤差 t P-値 下限 95%上限 95%下限 95.0%上限 95.0%
切片 -1241.84 3187.715 -0.38957 0.699909 -7782.49 5298.809 -7782.49 5298.809
GDP 0.001462 0.018272 0.079987 0.936838 -0.03603 0.038953 -0.03603 0.038953
GDPPC -190159 327099.6 -0.58135 0.565827 -861312 480993.7 -861312 480993.7
EXPEPC -2.5E+07 67562730 -0.36504 0.717922 -1.6E+08 1.14E+08 -1.6E+08 1.14E+08
HL 0.364747 0.165072 2.20963 0.035797 0.026048 0.703446 0.026048 0.703446
HD 4290.464 2092.354 2.050544 0.050134 -2.69138 8583.618 -2.69138 8583.618
GDPS -0.02613 0.064145 -0.40731 0.68699 -0.15774 0.105487 -0.15774 0.105487
GDPM -0.29328 0.301933 -0.97132 0.340008 -0.91279 0.32624 -0.91279 0.32624
TEL 23.74351 35.51199 0.668605 0.509424 -49.1211 96.60811 -49.1211 96.60811
BJP administrating regions (see Table 9): Al though the highway length
and the market s ize of the service sector showed a posi t ive relat ion, i t
did not show other notable resul ts . It could be concluded that further
state-wise research of the relat ion between s tate part ies’ FDI pol icy and
FDI inflows are required.
Table 9. BJP administrating regions
39
概要
回帰統計
重相関 R 0.919616
重決定 R2 0.845693
補正 R2 0.81826
標準誤差 5502.25
観測数 54
分散分析表
自由度 変動 分散観測された分散比有意 F
回帰 8 7.47E+09 9.33E+08 30.82824 8.3E-16
残差 45 1.36E+09 30274754
合計 53 8.83E+09
係数 標準誤差 t P-値 下限 95%上限 95%下限 95.0%上限 95.0%
切片 -6133.82 3654.51 -1.67843 0.100196 -13494.4 1226.737 -13494.4 1226.737
GDP -0.07944 0.022328 -3.55774 0.000895 -0.12441 -0.03447 -0.12441 -0.03447
GDPPC 765905.3 1097211 0.698047 0.488739 -1443992 2975803 -1443992 2975803
EXPEPC 1.4E+08 2.29E+08 0.611753 0.54378 -3.2E+08 6E+08 -3.2E+08 6E+08
HL 0.824847 0.174912 4.715792 2.35E-05 0.472557 1.177137 0.472557 1.177137
HD -12022.7 5118.663 -2.34879 0.023286 -22332.2 -1713.15 -22332.2 -1713.15
GDPS 0.216721 0.052934 4.094183 0.000174 0.110107 0.323335 0.110107 0.323335
GDPM 0.015683 0.196598 0.079771 0.936773 -0.38029 0.411652 -0.38029 0.411652
TEL 42.2738 96.38442 0.438596 0.663053 -151.854 236.402 -151.854 236.402
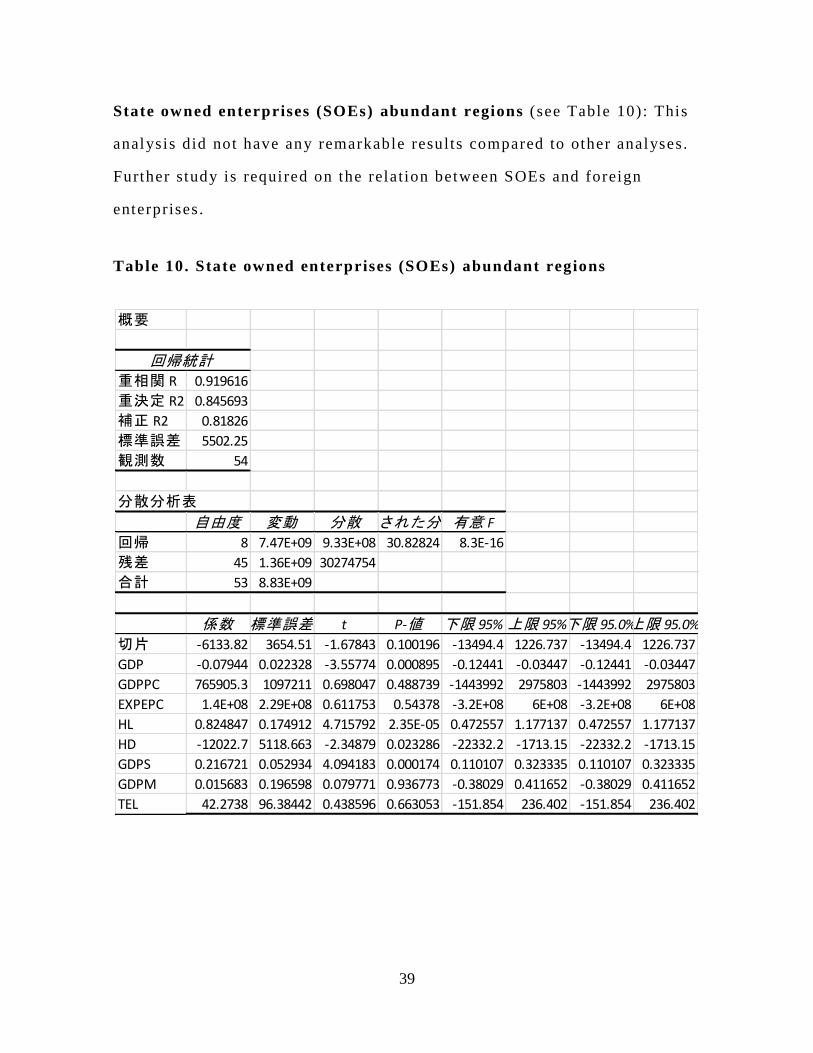
State owned enterprises (SOEs) abundant regions (see Table 10): This
analysis did not have any remarkable results compared to other analyses .
Further study is required on the relation between SOEs and foreign
enterprises .
Table 10. State owned enterprises (SOEs) abundant regions
40
5. Conclusion
The purpose of this study was to examine the determinants of inward
FDI in India region and sector wisely, by regression analysis. The FDI
data consis ts of 24 s tate and Union Terri tories , in the period of 2008 -
2013. In the model there were nine explanatory variables. They are,
respect ively, GDP, GDP per capita , expenditure on educat ion per capi ta ,
length of state and national highways , highway densi ty, GDP of service
sector , GDP of mining and quarrying sector , n umber of telephones per
100 populations , and amount of natural gas produced .
The resul ts of the analysis show that generally FDI in India is
related posi t ively with GDP per capita , length of s tate and national
highways, GDP of service sector , number of telephones per 100
populations, and amount of natural gas produced. Especial ly the resul ts
revealed that the FDI inflows have a signif icant relation with the market
size of the service sector of the ini t ial year .
41
6. References
Vani Archana, N.C.Nayak & P. Basu (2014), “Impact of FDI in India:
State-Wise Analysis in an Economic Framework”
Ashok Kundra (2009), “ India-China a Comparative Analysis of FDI
Pol icy and Performance”
Muhammad Azam, Ling Lukman (2010) , “Determinants of Foreign
Direct Investment in India, Indonesia and Pakistan: A Quant itat ive
Approach”
Đsmail Çevis and Burak Çamurdan (2007), “The Economic Determinants
of Foreign Direct Investment in Developing Countries and Transit ion
Economies”
Dipanjan Roy Chaudhury (2014) , “India, Japan Sign Key Agreements; to
Share ‘Special Strategic Global Partnership’” The Economic Times,
September 2, 2014
Election Commission of India (2014), “General Election to Loksabha
Trend and Resul t 2014”. 16 May 2014
Mart in Feldstein (2000), “Aspects of Global Economic Integration:
Out look for the Future,” NBER Working Paper No. 7899 (Cambridge,
Massachusetts: Nat ional Bureau of Economic Research)

42
Government of India (2014), “Consolidated FDI Policy” [Chapter -1, 1 .1,
1.1 .1] (Effective from Apri l 17, 2014)
IMF (1993), “Balance of Payments Manual : Fif th Edi tion (BPM5)”
Jun & Brewer (1997) , “The Role of Foreign Capi tal Flows in Sustainable
Development”
JETRO (2007), “ India States Abstract”
Prakash Loungani and Assaf (2001), “How Beneficial Is Foreign Direct
Investment for Developing Countr ies? ( IMF) Finance & Development”
URL: ht tp: / /www.imf.org/external /pubs/f t / fandd/2001/06/loungani.htm
Mohita Maggon (2012), “Economic and Pol icy Determinants of Foreign
Direct Investment : An Empirical Analysis in Context of India”
Bhavya Malhotra (2014) , “Foreign Direct Investment: Impact on Indian
Economy”, p . 18
Imad A. Moosa (2002) , “Foreign Direct Investment Th eory, Evidence
and Pract ice”
Imad A. Moosa, Buly A. Cardak (2006) , “The Determinants of Foreign
Direct Investment : An Extreme Bounds Analysis”
OECD (1996), “Deta iled Benchmark Defini t ion of Foreign Direct
Investment : Third Edi tion (BD3)”

43
OECD (2001), SNA 1.128 and 2.173-2.174
OECD (2002), “Foreign Direct Investment for Development ”
OECD (2008) , “OECD Glossary of Stat is t ical Terms”
K.S. Chalapat i Rao, Biswaji t Dhar (2011), “ India`s FDI Inflows Trends ”
and Concepts
UNCTAD (1999), “Foreign Direct Investment”
UNCTAD (2002), “World Investment Report 2002 Transnat ional
Corporat ions and Export Compet it iveness”
UNCTAD (2013), “IIA Issues Note No. 3”
UNCTAD (2014), “Global Investment Trends Monitor No. 15”
Narayanamurthy Vijayakumar, Perumal Sridharan, Kode Chandra
Sekhara Rao (2010) , “Determinants of FDI in BRICS Countries : A panel
analysis”
World Bank (2014), “Doing Business 2015 Economy Profi le 2015 India”