determinants of food price inflation in pakistaneuacademic.org/uploadarticle/365.pdf ·...
TRANSCRIPT
5213
ISSN 2286-4822
www.euacademic.org
EUROPEAN ACADEMIC RESEARCH
Vol. I, Issue 12/ March 2014
Impact Factor: 3.1 (UIF)
DRJI Value: 5.9 (B+)
Determinants of Food Price Inflation in Pakistan
SAIRA ANAM Department of Commerce and Finance
Superior University, Lahore
Pakistan
ALLAH RAKHA Department of Commerce and Finance
Superior University, Lahore
Pakistan
ZEESHAN FAREED Department of Management Sciences
COMSATS Institute of Information Technology
Sahiwal, Pakistan
Abstract:
This study describes the impact on food price inflation in
Pakistan due to food export, food import & population. It is
quantitative research paper, all the data about variables is taken from
1962 to 2012 from WDI. Due to high rise in prices the poor become
poorer & it dishearten them, their 50 % of the earning goes on food.
Due to increase in production in PCI (per capita income) & growth, the
household expenditure is rising. In Pakistan there is limited marketing
for the food that are unpreserved able & a lack of cold storage for food
preservation. So prices rise when greater demand for products or less
supply. According to Sharif et al. (2000), in Pakistan, there is greater
financial loss to State with respect to community revenue that is to be
together by the way of excise & duties by the government, when the
Pakistan to Afghanistan & Pakistan to Iran unlawfully goods (
agriculture & other) are bought and sold. Multiple regression is used
to test the variables. There is significant & positive impact of food
export, food import & population on Food price inflation. From
Correlation analysis there is positive & moderate correlation between
FPI & food export, Food import & population have positive but weak
correlation with FPI. The results show that both supply & demand
Saira Anam, Allah Rakha, Zeeshan Fareed- Determinants of Food Price Inflation
in Pakistan
EUROPEAN ACADEMIC RESEARCH - Vol. I, Issue 12 / March 2014
5214
sides are responsible for creating Food price inflation. Research Gap
shows that the sample size is 1972-2008 according to Abdullah, M. U.
H. A. M. M. A. D., & Kalim, R. (2009), but this study conducted the
research for 50 years & also considered the effect of population on FPI
according to Naz, A., Chaudhry, H. U. R., Hussain, M., Daraz, U., &
Khan, W. (2012).
Key words: Inflation, Food export, Food import, Population per
capita, GDP, Food price inflation.
1. Introduction:
This topic describes the impact of food export, food import,
population, money supply & per capita income on food price
inflation. FPI means there is increase in price of particular food
item that is also called consumer price inflation. The total
number of people live in a region is called population. Food
export means the goods that are required by another country.
Food import means the goods are required by home country.
Per capita GDP it is an indicator of nation’s economic
performance, as well as standard of living & sometimes its
calculated by adding each other’s income in a particular period
& sometimes calculated by adding the value of final goods in a
nation. Now days in the worldwide the rate of food price
inflation is increasing. In the world wide 6th November 2009,
the whole inflation & FPI rate is 16.5 % & 30.2 % reported by
Commodity Research Bureau (2009). In the world in different
nations, the rate of FPI is carry on. The vital obstacle in the
way of high demand & food price is due to decrease in poverty
& enhance the per capita income. By the rise in income level
then the nutritional way of life vary, their expenses towards
meat & food get higher. For instance, according to Abhayaratne
and Kasturi, (2008), in 1985 the per capita expenditure of meat
of 20 kilo gram & in 2007 rise up to 50 kilo gram in China.
From 2000 -2005, 17 % rise in morsel expenditure in “oil
Saira Anam, Allah Rakha, Zeeshan Fareed- Determinants of Food Price Inflation
in Pakistan
EUROPEAN ACADEMIC RESEARCH - Vol. I, Issue 12 / March 2014
5215
producing & exporting nations” for the reason of large earning
from selling to other countries (World Bank 2007). The rise in
inflation destroys the assessment of private agents towards,
outflow of capital, deposits, and salary agreements. Due to rise
in inflation level the pace of economic growth decreases.
Increase in food rates is due to major requirement of Bio fuel in
prosperous nations. According to IFPRI (2007), there is an
association between food and as well as power rates from the
time when 2000, 3 times increase in wheat & oil rates and 2
times increase in rates of rice & corn. The livelihood rate of the
family circle is rise in less developed countries by the rise in
food prices. Family circle has to decrease the expenditure on
food in some portion by the rise in food prices that bring
starvation. According to Alderman (2005), in life span the
productivity loss due to starvation that is 10 % & in badly
affected nations the Gross domestic product loss is 2 to 3 %.
Due to high rise in prices, it eats into the advantages of
production & makes the poor inferior (Esterly and Fischer
2001). Due to high rise in prices the poor become poorer & it
dishearten them, their 50 % of the earning goes towards food.
According to Khan et al. (2007), raise the space in wealthy &
deprived, it reallocates profit from the unchanging group of
income towards the asset’s owner plus business owner. In
Pakistan few elements are responsible in the way of food price
inflation. Due to increase in production in PCI (per capita
income) & growth, the household expenditure is rising. In
Pakistan there is limited marketing for the food that are
unpreserved able & a lack of cold storage for food preservation.
So prices rise when greater demand for a products or less
supply. According to Sharif et al. (2000), in Pakistan, there is
greater financial loss to State with respect to community
revenue that is to be together by the way of excise & duties by
the govt., when the Pakistan to Afghanistan & Pakistan to Iran
unlawfully goods (agriculture & other) are buy & sell. From
1997 to 2008 & 2003 to 2004, it’s less than 10 percent & from
Saira Anam, Allah Rakha, Zeeshan Fareed- Determinants of Food Price Inflation
in Pakistan
EUROPEAN ACADEMIC RESEARCH - Vol. I, Issue 12 / March 2014
5216
1972-2008, the FPI is 9.9 percent in Pakistan. From the year
2003 to 2004 it’s go faster & in 2004 to 2005 its rise up to 12.5
percent. From the year 2007 to 2008 its rate is 17.5 % & from
2008 to 2009 its rate is 26.6 percent. It’s reported by the GOP
from 2007 to 2009, the increase in food prices is due to increase
in foreign food rates & oil rates, due to rise in eatable items like
rice, cooking oil, meat, pulses, tea, milk, vegetables, fruits &
due to decrease in wheat supply & as well as rise in wheat
support prices. Rise in food prices is a point of discussion for
planners. The basic aim of this paper is to discover the relation
between other factors (food export, food import, per capita GDP,
population, money), that rise in food prices. It is necessary to
make the policy of income & expenditure for the elements that
creates rise in prices. According to Friedman (1963), the rise in
price is a monetary event. But according to others supply side
expansion is used in defining rise in prices. The rise in price is
considered due to wheat support prices in Pakistan. But if the
rise in price is considered as monetary event then the SBP &
financial system are accountable for balanced price level. When
the rise is wheat support prices then there is a prime
participation of the “ministry of Agriculture” in creating
inflation. The PASSCO (Pakistan agriculture storage &
Supplies Corporation) & the provinces acquire the wheat, grip
the equipped & planned reserves in order to be able to steady
the home wheat market when supply problem occur. The
wheat is imported in order to fulfill nation’s needs by the TCP
(trading corporation of Pakistan). The CPI (consumer price
index) contains 0.5 % of the wheat & contains other interrelated
products with wheat are 5.1 %. Natural utilization of resources
is raised when there is rise in population growth. When
population raises then food & material needs raised, they have
to be get residence, living needs & nourishment. Natural
resources become unproductive by rising consumption of land &
resources that result in financial adversity. Particularly, the
increase in populace is creating difficulty & requires a lot of
Saira Anam, Allah Rakha, Zeeshan Fareed- Determinants of Food Price Inflation
in Pakistan
EUROPEAN ACADEMIC RESEARCH - Vol. I, Issue 12 / March 2014
5217
investment in societal infrastructure. Lack of investment, the
societal background such as living, transportation, housing, and
schooling is declining. The worldwide increase in population
rate is 80 percent, at the end of 2011, the 7 billion rises which is
more than 2 times from 1956 & expected to be rise in 2050 at
9.3 billion. The worldwide population determines the carrying
ability of the earth, choosing the best living style, financial
resources to consume resources & technology available. For
societal & economic planning the proper data of population is
necessary. It’s impossible for state to give proper services &
infrastructure until it has all information regarding, population
age, where they live, their age, occupation, how much they have
child, data of married & unmarried, educated & uneducated,
migration, birth & death rate etc.
All the data related with food export, food import, money
supply, per capita GDP , population & food price inflation is
taken from WDI from 1962- 2012. The food price inflation is
used in the place of consumer price inflation. All analysis is
done through data. All data is only taken from Pakistan that is
the limitation of the paper.
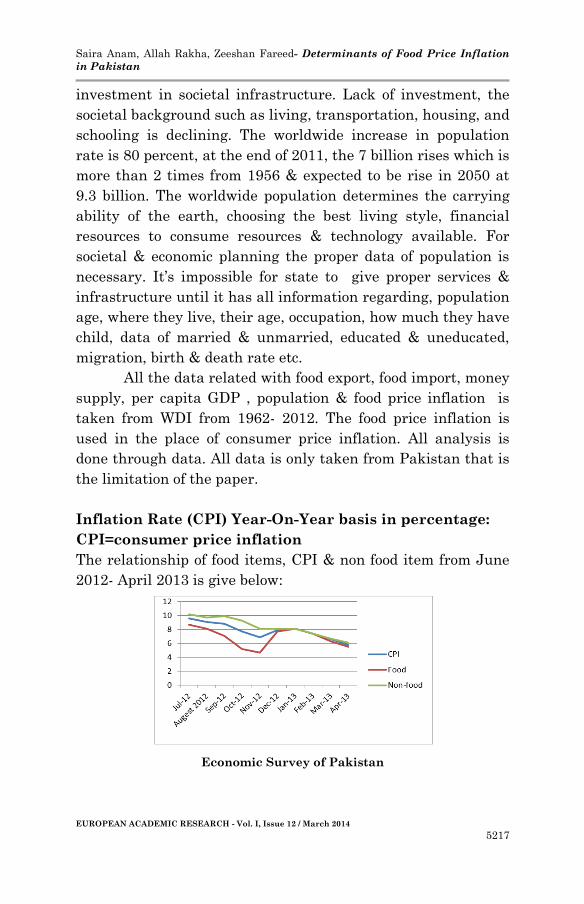
Inflation Rate (CPI) Year-On-Year basis in percentage:
CPI=consumer price inflation
The relationship of food items, CPI & non food item from June
2012- April 2013 is give below:
Economic Survey of Pakistan
Saira Anam, Allah Rakha, Zeeshan Fareed- Determinants of Food Price Inflation
in Pakistan
EUROPEAN ACADEMIC RESEARCH - Vol. I, Issue 12 / March 2014
5218
2. Literature Review:
Demand side & as well as supply sides are 2 major elements of
rise in price & comes in 2 approaches such as monetarist plus
structuralist. According to monetarist point of view, it has its
own theoretical base on QTM that is part of classical economic
theory that was given by Friedman (1968, 1970 & 1971). The
important declaration of this theory is “rise in price is a
monetary phenomenon”, it is numerically tested by Schwartz
(1973). According to monetarist approach that rise in prices due
to rise in supply of money by assuming that the balance of real
money, rational of economic agent & output do not change.
According to Structuralist model of rise in prices that says
supply side elements (eatable items rates, salaries, rates of
imports & support prices) are responsible for rise in price.
Streeten (1962), Olivera (1964), Baumol (1967) and Maynard
and Rijckeghem (1976) support the Structuralist approach. In
India, the advantages of structuralist approach are favored by
Bhattacharia and Lodh (1990). In India, for rise in prices
modeling through error correction specification, this
structuralist approach is used by Balkrishnan (1992), his
opinion is that in industrial region the input cost & workers are
the important elements of rise in prices. Prices of food grains
are measured by per capita output, per capita income & as well
as Govt. procurement in farming region. According to
Balkrishnan (1994), the monetarist approach is not good than
structural approach. The wide ranging rise in price & food rise
in prices is individually considered by Khan and Qasim (1996).
According to them, the rise in price is correlated with supply of
money (M2), GDP (real) & import prices, there is a positive
relationship of M2, import prices on rise in prices, but there is a
negative relationship of GDP (real) with rise in prices, they
suggest that FPI has a long relationship with M2. The food rise
in prices & inflation is observed by Khan and Qasim (1996)
separately, according to their research the real gross domestic
Saira Anam, Allah Rakha, Zeeshan Fareed- Determinants of Food Price Inflation
in Pakistan
EUROPEAN ACADEMIC RESEARCH - Vol. I, Issue 12 / March 2014
5219
product, rate of imports & money supply M2 are co integrated
with inflation. There is a positive relationship between money
supply & inflation, but there is a negative relationship of gross
domestic product with inflation, their study shows that there is
a long run relationship of rise in price with M2 ( money
supply). FPI has positive association with M2 & wheat rates
but FDI has negative association with farming output.
According to Hasan et al. (2005), from the 5 components of WPI,
they observed 3 components such as manufacturing, input (raw
material) & food items but the other 2 components are
considered as exogenous these 2 components are building
material & energy. According to their results, the FPI is
negatively affected by supply such as growth of farming items.
There is a greater significant & positive effect on FPI by wheat
support rates & prediction about future rise in prices, there is
insignificant impact of M2 (supply of money) or monetary policy
on farming food prices. There is a significant impact of M2 or
monetary policy on raw material & manufacturing. Monetary
elements show the rise in price in Pakistan, (Khan and
Schimimelpfenning 2006). The rise in prices is occurring mainly
due to credit production in private region & as well as broad
money growth, there is short span rise in prices due to support
prices. The monetary distress has a short span effect on
farming prices, (Tweeten 1980). According to Devadoss and
Meyers (1987) that affect of manufacturing items rates is less
than farming rates. According to Saghaian et al. (2002), change
in M2 (money supply) in United States of America, to a change
in money supply in the U.S.A. the money neutrality does not
grip the purpose of farming prices in United States but it is
discarded by Xuehua et al. (2004) and Bruno et al. (2005) that
the food rates are shown by non neutrality of M2 (money
supply). There is a little proving in Pakistan that the farming
support prices, international prices & domestic prices have a
long run association, (Lorie and Khan, 2006), but it is greater in
the wheat’s case. The change in exchange rates with respect to
Saira Anam, Allah Rakha, Zeeshan Fareed- Determinants of Food Price Inflation
in Pakistan
EUROPEAN ACADEMIC RESEARCH - Vol. I, Issue 12 / March 2014
5220
the flexibility in domestic prices is near to harmony for all
merchandize. Due to worldwide demand of food items, that
creates rise in prices, Johnson, (2008) saving products for
potential dealings then greater interest of investors creates
FPI. In LDC’s of Asia there are many factors like structural
plus cyclical are responsible for FPI, reported by Asian
Development Bank Report (2008). In many years, the
consumption growth had drop down due to production growth.
From 2000-07, there is a 43 percent drop down in wheat & rice
supply, but in USDA, (2008), due to greater usage of rice, the
worldwide market for rice is very low. In Ethiopia, The
dynamics of rise in prices & FP is keenly observed by Loening
et al (2009), according to their observation that in Ethopia food
rates & manufacturer rates brought the home food & non food
items rates. FPI is largely affected by rise in prices (inertia)
rather than non FPI. The farming supply & inertia affect the
rise in prices in short & medium span of time, but it is observed
that there is no direct effect on FPI & non FPI by M2 (money
supply) & worldwide power rise in prices. According to Dwyer
and Hafer (1999), in 2 periods there is relationship in M2 &
average inflation from 1987 to 1992 plus 1993 to 1997, in the
second period from 1993 to 1997 average rise in price is low.
When we move in the direction of zero money growth that
might be associated with average money growth of the nation,
so the falling relationship between M2 & inflation. A great real
cost is imposed by continuously rise in prices (inflation).
According to, Fischer, (1981), Feldstein, (1997) and Lucas,
(2000), in case of deposit & investment misallocation &loss of
real balance, 3 percent loss of real gross national product by 10
percent inflation rate. By incurring expenses on health,
education, comfort, security, that’s make men to purchase
additional eras of utility, there is no reduction in the MU
(marginal utility) of living addition. Consequently, Hall and
Jones, (2007), most of the spending goes toward health & health
is increase by income level. There is approximate effect on
Saira Anam, Allah Rakha, Zeeshan Fareed- Determinants of Food Price Inflation
in Pakistan
EUROPEAN ACADEMIC RESEARCH - Vol. I, Issue 12 / March 2014
5221
income level by alteration in life expectancy, (Acemoglu and
Johnson 2007). Population growth is affected by change in life
expectancy. About one percent increase in life expectancy then
1.5 percent increase in population, but there is a little effect of
life expectancy (first & the foremost part & 40 periods) on GDP,
but on the other way, there is no verification that the per capita
rise in economic development is affected by rise in life
expectancy. According to Benabou (1992), he adjust in United
States trade center the markup & inflation, in this region he
stats when the investigation cost is low then empirically it
performs credible relationship in inflation & markup, he states
the on retail mark up there is worse effect of inflation. The
Benabou interpret his findings that for prediction, better-
quality price diffusion is guided by pricing theory in the proxy
of rise in price. According to Denison (1981), import price index
discourage the net export &establish the phrase “command
gross domestic product” in order to explain the gross domestic
product in united states, in 1993, this is well defined by SNA.
In US, when they are developing the command of gross
domestic product then the terminology & methodology is
utilized by products accounts & as well as national income that
is given by Denison (1981). The FPI is considered by M2
(supply of money), Wheat support prices plus additional cost in
production process (Khan and Qasim 1996). NFPI (non food
price inflation) is considered by M2, import rates, power rates &
real gross domestic product. That is surprising that food prices
are effected by wheat support rates & it is estimated that the in
the catalogue 14 % participation of wheat items. However this
does not mean that one specific item overstates the rise in price.
Khan and Qasim determine that money supply M2, import
rates & real gross domestic product determine the rise in prices
(inflation). According to Sherani (2005), consumer price
inflation raise when the wheat carry prices rise in Pakistan, he
places of interest that the high inflation by building the
moveable monetary setup that results in financial fall down in
Saira Anam, Allah Rakha, Zeeshan Fareed- Determinants of Food Price Inflation
in Pakistan
EUROPEAN ACADEMIC RESEARCH - Vol. I, Issue 12 / March 2014
5222
2005.
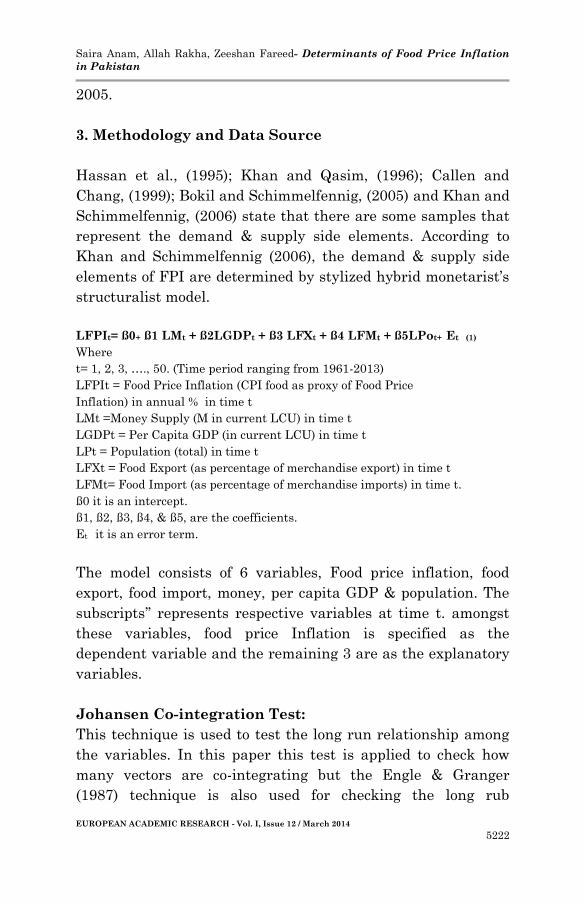
3. Methodology and Data Source
Hassan et al., (1995); Khan and Qasim, (1996); Callen and
Chang, (1999); Bokil and Schimmelfennig, (2005) and Khan and
Schimmelfennig, (2006) state that there are some samples that
represent the demand & supply side elements. According to
Khan and Schimmelfennig (2006), the demand & supply side
elements of FPI are determined by stylized hybrid monetarist’s
structuralist model.
LFPIt= ß0+ ß1 LMt + ß2LGDPt + ß3 LFXt + ß4 LFMt + ß5LPot+ Et (1)
Where
t= 1, 2, 3, …., 50. (Time period ranging from 1961-2013)
LFPIt = Food Price Inflation (CPI food as proxy of Food Price
Inflation) in annual % in time t
LMt =Money Supply (M in current LCU) in time t
LGDPt = Per Capita GDP (in current LCU) in time t
LPt = Population (total) in time t
LFXt = Food Export (as percentage of merchandise export) in time t
LFMt= Food Import (as percentage of merchandise imports) in time t.
ß0 it is an intercept.
ß1, ß2, ß3, ß4, & ß5, are the coefficients.
Et it is an error term.
The model consists of 6 variables, Food price inflation, food
export, food import, money, per capita GDP & population. The
subscripts’’ represents respective variables at time t. amongst
these variables, food price Inflation is specified as the
dependent variable and the remaining 3 are as the explanatory
variables.
Johansen Co-integration Test:
This technique is used to test the long run relationship among
the variables. In this paper this test is applied to check how
many vectors are co-integrating but the Engle & Granger
(1987) technique is also used for checking the long rub

Saira Anam, Allah Rakha, Zeeshan Fareed- Determinants of Food Price Inflation
in Pakistan
EUROPEAN ACADEMIC RESEARCH - Vol. I, Issue 12 / March 2014
5223
relationship but this is not good than Johansen (1988) and
Johansen and Juselius (1990). Two steps estimation is in Engle
and Granger (1987) test but if we see the Johansen (1988) and
Johansen and Juselius (1990), then there are the number of co-
integrating vectors.
Data Sources:
Data from 1960-2012 is taken, all data is taken from WDI
(world development indicator) 2012 online database. According
to … FPI is taken as proxy of consumer price inflation.
ESTIMATION OF THE MODEL (for empirical Analysis):
Data of time series from 1962-2012 is taken with 6 variables for
analysis. Then 1st of all stationarity of the data is checked
otherwise there will problem arise in economic results. After
this co-integration & error correction is applied. Phillips- perron
test is used to check the stationarity of the data rather than
ADF.
Phillips-Perron test at Level:
Variables Without
Trend
Prob.
Values
Trend &
Intercept
*Prob.
Values
LNFPI -0.808466 0.3607 -4.411725 0.0050
LNFM -0.44406 0.5172 -4.983545 0.0010
LNFX -0.123155 0.6362 -1.885998 0.6466
LNGDP 13.57086 1.000 -2.198087 0.4800
LNM2 17.31762 1.000 -2.893720 0.1734
LNPOP 13.15136 1.000 2.110567 1.000
Phillips-Perron test at 1st Difference:
LNFPI **-13.83442 0.000 - -
LNFM **-15.82721 0.0000 - -
LNFX **-7.095764 0.000 - -
LNGDP -1.268829 0.1856 *-5.431101 0.0003
LNM2 -1.823067 0.0654 **-6.972208 0.000
LNPOP -0.696985 0.4097 *-4.908824 0.0012
Note: * represents significant level at 1%.
** represent significant level at 5%.
Saira Anam, Allah Rakha, Zeeshan Fareed- Determinants of Food Price Inflation
in Pakistan
EUROPEAN ACADEMIC RESEARCH - Vol. I, Issue 12 / March 2014
5224
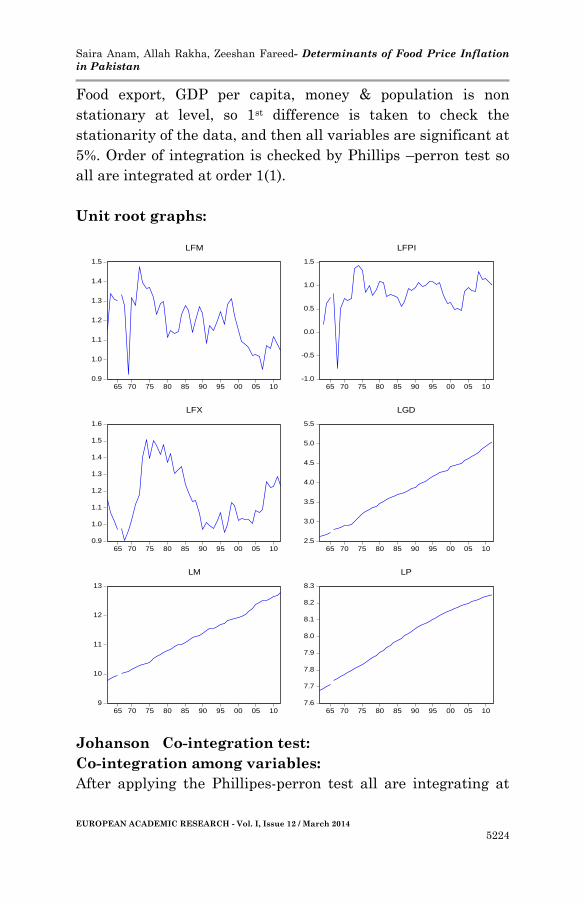
Food export, GDP per capita, money & population is non
stationary at level, so 1st difference is taken to check the
stationarity of the data, and then all variables are significant at
5%. Order of integration is checked by Phillips –perron test so
all are integrated at order 1(1).
Unit root graphs:
0.9
1.0
1.1
1.2
1.3
1.4
1.5
65 70 75 80 85 90 95 00 05 10
LFM
-1.0
-0.5
0.0
0.5
1.0
1.5
65 70 75 80 85 90 95 00 05 10
LFPI
0.9
1.0
1.1
1.2
1.3
1.4
1.5
1.6
65 70 75 80 85 90 95 00 05 10
LFX
2.5
3.0
3.5
4.0
4.5
5.0
5.5
65 70 75 80 85 90 95 00 05 10
LGD
9
10
11
12
13
65 70 75 80 85 90 95 00 05 10
LM
7.6
7.7
7.8
7.9
8.0
8.1
8.2
8.3
65 70 75 80 85 90 95 00 05 10
LP
Johanson Co-integration test:
Co-integration among variables:
After applying the Phillipes-perron test all are integrating at
Saira Anam, Allah Rakha, Zeeshan Fareed- Determinants of Food Price Inflation
in Pakistan
EUROPEAN ACADEMIC RESEARCH - Vol. I, Issue 12 / March 2014
5225
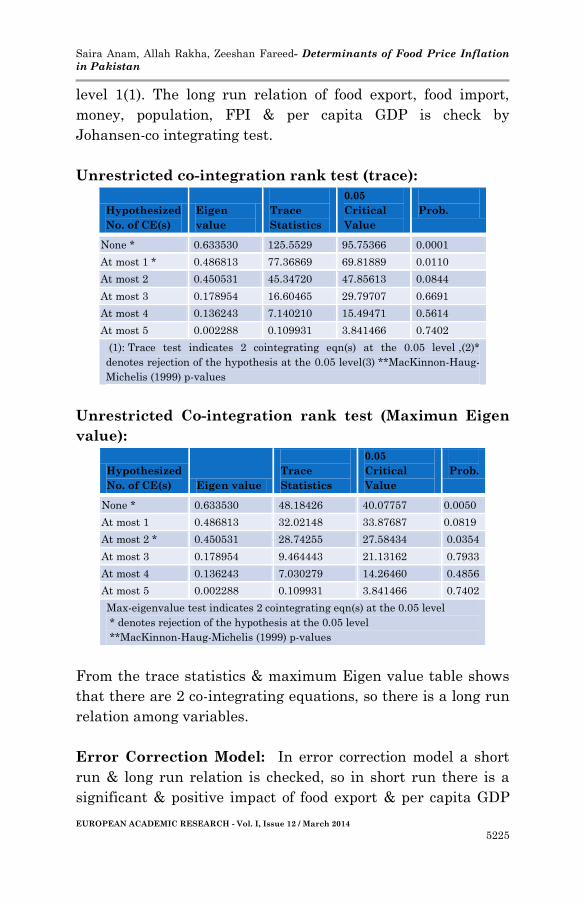
level 1(1). The long run relation of food export, food import,
money, population, FPI & per capita GDP is check by
Johansen-co integrating test.
Unrestricted co-integration rank test (trace):
Hypothesized
No. of CE(s)
Eigen
value
Trace
Statistics
0.05
Critical
Value
Prob.
None * 0.633530 125.5529 95.75366 0.0001
At most 1 * 0.486813 77.36869 69.81889 0.0110
At most 2 0.450531 45.34720 47.85613 0.0844
At most 3 0.178954 16.60465 29.79707 0.6691
At most 4 0.136243 7.140210 15.49471 0.5614
At most 5 0.002288 0.109931 3.841466 0.7402
(1): Trace test indicates 2 cointegrating eqn(s) at the 0.05 level ,(2)*
denotes rejection of the hypothesis at the 0.05 level(3) **MacKinnon-Haug-
Michelis (1999) p-values
Unrestricted Co-integration rank test (Maximun Eigen
value):
Hypothesized
No. of CE(s) Eigen value
Trace
Statistics
0.05
Critical
Value
Prob.
None * 0.633530 48.18426 40.07757 0.0050
At most 1 0.486813 32.02148 33.87687 0.0819
At most 2 * 0.450531 28.74255 27.58434 0.0354
At most 3 0.178954 9.464443 21.13162 0.7933
At most 4 0.136243 7.030279 14.26460 0.4856
At most 5 0.002288 0.109931 3.841466 0.7402
Max-eigenvalue test indicates 2 cointegrating eqn(s) at the 0.05 level
* denotes rejection of the hypothesis at the 0.05 level
**MacKinnon-Haug-Michelis (1999) p-values
From the trace statistics & maximum Eigen value table shows
that there are 2 co-integrating equations, so there is a long run
relation among variables.
Error Correction Model: In error correction model a short
run & long run relation is checked, so in short run there is a
significant & positive impact of food export & per capita GDP
Saira Anam, Allah Rakha, Zeeshan Fareed- Determinants of Food Price Inflation
in Pakistan
EUROPEAN ACADEMIC RESEARCH - Vol. I, Issue 12 / March 2014
5226
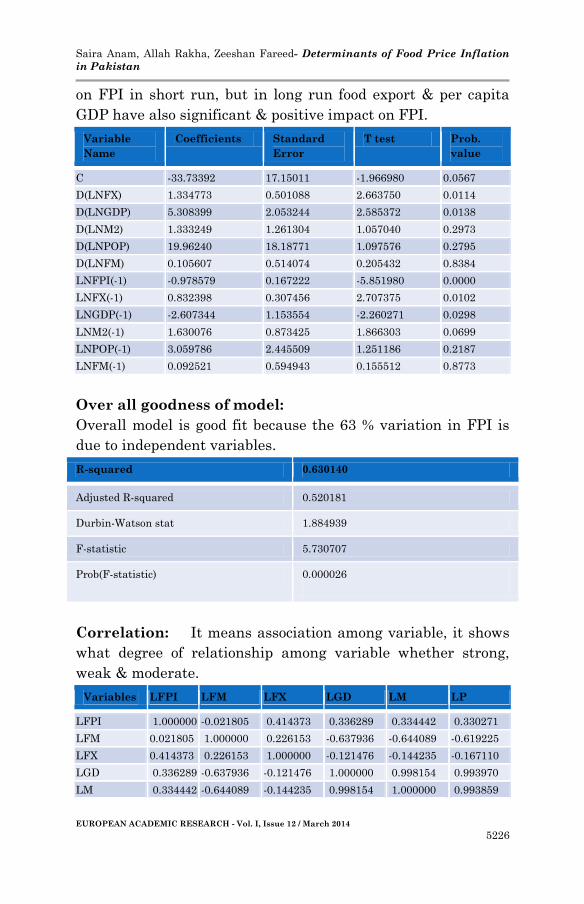
on FPI in short run, but in long run food export & per capita
GDP have also significant & positive impact on FPI.
Variable
Name
Coefficients Standard
Error
T test Prob.
value
C -33.73392 17.15011 -1.966980 0.0567
D(LNFX) 1.334773 0.501088 2.663750 0.0114
D(LNGDP) 5.308399 2.053244 2.585372 0.0138
D(LNM2) 1.333249 1.261304 1.057040 0.2973
D(LNPOP) 19.96240 18.18771 1.097576 0.2795
D(LNFM) 0.105607 0.514074 0.205432 0.8384
LNFPI(-1) -0.978579 0.167222 -5.851980 0.0000
LNFX(-1) 0.832398 0.307456 2.707375 0.0102
LNGDP(-1) -2.607344 1.153554 -2.260271 0.0298
LNM2(-1) 1.630076 0.873425 1.866303 0.0699
LNPOP(-1) 3.059786 2.445509 1.251186 0.2187
LNFM(-1) 0.092521 0.594943 0.155512 0.8773
Over all goodness of model:
Overall model is good fit because the 63 % variation in FPI is
due to independent variables.
R-squared 0.630140
Adjusted R-squared 0.520181
Durbin-Watson stat 1.884939
F-statistic 5.730707
Prob(F-statistic) 0.000026
Correlation: It means association among variable, it shows
what degree of relationship among variable whether strong,
weak & moderate.
Variables LFPI LFM LFX LGD LM LP
LFPI 1.000000 -0.021805 0.414373 0.336289 0.334442 0.330271
LFM 0.021805 1.000000 0.226153 -0.637936 -0.644089 -0.619225
LFX 0.414373 0.226153 1.000000 -0.121476 -0.144235 -0.167110
LGD 0.336289 -0.637936 -0.121476 1.000000 0.998154 0.993970
LM 0.334442 -0.644089 -0.144235 0.998154 1.000000 0.993859
Saira Anam, Allah Rakha, Zeeshan Fareed- Determinants of Food Price Inflation
in Pakistan
EUROPEAN ACADEMIC RESEARCH - Vol. I, Issue 12 / March 2014
5227
LP 0.330271 -0.619225 -0.167110 0.993970 0.993859 1.000000
There is weak & positive relation between LFPI & LFM,
moderate & positive relation between LFPI & LFX and there on
there is weak & positive relation in LFPI & LGD.
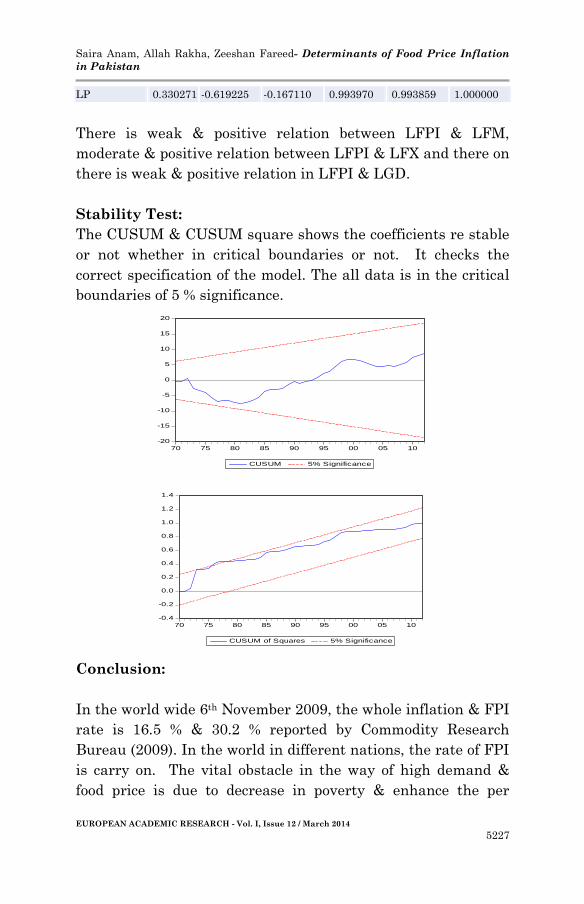
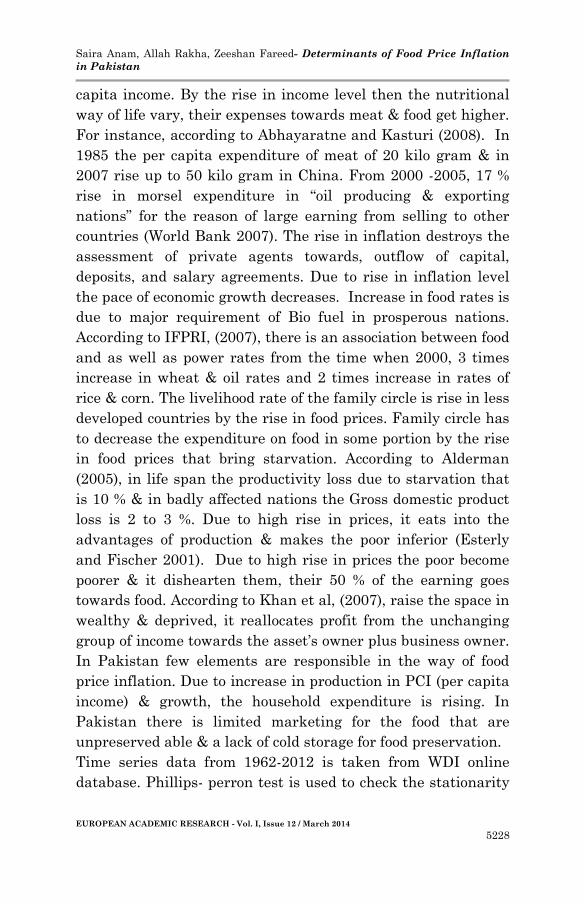
Stability Test:
The CUSUM & CUSUM square shows the coefficients re stable
or not whether in critical boundaries or not. It checks the
correct specification of the model. The all data is in the critical
boundaries of 5 % significance.
-20
-15
-10
-5
0
5
10
15
20
70 75 80 85 90 95 00 05 10
CUSUM 5% Significance
-0.4
-0.2
0.0
0.2
0.4
0.6
0.8
1.0
1.2
1.4
70 75 80 85 90 95 00 05 10
CUSUM of Squares 5% Significance
Conclusion:
In the world wide 6th November 2009, the whole inflation & FPI
rate is 16.5 % & 30.2 % reported by Commodity Research
Bureau (2009). In the world in different nations, the rate of FPI
is carry on. The vital obstacle in the way of high demand &
food price is due to decrease in poverty & enhance the per
Saira Anam, Allah Rakha, Zeeshan Fareed- Determinants of Food Price Inflation
in Pakistan
EUROPEAN ACADEMIC RESEARCH - Vol. I, Issue 12 / March 2014
5228
capita income. By the rise in income level then the nutritional
way of life vary, their expenses towards meat & food get higher.
For instance, according to Abhayaratne and Kasturi (2008). In
1985 the per capita expenditure of meat of 20 kilo gram & in
2007 rise up to 50 kilo gram in China. From 2000 -2005, 17 %
rise in morsel expenditure in “oil producing & exporting
nations” for the reason of large earning from selling to other
countries (World Bank 2007). The rise in inflation destroys the
assessment of private agents towards, outflow of capital,
deposits, and salary agreements. Due to rise in inflation level
the pace of economic growth decreases. Increase in food rates is
due to major requirement of Bio fuel in prosperous nations.
According to IFPRI, (2007), there is an association between food
and as well as power rates from the time when 2000, 3 times
increase in wheat & oil rates and 2 times increase in rates of
rice & corn. The livelihood rate of the family circle is rise in less
developed countries by the rise in food prices. Family circle has
to decrease the expenditure on food in some portion by the rise
in food prices that bring starvation. According to Alderman
(2005), in life span the productivity loss due to starvation that
is 10 % & in badly affected nations the Gross domestic product
loss is 2 to 3 %. Due to high rise in prices, it eats into the
advantages of production & makes the poor inferior (Esterly
and Fischer 2001). Due to high rise in prices the poor become
poorer & it dishearten them, their 50 % of the earning goes
towards food. According to Khan et al, (2007), raise the space in
wealthy & deprived, it reallocates profit from the unchanging
group of income towards the asset’s owner plus business owner.
In Pakistan few elements are responsible in the way of food
price inflation. Due to increase in production in PCI (per capita
income) & growth, the household expenditure is rising. In
Pakistan there is limited marketing for the food that are
unpreserved able & a lack of cold storage for food preservation.
Time series data from 1962-2012 is taken from WDI online
database. Phillips- perron test is used to check the stationarity
Saira Anam, Allah Rakha, Zeeshan Fareed- Determinants of Food Price Inflation
in Pakistan
EUROPEAN ACADEMIC RESEARCH - Vol. I, Issue 12 / March 2014
5229
of the data, at level some are stationarity but at 1st difference
all are stationary. Then Johansen co-integration technique is
used to check in long run how many vectors are co-integrating,
so by trace statistics 2 equations are co-integrating & by
maximum Eigen statistics there are also 2 equations are on-
integrating, so it shows there is a long run relation in LFPI,
LFX, LFM, LM, LGD & LP.
Error correction model is used to check the long & short
run relation among variables, so in long & in short run there is
significant & positive relation of LFX & LGD impact on LFPI.
Correlation, it means association among variable, it shows what
degree of relationship among variable whether strong, weak &
moderate. There is weak & positive relation between LFPI &
LFM, moderate & positive relation between LFPI & LFX and
there on there is weak & positive relation in LFPI & LGD.
From the all findings the supply & demand side factors are
responsible for generating rise in prices, due to empirical
finding there is no relation of LM & LPI, so this is not a
monetarist approach.
Limitation:
This study analyzes the food price inflation in Pakistan. Data is
just taken from one source, & just limited variables are used to
check the food price inflation, other variables like GNP,
national income, agriculture prices are also taken to check this
effect.
Recommendations:
From empirical analysis there is significant & positive relation
in Food export & food rise inflation, so govt. should restrict
export, 1st of all country needs should be fulfilled then it is
exported. Smuggling of goods from one to other country should
be properly checked. There is no empirical relation in money &
Saira Anam, Allah Rakha, Zeeshan Fareed- Determinants of Food Price Inflation
in Pakistan
EUROPEAN ACADEMIC RESEARCH - Vol. I, Issue 12 / March 2014
5230
Food price inflation so it is a non monetary phenomenon, so
LFPI is not affected by supply of money. Govt. should promote
credit in private regions like agriculture sector etc. Per capita
GDP has significant impact on food rise inflation, because the %
share in GDP is increasing more than Agriculture sector. Govt.
should make proper policies in order to cover the production
deficiencies. Government should provide easy loan to the
agriculturists so that they can meet their expenses towards
input cost, modern technology.
BIBLIOGRAPHY:
Abdullah, M. U. H. A. M. M. A. D., and Kalim, R. 2009.
“Determinants of food price inflation in Pakistan.”
In Conference of University of Management Sciences(pp.
1-21).
Abdullah, M. and Kalim, R. 2012. “Empirical analysis of food
price inflation in Pakistan.” World Applied Sciences
Journal 16(7): 933-939.
Ackerman, F. 2009. Can we afford the future?: the economics of
a warming world. London: Zed books.
Agha, A. I. and Khan, M. S. 2006. “An Empirical analysis of
Fiscal Imbalances and inflation in Pakistan.” SBP
research Bulletin 2(2): 343-362.
Alderman, H. 2005. “Linkages between poverty reduction
strategies and child nutrition: An Asian
perspective.” Economic and Political Weekly 4837-4842.
Ayyoub, M., Chaudhry, I. S., and Farooq, F. 2011. “Does
inflation affect economic growth? The case of
Pakistan.” Pakistan Journal of Social Sciences
(PJSS) 31(1): 51-64.
Baillie, R. T. and Selover, D. D. 1987. “Cointegration and
models of exchange rate determination.” International
Journal of Forecasting 3(1): 43-51.
Saira Anam, Allah Rakha, Zeeshan Fareed- Determinants of Food Price Inflation
in Pakistan
EUROPEAN ACADEMIC RESEARCH - Vol. I, Issue 12 / March 2014
5231
Balakrishnan, P. 1994. “How best to model inflation in
India.” Journal of Policy Modeling 16(6): 677-683.
Belke, A. and Polleit, T. 2007. Money and Inflation (No.
284/2007). Department of Economics, University of
Hohenheim, Germany.
Benabou, R. 1992. “Inflation and markups: theories and
evidence from the retail trade sector.” European
Economic Review 36(2): 566-574.
Bernanke, B. 2008. “Outstanding issues in the analysis of
inflation.” Understanding Inflation and the Implications
for Monetary Policy 447.
Bernanke, B. S. 2007. “Inflation expectations and inflation
forecasting.” In Remarks at the Monetary Economics
Workshop of the National Bureau of Economic Research
Summer Institute, Cambridge, Massachusetts. Available
on the Federal Reserve Board web site.
Bruno, G. S. Babula. 2005. “Evolving Dynamic Relationships
between the Money Supply and Food-Based Prices in
Canada and the United States.” Canadian Journal of
Agricultural Economic 42(2): 159-176.
Burki, A. A., Khan, M. A., and Bari, F. 2004. “The State of
Pakistan's Dairy Sector: An Assessment.” The Pakistan
Development Review 149-174.
Callen, T. and Chang, D. 1999. Modeling and Forecasting
Inflation in India (EPub). International Monetary Fund.
Canavese, A. J. 1982. “The structuralist explanation in the
theory of inflation.” World Development 10(7): 523-529.
Davis, K., & Princeton University. Office of Population
Research. 1951. The population of India and
Pakistan Vol. 1955. Princeton, NJ: Princeton University
Press.
Debabrata Patra, M. and Ray, P. 2010. “Inflation expectations
and monetary policy in India: An empirical
exploration.” IMF Working Papers 1-26.
Denison, E. F. 1981. “International transactions in measures of

Saira Anam, Allah Rakha, Zeeshan Fareed- Determinants of Food Price Inflation
in Pakistan
EUROPEAN ACADEMIC RESEARCH - Vol. I, Issue 12 / March 2014
5232
the nation’s production.” Survey of Current
Business 61(5): 17-28.
Devadoss, S. and Meyers, W. H. 1987. “Relative prices and
money: further results for the United States.” American
Journal of Agricultural Economics 69(4): 838-842.
Dickey, D. A. and Fuller, W. A. 1979. “Distribution of the
estimators for autoregressive time series with a unit
root.” Journal of the American statistical
association 74(366a): 427-431.
Dickey, D. A., Hasza, D. P., and Fuller, W. A. 1984. “Testing for
unit roots in seasonal time series.” Journal of the
American Statistical Association 79(386): 355-367.
Easterly, W. 2003. “IMF and World Bank structural adjustment
programs and poverty.” In Managing currency crises in
emerging markets, 361-392. University of Chicago Press.
Fisher, L. A., Otto, G., and Voss, G. 2005. “Housing booms, non-
financial wealth and consumption: Lessons from the
Australian experience.” Victoria 8: 2Y2.
Frankel, J. A. and Rose, A. K. 2010. “Determinants of
agricultural and mineral commodity prices.”
Frenkel, J. A. 1976. “Inflation and the Formation of
Expectations.” Journal of Monetary Economics 1(4): 403-
421.
Friedman, M. 1971. “A monetary theory of nominal
income.” The Journal of Political Economy 323-337.
Grauwe, P. D. and Polan, M. 2005. “Is Inflation Always and
Everywhere a Monetary Phenomenon?” The
Scandinavian Journal of Economics 107(2): 239-259.
Hamilton, J. D. 1994. Time series analysis. Vol. 2. Princeton:
Princeton University Press.
Hasan, M. A., Khan, A. H., Pasha, H. A., Rasheed, M. A., and
Husain, A. M. 1995. “What Explains the Current High
Rate of Inflation in Pakistan? [with Comments].” The
Pakistan Development Review 34(4): 927-943.
Jha, R. 2008. “Inflation targeting in India: issues and
Saira Anam, Allah Rakha, Zeeshan Fareed- Determinants of Food Price Inflation
in Pakistan
EUROPEAN ACADEMIC RESEARCH - Vol. I, Issue 12 / March 2014
5233
prospects.” International Review of Applied
Economics 22(2): 259-270.
Johansen, S. 1988. “Statistical analysis of cointegration
vectors.” Journal of economic dynamics and
control 12(2): 231-254.
Johansen, S. 1992. “Cointegration in partial systems and the
efficiency of single-equation analysis.” Journal of
Econometrics 52(3): 389-402.
Johansen, S. and Juselius, K. 1990. “Maximum likelihood
estimation and inference on cointegration—with
applications to the demand for money.” Oxford Bulletin
of Economics and statistics 52(2): 169-210.
Joiya, S. A. and Shahzad, A. A. 2013. “Determinants of High
Food Prices.” Pakistan Economic and Social
Review 51(1); 93-107.
Khan, A. H., Qasim, M. A., and Ahmad, E. 1996. “Inflation in
Pakistan Revisited [with Comments].” The Pakistan
Development Review 35(4): 747-759.
Khan, M. S. and Schimmelpfennig, A. 2006. “Inflation in
Pakistan.” The Pakistan Development Review 185-202.
Kremers, J. J., Ericsson, N. R., and Dolado, J. J. 1992. “The
power of cointegration tests.” Oxford bulletin of
economics and statistics 54(3): 325-348.
Leeper, E. M. 1991. “Equilibria under ‘active’and
‘passive’monetary and fiscal policies.” Journal of
monetary Economics 27(1): 129-147.
Moreno, A. 2004. “Reaching inflation stability.” Journal of
Money, Credit and Banking 801-825.
Nazli, H. and Meilke, K. 2008. “Implications of high food prices
for poverty in Pakistan.” Agricultural Economics 39(s1):
477-484.
Pesaran, M. H., Shin, Y., and Smith, R. J. 2001. “Bounds
testing approaches to the analysis of level
relationships.” Journal of applied econometrics 16(3):
289-326.
Saira Anam, Allah Rakha, Zeeshan Fareed- Determinants of Food Price Inflation
in Pakistan
EUROPEAN ACADEMIC RESEARCH - Vol. I, Issue 12 / March 2014
5234
Phillips, P. C. 1987. “Time series regression with a unit
root.” Econometrica: Journal of the Econometric Society
277-301.
Singh, K. and Kalirajan, K. 2003. “The inflation-growth nexus
in India: an empirical analysis.” Journal of Policy
Modeling 25(4): 377-396.
Sharif, M. U. H. A. M. M. A. D., Farooq, U. M. A. R., and
Bashir, A. R. S. H. E. D. 2000. “Illegal trade of Pakistan
with Afghanistan and Iran through Balochistan: Size,
balance and loss to the public exchequer.” International
Journal of Agriculture and Biology 2(3): 199-203.
Thornton, J. 2006. “Inflation and Inflation Uncertainty in
India, 1957-2005.” Indian Economic Review 1-8.
Tweeten, L. G. 1980. “Macroeconomics in crisis: Agriculture in
an underachieving economy.” American Journal of
Agricultural Economics 62(5): 853-865.
Von Braun, J. 2007. The World Food Situtation: New Driving
Forces and Required Actions. Intl Food Policy Res Inst.