determinants of environmental expenditure and investment
TRANSCRIPT

Department of Economics, Umeå University, S‐901 87, Umeå, Sweden
www.cere.se
CERE Working Paper, 2012:7
Determinants of Environmental Expenditure and Investment: Evidence from Sweden
Jūrate Jaraitė1, Andrius Kažukauskas1 & Tommy Lundgren2
1Centre for Environmental and Resource Economics and Dept of Economics
University of Umeå
S-901 87 Umeå, Sweden
2Centre for Environmental and Resource Economics and Dept of Forest Economics
Swedish University of Agricultural Sciences
S-901 83 Umeå, Sweden
The Centre for Environmental and Resource Economics (CERE) is an inter-disciplinary and inter-university research centre at the Umeå Campus: Umeå University and the Swedish University of Agricultural Sciences. The main objectives with the Centre are to tie together research groups at the different departments and universities; provide seminars and workshops within the field of environmental & resource economics and management; and constitute a platform for a creative and strong research environment within the field.

1
Determinants of environmental expenditure and investment: evidence from Sweden
Jūrate Jaraitėa,b
Andrius Kažukauskasa,b
Tommy Lundgrena,c
aCentre for Environmental and Resource Economics
SE-90187, Umeå, Sweden
bSchool of Business and Economics, Umeå University
SE-90183, Umeå, Sweden
cDepartment of Forest Economics, Swedish University of Agricultural Sciences
SE-90187, Umeå, Sweden.
2012-02-15
Abstract
This paper provides new evidence on the determinants of environmental expenditure and
investment. Also, by employing the Heckman selection models, we study how environmental
expenditure and investment by Swedish industrial firms responded to the national and
international policies directed to mitigate air pollution during the period 1999 through 2008.
We find that firms that use carbon intensive fuels such as oil and gas are more likely to spend
to and invest in the environment. Larger, more profitable and more energy intensive firms are
more likely to incur environmental expenditure/investment. Overall, an important finding of
our econometric analysis is that environmental regulation both on the national and
international levels are highly relevant motivations for environmental expenditure and
investment.
Keywords: environmental expenditure and investment, environmental policy, EU ETS, panel
data

2
1. Introduction
Sweden has been a leader in protecting its environment through introducing new legislation,
stepping up enforcement, and encouraging community involvement to promote an
environment-friendly culture. In the last two decades, the particular focus has been on
mitigating air pollution in industry. Apart from traditional energy/excise taxes levied on
energy products in the early 1990s, the Swedish government introduced CO2 taxes (1991),
SO2 taxes (1991), and a NOx charge (1992). Sweden, being the member of the European
Union, is also subject to the European regulation, in particular, to the European Union’s
Emission Trading System (2005). Due to these regulations on the national and international
levels the emissions of CO2, SO2, and NOx have significantly decreased since 1990.
As abatement cost increases with the stringency of environmental policy, regulation has most
certainly been a large factor in driving changes in production processes and investments to
mitigate pollution. Unregulated firms may also decide to acquire and install less polluting
capital technology equipment if it lowers their production cost. In addition, the fact that more
firms integrate social, environmental and economic concerns into their values and operations
and consumers becoming “greener” are likely to be another contributing factor.
Given the significant regulatory burden on firms to abate pollution and the resultant costs in
Sweden, it is natural to wonder whether corporate environmental expenditure and investment
is a response to these pressures or to other factors. Therefore the main goal of this paper is to
explore the determinants of environmental expenditure and investment in the entire
manufacturing sector in Sweden during the period 1999-2008. The available dataset allows us
to examine several types of environmental expenditure: first we look at firm’s current
expenditure for environmental protection which includes all other costs of environmental
protection that are not considered to be investment, second we consider firm’s investment in
environmental protection, and finally we analyse current environmental protection
expenditure on research and development (R&D). For this purpose we employ a selection
model which allows first examining which factors are the determinants of whether any such
expenditure occurs and in a second step we explain how much is spent on each type of
expenditure given that it occurs.
Most of the earlier empirical literature has focused on efficiency and effectiveness of
environmental policies. The later focus has been on effects of environmental regulations on
environmental investment, innovation and technological change. For instance, the relationship
between environmental policy stringency and innovation efforts has been demonstrated
empirically by Lanjouw and Mody (1996), Jaffe and Palmer (1997), Brunnermeiera and
Cohen (2003), Horbach (2008) and Carrion-Flores and Innes (2010) where increases in
pollution abatement control expenditures (assumed to be correlated to policy stringency) lead
to jumps in environmental patent counts and/or R&D expenditure. Horbach (2008) also finds
that environmentally innovative firms in the past are also more likely to innovate in the
present. Lee and Alm (2004) look at the impact of uncertainties surrounding the enactment
and the enforcement of environmental legislation on firm’s investment in air pollution
abatement equipment.

3
Also, there is growing evidence that firms respond to other external pressures for voluntary
overcompliance such as local/interest group pressures, customer demand or other social
pressures (see e.g. Heal (2008)). In addition to that, the standard industrial organisation
literature has stressed the importance of firm characteristics, such as firm size, firm
ownership, foreign competition, technological characteristics, capital intensity and others,
when explaining investment in general. For example, the attention to firm-specific factors
when explaining environmental expenditure has been given by Collins and Harris (2002,
2005) and Haller and Murphy (2012). (Collins and Harris 2002; Collins and Harris 2005)
Our paper contributes to the sparse empirical literature on interactions between environmental
regulation and corporate behaviour. Unlike previous studies, we exploit a comprehensive
survey of environmental expenditure and investment for a quite long time period. Our
empirical results show that firms that use carbon intensive fuels such as oil and gas are more
likely to spend to and invest in the environment. Larger, more profitable and more energy
intensive firms are more likely to incur environmental expenditure/investment. Overall, an
important finding of our econometric analysis is that environmental regulation both on the
national and international levels are highly relevant motivations for environmental
expenditure and investment.
The reminder of the paper is organised as follows. We present our theoretical framework and
define the variables to be used in our empirical analysis in Section 2. In Section 3 we outline
the data sources. Our empirical findings are discussed in Section 4. The final section
highlights the contributions of this paper and concludes.
2. Empirical strategy
The empirical problem of our study is to find the determinants of firm environmental
expenditure and investment. A number of econometric issues need to be tackled. First, we
might have sample selection bias since our dependent variable (the environmental
expenditure/investment level) can be measured only if the individual firm decides to do
expenditure/investment. The Heckman selection model (1979) can be used to deal with this
problem. Second, the Heckman sample selection model is more commonly used in studies
with cross-section data and less with panel data. Wooldridge (1995) proposed a similar to
Heckman selection model to deal with selection bias using the nature of longitudinal data. The
traditional Heckman two-stage selection model does not account for individual firm
heterogeneity effects what might be an important issue in environmental expenditure
decisions. These decisions might be based on unobservables such as firm culture, firm social
responsibility, management background etc. Thus, we adopt the Wooldridge (1995) empirical
estimation strategy to account not only for selection bias but also for firm time-invariant
individual effects.
4
2.1 A selection model of the environmental investment/expenditure decision
The first stage of this analysis constructs a model of the probability of environmental
expenditure/investment focusing on the role of environmental policy variables in this
decision. The underlying expenditure/investment decision is modelled as
i itz β x γ
where is a latent variable that underlines an observed indicator variable that captures
whether or not a firm spends according to the following rule:
and
i itz β x γ
where are firm specific time invariant variables; are firm specific time variant variables;
are firm specific time invariant unobservables such as firm culture, firm social
responsibility, management background etc. The first stage uses the cross-sectional probit
regressions to predict whether or not the individual firm do environmental
expenditure/investment in a given period. As the determinants of the investment/expenditure
decision a number of variables are included in the probit models.
We also need the variables which are likely to satisfy the necessary exclusion restrictions, i.e.
they are likely to affect the probability of firm investing in the environment, but are unlikely
to affect changes in a firm’s investment levels except through their effect on investment
decision.
For the instruments we use the dummy variables indicating whether individual firms use
carbon intensive fuels such as gas or oil. These instruments satisfy the exogeneity/exclusion
condition as it is unlikely that the particular fuel type usage affects the level of environmental
investment/expenditure given that we control for other energy/fuel use by individual firms.
2.2 A regression model identifying environmental investment/expenditure determinants
In the second stage we estimate the fixed effect model:
where , ... , are the inverse Mills ratios estimated in the first selection stage using the
probit model for each year. The coefficients of the inverse Mills ratios ( ) might suggest that
5
the factors, that predict which firms make decision whether to invest (or make expenditure)
into environmental measures or not, are correlated with the factors determining how much
firms do invest or make expenditures related with the environment protection. The
significance of the inverse Mills ratios indicates that accounting for sample selection is
important.
2.3 Variables included as potential determinants of firm environmental
investment/expenditure
Based on the earlier empirical and theoretical literature and the available data, we consider
firm economic situation, capital stock, energy intensity and firm-specific energy prices as
explanatory variables. We also control for technological characteristics by using six NACE
industry dummies. Additionally, we control for the introduction of the EU Emission Trading
System (EU ETS). The descriptive statistics of all variables are presented in Table 1. In turn,
we provide a brief motivation for including the above explanatory variables in our models.
In principle, firm’s economic performance is an important determinant of investment as the
rate of investment might be constrained by the supply of funds (e.g. see a comprehensive
survey by Jorgenson (1971)). We measure firm’s economic performance as a ratio of firm
value added and employee number. We expect the coefficient of this explanatory variable to
be positive.
Firm size in which firms operate might also affect investment activity. We might think that
large and monopolistic firms may have fewer incentives to invest and to innovate, whereas
small firms in competitive markets are forced to be better than their competitors by reducing
their production costs and developing new products. On the other hand, larger firms are more
likely to be more polluting and there may be economies of scale in environmental expenditure
and investment (Haller and Murphy 2012). We use firm’s lagged capital stock (machinery and
buildings) to account for firm size effects on environmental investment/expenditure.
We expect firms that are more energy intensive spend more on pollution reduction due to their
higher pollution levels and associated pollution abatement costs. We measure energy intensity
as a ratio of energy used in MWh and employee number. Also, we control for energy prices
by constructing a firm-specific Tornqvist energy price index. We expect that higher energy
prices should increase the probability of making an investment.
As mentioned in the introduction, Swedish firms are subject to national and international
environmental regulations. In Sweden there are three different types of excise duties, which
are levied on fuels – energy tax, CO2 tax and SO2 tax. Petrol, diesel, oil, kerosene, natural gas
and coal are directly subject to energy tax, CO2 tax and SO2 tax. The general principle is that
excise duties are only to be paid if the fuel is used as motor fuel or for heating purposes. Apart
from these directly excisable fuels, excise duties are also levied on certain other fuels when
sold or used as motor fuels or for heating purposes. This applies to all mineral oils, fats from
both vegetable and animal sources and fatty acid methyl esters. Taxable is also any product
used as motor fuel and any hydrocarbon, which is sold or used for heating purposes.
However, aviation spirit and jet fuel are not subject to excise duty when used for air
6
navigation. Petrol has been taxed since 1924 and diesel since 1937. Energy tax on oil and coal
used for heating purposes and electricity has been collected since the nineteen fifties. The
carbon dioxide and sulphur taxes were introduced in 1991. The CO2 tax base rate is presently
1,05 SEK (about 0,11 euro) per kilo CO2 emitted. However, due to exemptions and special
rules the actual rate paid by industry is considerably lower (0,15-0,20 SEK) The SO2 tax is
levied on the sulphur content in the fuel and is based on a tax rate of 30 SEK (3,08 euro) per
kilo.
That these policies are successful have been document by several studies. For instance,
Brännlund and Lundgren (2010), Lundgren and Marklund (2010) and Brännlund et al. (2011)
study the impact of a CO2 tax on firm level profits and environmental performance during
1990-2004. They find that environmental performance, in terms of carbon intensity in
production, is positively correlated with the CO2 tax, while the impact on profitability is
ambiguous.
In addition to the national policies, since 2005 large polluters of CO2 emissions have been
covered under the European Union’s Emission Trading System. Firms subject to these
regulations have strong incentives to reduce their emissions by contracting their output or by
employing and/or installing less polluting production technologies.
To explore the effects of environmental policies introduced by Swedish authorities, we use
total energy-environmental taxes paid by firms. Unfortunately, these data are available only
for a very small set of firms and, thus, this variable is excluded from the main models of this
study. For the EU ETS, we use a dummy variable which identifies whether a firm belongs to
the EU ETS. Also, to control for the dynamics of CO2 price, we use an average annual price
of CO2 as well as its variance for the years 2005-2008. Finally, we control for the introduction
of the EU ETS by using a dummy variable for the 2005-2008 period corresponding for the
first years of the EU ETS. The interaction term between the ETS-firm dummy and the time
dummy representing the first four years of the EU ETS will show whether the post-2005
period for ETS firms was associated with higher environmental expenditure and investment:
,
where is a coefficient of the interaction term. It will indicate the effect of the EU ETS on
environmental investment/expenditure.
3. Data
Our dataset consists of several independent datasets collected and owned by Statistics Sweden
(SCB). The environmental expenditure variables come from “Environmental protection
expenditure in industry” survey. It has been in place since 1999 but it has become compulsory
since 2001. The statistics cover total investments in environmental protection and current
expenditure. The expenditure is broken down between types of costs, environmental domains
(air, water, waste, biodiversity and landscape, protection of soil and groundwater and other),
7
30 economic activities for industries, and five size classes of numbers of employees (20-49,
50-249, 250-499, 500-999, more than 1000). The sample frame consists of enterprises with 20
employees or more1 whose main activity is in Mining and quarrying (NACE 10-14),
Manufacturing (NACE 15-36) and Electricity, gas and water supply (NACE 40-41). The total
sample for each year consists of approximately 1 000 firms. The analysis here focuses on the
Mining and quarrying and Manufacturing sectors. Survey forms, reports on methods and
quality as well as aggregates obtained from the data are available at www.scb.se.
The other necessary economic, environmental and energy variables for this study were
obtained from the other datasets owned by the SCB. Matching of firms across data sets was
performed using unique firm-level identifiers.2 Our dataset consists of more than seven
thousand observations over the period 1999-2008, about 750 per year.3
As only a fraction of firms reports positive values for environmental expenditure and
investment, we might have sample selection bias since our dependent variables are censored,
i.e. they can be measured only if an individual firm decides to spend or invest in pollution
abatement. We will use the Heckman selection models described above to deal with this
problem.
4. Results
4.1 Descriptive statistics
Table 1 presents the descriptive statistics of all variables used in this study. Separately, the
summary statistics are reported for firms that reported positive environmental expenditure and
investment. During the period of our analysis, 86% of firms reported positive environmental
expenditure and the share of firms that reported environmental investment was much smaller
– 44%. On average, firms spent SEK 3 505.6 thousand and invested SEK 4 950.2 thousand. It
is evident that firms that reported positive environmental investment are on average more
profitable and capital intensive than firms that reported positive environmental expenditure.
Firms that report environmental investments are also more energy intensive than other firms.
The sectoral allocation reveals (see Table 2) that firms in the mining and quarrying sector
report larger environmental expenditure and investment. Firms in the wood, pulp and paper;
and chemicals, mineral products and plastic sectors invest more in environmental protection
than firms in the other sectors.
1 In 2005, due to the administrative burden on enterprises, Statistics Sweden decided to raise the cut off to
enterprises with 50 employees or more instead of the usual 20 employees. To make comparisons with earlier
years possible, estimations were made for the size group 20-49 employees. 2 To the best of our knowledge, this merge of different datasets has not been done before.
3 Some variables are available for the shorter period.

8
Table 1 Descriptive statistics
Variables Measurement units All observations
If envexp > 0
If envinv >0
Obs. Mean Std. Dev.
Obs. Mean Std. Dev.
Obs. Mean Std. Dev.
Total investment SEK, thousands 7 560 2 156.2 12 367.1
5346 2 454.8 11 800.4
3293 4 950.2 18 367.1
Air investment SEK, thousands 7 560 912.3 6 969.9
5346 1 006.6 6 082.8
3293 2 094.6 10 443.6
Other investment SEK, thousands 7 560 1 243.9 8 118.0
5346 1 448.1 8 750.0
3293 2 855.7 12 112.7
Total expenditure SEK, thousands 6 224 3 011.1 8 804.4
5346 3 505.6 9 408.4
2653 5 787.0 12 541.1
R&D expenditure SEK, thousands 6 224 112.6 867.0
5346 131.0 934.2
2653 213.6 1210.0
Profitability ratio SEK per employee 7 530 651 602.9 1 215 244.0
5332 680 463.5 1 377 628.0
3287 743 799.6 1 761 912.0
Capital SEK, thousands 7 559 262 775.1 979 509.6
5345 297 683.9 1 059 913.0
3293 489 293.0 1 394 015.0
Energy intensity MWh per employee 6 944 219.0 614.1
5064 244.0 677.1
3193 343.4 813.5
Tornqvist energy price index Base year 2000 6 953 1.302 0.395
5071 1.360 0.383
3195 1.216 0.379
ETS firms dummy variable, 1 if ETS firm 7 560 0.100 0.300
5346 0.114 0.318
3293 0.183 0.387
Mining and quarrying dummy variable, 1 if NACE 10-15 7 560 0.017 0.130
5346 0.017 0.129
3293 0.024 0.152
Food, beverages, textiles and clothing dummy variable, 1 if NACE 15-19 7 560 0.118 0.323
5346 0.117 0.322
3293 0.114 0.318
Wood, pulp and paper dummy variable, 1 if NACE 20-22, 36 7 560 0.226 0.418
5346 0.217 0.412
3293 0.217 0.412
Chemicals, mineral products and plastic dummy variable, 1 if NACE 23-26 7 560 0.155 0.362
5346 0.169 0.375
3293 0.185 0.388
Metal, metal products dummy variable, 1 if NACE 27-28 7 560 0.136 0.343
5346 0.137 0.344
3293 0.150 0.357
Machinery and equipment, electronics dummy variable, 1 if NACE 29-35 7 560 0.347 0.476
5346 0.342 0.474
3293 0.311 0.463
Total energy and environmental taxes SEK, thousands 1 151 6 321.6 12 766.6 908 6 301.7 12 009.2 850 7 496.7 14 178.6

9
Table 2 Sectoral allocation of environmental expenditure and investment
Industry If envexp > 0
If envinv >0
Obs. Mean Std. Dev.
Obs. Mean Std. Dev.
Mining and quarrying 91 12 303.6 27 583.0
78 19 566.2 46 138.7
Food, beverages, textiles and clothing 627 3 742.4 6 901.4
375 2 722.4 6 492.5
Wood, pulp and paper 1 160 4 489.4 11 277.5
715 10 074.1 27 727.1
Chemicals, mineral products and plastic 906 4 579.2 9 233.0
608 5 487.7 12 099.0
Metal, metal products 733 3 575.9 10 298.2
494 3 492.9 21 459.8
Machinery and equipment, electronics 1 829 1 802.7 5 637.6 1023 1 455.5 3 838.1
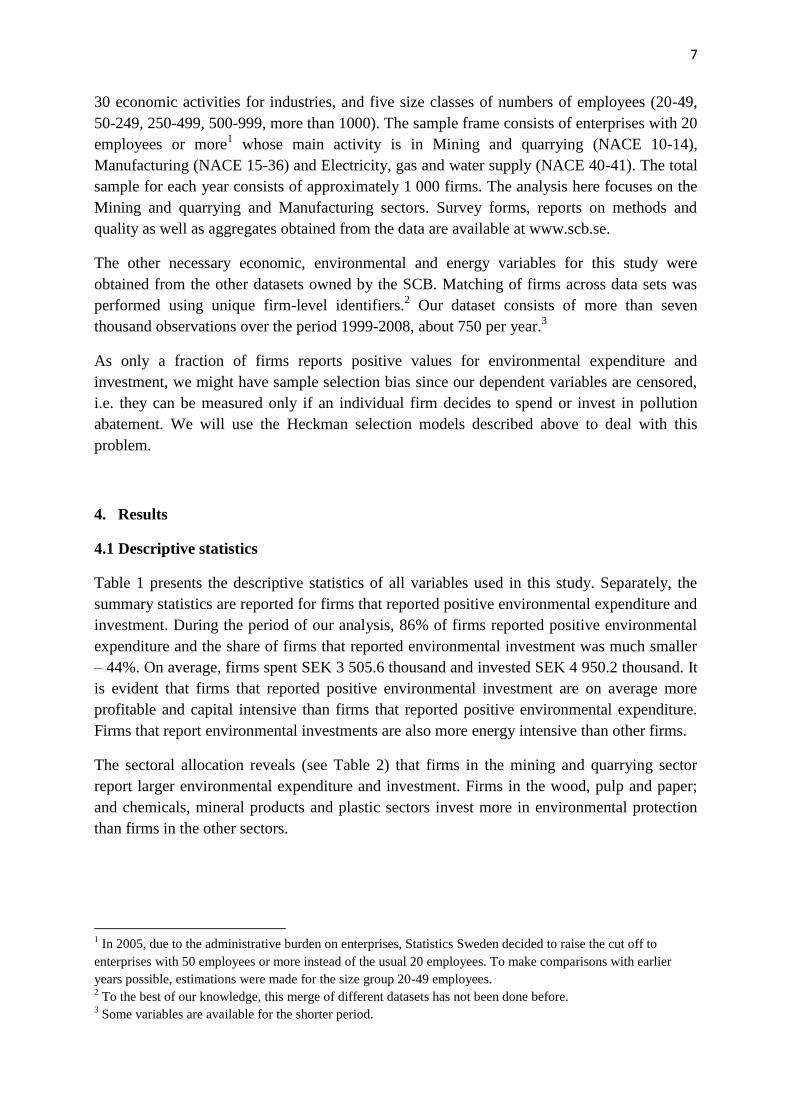
The dynamics of environmental expenditure and investment is presented in Figure 1. It is
evident that average environmental expenditure increased significantly after the year 2004. It
is an important question, whether this increase can be explained by the introduction of the EU
ETS in 2005. Oppositely, average environmental investment has slightly declined since 2005.
Figure 1 Mean environmental expenditure and investment, 1999-2008
Table 3 reports the descriptive statistics for ETS and non-ETS firms. It is evident that ETS
firms are larger than other firms in the sample. They are more energy and capital intensive as
well as more profitable. On average, ETS firms spend more on environment and invest more
in pollution control.
20
00
25
00
30
00
35
00
40
00
SE
K tho
usa
nd
s
1998 2000 2002 2004 2006 2008year
Expenditure Investment

10
Table 3 Descriptive statistics for ETS and non-ETS firms.
Variables Measurement units Non-ETS firms ETS firms
Mean Obs. Mean Obs.
Total investment SEK, thousands 690.3 6 805 15 369.4 755
Air investment SEK, thousands 305.4 6 805 6 383.0 755
Other investment SEK, thousands 384.9 6 805 8 986.3 755
Total expenditure SEK, thousands 1 355.2 5 584 17 458.3 640
R&D expenditure SEK, thousands 62.2 5 584 552.3 640
Profitability ratio SEK per employee 615 492.2 6 775 975 643.2 755
Capital SEK, thousands 105 345.8 6 804 1 681 515.0 755
Energy intensity MWh per employee 116.4 6 196 1 068.8 748
Energy price index Base year 2000 1.332 6 205 1.051 748
Mining and quarrying dummy variable, 1 if NACE 10-15 0.015 6 805 0.037 755
Food, beverages, textiles and clothing dummy variable, 1 if NACE 15-19 0.124 6 805 0.066 755
Wood, pulp and paper dummy variable, 1 if NACE 20-22, 36 0.202 6 805 0.444 755
Chemicals, mineral products and plastic dummy variable, 1 if NACE 23-26 0.145 6 805 0.249 755
Metal, metal products dummy variable, 1 if NACE 27-28 0.137 6 805 0.122 755
Machinery and equipment, electronics dummy variable, 1 if NACE 29-35 0.376 6 805 0.082 755
Total energy and environmental taxes SEK, thousands 1 812.6 537 10 265.1 614
11
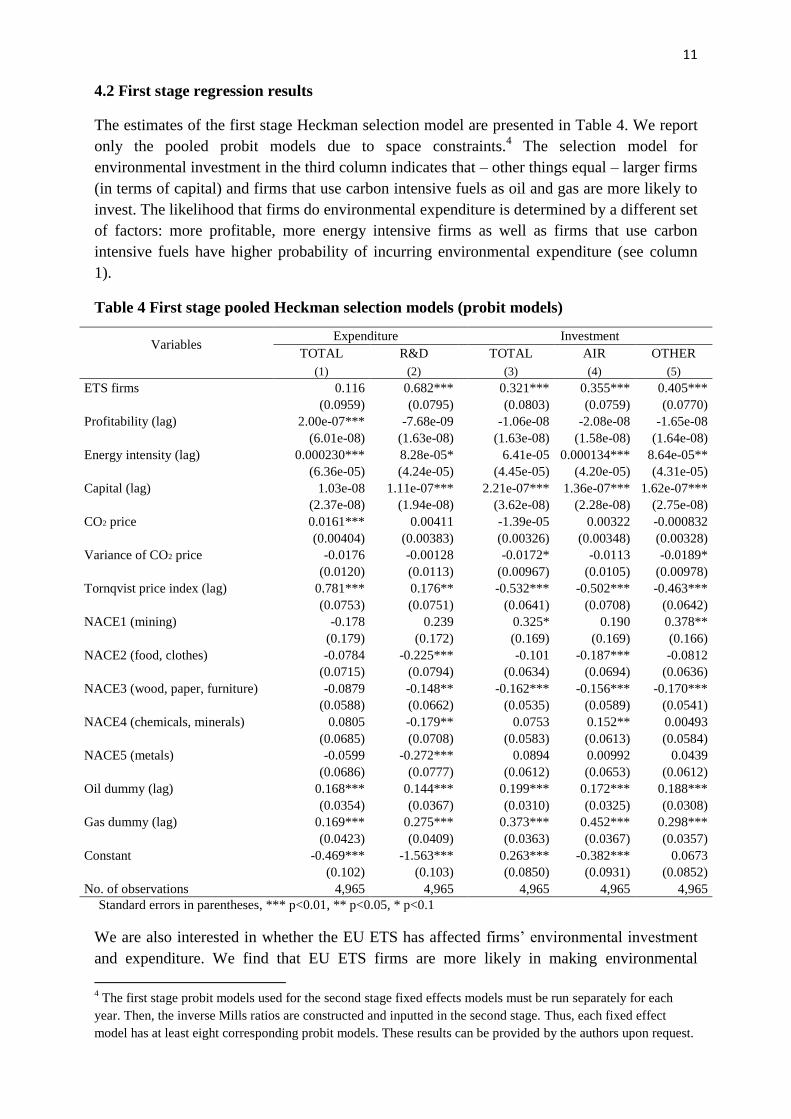
4.2 First stage regression results
The estimates of the first stage Heckman selection model are presented in Table 4. We report
only the pooled probit models due to space constraints.4 The selection model for
environmental investment in the third column indicates that – other things equal – larger firms
(in terms of capital) and firms that use carbon intensive fuels as oil and gas are more likely to
invest. The likelihood that firms do environmental expenditure is determined by a different set
of factors: more profitable, more energy intensive firms as well as firms that use carbon
intensive fuels have higher probability of incurring environmental expenditure (see column
1).
Table 4 First stage pooled Heckman selection models (probit models)
Variables Expenditure Investment
TOTAL R&D TOTAL AIR OTHER
(1) (2) (3) (4) (5)
ETS firms 0.116 0.682*** 0.321*** 0.355*** 0.405***
(0.0959) (0.0795) (0.0803) (0.0759) (0.0770)
Profitability (lag) 2.00e-07*** -7.68e-09 -1.06e-08 -2.08e-08 -1.65e-08
(6.01e-08) (1.63e-08) (1.63e-08) (1.58e-08) (1.64e-08)
Energy intensity (lag) 0.000230*** 8.28e-05* 6.41e-05 0.000134*** 8.64e-05**
(6.36e-05) (4.24e-05) (4.45e-05) (4.20e-05) (4.31e-05)
Capital (lag) 1.03e-08 1.11e-07*** 2.21e-07*** 1.36e-07*** 1.62e-07***
(2.37e-08) (1.94e-08) (3.62e-08) (2.28e-08) (2.75e-08)
CO2 price 0.0161*** 0.00411 -1.39e-05 0.00322 -0.000832
(0.00404) (0.00383) (0.00326) (0.00348) (0.00328)
Variance of CO2 price -0.0176 -0.00128 -0.0172* -0.0113 -0.0189*
(0.0120) (0.0113) (0.00967) (0.0105) (0.00978)
Tornqvist price index (lag) 0.781*** 0.176** -0.532*** -0.502*** -0.463***
(0.0753) (0.0751) (0.0641) (0.0708) (0.0642)
NACE1 (mining) -0.178 0.239 0.325* 0.190 0.378**
(0.179) (0.172) (0.169) (0.169) (0.166)
NACE2 (food, clothes) -0.0784 -0.225*** -0.101 -0.187*** -0.0812
(0.0715) (0.0794) (0.0634) (0.0694) (0.0636)
NACE3 (wood, paper, furniture) -0.0879 -0.148** -0.162*** -0.156*** -0.170***
(0.0588) (0.0662) (0.0535) (0.0589) (0.0541)
NACE4 (chemicals, minerals) 0.0805 -0.179** 0.0753 0.152** 0.00493
(0.0685) (0.0708) (0.0583) (0.0613) (0.0584)
NACE5 (metals) -0.0599 -0.272*** 0.0894 0.00992 0.0439
(0.0686) (0.0777) (0.0612) (0.0653) (0.0612)
Oil dummy (lag) 0.168*** 0.144*** 0.199*** 0.172*** 0.188***
(0.0354) (0.0367) (0.0310) (0.0325) (0.0308)
Gas dummy (lag) 0.169*** 0.275*** 0.373*** 0.452*** 0.298***
(0.0423) (0.0409) (0.0363) (0.0367) (0.0357)
Constant -0.469*** -1.563*** 0.263*** -0.382*** 0.0673
(0.102) (0.103) (0.0850) (0.0931) (0.0852)
No. of observations 4,965 4,965 4,965 4,965 4,965
Standard errors in parentheses, *** p<0.01, ** p<0.05, * p<0.1
We are also interested in whether the EU ETS has affected firms’ environmental investment
and expenditure. We find that EU ETS firms are more likely in making environmental
4 The first stage probit models used for the second stage fixed effects models must be run separately for each
year. Then, the inverse Mills ratios are constructed and inputted in the second stage. Thus, each fixed effect
model has at least eight corresponding probit models. These results can be provided by the authors upon request.

12
investment and R&D expenditure decisions (see columns 2-5 in Table 4). The resultant price
of CO2 in the EU ETS market had a positive and significant effect only on the probability of
total environmental expenditure (see column 1 in Table 4), but not investment.
4.3 Second stage regression results
Table 5 and Table 6 show the results of the Heckman selection models without and with
accounting for fixed effects, respectively. The coefficients of the inverse Mills ratios are
statistically significant showing that the two firms’ decisions on whether to spend and how
much to spend are significantly correlated. This indicates that we should use selection models
to investigate our empirical research questions.
Table 5 Second stage pooled Heckman selection models
Variables Expenditure Investment
TOTAL R&D TOTAL AIR OTHER
(1) (2) (3) (4) (5)
ETS firms 3,718*** 299.4 7,210*** 2,766** 5,216***
(1,145) (421.3) (1,526) (1,351) (1,218)
ETS*Y05 3,924*** 416.6 -4,295** 1,682 -5,601***
(1,186) (309.6) (1,758) (1,556) (1,326)
Y05 598.6 -275.0 856.5 1,184 158.0
(755.0) (298.9) (1,604) (1,590) (1,242)
Profitability (lag) -0.000278 0.000957*** 0.00349*** 0.00109 0.00296***
(0.000199) (0.000172) (0.000860) (0.000762) (0.000660)
Energy intensity (lag) 0.855 -0.120 4.388*** 2.516*** 1.733***
(0.531) (0.127) (0.702) (0.591) (0.535)
Capital (lag) 0.00392*** 1.57e-05 0.00136*** 3.31e-05 0.00115***
(0.000206) (4.76e-05) (0.000268) (0.000229) (0.000207)
CO2 price -115.0** 1.919 23.75 -3.271 19.86
(48.05) (14.77) (80.30) (77.68) (62.01)
Variance of CO2 price 135.5 72.39** 116.2 28.56 139.2
(116.1) (36.25) (200.1) (190.8) (155.7)
Tornqvist price index (lag) -5,150*** 86.44 -1,675 -2,511* -433.8
(1,183) (313.5) (1,528) (1,496) (1,169)
NACE1 (mining) 6,215*** 780.6* 9,343*** 2,612 7,718***
(1,899) (453.9) (2,600) (2,418) (1,934)
NACE2 (food, clothes) 1,581** -437.2 -115.1 -157.6 377.9
(765.2) (270.4) (1,229) (1,254) (944.3)
NACE3 (wood, paper, furniture) -406.7 -461.3* 2,610** 1,232 2,584***
(655.2) (239.6) (1,105) (1,091) (864.0)
NACE4 (chemicals, minerals) 1.613 90.01 -836.9 -875.7 -320.2
(719.5) (243.6) (1,112) (1,073) (862.2)
NACE5 (metals) 1,235* -113.3 -670.9 299.2 -641.5
(739.5) (268.3) (1,162) (1,134) (891.4)
Lambda -15,290*** 170.2 -4,440** -1,492 -3,137*
(3,126) (465.6) (2,148) (1,640) (1,838)
Constant 13,066*** -419.6 3,428 4,541* 1,449
(2,529) (956.0) (2,138) (2,371) (1,840)
No. of. obs. (uncensored) 3,992 787 2,367 1,422 2,059
Standard errors in parentheses, *** p<0.01, ** p<0.05, * p<0.1

13
One of the most interesting research questions is whether the introduction of the EU ETS in
2005 has had any effect on firms’ environmental behaviour. To explore this question we use
the interaction term between the dummy representing the EU ETS time period (2005-2008)
and the dummy variable indicating whether the individual firm was covered by this scheme.
Since it was not a voluntary scheme, we can consider the EU ETS as an exogenous factor
which can allow us to identify the causal policy effect.
The fixed effects and pooled Heckman selection models produce very similar estimates. The
results from Table 5 and Table 6 indicate that the EU ETS policy had different effects on
environmental expenditure and investment: the effect on environmental expenditure is
positive (column 1), while it is negative on other than air pollution related investment
(column 5). We might think that the EU ETS encouraged ETS firms to redistribute their
environmental expenses, i.e. to postpone or decrease environmental investment in other than
air related areas and to increase environmental expenditure in order to comply with the EU
ETS regulations. For instance, Jaraitė et al. (2010) have found that internal (staff) and capital
costs accounted for most of the expenditure associated with the introduction of the EU ETS in
Ireland.
We also included the EU ETS allowance price and its volatility to extend our analysis on EU
ETS effects. We find no evidence that EU ETS price or its volatility had a significant impact
on the environmental investment or expenditure levels perhaps indicating that this price was
too low to trigger any changes in firms’ expenditure and investment decisions.
Table 6. Fixed effects Heckman selection models
VARIABLES Expenditure Investment
TOTAL R&D TOTAL AIR OTHER
(1) (2) (3) (4) (5)
ETS*Y05 3,809*** 237.5 -3,154 2,656 -5,435***
(418.2) (398.0) (2,043) (2,132) (1,565)
Y05 4.231 -219.1 344.9 2,005 -222.9
(296.2) (386.2) (1,956) (2,359) (1,571)
Profitability (lag) 0.00123*** 0.000854 0.00392* -0.000332 0.00737***
(0.000371) (0.000726) (0.00231) (0.00400) (0.00179)
Energy intensity (lag) 1.183 1.052 -9.507** -17.94** -5.709
(1.440) (1.158) (4.043) (8.167) (3.751)
Capital (lag) 0.000477 -0.000296 -0.00697*** -0.00485*** -0.00142
(0.000390) (0.000671) (0.00124) (0.00137) (0.000891)
CO2 price -10.75 6.560 64.34 -6.847 53.43
(14.27) (16.86) (90.16) (104.8) (71.97)
Variance of CO2 price 25.31 56.74 -79.50 -51.00 30.59
(34.99) (41.38) (217.3) (243.2) (175.1)
Tornqvist price index (lag) 1,246* 420.2 5,197 5,568 1,784
(660.7) (1,556) (3,722) (3,881) (2,144)
Inverse Mills ratios y y y y y
Constant 1,875** -4,041 12,710*** 16,610*** 10,633***
(899.3) (4,902) (3,969) (5,016) (3,958)
No. of. obs. (uncensored) 3,992 787 2,367 1,422 2,059
R-squared (within) 0.055 0.087 0.029 0.056 0.026
Number of firms 1,060 281 766 535 704
Standard errors in parentheses, *** p<0.01, ** p<0.05, * p<0.1
14
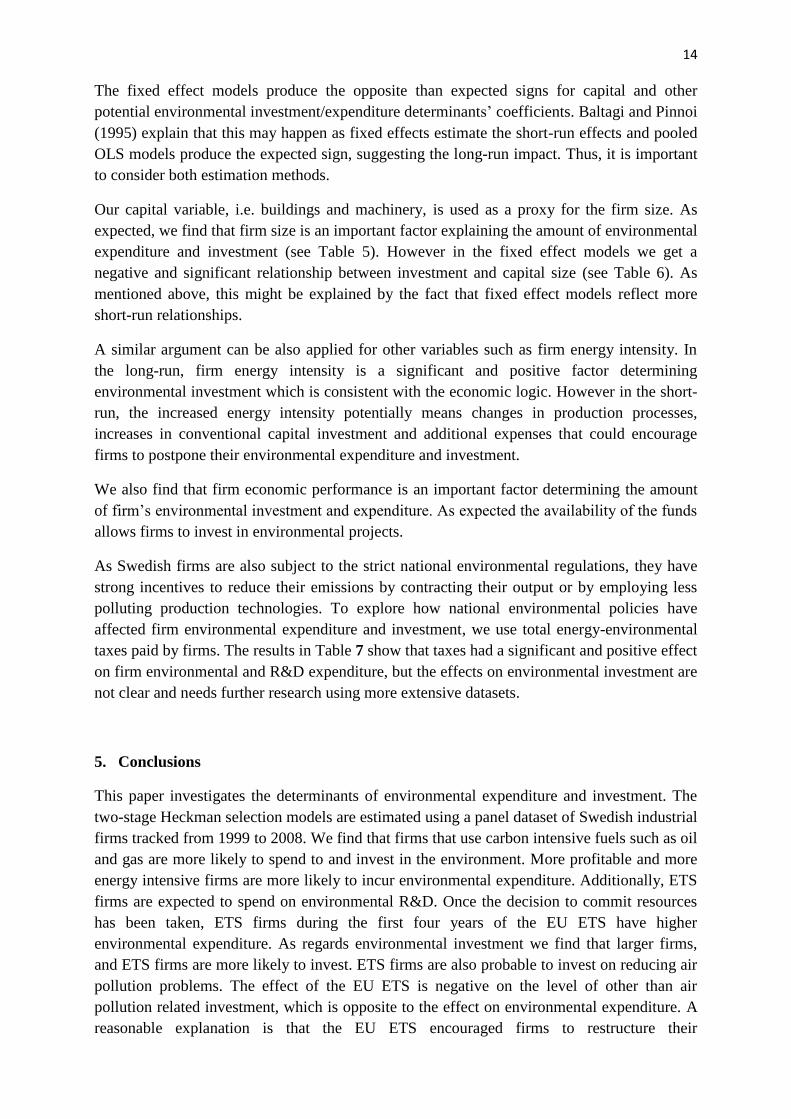
The fixed effect models produce the opposite than expected signs for capital and other
potential environmental investment/expenditure determinants’ coefficients. Baltagi and Pinnoi
(1995) explain that this may happen as fixed effects estimate the short-run effects and pooled
OLS models produce the expected sign, suggesting the long-run impact. Thus, it is important
to consider both estimation methods.
Our capital variable, i.e. buildings and machinery, is used as a proxy for the firm size. As
expected, we find that firm size is an important factor explaining the amount of environmental
expenditure and investment (see Table 5). However in the fixed effect models we get a
negative and significant relationship between investment and capital size (see Table 6). As
mentioned above, this might be explained by the fact that fixed effect models reflect more
short-run relationships.
A similar argument can be also applied for other variables such as firm energy intensity. In
the long-run, firm energy intensity is a significant and positive factor determining
environmental investment which is consistent with the economic logic. However in the short-
run, the increased energy intensity potentially means changes in production processes,
increases in conventional capital investment and additional expenses that could encourage
firms to postpone their environmental expenditure and investment.
We also find that firm economic performance is an important factor determining the amount
of firm’s environmental investment and expenditure. As expected the availability of the funds
allows firms to invest in environmental projects.
As Swedish firms are also subject to the strict national environmental regulations, they have
strong incentives to reduce their emissions by contracting their output or by employing less
polluting production technologies. To explore how national environmental policies have
affected firm environmental expenditure and investment, we use total energy-environmental
taxes paid by firms. The results in Table 7 show that taxes had a significant and positive effect
on firm environmental and R&D expenditure, but the effects on environmental investment are
not clear and needs further research using more extensive datasets.
5. Conclusions
This paper investigates the determinants of environmental expenditure and investment. The
two-stage Heckman selection models are estimated using a panel dataset of Swedish industrial
firms tracked from 1999 to 2008. We find that firms that use carbon intensive fuels such as oil
and gas are more likely to spend to and invest in the environment. More profitable and more
energy intensive firms are more likely to incur environmental expenditure. Additionally, ETS
firms are expected to spend on environmental R&D. Once the decision to commit resources
has been taken, ETS firms during the first four years of the EU ETS have higher
environmental expenditure. As regards environmental investment we find that larger firms,
and ETS firms are more likely to invest. ETS firms are also probable to invest on reducing air
pollution problems. The effect of the EU ETS is negative on the level of other than air
pollution related investment, which is opposite to the effect on environmental expenditure. A
reasonable explanation is that the EU ETS encouraged firms to restructure their

15
environmental expenses by postponing environmental investment in other than air related
areas and increasing environmental expenditure in order to comply with the EU ETS
regulation. The role of CO2 price was irrelevant in all models.
Table 7 Heckman selection models with taxes
Variables Expenditure Investment
TOTAL R&D TOTAL AIR OTHER
(1) (2) (3) (4) (5)
Total taxes (lag) 0.219** 0.101*** 0.0279 -0.0185 -0.0530
(0.107) (0.0136) (0.110) (0.0773) (0.0865)
ETS firms 2,177 275.2 2,245 1,383 2,235
(3,488) (708.8) (4,388) (3,241) (3,225)
ETS*Y05 4,956 862.6 -2,570 2,835 -4,494
(4,150) (598.1) (4,943) (4,295) (3,561)
Y05 -1,631 -1,303** -2,180 129.4 -2,320
(4,762) (664.0) (6,096) (5,375) (4,342)
Profitability (lag) -0.00141 0.000850*** 0.00396 0.000894 0.00340
(0.00234) (0.000270) (0.00299) (0.00204) (0.00224)
Energy intensity (lag) -0.563 -0.165 1.320 1.560 -0.681
(1.512) (0.158) (1.740) (1.256) (1.363)
Capital (lag) 0.00379*** -2.87e-05 0.00101 -0.000101 0.000975
(0.000562) (7.25e-05) (0.000779) (0.000520) (0.000615)
CO2 price -303.0 4.716 71.00 46.19 -10.36
(260.4) (25.72) (278.0) (214.6) (205.1)
Variance of CO2 price 512.1 126.3* 595.7 174.3 667.5
(615.5) (64.55) (730.3) (534.5) (584.1)
Tornqvist price index (lag) -10,757 680.6 -5,413 -7,273 -1,790
(7,219) (670.5) (6,134) (4,450) (4,488)
NACE1 (mining) 13,124* -125.0 21,068*** 5,162 17,626***
(6,840) (717.3) (7,509) (5,790) (5,481)
NACE2 (food, clothes) 2,965 -1,153* 2,044 -37.33 2,375
(4,891) (612.7) (5,682) (4,336) (4,262)
NACE3 (wood, paper, furniture) -1,227 -440.1 13,847** 3,426 11,363***
(4,465) (539.6) (5,403) (4,145) (3,893)
NACE4 (chemicals, minerals) 1,762 -216.6 1,712 -1,358 2,331
(4,335) (597.4) (4,991) (3,893) (3,711)
NACE5 (metals) 5,128 -349.0 1,843 2,655 2,937
(4,731) (607.5) (5,848) (4,203) (4,047)
Lambda -32,966** 1,061 -26,625 -3,014 -20,893
(16,802) (1,041) (16,675) (7,379) (13,757)
Constant 25,572* -2,086 15,668 11,354 10,719
(14,805) (2,061) (11,265) (8,941) (10,087)
No. of observations (uncensored) 794 595 691 514 637
Standard errors in parentheses, *** p<0.01, ** p<0.05, * p<0.1.
Firm economic performance is another important factor determining the amount of
environmental investment and expenditure. This corroborates the idea that environmental
investment and expenditure to some extent are motivated by strategic reasons and as a
consequence integrated with a good economic performance (Heal 2008).

16
The analysis of the small sub-sample of our dataset reveals that environmental-energy taxes
seem to motivate the level of environmental and R&D expenditure, but the effect on
investment is not clear and needs further research.
Overall, an important finding of our econometric analysis is that environmental regulation
both on the national and international levels are highly relevant motivations for environmental
expenditure and investment. Whether these policies have been sufficient to drive
environmental innovation has to be investigated by future research.
References
Baltagi, B. H. and Pinnoi, N. (1995). Public capital stock and state productivity growth:
Further evidence from an error components model Empirical Economics 20: 351-359.
Brunnermeiera, S. B. and Cohen, M. A. (2003). Determinants of environmental innovation in
US manufacturing industries. Journal of Environmental Economics and Management
45: 278-293.
Brännlund, R. and Lundgren, T. (2010). Environmental Policy and Profitability – Evidence
from Swedish Industry. Environmental Economics and Policy Studies 12: 59-78.
Brännlund, R., Lundgren, T. and Marklund, P.-O. (2011). Environmental performance and
climate policy. Working paper No. 06, Centre for Environmental and Resource
Economics. Umeå.
Carrion-Flores, C. and Innes, R. (2010). Environmental innovation and environmental
performance. Journal of Environmental Economics and Management 59: 27-42.
Collins, A. and Harris, R. I. D. (2002). Does plant ownership affect the level of pollution
abatement expenditure? Land Economics 78: 171-189.
Collins, A. and Harris, R. I. D. (2005). The impact of foreign ownership and efficiency on
pollution abatement expenditure by chemical plants: Some UK evidence. Scottish
Journal of Political Economy 52: 747-768.
Haller, S. A. and Murphy, L. (2012). Corporate Expenditure on Environmental Protection.
Environmental and Resource Economics 51: 277-296.
Heal, G. (2008). When Principles Pay: Corporate Social Responsibility and the Bottom Line.
New York: Columbia Business School Publishing.
Heckman, J. J. (1979). Sample selection bias as a specification error. Econometrica 47: 153-
161.
Horbach, J. (2008). Determinants of environmental innovation - New evidence from German
panel data sources. Research Policy 37: 163-173.
Jaffe, A. B. and Palmer, K. (1997). Environmental Regulation and Innovation: A Panel Data
Study. The Review of Economics and Statistics 79: 610-619.
Jaraitė, J., Convery, F. and Di Maria, C. (2010). Assessing the transaction costs of firms in the
EU ETS: lessons from Ireland. Climate Policy 10: 190-215.
Jorgenson, D. W. (1971). Econometric studies of investment behaviour: a survey. Journal of
Economic Literature 9: 1111-1147.
Lanjouw, J. O. and Mody, A. (1996). Innovation and the international diffusion of
environmentally responsive technology. Research Policy 25: 549-571.
Lee, A. I. and Alm, J. (2004). The Clean Air Act Amendments and Firm Investment in
Pollution Abatement Equipment. Land Economics 80: 433-447.
Lundgren, T. and Marklund, P.-O. (2010). Climate Policy and Profit Efficiency. CERE
Working paper No. 11, Centre for Environmental and Resource Economics. Umeå.
Wooldridge, J. M. (1995). Selection Corrections for Panel Data Models Under Conditional
Mean Independence Assumptions Journal of Econometrics. Journal of Econometrics
68: 115-132.