determinants of entrepreneurship in canada: state of knowledgefil… · importance of fostering...
TRANSCRIPT

Determinants of Entrepreneurship in Canada: State of Knowledge
June 2015
Small Business Branch
www.ic.gc.ca/SMEresearch

This publication is also available online in HTML in print-ready format at www.ic.gc.ca/SMEresearch.
To obtain a copy of this publication or an alternate format (Braille, large print, etc.), please fill out the Publication Request form or contact:
Web Services Centre Industry Canada C.D. Howe Building 235 Queen Street Ottawa, ON K1A 0H5 Canada
Telephone (toll-free in Canada): 1-800-328-6189 Telephone (Ottawa): 613-954-5031 Fax: 613-954-2340 TTY (for hearing-impaired): 1-866-694-8389 Business hours: 8:30 a.m. to 5:00 p.m. (Eastern Time) Email: [email protected]
Permission to Reproduce Except as otherwise specifically noted, the information in this publication may be reproduced, in part or in whole and by any means, without charge or further permission from Industry Canada, provided that due diligence is exercised in ensuring the accuracy of the information reproduced; that Industry Canada is identified as the source institution; and that the reproduction is not represented as an official version of the information reproduced, nor as having been made in affiliation with, or with the endorsement of, Industry Canada.
For permission to reproduce the information in this publication for commercial purposes, please fill out the Application for Crown Copyright Clearance or contact the Web Services Centre (see contact information above).
© Her Majesty the Queen in Right of Canada, represented by the Minister of Industry, 2015 Cat. No. Iu185-8/2015-1E-PDF ISSN 2292-6712
Aussi offert en français sous le titre Déterminants de l’entrepreneuriat au Canada : état des connaissances.

iDeterminants of Entrepreneurship in Canada: State of Knowledge—June 2015
Introduction
Entrepreneurship has been examined by a variety of scholars and organizations in recent decades. According to the Organisation for Economic Co-operation and Development (OECD), entrepreneurship is defined as the phenomenon associated with “enterprising human action in pursuit of the generation of value, through the creation or expansion of economic activity, by identifying and exploiting new products, processes or markets.” It is a dynamic concept, and can be measured through various indicators, such as enterprise start-up and survival rates, enterprise duration, and high-growth firm rates.
Although there is increasing recognition of the importance of fostering entrepreneurial activity as part of public policy, governments and international organizations have identified the need to better understand and measure the factors that influence entrepreneurship. In particular, the OECD has established the Indicators of Entrepreneurial Determinants—a framework that outlines the different factors that shape entrepreneurship. This framework explains how the determinants of
entrepreneurship can be measured and provides an improved method of internationally benchmarking these determinants.
Recognizing the need to better understand and measure entrepreneurship, this series of indicators applies the OECD framework to the Canadian context and collects the statistical information required for the framework. It is designed as a guide for anyone interested in the state of entrepreneurship in Canada, including business professionals, policy makers, economists, and academics. In addition, for each of the indicators, it identifies policy areas where the Government of Canada is moving forward in fostering entrepreneurship and how the latter is responding to the challenges faced by entrepreneurs.
The main objective of this series of indicators is twofold: (1) improve the state of knowledge on the factors that shape Canadian entrepreneurial activity; (2) help policymakers in evaluating Canada’s entrepreneurship performance in comparison to other OECD countries.

Determinants of Entrepreneurship in Canada: State of Knowledge—June 2015ii
The first part of the compilation of indicators begins by outlining the OECD framework and presenting the determinants of entrepreneurship and how they are situated in relation to entrepreneurial performance and entrepreneurial impact. Then, the indicators are classified into six categories of determinants:
1. Regulatory Framework2. Market Conditions3. Access to Finance4. Knowledge Creation and Diffusion5. Entrepreneurial Capabilities6. Culture
Each category presents the corresponding determinants and a number of the determinants are profiled in more detail. Each determinant profile will cover the following sections:
1. Defining the indicators
- It describes the indicator(s) used to measure each determinant, how they have been developed, and how they are measured.
2. Main statistical findings
- It highlights the main statistical findings on each indicator and benchmarks Canadian performance to that of other countries.
3. Past and existing policy support
- It outlines the various policies and/or programs that have been implemented in Canada, demonstrating how the Government of Canada is currently encouraging entrepreneurial activity.
4. Sources
- It indicates the sources that have been used to document each indicator.
- External links and references to online sources within the Government of Canada are included, along with paths to publicly available data for each indicator.
This series of indicators presents the most recently available data and will be updated regularly. Each indicator will be analysed over time, depending on the availability of relevant data, with a focus on presenting an evergreen analysis of the status of entrepreneurial determinants in Canada.
iiiDeterminants of Entrepreneurship in Canada: State of Knowledge—June 2015
Framework
In 2006, Denmark created the International Consortium for Dynamic Entrepreneurship Benchmarking (ICE) in an effort to develop better data on entrepreneurship. The Consortium included Canada, Denmark, Finland, the Netherlands, Norway, Sweden and the United Kingdom. Industry Canada’s Small Business Branch was part of this early effort. The OECD-Eurostat Entrepreneurship Indicators Programme that ensued helped develop multiple measures of entrepreneurship according to a simplified conceptual framework.
The initial framework designed by the OECD for analyzing the different elements of entrepreneurship is presented in Table 1. The framework distinguishes between the factors that influence entrepreneurship (determinants), the manifestation of entrepreneurship (performance), and the effects it has on the economy or society (impact).
The determinants of entrepreneurship, which is the focus of this document, illustrate the multiple factors impacting entrepreneurship.
The determinants selected for the analysis (in shaded boxes) were chosen based on their relevance, and on the availability of data. Not all the indicators examined have reached the same degree of development. Some are well established components of regular data collections, while others have only been developed in a few countries, therefore, definitions can vary.
Prepared by Industry Canada’s Small Business Branch (SBB), this series of indicators is designed to provide a brief overview of each of the selected determinants as part of the framework below. As a result, it does not aim at providing a causal analysis on how these determinants impact performance and growth. As more quality data is developed, this analysis will be expanded to include more of the indicators not currently available.

Determinants of Entrepreneurship in Canada: State of Knowledge—June 2015iv
Table 1: The Organisation for Economic Co-operation and Development Entrepreneurship Indicators Framework
Source: OECD, Entrepreneurship at a Glance, 2013.
Note: The Determinants in shaded boxes are included here, other sections to follow.
Entrepreneurial Performance
Firms Start-up rate of firms (business birth rate)
Exit rate of firms (business death rate)
Employment Proportion of high growth firms
by Employment
Financial Proportion of high growth firms
by Revenue firms
Impact
Job Creation Employment growth
Economic Growth Real Gross Domestic Product (GDP);
Real GDP per capita
Entrepreneurship Determinants
1.Regulatory Framework
2.Market
Conditions
3.Access to Finance
4.Knowledge
Creation and Diffusion
5.Entrepreneurial
Capabilities
6.Culture
Administrative Burden for Entry Competition Access to Debt
Financing
Research and Development Investment
Training and Experience of Entrepreneurs
Risk Attitudes in Society
Administrative Burden for Growth
Access to Foreign Markets Business Angels University/Industry
Partnerships
Business and Entrepreneurship Education (Skills)
Attitudes towards Entrepreneurs
Bankruptcy Regulation Anti-Trust Laws Access to Venture
Capital
Technological Cooperation
between Firms
Entrepreneurship Infrastructure
Desire for Business
Ownership
Product Regulation Access to
Domestic Markets (Interprovincial)
Access to Other Types of Equity
Technology Diffusion Immigration
Attitudes to Entrepreneurship
Education
Business and Capital Taxes
Degree of Public Involvement Stock Markets Broadband Access
Patent System Public Procurement
Safety, Health and Environmental
Regulation
Labour Market Regulation
Court and Legal Framework
Social and Health Security
Income Taxes, Wealth/Bequest
Taxes

Determinants of Entrepreneurship in Canada: State of Knowledge
June 2015 (Updated version)
1
1.1 Administrative Burden for Entry1.2 Administrative Burden for Growth1.3 Bankruptcy Regulation1.4 Product Regulation1.5 Business and Capital Taxes1.6 Patent System
Section 1
Regulatory Framework

Section 1 Regulatory Framework
2
IndicatorInternational
RankingNumber of procedures 1.0 1Time (days) 5.0 10Cost (% of income per capita) 0.4 5Overall — 3
1. Regulatory Framework
1.1 Administrative Burden for Entry
Defining the Indicator
This indicator estimates the costs incurred by businesses while fulfilling necessary administrative requirements to start a business. These costs are associated with the money, time and human resources spent on ensuring compliance with regulation and registration formalities while starting a business, including processing required claims, forms and submissions.
The following measure of administrative burden for entry is reported below:
• Overall ranking of ease of starting a business: Ratio, as measured by the World Bank, which takes into account the procedures, time, cost and paid-in minimum capital required to start a business.
Main Statistical Findings
As shown in Table 1.1-1, Canada ranks well internationally in terms of administrative burden for entry, according to the World Bank report Doing Business 2013. In 2004, Canada ranked first in the world for ease of starting a business, and retained this rank until 2007. It fell to second from 2008 to 2010, and has been in third place since that time.
Table 1.1-1: Ranking of Ease of Starting a Business 2013
Source: World Bank, Doing Business 2013.
The World Bank estimates that Canada ranks equally well in other measures such as the number of procedures, time and cost of starting a business (Table 1.1-2). For instance:
• Canada ranks first with only one procedure required to start a business.
• Based on total time spent starting a business, Canada ranks 10th out of 185 countries, with approximately five days per business, including time spent waiting for government approvals.
• The cost of starting a business in Canada is estimated at about 0.4 percent of income per capita, ranking fifth internationally. This is compared to 1.4 percent income per capita in the United States, which ranks 20th. According to Statistics Canada, the costs of corporate registration requirements in Canada are on average $181 per business, which equates to $22 per employee, and over $67 million per year in total corporate registration costs for businesses.
Table 1.1-2: Procedures, Time and Cost of Starting a Business in Canada
Source: World Bank, Doing Business 2013.
Indicator International Ranking
New Zealand 1Australia 2Canada 3Singapore 4Macedonia, FYR 5Hong Kong SAR, China 6Georgia 7Rwanda 8Belarus 9Ireland 10

3Determinants of Entrepreneurship in Canada: State of Knowledge—June 2015
Past and Existing Policy Support
The Government of Canada has launched a number of initiatives to reduce administrative burden. Budget 2010 created the Red Tape Reduction Commission (RTRC) with the mandate of addressing irritants to business that stem from federal regulatory requirements. After holding consultations with Canadian businesses in 2011, the RTRC identified 2,300 irritants for small business productivity. It produced a report, which presented a total of 90 recommendations across 18 departments and agencies. The recommendations included how to: address these irritants, reduce businesses’ compliance burden, and reduce time and costs involved for entrepreneurs when starting a business.
The Government of Canada has developed specific initiatives to facilitate business entry:
• Canada Business Network provides businesses with a wide range of information on government services, programs and regulations through an online portal and a network of service centres across Canada. This initiative is a collaborative arrangement among federal departments and agencies, provincial and territorial governments, and not-for-profit entities. It seeks to reduce the complexity of dealing with multiple levels of government, and to consolidate business information in one source.
• BizPal is a web-based service offered in partnership with provincial, territorial and municipal governments that helps businesses identify licences and permits required to begin operations.
• Service Canada is a single window access point that provides information through Internet, telephone, mail or in person on a range of programs and services available from the federal government to help start a business.
• REGISTREX provides a single window for links to the corporate registries of the federal, provincial and territorial governments. The links will bring businesses directly to the registry website of that jurisdiction or its agent where they can: - register a corporation; - report a change to corporate
information; and - file a corporation's annual report.
The electronic transaction capabilities of the websites vary.
• The Canada Revenue Agency (CRA) has established the Business Registration Online (BRO) service to simplify the way small businesses deal with the federal government, particularly with regards to tax and regulatory processes. Notably, the service allows businesses to register for a Business Number, as well as for four program accounts: Corporation income tax, GST/HST, Payroll and Import/Export.
Sources:
Statistics Canada, Survey of Regulatory Compliance Cost, 2008.
World Bank, Doing Business Series, 2004 to 2013.

Section 1 Regulatory Framework
4
1.2 Administrative Burden for Growth
Defining the Indicator
This indicator refers to the number of procedures, time spent on compliance, and/or costs incurred by businesses in fulfilling mandatory government reporting requirements and procedures. Because businesses need to devote resources to comply with government regulations, it may impact their ability to grow. These may include processing and submitting tax forms, payroll remittances, record of employment forms, mandatory government surveys, and registering property, among others.
Two measures of administrative burden for growth are reported below:
• Total cost of regulatory compliance
• Time it takes to prepare, file and pay taxes.
Statistics Canada’s Survey of Regulatory Compliance Cost gathers statistical information on the costs
incurred by small and medium-sized businesses (SMEs) in complying with government regulation.
Main Statistical Findings
Total Cost of Regulatory Compliance
According to Statistics Canada’s Survey of Regulatory Compliance Cost, the economy-wide nominal cost of compliance grew from $4.3 billion to $5.2 billion between 2005 and 2011. After adjusting for inflation and growth in the size of the business sector, the real cost of compliance fell from $4.86 billion to $4.76 billion, a 2-percent decline (Figure 1.2-1). Measured as a share of economic resources, the data indicates that the cost of regulatory compliance for SMEs fell from 0.81 percent of SME GDP in 2005 to 0.75 percent of GDP in 2011.
Figure 1.2-1: Economy-wide Estimates of the Total Cost of Regulatory Compliance
Source: Statistics Canada, Survey of Regulatory Compliance Cost, 2005, 2008, 2011.
0.0
0.5
1.0
1.5
2.0
2.5
3.0
3.5
4.0
4.5
5.0
5.5
2005 2008 2011
($ billions)
4.86 4.84 4.76

5Determinants of Entrepreneurship in Canada: State of Knowledge—June 2015
Time it takes to prepare, file and pay taxes
According to the 2011 Survey of Regulatory Compliance Cost:
• SMEs prepared and submitted about 12 million submissions to government to comply with key federal, provincial and municipal regulations, which translated into over 14 million compliance hours.
• Annual federal/provincial business income tax filing was the most burdensome administrative requirement for businesses, costing on average between $500 and $4,145 per business per year depending on the size of the business.
• Payroll remittances and federal/provincial sales taxes were the second and third most burdensome administrative requirements for businesses, costing on average $839 and $454 per year respectively.
In 2013, the World Bank ranked Canada eighth in terms of the ease of paying taxes. This ranking reflects a weighted average of the number of payments per year (8), time spent on compliance per year (131 hours), and the total tax rate (26.9 percent of profit) for the average Canadian establishment.
Past and Existing Policy Support
Following the recommendations of the Advisory Committee on Paperwork Burden Reduction (ACPBR), established in 2004, the Government of Canada committed to reducing by 20 percent the burden of paperwork imposed on businesses across 13 federal departments and agencies. This included streamlining regulations, eliminating duplicate requirements, harmonizing overlapping obligations, and reducing the number of reporting requests. As identified by the ACPBR, these irritants have a clear detrimental effect on growth, competitiveness and innovation. The mandate
of the ACPBR concluded in 2009, and was a precursor to the Red Tape Reduction Action Plan (RTRAP).
Launched in October 2012 by the Treasury Board Secretariat, the RTRAP recommends several measures to reduce administrative burdens for growth. These measures include a mandatory analysis of small business impacts in the Regulatory Impact Analysis Statements (RIAS) of regulators, and a requirement for departments and agencies to remove one regulation for each new one they introduce. The Action Plan also includes measures specific to particular sectors and across departments and agencies such as the Canada Revenue Agency and Health Canada. For example, it recommends that regulatory bodies improve the delivery of services for businesses, improve the availability and clarity of tax information, and simplify reporting obligations for businesses.
The Government of Canada introduced a number of additional initiatives to streamline administrative compliance and to reduce administrative burdens for growth:
• BizPal is a web-based service offered in partnership with provincial, territorial and municipal governments that helps businesses identify licences and permits required to begin operations.
• The Canada Revenue Agency's My Business Account offers businesses secure online access to their tax accounts, thus reducing the time required to process tax claims.
• In partnership with the United States Government, the Government of Canada launched a number of initiatives to reduce administrative burdens for business growth. These include the Canada Border Services Agency (CBSA)’s Single Window Initiative, which allows businesses to electronically

Section 1 Regulatory Framework
6
1. More information on joint Canada–U.S. cross-border initiatives can be found in section 2.3: Access to Foreign Markets.
submit information on commercial shipments containing regulated goods, with the goal of reducing the amount of documentation required to import, export and transport goods. They also include the Canada–U.S. Beyond the Border Action Plan, announced in December 2012, which outlines several initiatives designed to reduce the administrative burden for businesses wishing to transport goods or deliver services across the Canada–U.S. border.1
• In January 2013, the Government of Canada announced proposed changes to the Corporations Returns Act to reduce reporting burdens for Canadian business. Under this reform, only corporations with revenues of more than $200 million, assets over $600 million, or foreign debt and equity over $1 million would have to report financial and ownership information. As a result, 32,000 businesses will no longer be required to file returns under the Act.
Sources:
Statistics Canada, Survey of Regulatory Compliance Costs, 2011.
Statistics Canada, Survey of Regulatory Compliance Costs, 2008.
Statistics Canada, Survey of Regulatory Compliance Costs, 2005.
7Determinants of Entrepreneurship in Canada: State of Knowledge—June 2015
1.3 Bankruptcy Regulation
Defining the Indicator
Bankruptcy is a legal process for persons (including corporations recognized by law) who can no longer pay back debt. The person who owes the debt assigns all assets to a trustee in bankruptcy, which sells it or uses it to help pay back the debt to creditors.
This section focuses on business bankruptcy, and examines the bankruptcy process according to three measures:
• Time (years) for creditors to recover their credit.
• Cost of bankruptcy proceedings (as a percentage of the value of the debtor’s estate).
• Recovery rate (cents on the dollar).
These measures are provided by the World Bank in its Doing Business 2013 report.2 The time required for credit recovery is measured from the time of the company’s default until the payment of some or all of the money owed to creditors. The cost of proceedings is recorded as a percentage of the value of the debtor’s estate, and includes all associated costs and fees of insolvency administrators, auctioneers and lawyers, among others.
Finally, the bankruptcy recovery rate is measured in average cents on the dollar recouped by creditors through reorganization, liquidation or debt enforcement (foreclosure) proceedings. The rate is based on the outcome of bankruptcy (whether the businesses emerges from the process as a going concern or if its assets are sold piecemeal), the value of assets deducted, and the value lost over the course of insolvency proceedings. Doing Business 2013 report’s overall international ranking for resolving insolvency is based on this recovery rate. A good ranking in these indicators would suggest that the
business bankruptcy process is faster, cheaper and relatively less burdensome.
Main Statistical Findings
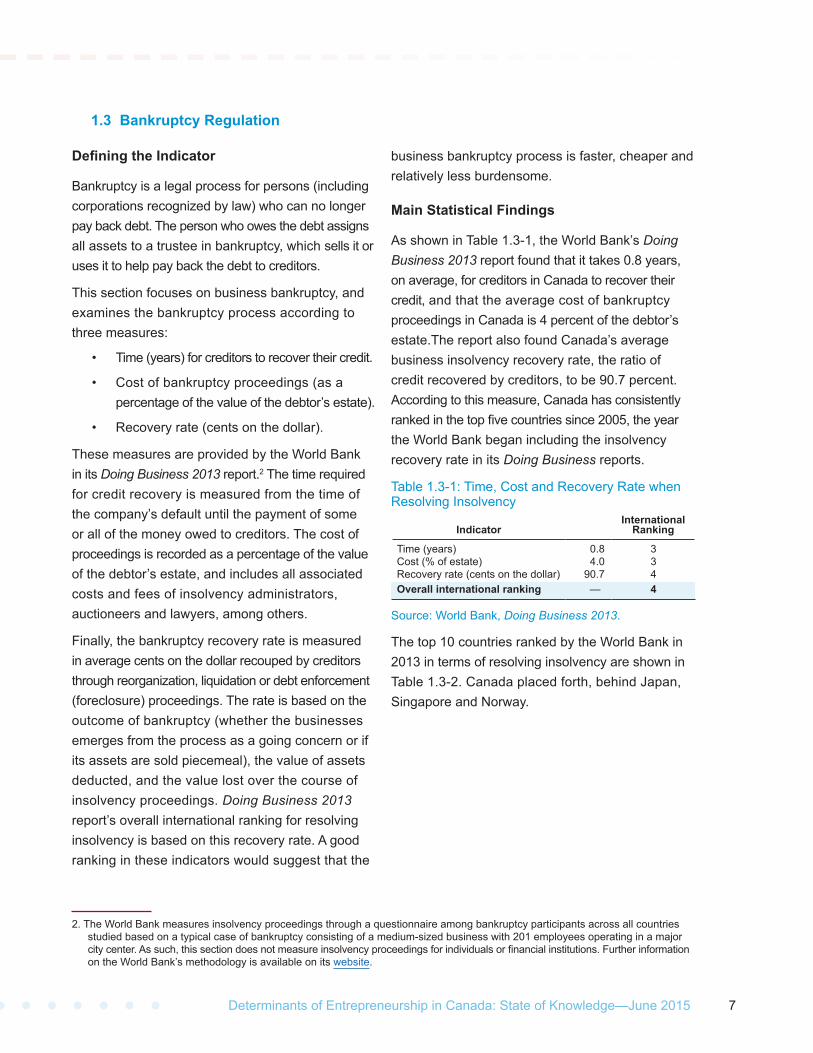
As shown in Table 1.3-1, the World Bank’s Doing Business 2013 report found that it takes 0.8 years, on average, for creditors in Canada to recover their credit, and that the average cost of bankruptcy proceedings in Canada is 4 percent of the debtor’s estate.The report also found Canada’s average business insolvency recovery rate, the ratio of credit recovered by creditors, to be 90.7 percent. According to this measure, Canada has consistently ranked in the top five countries since 2005, the year the World Bank began including the insolvency recovery rate in its Doing Business reports.
Table 1.3-1: Time, Cost and Recovery Rate when Resolving Insolvency
Source: World Bank, Doing Business 2013.
The top 10 countries ranked by the World Bank in 2013 in terms of resolving insolvency are shown in Table 1.3-2. Canada placed forth, behind Japan, Singapore and Norway.
2. The World Bank measures insolvency proceedings through a questionnaire among bankruptcy participants across all countries studied based on a typical case of bankruptcy consisting of a medium-sized business with 201 employees operating in a major city center. As such, this section does not measure insolvency proceedings for individuals or financial institutions. Further information on the World Bank’s methodology is available on its website.
IndicatorInternational
Ranking
Time (years) 0.8 3Cost (% of estate) 4.0 3Recovery rate (cents on the dollar) 90.7 4Overall international ranking — 4

Section 1 Regulatory Framework
8
Table 1.3-2: Business Insolvency Recovery Rate, International Rankings
Source: World Bank, Doing Business 2013.
Past and Existing Policy Support
The insolvency process in Canada is governed by the Bankruptcy Insolvency Act (BIA), the Companies’ Creditors Arrangement Act (CCAA), along with related regulations, rules and directives. The Office of the Superintendent of Bankruptcy Canada (OSB) continues to review this framework and to undertake initiatives to ensure that the framework reflects the reality of debtors and creditors in an ever-changing Canadian economy. Among the initiatives undertaken by the OSB:
• The most recent legislative amendments to both acts came into force in 2009. These changes are designed to modernize the insolvency system, to increase fairness and reduce abuse of the system, and to encourage restructuring among businesses as an alternative to bankruptcy. Amendments related to businesses include clarifying the powers of the Court during the bankruptcy process, reforming the protection of unpaid suppliers’ rights, and clarifying rules for collective bargaining agreements. More information on these amendments is available on the OSB website.
• In 2010–11, the OSB undertook a review of the Trustee Licensing Framework, which oversees the requirements for trustees to obtain and keep their license to practice.
The review included consultations with business and trustee stakeholders in Canada, and the OSB is currently working to address areas for reform that emerged throughout the review, including the license application process.
• The OSB promotes awareness of the rights and responsibilities of stakeholders in the insolvency system through a number of initiatives. First, in 2011–12 the OSB updated its website to make it client-oriented, and published several items online including the Bankruptcy and Insolvency Records, the Unclaimed Funds Database, and new information resources for debtors and creditors. Second, the OSB News was launched that same year, and helps communicate with stakeholders, providing information on OSB initiatives in order to facilitate their implementation.
• Finally, in 2012, the OSB launched the CCAA Registry Project, a web-based filing system that gives trustees a more efficient filing mechanism for statutory forms, and enables the OSB to maintain a public registry of information in CCAA filings, to record and address complaints, and to investigate monitors’ conduct.
Sources:
Office of the Superintendent of Bankruptcy Canada, Annual Report 2011-2012.
Office of the Superintendent of Bankruptcy Canada, Glossary.
Office of the Superintendent of Bankruptcy Canada, Insolvency Statistics in Canada, 2012.
World Bank, Doing Business 2013.
World Bank, Doing Business, “Methodology for Resolving Insolvency,” 2013.
Rank EconomyRecovery rate (cents
on the dollar)
1 Japan 92.82 Singapore 91.33 Norway 90.84 Canada 90.75 Finland 89.76 Netherlands 88.87 Belgium 88.78 United Kingdom 88.69 Ireland 87.510 Denmark 87.1

9Determinants of Entrepreneurship in Canada: State of Knowledge—June 2015
1.4 Product Regulation
Defining the Indicator
Product regulation refers to efforts by governments to intervene in product markets that are inherently competitive. Such regulation is generally used with the intention of improving the functioning of market economies and correcting market failures.
Over the past two decades, governments and international organizations have sought to better understand product regulations and their effects on the economy. In particular, the OECD launched the Indicators of Product Market Regulation (PMR) in 1998, which measures regulation at the economy-wide level every five years. The project focused on the construction of a database of internationally comparable data on certain regulations, with a focus on economic and administrative regulations that affect product markets.
The economy-wide PMR score is a comprehensive indicator based on a weighted average of a total of 18 low-level indicators. These include price controls,
the level of command-and-control regulation, licenses and permits systems, and the communication of rules and procedures.
Main Statistical Findings
Economy-wide product market regulation scores in 2003 and 2008 across selected OECD countries is shown in Figure 1.4-1. These results demonstrate the stringency of product regulation, with higher numbers representing countries with policies that are more restrictive to competition. Except for the United Kingdom and Australia, the countries shown here have loosened product market regulations over the time period.
Canada is part of a group of countries characterised by lower levels of product market regulation compared with the OECD average. In 2008 Canada ranked fifth, behind the United Kingdom, the United States, Ireland and the Netherlands.
Figure 1.4-1: Aggregate Product Market Regulation Scores, 2003 and 2008
Source: OECD, Integrated PMR indicator 2008.
0.0
0.2
0.4
0.6
0.8
1.0
1.2
1.4
1.6
1.8
2.0
2008
Sweden
Austra
lia
Hunga
ry
Norway
Japa
n
Switzerl
and
Finlan
d
Icelan
d
Denmark
Spain
Canad
a
Netherl
ands
Irelan
d
United
Stat
es
United
King
dom
2003
Score

Section 1 Regulatory Framework
10
Canada’s overall score has consistently improved since the indicator was created in 1998. This was driven by advancements relating to a number of sub-indicators, including price controls, the use of command and control regulation, simplification of procedures for businesses, and barriers to entry in network sectors.
Past and Existing Policy Support
In recent years, the Government of Canada has launched a number of reforms related to product market regulation.
• In June 2012, the Government of Canada announced proposed amendments to the Investment Canada Act to remove barriers to foreign investment. The amendments raise thresholds for reviewing foreign investments to $1 billion over a four-year period, and change the basis of the threshold from asset value to enterprise value.
• Launched in October 2012, the Treasury Board’s Red Tape Reduction Action Plan (RTRAP) is leading the reform of several kinds of product regulation at a number of departments and agencies. For example, the Action Plan recommends that the Department of Foreign Affairs, Trade and Development Canada (DFATD) reduce businesses’ burden of compliance with export regulation, and DFATD has responded with a new import system for steel and steel products. The Action Plan also includes government-wide measures designed to reduce the burden of product regulation on businesses. It sets targets for the timely
issuance of licenses, certifications and permits, and commits regulators to set and publish measurable standards for delivering them.
• In addition, Economic Action Plan 2012 committed to changing how the Canadian Food Inspection Agency (CFIA) monitors and enforces non-health and non-safety food labelling regulations. For example, the CFIA will introduce a web-based label verification tool that encourages consumers to bring validated concerns directly to companies and associations for faster resolution. The federal government will also repeal regulations related to container standards to remove unnecessary barriers to importing new products from international markets.
• In 2013, the Canadian Radio-television and Telecommunications Commission (CRTC) announced a new wireless code effective December 2013. This will make it easier for individual and small business customers to obtain and understand the information in their wireless service contracts; establish user-friendly business practices for the wireless service industry; and contribute to a more dynamic wireless market. Also, that same year, the Department of Industry released a new spectrum license transfer framework to provide greater clarity on the review of spectrum license transfer requests, and to promote competition in Canada’s wireless market.

11Determinants of Entrepreneurship in Canada: State of Knowledge—June 2015
• The Government of Canada has also committed to reforming existing price controls on agricultural products. In December 2011, Bill C-18 reformed the Canadian Wheat Board to give western farmers the freedom to sell their products on an open market. Also, in 2013 the Canadian Dairy Commission reformed the supply management system to exempt certain dairy products from existing price controls.
Sources:
Government of Canada, Red Tape Reduction Action Plan Report, 2012.
Organisation for Economic Co-operation and Development, Integrated PMR Indicator 2008.
A. Wolfl et al. Ten Years of Product Market Reform in OECD Countries, OECD, 2009.

Section 1 Regulatory Framework
12
1.5 Business and Capital Taxes
Defining the Indicator
This indicator refers to the levels of taxation imposed by governments on the profits earned by businesses through providing goods and services or through selling assets.
Two tax-related measures are discussed below:
• The federal small business tax rates and limits.
• International comparisons with other OECD countries.
Main Statistical Findings
Federal Small Business Tax Rates and Limits
Research conducted by the OECD on the impact of tax reform on economic growth has found that levels of corporate taxation shape business incentives by affecting returns on investment, including returns on innovation, and that lower taxes on small businesses’ income and capital gains can improve economic growth.
The OECD research found that corporate income taxes discourage firms from undertaking activities that
are important for growth, such as investments in physical capital and in productivity improvements. Corporate taxes also affect entrepreneurs’ decisions to start a business and can impact the profits of businesses, in particular for high-growth firms. Furthermore, corporate taxation affects foreign companies’ decisions to invest in Canada, and Canadian companies’ decisions to continue doing business in Canada.
The current federal small business tax rate of 11 percent applies to the first $500,000 of eligible income. Between 2002 and 2007, this tax rate was 12 percent. The Federal Budget 2009 increased the amount of small business income eligible for the reduced federal tax rate from $400,000 to $500,000 as of January 1, 2009.
As seen in Table 1.5-1, the federal corporate tax rate currently stands at 15 percent, down from the 2007 rate of 21 percent. In 2008, the 1.5 percent federal corporate surtax was eliminated, and the overall corporate rate has been reduced gradually every year since.
Table 1.5-1: Federal Small Business Limit and Tax Rates
Source: Department of Finance, 2012 * As per the Canada Revenue Agency website, these rates are in effect January 1, 2013, and may be subject to change.
International Comparisons
Canada’s small business tax rate is now among the lowest in the OECD economies, according to the OECD Tax Database. As shown in Figure 1.5-1, the Canadian rate (including combined federal and provincial rates) has been declining over the past
six years, reaching 15.3 percent in 2011. It is slowly approaching France’s small business tax rate of 15.0. The small business tax rates in the U.S. and France have been constant since 2005 at 20.1 and 15.0 percent, respectively. The rates in Japan
2000 2001 2002 2003 2004 2005 2006 2007 2008 2009 2010 2011 2012 2013*Federal small business limit ($000)
200 200 200-300 200 200-
300 250 250 300 300 400 400 500 500 500 500 500
Federal small business rate (%) 12 12 21 12 21 12 12 12 12 12 11 11 11 11 11 11
Federal corporate tax rate (%) 28 27 25 23 21 21 21 21 19.5 19 18 16.5 15 15

13Determinants of Entrepreneurship in Canada: State of Knowledge—June 2015
have decreased from 29.3 percent in 2005 to 24.8 percent in 2009. Korea also saw a decrease from 14.3 percent in 2008 to 11 percent in 2010.
It should be noted that for many countries there are different rates across sub-national jurisdictions such as states and provinces. The estimates in Figure 1.5-1, as developed through the OECD
Tax Database, combine the central government corporate tax rate with the sub-central government (combined provincial and local) corporate tax rate. Thus, the OECD estimate for Canada combines the federal corporate tax for SMEs (11 percent) with the combined provincial and local rate for SMEs (4.3 percent in Ontario).
Figure 1.5-1: Small and Medium-Sized Enterprises’ Tax Rates across Select Countries
Source: OECD, Tax Database: Corporate and capital income taxes.
Past and Existing Policy Support
Over the past decade, Canada has reduced levels of taxation imposed on businesses. Among the G7 countries, Canada now has the lowest overall tax rate on new business investment, and nearly the lowest statutory corporate income tax rate, second to the United Kingdom.
In addition to lowering tax rates on corporate income and capital gains, the federal government has undertaken additional measures to reduce the tax burden imposed on businesses:
• Introduced in 2003, the small business capital gains rollover allows investors, subject to certain limits, to defer the taxation of capital gains on investments in eligible
small business shares if the proceeds of disposition are reinvested in other eligible small business shares. To be eligible, a small business must have no more than $50 million in assets immediately after the investment.
• Economic Action Plan (EAP) 2013 increased the lifetime capital gains exemption for dispositions of qualified small business corporation shares, including qualified farm and fishing property. It also raised the exemption from $750,000 to $800,000 as of 2014, and indexed it to inflation in subsequent tax years.
5
10
15
20
25
30
35
United StatesKoreaJapan
FranceCanada
201320122011201020092008200720062005
SME Tax Rate (%)

Section 1 Regulatory Framework
14
• The federal income tax incentives for Scientific Research and Experimental Development (SR&ED) are intended to provide broad-based support for SR&ED performed in every industrial sector in Canada, and to assist small businesses in particular. As of 2012, there are two rates of investment tax credits (ITCs) for SR&ED in Canada: (1) a general rate of 15 percent, and (2) an enhanced rate of 35 percent, provided to small Canadian-Controlled Private Corporations (CCPCs) on their first $3 million of qualified expenditures. EAP 2012 committed to simplifying the SR&ED tax incentive program and improving cost-effectiveness and predictability.
• EAP 2013 extended the Hiring Credit for Small Business for one year, which was initially announced in Budget 2011. This temporary measure allows businesses to claim a credit of up to $1,000 against a small employer’s increase in its current Employment Insurance (EI) premiums over those paid in the previous year.
Sources:
Canada Revenue Agency, Corporation Tax Rates, 2013.
Department of Finance, Budget 2009.
Department of Finance, Budget 2012.
Department of Finance, Budget 2013.
Organisation for Economic Co-operation and Development, Tax Database, 2013.

15Determinants of Entrepreneurship in Canada: State of Knowledge—June 2015
1.6 Patent System
Defining the Indicator
A patent system is a country’s framework defining the rules governing the granting and enforcement of patents, a form of intellectual property (IP). The patent system is meant to provide a set of incentives leading to more invention, innovation and the subsequent activities conducive to new products and services being marketed.
The measures presented below refer to:
• Patent applications and grants data.
• Intellectual property international rankings and statistics.
Main Statistical FindingsPatent Applications and Grants Data
While overall applications with the Canadian Intellectual Property Office (CIPO) fell slightly during 2011–12 (Table 1.6-1), the number of domestic applications increased by nearly 8 percent. A greater proportion of total patent applications submitted in Canada continue to be submitted from foreign sources (86 percent in 2011–12), compared with domestic applications (14 percent).
Similarly, a greater proportion of patents granted in Canada were to foreign sources (89 percent), compared to domestic sources (11 percent). Between 2010–11 and 2011–12, the number of total patents granted increased by approximately 6 percent.
Table 1.6-1: Patent Applications Received and Granted by Canadian Intellectual Property Office, 2011–12
Source: CIPO Annual Report 2011–2012: A Foundation for the Future.
Canadian patents in force represent 1.7 percent of all patents in force worldwide, while U.S. patents in force represent 26.8 percent of all patents in force worldwide (World Intellectual Property Organization, World Intellectual Property Indicators 2012).
Intellectual property international rankings and statistics
The World Economic Forum’s Global Competitiveness Report measures the level of IP rights protection across countries. Canada’s ranking has fallen since 2011, moving down two ranks from 12th in 2011–12 to 14th in 2012–13.
According to the World Intellectual Property Organization (WIPO), between 2010 and 2011, most countries saw positive growth in IP applications. This included a 31.2 percent increase in China, a 21.6 percent increase in Brazil and an 8.4 percent increase in Canada. In 2011, Canada saw a total of 133,921 trademark application class counts,3 approximately 73,000 (55 percent) of which were submitted by residents. By comparison, the number of trademark application class counts in China reached 1,418,251 that same year, over one million greater than any other country. Nearly 1.3 million applications in China were submitted by residents.
Total applications
2011–12% of total
applications
% change from 2010–11 to
2011–12Total grants
2011–12% of total
grants
% change from 2010–11 to
2011–12Foreign Sources 30,198 86.25% -2.08% 18,610 88.93% 4.56%
Domestic Sources 4,813 13.75% 7.51% 2,317 11.07% 17.02%
Total 35,011 100.00% -0.87% 20,927 100.00% 5.81%
3. Trademark data refer to class counts, i.e., the number of classes of goods and services specified in a trademark application or registration. Trademark offices have either a single- or multi-class filing system. For better comparison of international trademark application activity across offices, WIPO uses application and registration class counts. For more information, see the World Intellectual Property Organization Indicators 2012, p. 163.

Section 1 Regulatory Framework
16
4. The Patent Cooperation Treaty (PCT) is an international patent law treaty (1970). A patent application filed under the PCT is called an international application, or PCT application.
5. The World Intellectual Property Organization (WIPO), World Intellectual Property Indicators 2012.
WIPO also found that Canada and other countries saw an increase in the number of international patent applications filed under the Patent Cooperation Treaty (PCT).4 International patent applications filed in 2011 by residents of Canada increased 8.6 percent compared to 2010. The largest growth in number of applications was among residents of China, with an increase of 29 percent in 2011, while the Netherlands met the sharpest decline (13.8 percent).
Overall, worldwide industrial design applications grew 16 percent between 2010 and 2011. China’s intellectual property office received the highest number of industrial design applications (521,468) compared to the U.S. (30,467) and Canada (5,227). Over 97 percent of industrial design applications in China were submitted by residents, in comparison with over 84 percent in Canada submitted by non-residents.5
Past and Existing Policy Support
CIPO is the agency within the federal government that is tasked with monitoring and administering Canada’s system of IP rights: patents, trade-marks, copyrights, industrial designs and integrated circuit technologies. CIPO delivers programs and policy support in several areas to ensure Canada’s IP framework is in tune with the current IP environment.
• In 2010, the Patent Rules were amended to assist applicants in obtaining patent rights, to eliminate a number of administrative requirements, to clarify a number of provisions in the Patent Rules, and to align them with international standards.
• Throughout 2010–11, the agency delivered 60 IP case studies in 42 educational institutions
to raise awareness on the benefits to IP protection. That same year, CIPO delivered three training sessions to 55 trade commissioners in partnership with the Canadian Federal Department of Foreign Affairs, Trade and Development. As a result, trade commissioners will be able to provide the appropriate IP resources to clients. CIPO also partnered with the Canadian Commercial Corporation (CCC) to provide IP training to 22 CCC officers.
• In Fall 2012, CIPO hosted roundtable discussions with individuals and stakeholders from the business community to better understand the challenges and barriers faced by small and medium-sized enterprises in using the IP system. These roundtables touched on the IP application process, knowledge of IP and information tools, IP strategy and challenges of using the Canadian IP system.
• Through the Patent Prosecution Highway (PPH), CIPO maintains a number of bilateral agreements with other countries for IP. These agreements provide a means of prioritizing examination of a patent application in one country when the patent has already been processed within another country. Conditions include an indication of patentable subject matter, or an indication of novelty, inventive step and industrial applicability (in the international phase). Through the PPH, Canada has an ongoing agreement with the United States, and pilot agreements with Denmark, Germany, Israel, Japan, Korea, Finland, Spain and the United Kingdom.

17Determinants of Entrepreneurship in Canada: State of Knowledge—June 2015
• In addition to bilateral agreements, CIPO conducts a number of activities with WIPO to harmonize the Canadian IP regime with other international jurisdictions. The goal of such activities is to make it easier for Canadians to file abroad, and for foreigners to file in Canada.
In 2007, the Government of Canada introduced its science and technology strategy called Mobilizing Science and Technology to Canada’s Advantage. The strategy emphasized the contribution of science and technology in building a more competitive and sustainable economy. In the strategy, the federal government expressed its commitment to maintain a balanced patent regime that provides appropriate incentives for innovation while respecting Canadians’ values and ensuring that they have access to the latest scientific information and technologies.
In line with the 2007 Science and Technology Strategy, the Patent Rules were amended in March 2011 to accelerate the processing of patent applications relating to green technologies. The amendments allow the Commissioner of Patents to expedite the
examination of applications for patents in the area of environmental technology.
In March 2013, the Government of Canada introduced the Combating Counterfeit Products Act, which seeks to foster an environment that promotes innovation and creativity, attracts new investment, and stimulates the growth of the knowledge-based economy. Key provisions include protecting brands and creative works by strengthening Canada’s trade-mark enforcement regime, registering non-traditional trademarks found in new technologies, and simplifying the overall trademark registration process to ensure a high level of validity and efficiency for trademark owners.
Sources:
Canadian Intellectual Property Office, Annual Report 2010–2011: Adapting to Changing Realities; Annual Report 2011–2012: A Foundation for the Future; Business Plan 2011–2012: Touch the Future of IP; Business Strategy 2012–2017: Inspired by Innovation; Committed to Success.
World Economic Forum, The Global Competitiveness Report 2012–2013.
World Intellectual Property Organization, World Intellectual Property Indicators, 2012.

18

Determinants of Entrepreneurship in Canada: State of Knowledge
June 2015 (Updated version)
19
2.1 Competition2.2 Access to Foreign Markets2.3 Access to Domestic Markets (Interprovincial)2.4 Degree of Public Involvement
Section 2
Market Conditions

Section 2 Market Conditions
20
2. Market Conditions
2.1 Competition
Defining the Indicator
This indicator measures the extent to which businesses face competitive pressure. The Organisation for Economic Co-operation and Development (OECD) identifies two types of policies for promoting competition: policies to promote the general level of competition and policies focusing on certain sectors, particularly deregulated network industries (e.g., utilities, telecommunications, transportation). The World Economic Forum’s The Global Competitiveness Report 2013-2014 includes several indicators on market efficiency in competition, based on the Forum’s Executive Opinion Survey of business leaders.
The following indicators of the performance of Canada’s competition policies and outcomes are reported below:
• Extent of market dominance
• Effectiveness of anti-monopoly policy.
Main Statistical Findings
The market dominance indicator measures whether corporate activity is dominated by a few business groups (low ranking) or spread among many firms (high ranking). As seen in Figure 2.1-1, in 2013 Canada ranked 14th of the 34 OECD countries in terms of the extent of its market dominance. In Canada, and much of the OECD, markets are increasingly dominated by fewer firms than in 2006.
Figure 2.1-1: Extent of Market Dominance, 2006 and 2013
Source: World Economic Forum, The Global Competitiveness Report 2013-2014.
Score
0
1
2
3
4
5
6
7
2013
Israe
lChil
e
South
Korea
Hunga
ry
Mexico
Slovak
ia
Portug
al
Icelan
d
Sloven
ia
Greece
Estonia
Czech
Rep
ublic
Austra
lia
Turke
y
France
New Zea
land
Spain
Luxe
mbourg
Finlan
d
Sweden
Canad
a
Irelan
d
PolandIta
ly
Norway
Denmark
United
Stat
es
United
King
dom
Belgium
Netherl
ands
Austria
Japa
n
German
y
Switzerl
and
2006

21Determinants of Entrepreneurship in Canada: State of Knowledge—June 2015
The effectiveness of anti-monopoly policy indicator measures the extent that anti-monopoly or competition policy promotes competition. As seen in Figure 2.1-2, in 2013 Canada ranked 21st out of 34 OECD countries
in the effectiveness of its anti-monopoly policy. Similar to market dominance, anti-monopoly policies in much of the OECD have become less effective than in 2006.
Figure 2.1-2: Effectiveness of Anti-Monopoly Policy, 2006 and 2013
Source: World Economic Forum, The Global Competitiveness Report 2013-2014.
Past and Existing Policy Support
Canada’s competition framework is based on a set of policies enforced by Canada’s Competition Bureau. The Bureau is an independent law enforcement agency responsible for the administration and enforcement of Canada’s competition legislation, which is made up of the Competition Act, the Consumer Packaging and Labelling Act, the Textile Labelling Act, and the Precious Metals Marking Act.
• The Competition Bureau plays an important role in ensuring truth in advertising, in investigating cartels, in preventing abuses of market power, and in reviewing mergers. The Bureau uses a range of tools including public education, the authority to search for and seize evidence, the ability to refer criminal matters to the Attorney General,
and the power to bring civil matters before the Competition Tribunal.
• The Competition Bureau plays an advocacy role to promote increased competition, advising regulators and policymakers to regulate only where necessary and assisting in implementing minimally intrusive policies where market forces are insufficient to achieve objectives. In 2013, the Bureau provided comments on the Canadian Radio-television and Telecommunications Commission’s Wireless Code of Conduct and conducted a public consultation to identify economic sectors where advocacy efforts should targetted.
Score
0
1
2
3
4
5
6
7
2013
Mexico
Israe
lIta
ly
Slovak
ia
Greece
Hunga
ry
Sloven
ia
Poland
Czech
Rep
ublic
Portug
al
South
Korea
Icelan
dSpa
in
Canad
a
Austra
liaChil
e
Estonia
Turke
y
Austria
France
Irelan
d
Denmark
Switzerl
and
United
King
dom
Luxe
mbourg
United
Stat
es
Belgium
German
yJa
pan
Norway
New Zea
land
Netherl
ands
Sweden
Finlan
d
2006

Section 2 Market Conditions
22
• In March 2010, the Competition Act was amended to better protect Canadians from the harm caused by anti-competitive conduct. These changes to the Act allow for more effective criminal enforcement against cartel agreements, while providing businesses with more flexibility to benefit from legitimate alliances with competitors.
• In the Speech from the Throne 2013, the Government of Canada announced policies to improve transparency for consumers, including cost disclosure for different payment methods and cooperating with provinces and territories against predatory payday lenders.
The Government of Canada is also engaging in initiatives to ensure competition in network sectors, particularly in telecommunications:
• Economic Action Plan 2012 proposed key amendments to the Telecommunications Act. These changes, which came into force in June 2012, lifted foreign investment restrictions for telecommunications companies that hold less than a 10 percent share of the total Canadian telecommunications market. They are expected to encourage greater competition by strengthening the position of new entrants, improving access to capital, and enabling closer strategic partnerships.
• Economic Action Plan 2013 announced a review of the rules governing the credit and debit card industry so that the principles of transparency, fairness and competition would guide the evolution of mobile payments.
• In March 2013, the federal government announced new measures to increase competition in the wireless sector, including expanding the requirement for companies to provide roaming to competitors, strengthening cell tower sharing rules, and ensuring at least four wireless providers in every region can acquire spectrum in the upcoming 700 Mhz spectrum auction.
• The Speech to the Throne 2013 announced new policies to reduce wireless roaming costs and to require unbundling of television channels.
Source:
World Economic Forum, The Global Competitiveness
Report 2013-2014.

23Determinants of Entrepreneurship in Canada: State of Knowledge—June 2015
2.2 Access to Foreign Markets
Defining the Indicator
This indicator measures the extent to which Canadian businesses can export goods and services to markets outside Canada. Access to markets outside Canada can be reduced by tariffs or non-tariff trade barriers, including the time, money, and other resources required to comply with regulations and transport goods to foreign destinations.
The following measures of the ability of Canadian firms to access foreign markets are reported below:
• The percentage of small and medium-sized enterprises (SMEs) that export
• The value of exports by all Canadian firms
• Comparison by destination and industry sector
• International ranking of export burdens.
Main Statistical Findings
According to Industry Canada’s Key Small Business Statistics 2013 (KSBS), only 10.4 percent of Canada’s SMEs export to foreign markets. The total value of Canadian exports has been increasing since the 2008–09 recession, though exports have yet to return to pre-2008 levels. Canadian enterprises of all sizes exported goods with a total value of approximately $374 billion in 2011, a $48 billion (15 percent) increase from 2010. Compared to medium-sized businesses (16.2 percent) and large businesses (59.9 percent), small businesses make up 23.9 percent of the value of exports.
The United States (89.3 percent) and Europe (32.1 percent) are, by significant margins, the most popular export destinations for SMEs exporters (Table 2.2-1).
Table 2.2-1: Export Destinations of by Business Size, 2011
Sources: Statistics Canada, Survey on Financing and Growth of Small and Medium Enterprises, 2011; and Industry Canada calculations.
In terms of the destination of exports by industry sector in 2011 (KSBS 2013):
• The United States was prominent as a destination market for all industry sectors, particularly for the accommodation and food services (97.9 percent); health care, information and arts (97.3 percent); and transportation and warehousing (96.6 percent) sectors.
• Export destinations in Europe were important for the health care, information and arts sector (64.9 percent).
• Exports to Latin America were dominated by manufacturing (23.5 percent).
• Exports to other Asian destinations were dominated by agriculture, forestry and other resource-based industries (25.0 percent) and the wholesale trade sector (19.0 percent).
United States Europe Latin America China Other Asia Others
Business Size (in percent)1 to 4 employees 87.2 28.9 9.1 7.4 11.4 14.3
5 to 19 employees 89.6 35.5 9.6 11.2 7.9 15.9
20 to 99 employees 92.2 32.2 20.3 8.8 16.9 17.4
100 to 499 employees 94.8 30.7 21.7 19.2 26.4 10.0
All SMEs 89.3 32.1 11.9 9.5 11.6 15.4

Section 2 Market Conditions
24
The World Bank’s Doing Business report measures the burdens associated with exporting, according to three indicators:
• The number of documents required to export goods.
• The time necessary to comply with all procedures required to export goods.
• The cost of exporting per container, excluding tariffs.
Table 2.2-2 shows Canada’s performance according to the Doing Business indicators on export burdens. In 2012, exporting from Canada required three documents, took seven days on average, and cost US$1,610 per container on average. Based on an average ranking of all three indicators, Canada ranked 42nd in all surveyed countries in 2013, falling from 39th in 2006. Canada currently ranks high in terms of the number of days and documents required for export, but lower in terms of the monetary cost of exporting. In fact, Canada’s cost of exporting is the highest among OECD countries.
Table 2.2-2: Canada’s Ranking in Export Burdens, Selected Indicators, 2013
Sources: World Bank Group, Doing Business 2013; and Industry Canada calculations. Note: Canada’s overall export burden ranking is based on the average of the rankings of the three indicators among all 185 countries examined.
Past and Existing Policy Support
A core priority of the Department of Foreign Affairs, Trade and Development (DFATD), as expressed in its 2013–14 Report on Plans and Priorities, is to “generate international opportunities for Canadian business by negotiating agreements to open and expand markets, by facilitating trade and investment and by encouraging innovation through international science and technology partnerships.” DFATD seeks to accomplish this through a number of mechanisms.
• DFATD leads the negotiation of bilateral and multilateral free trade agreements (FTAs) with trade partner countries. These agreements seek to remove restrictions such as tariffs, taxes and quotas, thus improving Canadian businesses’ access to international markets. The first and most important of these agreements is the North American Free Trade Agreement (NAFTA), signed in 1994 between Canada, the U.S. and Mexico. Since 1997, Canada has signed FTAs with Chile, Colombia, Costa Rica, Israel, Jordan, Panama and Peru, and is currently negotiating new agreements with a number of economies. Canada has also concluded negotiations on the Comprehensive Economic and Trade Agreement (CETA) with the European Union.
• The World Trade Organization (WTO) was founded in 1995 to provide countries with a multilateral forum to negotiate trade liberalization. This forum allows countries to identify and lower barriers to international trade, to promote the free flow of goods and services across national borders, and to improve access to foreign markets. DFATD plays an active role in
IndicatorInternational
Ranking
Documents to export (number) 3 2Time to export (days) 4 7Cost of exporting (US$ per container) 1,610 141Overall 42

25Determinants of Entrepreneurship in Canada: State of Knowledge—June 2015
promoting Canadian interests within the organization, and works with other countries to develop rules to make the global business environment stable and predictable.
• The department’s Trade Commissioner Service (TCS) offers ongoing support for Canadian enterprises that do business in foreign markets. Through a network of Canadian offices abroad, Trade Commissioners provide Canadian exporters and investors with country-level information on doing business in foreign markets. These officials also play a key role in facilitating businesses’ access to an extensive network of contacts, including foreign governments, decision-makers, and key business leaders.
• The Global Markets Action Plan is a trade plan announced in November 2013 to advance Canadian commercial interests around the world. The Plan sets a concrete target to grow the presence of Canada’s SMEs in emerging markets, from 29 percent to 50 percent by 2018.
In addition to the services offered by DFATD, Export Development Canada (EDC) provides trade finance and risk management services to Canadian exporters and investors in 187 markets worldwide. It also provides insurance and financial services, bonding products, and small business solutions to Canadian exporters and investors. Close to 80 percent of EDC's customers are small and medium-sized businesses.
The Business Development Bank of Canada (BDC) provides export planning services, which helps businesses considering exporting evaluate potential benefits and develop an exporting plan. BDC also provides financing support for activities related to exporting, including market research, product research and development (R&D), and equipment investments for increased production.
Based on consultations in Canada and the U.S., the Government of Canada launched the Beyond the Border Action Plan in December 2011, with the goal of making it easier for Canadian and American firms to do business on both sides of the border. Canada and the U.S. have since taken several measures to facilitate cross-border trade including a joint entry/exit pilot project at the land border, an Integrated Cargo Security Strategy, and a border wait-time measurement system.
Other initiatives include the joint Canada-U.S. Free and Secure Trade and NEXUS programs, both designed to expedite the border clearance process for low-risk, pre-approved travelers between Canada and the U.S. Improvements to these programs in 2013 include opening additional NEXUS trusted traveler lanes at border crossings and expanding existing security screening lanes.
Sources:
Statistics Canada, Survey on Financing and Growth of Small and Medium Enterprises, 2011.
Industry Canada, Key Small Business Statistics, 2013.
World Bank Group, Doing Business, “Trading Across
Borders,” 2013.

Section 2 Market Conditions
26
2.3 Access to Domestic Markets (Interprovincial)
Defining the Indicator
This indicator measures the extent to which Canadian businesses can sell goods and services to non-local markets within Canada, defined here as trade of goods and services between provinces and territories. In Canada, formal interprovincial tariffs do not exist, but the size of the domestic market can be limited by differences in regulations and standards across jurisdictions.
The following measures of the ability of Canadian firms to access markets outside their home province or territory are reported below:
• The percentage of SMEs that have sales outside their home province or territory, and comparisons by sector
• The value of interprovincial trade by all Canadian firms.
Main Statistical Findings
Despite a momentary decline during the 2009 financial crisis, stronger domestic economic conditions have allowed interprovincial trade in Canada to experience sustained growth since 2005 (Table 2.3-1). The size of the economy matters in terms of domestic imports as the greatest total values were found in Ontario, Quebec and Alberta. In terms of growth over the period, we find a different picture where the provinces of Saskatchewan and Manitoba led with growth of 60 and 55 percent respectively compared to Ontario (33 percent) and Quebec (18 percent). Although their levels are considerably lower, Nunavut and Yukon experienced growth in their domestic trade of 114 and 89 percent respectively over the period.
Table 2.3-1: Imports of Goods and Services from Other Provinces, by Region (millions of dollars)
Source: Statistics Canada, CANSIM table 384-0038.
2005 2006 2007 2008 2009 2010 2011 2012British Columbia 35,938 38,645 40,563 42,623 41,420 44,269 47,262 48,437
Alberta 45,385 48,775 51,928 54,249 50,918 55,312 58,255 59,394
Saskatchewan 15,739 17,368 18,820 20,993 21,380 23,946 26,065 25,177
Manitoba 14,823 16,084 17,872 19,209 19,353 20,539 22,440 23,024
Ontario 73,559 78,247 82,730 86,664 82,997 87,934 95,819 98,102
Quebec 57,184 59,202 61,921 62,393 60,386 62,351 65,914 67,572
New Brunswick 10,624 11,658 13,892 14,636 11,666 13,027 13,757 13,150
Nova Scotia 10,324 10,585 11,534 11,809 11,952 12,486 13,292 13,903
Prince Edward Island 2,072 2,205 2,507 2,689 2,414 2,451 2,694 2,804
Newfoundland and Labrador 6,616 6,748 7,064 8,014 7,486 7,932 8,575 8,510
Yukon 714 759 834 850 926 1,179 1,436 1,349
Northwest Territories 1,831 2,136 2,299 2,306 2,202 2,282 2,395 2,449
Nunavut 726 785 1,102 1,435 1,130 1,355 1,692 1,553
Outside Canada 165 144 126 179 209 244 135 88
Canada 275,700 293,341 313,192 328,049 314,439 335,307 359,731 365,512

27Determinants of Entrepreneurship in Canada: State of Knowledge—June 2015
According to the Survey on Financing and Growth of Small and Medium Enterprises, 2011, 18.3 percent of Canada’s SMEs have interprovincial sales (Table 2.3-2). For comparison, 94.0 percent of SMEs have sales in their local municipality, 43.8 percent of SMEs have sales within their home provinces but outside their local municipality, and 10.4 percent of SMEs export outside Canada. SMEs in wholesale trade (46.2 percent) and manufacturing (38.0 percent) are especially likely to have interprovincial sales. SMEs in these industries are also likelier to export outside Canada.
Table 2.3-2: Percentage of SMEs in Sector with Interprovincial Sales
Source: Statistics Canada, Survey on Financing and Growth of Small and Medium Enterprises, 2011.
Past and Existing Policy Support
The Agreement on Internal Trade (AIT) provides a framework to reduce barriers to the free movement of people, goods, services and investments within Canada. Signed in 1994, it is a political accord among the federal, provincial and territorial governments (except Nunavut). There is growing support from governments and businesses to modernize Canada’s internal market, renew the AIT, and ensure alignment with Canada’s recently concluded international trade agreements. The federal government has exercised leadership in this area, releasing a roadmap for AIT renewal, One Canada, One National Economy: Modernizing Internal Trade in Canada,
and committing in Budget 2014 to create an Internal Trade Barriers Index to guide decisions on priority areas for action.
Under the AIT, the Government of Canada and provincial governments have implemented a number of reforms and initiatives:
• Revised the AIT’s government-to-government dispute resolution mechanism to, among other things, provide for monetary penalties of up to $5 million (for the largest jurisdictions) for continued non-compliance with AIT obligations.
• Established MARCAN, a website that connects to procurement opportunities for the Government of Canada, provincial, territorial, and local governments. It also provides rules on public procurement, and other related information for businesses wishing to participate in procurement processes.
• Introduced full labour mobility for workers in regulated occupations, under AIT Chapter 7, so that a worker recognized as qualified by one province or territory will, upon application, be recognized in any other province or territory for that profession. The Labour Mobility Coordinating Group (LMCG) coordinates implementation of Chapter 7.
• Harmonized standards on consumer issues including direct sellers regulations, cost of credit disclosure, prohibited collection practices, Internet sales contracts, and upholstered and stuffed articles. This work is managed by the Consumer Measures Committee (CMC).
• Amended the Importation of Intoxicating Liquors Act to remove federal restrictions against transportation of wine across provincial borders for personal use, while respecting provincial jurisdiction on regulating possession, movement and sale of wine. Similar amendments for beer and spirits were made in 2014.
Industry Percentage
Wholesale trade 46.2Manufacturing 38.0Transportation and warehousing 30.4Professional, scientific and technical services 29.5
Retail trade 16.5Health care and social assistance; Information and cultural industries; Arts, entertainment and recreation 14.7Natural resources 10.4Other services 9.8Accommodation and food services 7.0Construction 5.5All SMEs 18.3

Section 2 Market Conditions
28
Canadian provinces and territories have implemented other initiatives that reduce interprovincial trade barriers. Under the New West Partnership Trade Agreement (NWPTA), British Columbia, Alberta and Saskatchewan have committed to full mutual recognition or reconciliation of their rules affecting trade, investment and labour mobility. The Trade and Cooperation Agreement between Ontario and Quebec includes commitments regarding several sector-specific joint initiatives such as the creation
of joint rules for financial regulatory measures, and harmonization of regulations on transportation and agricultural products.
Sources:
Statistics Canada, Survey on Financing and Growth of Small and Medium Enterprises, 2011.
Statistics Canada, CANSIM table 384-0038.

29Determinants of Entrepreneurship in Canada: State of Knowledge—June 2015
2.4 Degree of Public Involvement
Defining the Indicator
This indicator measures the extent to which public policy is involved in the business sector. Public involvement can affect the size and efficiency of the potential market that entrepreneurs face.
The indicator of the degree of Canadian public involvement in the economy is measured below.
Main Statistical Findings
The OECD’s indicators of product market regulation measures regulation at the economy-wide level. State control is an aggregate indicator that measures the scope of the public involvement in the economy. It reflects the extent to which
governments influence firm decisions through public ownership, price controls or other forms of coercive—instead of incentive-based—regulation. The Index scale goes from 0 to 6, ranging from least to most restrictive.
Between the years 2003 and 2013, the majority of OECD countries have removed much of their direct involvement. In the same vein, Canada has improved its scores both in terms of the indicator as well as its relative OECD ranking (Figure 2.4-1). Whereas Canada had a score of 2.08 and ranked 10th among OECD countries in 2003, it improved its score to 1.92 and ranked 7th in 2013.
Figure 2.4-1: OECD, State Control, 2003 and 2013
Source: OECD, Product Market Regulation Statistics, 2013. * Note: Data for 2013 is not available for the United States.
Score
0
1
2
3
4
2013
United
Stat
es*
Israe
l
Switzerl
and
Greece
Sloven
iaKore
a
Sweden
Slovak
ia
France
Portug
al
Norway
BelgiumIta
ly
Finlan
d
Irelan
d
New Zea
land
Hunga
ryChil
e
Austra
lia
Icelan
d
Denmark
Spain
Czech
Rep
ublic
Canad
aJa
pan
German
y
Estonia
Austria
United
King
dom
Netherl
ands
2003

Section 2 Market Conditions
30
Past and Existing Policy Support
The Government of Canada has integrated the consideration of market-oriented alternatives to regulations through its Canadian Cost-Benefit Analysis Guide, which includes the development of non-regulatory measures such as fees, subsidies, or tradable permits, when analysing new regulatory options.
On removing price controls, the Government of Canada removed mandatory sales of wheat and barley to the Canadian Wheat Board (CWB) in 2012. Canadian wheat and barley farmers can now sell products to the voluntary CWB or other purchasers, and the CWB is transitioning into a privately owned corporation. The goal of the reforms to the Canadian grains market is to give farmers better price signals and access to competitive markets.
The scope of public enterprises is currently under the Government of Canada’s Corporate Asset Management Review. Since 2009, the Review is assessing Crown corporate assets to improve their efficiency and effectiveness and to allocate resources to high priorities and maximize benefits to taxpayers. As a result of the Review, the Government of Canada announced its intention to sell Ridley Terminals Inc. in 2012.
Source:
OECD, Product Market Regulation Statistics, 2013.

Determinants of Entrepreneurship in Canada: State of Knowledge
June 2015
31
3.1 Access to Debt Financing3.2 Business Angels3.3 Access to Venture Capital3.4 Access to Other Types of Equity3.5 Stock Markets
Section 3
Access to Finance

Section 3 Access to Finance
32
3. Access to Finance
3.1 Access to Debt Financing
Defining the Indicator
This indicator measures the ability of entrepreneurs to gain access to debt financing. Debt financing includes term loans, lines of credit, credit cards and non-residential mortgages.
The following indicators used to measure access to debt financing are reported below:
• Debt financing request and approval rates
• Access of loans
• Ease of resolving insolvency.
Main Statistical Findings
Debt financing request and approval are related to size: generally, larger businesses are more likely to request debt financing, and they are more likely to have financing approved. In 2011, according to the Survey on Financing and Growth of Small and Medium Enterprises, about a quarter of SMEs requested debt financing, and nearly 90 percent of requesting businesses were approved financing in full or in part. As shown in Table 3.1-1, medium-sized enterprises with 100 to 499 employees, the request rate is 47.6 percent and the approval rate is 97.7 percent, significantly higher than the rates for all SMEs.
Table 3.1-1: Debt Financing Request and Approval Rates for Selected Years
Sources: Statistics Canada, Survey on Financing of Small and Medium Enterprises for 2000, 2001, 2004, and 2007; and Statistics Canada, Survey on Financing and Growth of Small and Medium Enterprises, 2011. Note: Data for firms with 100 to 499 employees in 2001, 2004, and approval rate for firms with 20 to 99 employees in 2001, are unavailable due to confidentiality rules.
Of the forms of debt financing, lines of credit are most popular, requested by 54 percent of SMEs in 2011. Credit cards are requested by 40 percent of SMEs and term loans are requested by 36 percent. Non-residential mortgages are not common,
requested by only 16 percent of SMEs. The smallest businesses, with 1 to 4 employees, are more likely than other SMEs to request credit cards, and less likely to request other forms of debt financing.
2000 2001 2004 2007 2011Request Rates (percent)1 to 4 employees 23.4 21.2 20.7 13.0 19.9
5 to 19 employees 33.4 26.6 22.9 20.0 29.9
20 to 99 employees 36.2 23.1 33.4 27.0 36.9
100 to 499 employees 35.4 — — 30.0 47.6
Total SMEs (1 to 499) 29.0 25.0 23.0 17.0 25.5
Approval Rates (percent)1 to 4 employees 78.9 79.7 82.6 86.0 88.4
5 to 19 employees 84.6 84.0 81.0 92.0 88.5
20 to 99 employees 87.2 — 80.9 88.0 97.1
100 to 499 employees 93.4 — — 97.0 97.7
Total SMEs (1 to 499) 82.0 83.0 82.0 89.0 89.9

33Determinants of Entrepreneurship in Canada: State of Knowledge—June 2015
The “ease of access to loans score” is produced by the World Economic Forum’s The Global Competitiveness Report, measuring the ability of an entrepreneur without collateral to obtain a loan (Figure 3.1-1). In general, access to loans fell
worldwide since the financial crisis of 2007–08, but there was less tightening in Canada than in most other countries. In the OECD, Canada ranked 9th in 2013, up from 20th in 2006.
Figure 3.1-1: Ease of Access to Loans Score, 2006 and 2013
Source: World Economic Forum, The Global Competitiveness Report 2013-2014.
Past and Existing Policy Support
The difficulties that SMEs face while attempting to access financing can be attributed to a number of issues including information asymmetries, high risks, high transaction costs, lack of collateral and little credit history. This can create a situation in which credit-worthy SMEs cannot obtain financing and services from formal financial institutions such as banks. In those cases, government intervention may be an important support. In Canada, there are a number of policies and programs in place that aim to address some of the market gaps and facilitate SME lending. For example:
• Industry Canada administers the Canada Small Business Financing Program (CSBFP), which guarantees business loans with financial institutions. In sharing risk with
lenders the government makes it easier for small businesses to obtain loans from financial institutions. In 2012–13, lenders registered 6,201 loans worth $910.2 million under the CSBFP. Borrowers less than one year old accounted for 58 percent of total lending by value (Industry Canada, 2014).
• Business Development Bank of Canada (BDC), as a Crown corporation, provides financing and consulting services to entrepreneurs, with a specific focus on SMEs. In fiscal year 2014, BDC provided services to 30,000 entrepreneurs, and approximately $4.1 billion in acceptances (BDC, Annual Report 2014).
Score
0
1
2
3
4
5
6
2013
GreeceItaly
Spain
Slovenia
Ireland
Hungary
Portugal
Korea, South
PolandMexic
o
United Kingdom
Iceland
Israel
Denmark
Czech
Republic
Austria
Turkey
Slovakia
Estonia
Netherlands
Germany
FranceJa
pan
Belgium
Australia
CanadaChile
Switzerla
nd
United States
Luxembourg
Finland
Norway
Sweden
New Zealand
2006

Section 3 Access to Finance
34
• Export Development Canada (EDC), Canada’s export credit agency, provides Canadian exporters with financing, insurance and bonding services, as well as trade and market expertise. In fiscal year 2013, EDC served over 7,000 customers, of which 77 percent were SMEs, and delivered $18.3 billion in loans to Canadian clients and their foreign trading partners to finance their activities (EDC, Annual Report 2013).
Sources:
Business Development Bank of Canada (BDC), Annual Report 2014.
Export Development Canada (EDC), Turning the Corner on Trade, 2013 Annual Report, 2013.
Industry Canada, Canada Small Business Financing Act—Annual Report 2012–13, 2012.
Statistics Canada, Survey on Financing and Growth of Small and Medium Enterprises, 2011.
Statistics Canada, Survey on Financing of Small and Medium Enterprises, 2000, 2001, 2004, 2007.
World Bank Group, Doing Business, “Resolving Insolvency,” 2014.
World Economic Forum, The Global Competitiveness Report 2013–2014.

35Determinants of Entrepreneurship in Canada: State of Knowledge—June 2015
3.2 Business Angels
Defining the Indicator
Business angels (also called angel investors) can be broadly defined as individuals that invest their own funds in start-up companies with which they have no personal connection. They typically invest less than venture capitalists in the seed stage of a business. Business angels are often high-net-worth experienced entrepreneurs or businesspeople, well educated, and often actively provide advice to the management teams of companies they invest in.
Main Statistical Findings
According to the Survey on Financing and Growth of Small and Medium Enterprises, a relatively small group of SMEs receive financing from business angels, and this before their first sale of goods or services. SMEs with 20 or more employees are more likely to use angel financing than smaller SMEs (Table 3.2-1).
Table 3.2-1: Percentage of SMEs Using Financing from Unrelated Individuals for Start-up, 2007 and 2011
Sources: Statistics Canada, Survey on Financing of Small and Medium Enterprises, 2007; and Statistics Canada, Survey on Financing and Growth of Small and Medium Enterprises, 2011. Note: Data for 2007 includes debt financing (loans) only, while data for 2011 includes debt and equity financing.
A survey of Canadian angel groups (networks of individuals who may perform angel-type investments individually or as a group) by the National Angel Capital Organization (NACO) found that:
• In 2013, business angel groups reported 199 investments with a total value of $89 million, of which 133 were for new investments with a value of $37.4 million, significantly up from the $40.5 million invested by 19 groups in 2012.
• Business angel groups mostly invest in local businesses: 93 percent of angel group investments are made in the same city or in the same province, and only 7 percent are made out of the province, including 2 percent out of the country.
• A total of 22 percent of the surveyed business angel groups reported investments that leveraged government programs funding. According to the survey data, the most common programs used by angel-backed firms are the Federal Economic Development Agency for Southern Ontario’s Investing in Business Innovation, the Ontario government’s Health and Technology Exchange and the British Columbia government’s Scientific Research & Experimental Development (SR&ED) Tax Credit.
2007 2011Usage Rates (percent)1 to 4 employees 1.0 2.6
5 to 19 employees 1.0 4.0
20 to 99 employees 6.0 8.8
100 to 499 employees 5.0 6.1
Total SMEs (1 to 499) 1.0 3.6

Section 3 Access to Finance
36
Visible investment by business angel groups in Canada has been smaller than the United States and Europe (Table 3.2-2). However, it is difficult the gauge the level of overall Canadian angel investments, given that only organized business angel groups were surveyed. The survey did
not capture an unknown, but large, number of individual business angel investors, that are unaffiliated with an angel group or that do not report their investment activity through an angel group. The challenge of measuring the real size of business angel investments is not unique to Canada.
Table 3.2-2: Business Angel Investment in Select Regions in 2009, 2010 and 2012
Sources: United States, Europe and United Kingdom: OECD, Financing High-Growth Firms: The Role of Angel Investors; and Canada: National Angel Capital Organization, 2013 Report on Angel Investing Activity in Canada. Note: “—” indicates that the information was not available.
Past and Existing Policy Support
Business angels play an important role in the Canadian entrepreneurship ecosystem, particularly with growth-oriented and early-stage companies. Canadian securities regulations provide an exemption on prospectus filing for small business receiving business angel investment, provided that the angel investor is an accredited investor. This exemption aims to encourage business angel investment.
Some business angels invest in companies individually and some invest in groups in order to leverage knowledge and relationships as well as share risk. In Canada, there are more than 30 business angel groups.
The Government of Canada and some provincial governments have been involved in supporting business angels and business angel groups.
The existing federal programs are:
• The Federal Economic Development Agency for Southern Ontario provides funding to leverage existing investments through its Investing in Business Innovation initiative. This initiative provides funding to assist start-up businesses in Southern Ontario in commercializing new products and processes. It provides eligible small businesses that already have committed investment from a business angel or venture capitalist with repayable contributions of up to $1 million for no more than one third of total project costs.
• The Investing in Business Innovation initiative also provides funding to support business training to new entrepreneurs, helping them to start a new business and
All Business Angels Formal Groups Only
All investmentInvestment
as share of GDP Group investmentGroup investment as share of GDP
USD Million percent USD Million1/100 of a percent
(basis point)United States (2009) 17,700 0.127 469 0.34
Europe (2009) 5,557 0.034 383 0.23
United Kingdom (2009) 624 0.029 74 0.34
Canada (2010) — — 15 0.10
Canada (2012) — — 41 0.23

37Determinants of Entrepreneurship in Canada: State of Knowledge—June 2015
attract the private angel and/or venture capital required to grow a business commercializing world-leading innovations. Organizations may be eligible for a non-repayable contribution of up to $500,000 per network for outreach, building capacity, providing mentorship, education and resource development, and coordination and convening.
Provincial governments are also involved and include programs such as:
• Income tax credit programs for individuals investing in small businesses. This type of program is available in six provinces and one territory (British Columbia, Manitoba, New Brunswick, Newfoundland and Labrador, Nova Scotia, Prince Edward Island and Yukon). These programs are broad in nature, and investors other than business angels are also eligible.
• Investment funds, of which Anges Québec Capital is an example, are funds aimed at providing financial support to members of the Réseau Anges Québec. It was created in 2012 and financed with $20 million from the Québec government (Investissement Québec) and $10 million from Anges Québec (a business angel group). These organizations invest in cooperation and provide financial leverage to enhance business development.
Sources:
Anges Québec Capital Website, Anges Québec Capital support financial angels, 2012.
FedDev Ontario Website, Investing in Business Innovation, 2014.
National Angel Capital Organization, 2013 Report on Angel Investing Activity in Canada, Accelerating the Asset Class, 2014.
Organisation for Economic Co-operation and Development, Financing High-Growth Firms: The Role of Angel Investors, 2012.
Statistics Canada, Survey on Financing and Growth of Small and Medium Enterprises, 2011.
Statistics Canada, Survey on Financing of Small and Medium Enterprises, 2000, 2001, 2004, 2007.

Section 3 Access to Finance
38
3.3 Access to Venture Capital
Defining the Indicator
Venture capital (VC) is a specialized form of private equity, characterized chiefly by high-risk investment in new or young companies, most often high-tech sectors, with the potential for high-growth. Venture capital funds are usually structured in limited partnership format with the general partner professionally managing the fund and the limited partners investing in the funds. Limited partners represent a wide array of investors such as institutional investors (pension funds, insurance companies, etc.), large corporations, governments, and high-net-worth individuals.
The following indicators of access to venture capital are reported below:
• Availability of venture capital
• Early stage and expansion stage venture capital investment as a percentage of gross domestic product (GDP).
Main Statistical Findings
Figure 3.3-1 shows venture capital investment as a percentage of GDP in all Organisation for Economic Co-operation and Development (OECD) countries. Israel, with 0.30 percent of GDP in early stage venture capital (1st) and 0.06 percent of GDP in expansion stage venture capital (2nd), is the best performing OECD country with a total venture capital investment of 0.36 percent of GDP (1st). The United States and Canada are respectively ranked a distant 2nd and 3rd. While venture capital in Canada is mostly invested in the expansion stage—good for 3rd highest and comparable to Israel and the United States—it does not perform as well in terms of investment in early stage venture capital where it ranked 8th.
Figure 3.3-1: Early and Expansion Stage Venture Capital Investment as a Percentage of GDP, 2012 (2011 where specified)
Source: OECD, Entrepreneurship at a Glance, 2013.
Score
0
0.05
0.1
0.15
0.2
0.25
0.3
0.35
0.4
UnspecifiedExpansionEarly
Poland
Czech RepublicItaly
Greece (2011)
Slovenia (2011)
Estonia (2
011)
Portugal
Austria
Spain
New Zealand (2011)
Germany
Australia
Belgium
Luxembourg
Japan (2011)
FranceNorway
Netherlands
Denmark
Switzerland
United KingdomFinland
Korea, South
Ireland
Sweden
Hungary
Canada (2011)
United States Isra
el

39Determinants of Entrepreneurship in Canada: State of Knowledge—June 2015
Past and Existing Policy Support
1. The Government of Canada announced in the Economic Action Plan (EAP) 2013 that the Venture Capital Action Plan would enhance the available capital and resources to expand the growth of innovative high potential companies. This plan consists of various initiatives to help the industry develop and expand. These initiatives are:
- Deployment of $400 million to help increase private sector investments in early-stage risk capital, and to support the creation of large-scale venture capital funds led by the private sector. This new injection of capital is expected to attract close to $1 billion in new private sector investments over a period of 7 to 10 years.
Of this, $350 million is to establish or recapitalize up to four large fund-of-funds led by the private sector in partnerships with institutional and corporate strategic investors, as well as interested provinces. Announced funds of funds are Northleaf Venture Catalyst Fund, HarbourVest Partners, and Teralys Capital.
A total of $50 million will be invested in four existing high-performing venture capital funds focusing on information and communication technologies, life sciences, and key growth sectors. Announced funds are CTI Life Sciences Fund II, Real Ventures Fund III, Lumira Capital II, and Relay Ventures III.
- $100 million through the Business Development Bank of Canada (BDC) to improve the supply of capital and support for very early stage companies and entrepreneurs in priority sectors of economic importance.
- $100 million over five years to help outstanding and high-potential incubator and accelerator organizations expand their services to entrepreneurs.
The BDC acts as an agent of government in the implementation of the $400-million investment since it already has the expertise and an extensive venture capital program, with more than $1 billion in current and planned investment. The BDC manages direct investment funds, as well as an indirect fund of funds, that focus on the information technology, health care, and energy/cleantech sectors. To further increase its investments in venture capital, BDC created a Strategic Investments and Partnerships group that focuses on investments promoting entrepreneurship, such as business accelerators.
2. Avrio Capital (Avrio) is an independent Canadian venture capital fund. It was previously a division of Farm Credit Canada (FCC). This fund focuses on helping Canadian companies, primarily SMEs, develop sustainable solutions to the worldwide growing agriculture demand. Export Development Canada (EDC) has been an investor in Avrio since its beginning (2006), and helps Canadian companies connect with potential foreign buyers.
3. EDC is an active investor in direct venture and growth capital investments and also partners with private-sector fund managers, both domestically and internationally. During periods of constrained credit, this is particularly helpful to SMEs as it gives them access to the private equity they need to penetrate the global marketplace.
Since the inception of the program, EDC has provided commitment totaling $1.1 billion, including new commitments of $217 million in 2013.

Section 3 Access to Finance
40
The $1.1 billion commitment includes $425 million in commitments to next generation exporters, $140 million in commitments to mid-market growth exporters and $553 million in commitments focused on connecting with emerging markets.
4. Provincial governments have also implemented programs to support the venture capital market:
- The Ontario Venture Capital Fund (OVCF) is a joint initiative between the Government of Ontario and institutional investors structured as a fund of funds that support innovative, high-growth companies.
- Build Ventures is a venture capital fund with a focus on companies in information technology, clean technology, life sciences and other high-growth sectors initiated by the governments of Nova Scotia, New Brunswick and Prince Edward Island. BDC is also an investor.
- British Columbia has a venture capital tax credit on investments into venture capital funds, or direct investments into eligible small businesses to help them develop and expand.
Sources:
Government of Canada, Economic Action Plan 2013.
Organisation for Economic Cooperation and Development, Entrepreneurship at a Glance, 2013.
Thomson Reuters, VC Reporter, 2012.
World Economic Forum, The Global Competitiveness Report 2013–2014.

41Determinants of Entrepreneurship in Canada: State of Knowledge—June 2015
3.4 Access to Other Types of Equity
Defining the Indicator
Equity financing could be formal such as venture capital, private equity, and publicly traded stocks, or less formal, such as business angel investments and investments from friends and families. Recently, crowdfunding has emerged as a new form of financing in Canada.
The following indicator of access to equity capital is reported below:
• Percentage of SME owners using financing from friends and family.
Main Statistical Findings
Friends and family are an important source of financing for SME owners. As shown in Table 3.4-1, in 2011, 21.8 percent of SME owners used equity or loans from friends and family to financing the start-up of their business, and 14.5 percent of SME owners used funds to finance the acquisition of an existing business. However, friends and family are a last resort source of financing as only 2.2 percent of SME owners used friends and family funds as first financing for their businesses.
Table 3.4-1: Percentage of SMEs Using Financing from Friends and Family, 2011
Source: Statistics Canada, Survey on Financing and Growth of Small and Medium Enterprises, 2011. Note: “—” indicates that data were suppressed to meet confidentiality requirements of the Statistics Act.
Past and Existing Policy Support
Although few policy measures exist that target friends and family as investors, some do exist to facilitate more informal types of investment. The Lifetime Capital Gains Exemption (LCGE), for instance, applies against taxable capital gains on the sale of qualified small business corporation shares. Additionally, tax on capital gain can be deferred when the proceeds of a small business investment are re-invested in another small business within 120 days (also called “roll-over” treatment). Economic Action Plan 2013 increased the LGCE from $750,000 to $800,000, and planned to index the LGCE to inflation in the future.
An alternative form of financing, known as crowdfunding, has been developed with the greater access to people through social media. This new way of funding a project or a business (for-profit or non-for-profit) is to pool small amounts of capital from a large number of people through Internet and social media. It provides entrepreneurs with access to financing that they would not have the opportunities to obtain otherwise. In Canada, crowdfunding entrepreneurs can provide rewards such as priority delivery of products or gifts, revenue sharing, or receive payments as donations in cases of philanthropic or charitable campaigns.
Start-up Acquisition
Primary financing provider
Usage Rates (percent)
1 to 4 employees 12.1 25.1 2.1
5 to 19 employees 17.1 20.0 3.0
20 to 99 employees 20.1 18.3 —
100 to 499 employees 17.3 20.4 —
Total SMEs (1 to 499) 21.8 14.5 2.2

Section 3 Access to Finance
42
Securities regulators are currently studying how to regulate equity crowdfunding. The Ontario Securities Commission and Government of Saskatchewan’s Financial and Consumer Affairs Authority have proposed possible exemptions for equity crowdfunding.
Source:
Statistics Canada, Survey on Financing and Growth of Small and Medium Enterprises, 2011.

43Determinants of Entrepreneurship in Canada: State of Knowledge—June 2015
3.5 Stock Markets
Defining the Indicator
Stock markets are public entities that facilitate the trading of stocks, bonds and other securities. Through stock markets, businesses can raise financial capital for liquidity gains, expansion or acquisition by selling shares of ownership to the general public. Stock market rules serve to inform the investors with accurate information, control the volume of stocks and organize the stock market exchanges.
Several measures assessing the stock market activities of SMEs and large firms are reported below:
• Market capitalization, as a percentage of GDP
• Value of stocks traded, as a percentage of GDP.
Main Statistical Findings
Market capitalization measures the total value of all companies’ outstanding shares. It is calculated by multiplying the number of outstanding company shares by the current market price of each share. The market capitalization of Canada’s stock markets is high, at 111 percent of GDP in 2012, ranking 6th among OECD countries and up from 8th in 2002 (Figure 3.5-1). Market capitalization is more volatile than most other indicators, but Canada has ranked 8th or higher since 2002, and compares favourably to international finance hubs such as Luxembourg and Switzerland.
Figure 3.5-1: Market Capitalization as Percentage of GDP, 2002 and 2012
Source: The World Bank, World Development Indicators: Financial Sector.
Score
0
20
40
60
80
100
120
140
160
180
200
2012
Slovakia
Estonia
Slovenia
Hungary
Greece
Czech
Republic
IcelandIta
ly
Austria
Portugal
PolandTurke
y
Germany
Mexico
New Zealand
Norway
Ireland
Israel (2
011)
Japan
BelgiumFinland
France
DenmarkSpain
Netherlands
Australia
Korea, South
Sweden
CanadaChile
United States
Luxembourg
United Kingdom
Switzerla
nd
2002

Section 3 Access to Finance
44
Turnover in Canada’s stock markets is also high at 66 percent of GDP in 2012, ranking 8th among OECD countries and up from 12th in 2002 (Figure 3.5-2). Canada’s high turnover
ratio relative to most OECD countries shows that Canada’s stock markets are some of the largest in the world.
Figure 3.5-2: Turnover Ratio (Value of Total Stocks Traded as Percentage of GDP), 2002 and 2012
Source: The World Bank, World Development Indicators: Financial Sector.
Past and Existing Policy Support
Stock markets are generally not a first option for financing for a start-up business, but provide an important source of equity financing for growing SMEs or for larger firm expansion. An initial public offering is one of the options that business angels and venture capital firms often seek to achieve its returns.
The Government of Canada has agreed, with the governments of Ontario and British Columbia, to establish a cooperative capital markets regulatory system and has invited all provinces and territories to participate. The cooperative system would create a common regulator and a common set of regulation, while balancing local concerns. The cooperative system would increase
protection for investors by creating more consistent regulations, increase market efficiency by reducing duplication and expanding the potential securities market size, and better manage systemic risk on a national level.
Sources:
The World Bank, World Development Indicators: Financial Sector.
World Bank Group, Doing Business, “Protecting Minority Investors,” 2014.
Score
0
50
100
150
200
250
2012
Slovakia
Luxembourg
Estonia
Slovenia
Iceland
Czech
Republic
Ireland
Greece
Hungary
Mexico
Austria
Portugal
Poland
New ZealandChile
BelgiumNorw
ay
Denmark
Germany
Italy
Israel (2
011)
FranceTurke
y
Finland
Netherlands
Japan
Canada
Australia
SwedenSpain
Switzerla
nd
United Kingdom
Korea, South
United States
2002