determinants of customer retention in the mobile
TRANSCRIPT
DETERMINANTS OF CUSTOMER RETENTION IN THE MOBILE TELECOMMUNICATION INDUSTRY IN
KENYA: A CASE OF AIRTEL KENYA
REBECCA KAPAI
- 1622 -
Vol. 2, Iss. 2 (108), pp 1621 – 1672, Nov 2, 2015, www.strategicjournals.com, ©Strategic Journals
DETERMINANTS OF CUSTOMER RETENTION IN THE MOBILE TELECOMMUNICATION INDUSTRY IN
KENYA: A CASE OF AIRTEL KENYA
1 Rebecca Kapai and 2 Dr. Makori Moronge
1 Student, Jomo Kenyatta University of Agriculture & Technology (JKUAT), Kenya
2 Senior Lecturer, Jomo Kenyatta University of Agriculture & Technology (JKUAT), Kenya
Accepted: November 2, 2015
ABSTRACT
The purpose of the study was to explore the determinants of effective customer retention in the mobile
communication industry in Kenya. The specific objectives of the study were to examine how customer satisfaction,
customer care service, sales promotion and price/ tariff structure influence customer retention in the mobile
communication industry in Kenya. The study adopted a descriptive survey and the study targeted 680 employees
of Airtel Kenya.A sample of 68 respondents was used and stratified sampling technique was carried out and
primary data was collected through the use of questionnaires. The secondary data was obtained from published
documents such as journals, periodicals, magazines and reports to supplement the primary data. A pilot study was
conducted for the data collection instrument. The data was analyzed with help of SPSS version 21 and Excel. The
study adopted correlation and regression analysis at 5% level of confidence to determine strength and direction of
the relationship of the variables under study. The analysis showed that customer satisfaction had the strongest
positive (Pearson correlation coefficient =.837) influence on customer retention. In addition, customer care service
and sales promotion were positively correlated while price/ tariff structure was negatively correlated to customer
retention (Pearson correlation coefficient =.667, .639 and -.781) respectively. The study recommends that the
organization to develop policies to ensure that there is customer care is well taken care of as it influences customer
retention in Airtel Kenya, sales promotion should match with the changing environment, the organization should
have a wide range of sales promotion to suit different people, offer continuous sale-promotion to its customers,
enact strategies to ensure that there is sale-promotion of Airtel Kenya and appreciated by its customers and the
organization should offer more sale-promotion than its competitors and ensure customers are satisfied with the
prices offered by the service provider as the price is an indicator of the quality of service and need for the
organization to offer relatively cheaper and affordable products as compared to other mobile companies.
Key Words: Customer Retention, Mobile Telecommunication Industry

- 1623 - | P a g e
INTRODUCTION
The chapter provides the background information,
Statement of the Problem, research objectives and
research questions that underpin the study. The
chapter also has significance, scope and limitations
of the study.
Background of the study
Telecommunication has been seen as a key
resource for a country‘s development and
hence the importance to understand the trends
that influence its penetration in the country.
Customer retention is vital for continuity of an
organization. This is because the organization is
ensured of repeat purchases, word-of-mouth
advertisement and lower customer handling
costs as the customer is aware of the standard
operating procedures among many other
benefits. Besides, it reflects "the state of mind
that customers have about a company and its
products or services when their expectations
have been met or exceeded. This state reflects
the lifetime of the product or service
experience. Marketers recognize that it is
usually less costly and easier to do business or
sell to an old satisfied customer, than to keep
seeking new ones( Hughes, 2001)
The world has taken cognizance of the
emergence of the service industry as a
prominent contributor to its economy over
the last century. A number of countries in the
last few decades have experienced a dramatic
change in the importance of services and the
role of the services sector in their economies
(Sharma, 2002). The ultimate goal of service
industry is the satisfaction of its customers
because their satisfaction can somehow make
them to come again. But if the customer is
loyal then he will definitely turn back. In
today's challenging economy and competitive
business world, retaining your customer base
is critical to your success. If you don't give your
customers some good reasons to stay, your
competitors will give them a reason to leave.
Customer retention and satisfaction drive
profits. It's far less expensive to cultivate your
existing customer base and sell more services
to them than it is to seek new, single-
transaction customers. Most surveys across
industries show that keeping one existing
customer is five to seven times more
profitable than attracting a new one. If a
business successfully creates and keeps
customers in a cost-effective way, it will make
a profit while continuing to survive and thrive.
If, for any reason, a business fails to attract or
sustain a sufficient number of customers, it
will experience losses. Too many losses will
lead to the demise of the enterprise (Lewis,
2004).
Global Perspective of Customer Retention
Communication industry is gaining popularity
and importance in many advanced and
developing countries. Today, communication
is becoming the nerve of the life. Mobile usage
is growing rapidly, and telecommunication
marketers are developing new strategies to
take advantage of the potential customers.
According to Federal Communications
Commission (2003), subscribers for mobile
telephony services in the United States for
2002 stood at 141.8 million. Literature also
shows that 7.5% of all mobile phone
subscribers actually use the phones to browse
the Internet. On the other hand, an estimated
11.9 million in the U.S. subscribe to mobile
Internet service. Customer satisfaction is an

- 1624 - | P a g e
important issue for marketing managers,
particularly those in services industries (Lewis,
2004). In general, if the customers are
satisfied with a provided goods or a particular
service, the probability that they use the
service again increases (Venetis & Ghauri,
2004).
The globalization of competition, saturation of
markets, and development of information
technology have enhanced customer
awareness and created a situation where
long-term success is no longer achieved
through optimized product price and
qualities. Instead, companies build their
success on a long-term customer relationship
(Venetis & Ghauri, 2004). Customer retention
programs have increased in recent decades
and customers are members in several loyalty
programs. Loyalty programs are seen as a tool
of exploiting customer relationship
management with the aim of long-term,
profitable customer relationships (Eriksson &
Vaghult, 2000).). Companies have created
such a market where customers are rewarded
automatically, even if they are disloyal. In
addition, companies are struggling as they try
to motivate customers to purchase more and
make more frequent visits (Arantola, 2003)
It has been estimated that in 2003 there were
1.4 billion mobile phones worldwide, half of
them capable of being internet-enabled
(Clarke III, 2001). Communication devices for
both entertainment and commerce,
corporations are also increasing considering
cell phones as a critical success factor to
conducting business activities. Recently,
customers can go to market with the
―mobility‖ that new technology has brought
to customer’s daily lives. Usage of mobile
phones has now extended from voice
communications to the internet, increase in
extension of mobile internet technology and
much development of m-commerce
applications has opened great opportunity for
mobile service users. However, surveys on US
consumer’s perceptions of mobile service
show that the level of satisfaction is much
lower for mobile service carriers compared to
other service sectors (Sharma, 2007) Mobile
service carriers need to be aware of drivers of
customer satisfaction and loyalty in order to
build effective business strategies for
customer retention. In the highly competitive,
complex and dynamic environment of the
communication industry, the very slight
differences which exist in financial services
and products together with an increasingly
demanding customer have led to a great
transformation in the industry. The traditional
product-oriented organization is becoming
increasingly customer-oriented in accordance
with the basic principles of relational
marketing, which focuses on customer
retention as its main goal. In this sense,
Winner (2001) considers that constant
customer-oriented behaviour is a requisite for
improving the implementation of quality in
services marketing. Indeed, factors such as
financial products and distribution have
attained similar levels of development and
technology and have thus been relegated to a
secondary role as reference points for
distinguishing between one organization and
another (Edward & Sahadev, 2011).
In this sense, Gilmore et al., (2009) argue that,
given that many financial services are parity
offerings, it can be stated that a customer is
unlikely to be overly impressed by core

- 1625 - | P a g e
product attributes when all companies are
providing similar offerings(Carson et al,
2009).Communication industry is gaining
popularity and importance in many advanced
and developing countries. Today,
communication is becoming the nerve of the
life. Mobile usage is growing rapidly, and
telecommunication marketers are developing
new strategies to take advantage of the
potential customers. According to Federal
Communications Commission (2003),
subscribers for mobile telephony services in
the United States for 2002 stood at 141.8
million. Literature also shows that 7.5% of all
mobile phone subscribers actually use the
phones to browse the Internet. On the other
hand, an estimated 11.9 million in the U.S.
subscribe to mobile Internet service. It is
commonly known that there is a positive
relationship between customer retention and
profitability. Alshuredi & Alkurdi (2012) found
that when a company retains just 5 percent
more of its customers, profits increase by 25
percent to 125 percent. Their study caught the
attention of both practitioners and
researchers, arousing a great interest in
customer retention (Kandampully,&
Suhartanto, 2004).).
It can cost as much as six times more to win a
new customer than it does to keep an existing
one (Chuah et al., 2014). Depending on the
particular industry, it is possible to increase
profit by up to 60% after reducing potential
migration by 5% (Verhoef, 2003). Hence the
increase and retention of loyal customers has
become a key factor for long-term success of
the companies. Loyal customers will also help
promote your hotel. They will provide strong
word-of-mouth, create business referrals,
provide references, and serve on advisory
boards. Kaplan & Atnkson (2015) states, loyal
customers serve as a ―fantastic marketing
force‖ by providing recommendations and
spreading positive word-of-mouth; those
partnership-like activities are the best
available advertising a company can get. Loyal
customers increase sales by purchasing a
wider variety of the hotel‘s products and by
making more frequent purchases.
Guttafusson (2005) found loyal hotel
customers had higher food and beverage
purchases than non-loyal customers.
Trustworthiness of the partner is a factor that
has certain impact on the establishment of
loyalty – nobody expects a long-term relation
with a partner that cannot be trusted.
Trustworthiness is one criterion for measuring
the value of the partner. (Kivetz et al, 2004)
calls trust a cornerstone of the strategic
partnership. Uncertainty may be caused by
dependence or large choice: people tend then
to prefer popular or familiar brands or
partners. Reinartz (2005) posit that trust is a
major determinant of relationship
commitment: brand trust leads to brand
loyalty because trust creates exchange
relationships that are highly valued. Chauduri
and Holbrook (2001) have showed that brand
trust is directly related to both purchase and
attitudinal loyalty. Many authors have
accented that trust is important in conditions
of uncertainty (Thomas, 2001).
The main emphasis in marketing has shifted
from winning new customers to the retention
of existing ones. Traditionally there are two
approaches to treat customer retention.
Ehrenberg, Ndungu (2012) investigated the
nature of different levels of loyalty, others
(e.g. Day, 2003) have explored the influence of
individual factors on loyalty. Lavierre (2005)

- 1626 - | P a g e
has considered a role of salesman in making
relationship more personal thus enhancing
customer retention. Hofmeyr and Rice (2000)
point out that the more important the
relationship is to a person, the more willing
that person is to tolerate dissatisfaction in
favour of trying to fix it. By contrast, when a
relationship doesn‘t matter, then even the
perfectly satisfied consumer can switch on a
whim. (Hofmeyrand Rice, 2000) A relationship
can also be made important by personal
approach. Various authors have compared
loyalty with marriage. Marriage is one of the
most personal and important relationships.
That means that intimacy is one determinant
for importance of relationship.
The potential for establishing loyalty depends
on the subject (customer) or on the
environment (market). Customer retention is
the feelings or attitudes that incline a
customer either to return to a company, shop
or outlet to purchase there again, or else to re-
purchase a particular product, service or
brand. Customer retention is the totality of
feelings or attitudes that would incline a
customer to consider the repurchase of a
particular product, service or brand or re-visit
a particular company or shop. It affects the
success and profitability of companies.
Companies can achieve competitive
advantage through customer retention and it
is the way to gain the best kind of customers
and thereby repeat customers (Lavierre,
2005)
According to Lai (2009), perception of a
customer affects his judgment and it turns his
loyalty towards the product or services.
Loyalty provides the foundation of a
company's sustained competitive edge. By
developing and increasing loyalty, companies
can ensure its proper growth and economic
performance. So the marketing strategy of the
companies should be framed in such a way
that they will be able to try to retain the
existing customers by increasing their loyalty
and value (Kim et al., 2004).
Kenyan Perspective of Customer Retention
Telecommunication is the transmission of
information, over significant distances, for the
purpose of communication. In earlier times,
telecommunications involved the use of visual
signals, such as beacons, smoke, semaphore
telegraphs, signal flags, and optical
heliographs, or audio messages via coded
drumbeats, lung-blown horns, or sent by loud
whistles, for example. In the modern age of
electricity and electronics,
telecommunications now also includes the
use of electrical devices such as telegraphs,
telephones, and teletypes, the use of radio
and microwave communications, as well as
fiber optics and their associated electronics,
plus the use of the orbiting satellites and the
Internet (Choie et al, 2013).
Kenya's government has responded to these
challenges with a market-oriented economic
policy, which emphasizes openness to the
world economy and export-led growth. This
policy necessitates a more universal and
reliable telecommunications network than
would be needed had Kenya attempted a
predominantly inward-looking, centrally-
directed economic strategy similar to those
attempted by some other African countries.
One of the more intriguing aspects of
telecommunications in Kenya in recent years
has been the establishment of a variety of
- 1627 - | P a g e
special purpose networks making use of state-
of-the-art technology to solve specific
communications problems. The majority of
these have been established by international
public sector organizations, by universities
and other research institutions, by nonprofit
organizations, and by the financial services
sector.
Airtel Kenya
Airtel is the World‘s fifth largest mobile
operator with 180 million customers. Airtel
brand replaced Zain in October 2010. Interms
of network coverage, Airtel is currently
number 1 in 10 countries in Africa, and there
are, on average 2-3 telecom operators in a
country. In the continent, Airtel is number 2
after MTN, and covers a population of 450
million. Earlier on, a price war had
characterized Kenya‘s mobile
communications market in 2008 to date,
following the market entry of the third and
fourth network, Econet Wireless Kenya (EWK,
in which India‘s Essar acquired a stake), and
Telkom Kenya under the Orange brand with its
new majority shareholder, France Telecom.
Subscriber growth is now forecast to slow
over the coming years, and rapidly falling
ARPU(average revenue per user) levels had
driven one of the incumbents, Airtel, deeper
into negative earnings, leaving only the
market leader, Safaricom, with a net profit,
although reduced.
Airtel made its formal entry into the African
continent with its new global identity in
November 2010. The new identity received a
remarkably warm welcome from the African
customers across different markets. Despite
the challenge of multiple market
environments the changeover to the new
identity was remarkably swift. With this, 42
million customers in Africa started
experiencing the power of the new global
brand as part of the larger Airtel family. On
the marketing front, two of Africa‘s biggest
passions, Music and Football have been a key
focus area for Airtel. Airtel is driving and
leveraging music with the one8 anthem,
which brings together eight African music
superstars with the American R & B superstar
R Kelly. Similarly, Airtel‘s association with
football is being driven by the theme
commercial ―Kabutu‖, its partnership with
English Premier League leader Manchester
United and launch of ―Airtel Rising Stars‖
programme for under 17 boys and girls in 15
countries. Both the initiatives have struck an
instant chord with customers across the 16
markets. Product innovation remains a key
driver of Airtel market penetration strategy in
Africa. As part of the innovative model Airtel
has also successfully set up the Tower Co,
which runs a separate business in the
countries of operation and will be responsible
for managing the end to end process and
operations of their sites. This is another great
opportunity, which will not only enable Airtel
roll out our network with great speed but also
provide potential cost efficiencies arising from
site sharing. We would also be looking at
leveraging the big opportunities that 3G, data,
MNP and airtel money present to us. Exploited
fully, they have the potential to make us truly
unique to both our current and prospective
customers in the market.
Deeply embedded in BhartiAirtel‘s DNA,
operational excellence has been the driving
force towards mobilising the entire
organisation to eliminate non-conformances
and minimize waste in its processes. This has

- 1628 - | P a g e
led to a remarkable process improvement and
cost reduction. The Company has developed
its unique model of excellence in line with
Malcolm Balridge award known as CEO‘s
Operational Excellence award. The award
criteria include improvement, process
compliance, leadership engagement in
excellence, best practice replication,
customer and employee satisfaction and
financial performance. For the up-keep of
standards, all processes are continually
assessed by external consultants leading to
certifications like TL9000, BCP DR, ISO 27001,
OHSAS, beside continual improvement of the
brand logo and identity.
Designed to appeal to a more demanding
consumer, the dynamic new identity met with
high appreciation as it was introduced in
existing and new markets. Backed by a high
decibel communication campaign, the roll out
of the new identity was completed across all its
markets. Apart from India and Sri Lanka, the
brand also started to offer its services to
consumers in
Bangladesh making the Company a powerhouse
across South Asia. Across the seas, the Company
established a strong presence in the 16 countries
across the African continent. During the year,
Airtel won the ‗Most Preferred Cellular Service
Provider Brand‘ award in the CNBC Awaaz
Consumer Awards 2010 for the 6th year in a row.
The CNBC Awaaz Consumer Awards were based
on an extensive consumer survey done by Nielsen,
wherein the customers rated brands across
different categories which delivered true value for
money.
Statement of the Problem
As competition intensifies, companies are
confronted with various threats and
opportunities in an effort to sustain their
market position. In Kenya‘s saturated mobile
services market, where both carriers and
subscribers have either reached or nearing
their peak levels; attracting and creating new
customers, has become overwhelmingly
difficult, and also very costly in terms of
marketing spend (Kim, Park and Jeong, 2013).
With mobile penetration rate standing at
84.9%, new subscriptions are expected to
slow down and also stabilize, as observed in
other markets (Santourisdis &Trivellas, 2010).
According to the Economic review (2011) on
telecommunication industry, the market for
the telecommunication industry in Kenya is
highly competitive( Quaye, 2013)
This industry is currently dominated by four
operators namely: Telkom/orange, Safaricom,
Airtel and Essar Telecom Kenya. Safaricom
being one of the most favorable choice for
users, believes that the main competitive
factors in the mobile services market are
network coverage, service quality, pricing
and brand. Airtel despite being the first
mobile service provider in Kenya has not been
able to retain its customers. Additionally Airtel
has over the years kept rebranding hence this
has led to consumers loosing track of branding
revolutions within the company. According to
Research from Pitney Bowes Group Software
(RPBGS, 2011) shows that customer retention
within the Airtel Kenya has dropped from
38.4% in 2005 to 33.6% in 2007, a decrease of
15.3%. One of the primary findings of the
research was that Mobile telecoms retain the
highest average customer at 33% According to
Group, the findings indicate that the world is
becoming more mobile and that companies’

- 1629 - | P a g e
customer retention strategies need to
improve to deal with this phenomenon.
The competition in the Kenyan mobile
telecom market is influenced by the lower
switching costs among the subscribers of the
various networks, which manifest in the
frequency with which the subscribers freely
enter and leave the networks (Kuo et al.,
2009). Therefore, it costs subscribers only Ksh
30.00 to acquire SIM (Subscriber Identification
Module) and this makes it cheaper for
subscribers to move from one network to
another. A recent study by Lee et al (2013),
indicate that an understanding of the drivers
of brand choice by customers in the
telecommunication industry is not clear. The
major challenge confronting all the mobile
operators in Kenya, is the execution of various
marketing initiatives that would not only lead
to attraction of new subscribers, but retaining
existing ones who would then become loyal
customers (Okyere et al., 2011; Davidson &
McCarty, 2011). Also there are overwhelming
arguments supporting that it is more
expensive to win new customers than to keep
existing ones (Seo & Babad, 2008; Pfeifer,
2005; Pine et al., 2010; Adamska 2014). This
study was intended to establish the
determinants of effective customer retention
mobile telecommunication industry in Kenya
with a case of Airtel Kenya.
Research Objectives
General objective
The general objective of the study was to establish
the determinants of customer retention in the
mobile telecommunication industry in Kenya.
Specific Objectives
The study was based on the following research
objectives to:
I. Determine the influence of customer
satisfaction on customer retention in the
mobile telecommunication industry in
Kenya.
II. Find out the influence of customer care
service on customer retention in the
mobile telecommunication industry in
Kenya.
III. Establish the influence of sales-
promotion on customer retention in the
mobile telecommunication industry in
Kenya.
IV. Examine the influence of price structure
on customer retention in the mobile
telecommunication industry in Kenya.
Research Questions
The study was guided by the following research
questions:
I. What is the influence of customer
satisfaction on customer retention in the
mobile telecommunication industry in
Kenya?
II. Does customer care service influence
customer retention in the mobile
telecommunication industry in Kenya?

- 1630 - | P a g e
III. How does sales-promotion influence
customer retention in the mobile
telecommunication industry in Kenya?
IV. Does price structure influence customer
retention in the mobile
telecommunication industry in Kenya?
Significance of the Study
The managers at the Airtel Kenya would gain
additional knowledge in relation to the issues
that need to be addressed to retain
customers. This will enable them beat the
competition experienced from other
companies. The customers will be able to
understand the factors that need to be put in
place to be able to obtain adequate and
quality service. They will be adequately
informed on what they should demand from
the company. This study will provide an
insight to customers on the kind of goods and
services to focus on when making a choice on
the telephone service provider to join. The
study will also act as a benchmark for the
communication industry in the country on the
factors they need to consider in order to
enhance customer retention and as a
consequence their performance.
Scope of the Study
This study was limited to the factors affecting
effective customer retention in the mobile
communication industry with. The study, due
to its limited scope concentrated on the Airtel
Kenya Company since the researcher does not
have the capacity to cover the whole of the
mobile communication industry. The target
population was 680 employees The study was
limited to four determinants that the
researcher consider as major factors affecting
effective customer retention such as
customer satisfaction, customer care service,
price and sales promotion, though there are
other factors, the scope of this study is beyond
them.
Limitations of the Study
Due to the veil of confidentiality surrounding
many firms, some of respondent may be
reluctant to participate. However, the
researcher will assure the respondents that
the findings will be used for academic
purposes only. Due to their busy schedules
most of the top managers may not have time
to participate in the study however, the
managers gave ample time to fill the
questionnaires. This study focused on four
independent variables namely customer
satisfaction, customer care service, sales-
promotion and price/tariff structure whereas
there could be other determinants of
customer retention in the mobile
communication industry.
LITERATURE REVIEW
Introduction
This chapter presents the literature review,
specifically the literature review focuses on
the variables of the study, and the discussion
includes customer satisfaction, service
quality, supplier brand and pricing. The review
of literature focuses on the effect of the above
variables on customer retention.
Theoretical Review

- 1631 - | P a g e
This section examines relevant theories to the
study variables. According to Kombo and
Tromp (2009), a theoretical framework is a
collection of interrelated ideas based on
theories. It is a reasoned set of prepositions
derived from and supported by data or
evidence and it accounts for or explains
phenomena and attempts to clarify why
things are the way they are based on theories.
A theory is defined as a reasoned statement
which is supported by evidence, meant to
explain phenomena (Kombo & Tromp, 2009).
It is a systematic explanation of the
relationship among phenomena. Mugenda
(2008) defines a theory as a framework of
explaining phenomena by stating constructs
and the laws that inter-relate these constructs
to each other.
Servqual theory
Servqual represents service quality as the
discrepancy between a customer's
expectations for a service offering and the
customer's perceptions of the service
received, requiring respondents to answer
questions about both their expectations and
their perceptions (Parasuraman et. al., 2008).
The use of perceived as opposed to actual service
received makes the serviqual measure an attitude
measure that is related to, but not the same as,
satisfaction (Parasuraman et. al.,2008).
Parasuraman et al. (2008) presented some
revisions to the original servqual measure to
remedy problems with high means and standard
deviations found on some questions and to obtain
a direct measure of the importance of each
construct to the customer.
Market Intensification theory
This theory calls for more intensive and
continuous improvement initiatives. The
theory calls for significantly intensifying the
focus on enhancing business outcomes
through current network operations and
products and services offered in current
postal industry markets by further increasing
operating efficiency, addressing labour costs
and work rules, and identification of
additional underexploited niche market
opportunities for additional revenue within
the present network( Alida et al ,. 2013)
This theory calls for ―Doing what we do,
always better.‖ The Market Intensification
theory does call for aggressive market pricing
to be the dominant competitor in the larger
domestic postal industry. Competition would
be through both current and add-
ons/extensions to products/services.
Operating scope and processes with facility
locations and operations would continue to be
strictly determined by system-wide
cost/benefit analyses of operating
effectiveness and efficiency. Initiatives that
enhance overall safety and security would also
be made to minimize the financial
consequences of lapses (Malthouse, 2010).
Market Leveraging theory
This theory calls for ―Leveraging the current
distribution/delivery platform.‖ It recognizes
the tremendous scale of the present
distribution and delivery network and in-place
infrastructure and asks how it might be used
to deliver new products and services within it.
These may be created and supported by the

- 1632 - | P a g e
postal service or by others in partnering and
synergistic alliances, all designed to reduce
operating costs and generate additional
revenues. Current postal products and
services would continue to be offered but be
supplemented by additional new products
and services provided either by USPS or in
partnership with other public providers such
as state and local governments and other
federal agencies or private providers( Alida et
al, 2013
The Market Leverage theory means that
market access and pricing would be more
stable over time due to cost sharing. The
primary emphasis of this theory is to maximize
the possible value contribution of every
facility and vehicle. A greater variety of
products and services would be provided at a
single location, enhancing access and
convenience. Larger numbers of people would
visit postal facilities to utilize other services
then being provided. Managing increased
numbers of customers could, however, make
safety and security bigger issues. Nonetheless,
the universal service obligation would be met
with this model and customer convenience
enhanced. The theory could also present an
opportunity for postal service employees to
acquire new skills and perform additional new
roles in supporting services delivered within
existing facilities (Malthouse, 2010).
Innovation or Open Market theory
Definition 1: Innovation is a process of value
creation, which consists in changing the
composition of a set of variables describing a
system. This theory calls for ―Opening
markets to creative competition.‖ It is the
most radical in that it essentially opens the
postal industry to further competition and use
of the distribution and delivery network for
additional products and services, both
domestically and internationally. In all cases,
the national post office would retain control
of the mailbox, and would handle additional
products and services of third parties that
would be delivered by it. The innovation
theory invites additional providers to
participate in the distribution, operations and
delivery network which enhance competition
and price competitiveness. The universal
service obligation mandate is maintained
although the national post office may act as
―franchisor‖ and regulate access and
affordability of products/services provided by
―franchisees‖, thus offering access to a wider
range of products and services, which
enhances accessibility and convenience.
However, the theory could possibly
―overload‖ the network with
products/services, creating customer
confusion and dissatisfaction (Harvey &
Joseph (2009).
Extensive planning and coordination will be
required over a multi-year period to plan for
the opening of the market and network. A
staged process where experimentation occurs
in a specific market or service area is
recommended to test operating reliability,
service quality, customer acceptance, and
work force adjustments. This theory is the
most radical in that it essentially opens the
postal industry to further competition and use
of the distribution and delivery network for
additional products and services, both
domestically and internationally. The above
theory relates to customer satisfaction

- 1633 - | P a g e
Conceptual Framework
A conceptual framework is a research tool
intended to assist a researcher to develop
awareness and understanding of the situation
under scrutiny and to communicate it. A
conceptual framework is used in research to
outline possible courses of action or to
present a preferred approach to an idea or
thought. According to Bogdan and Biklen
(2003) a conceptual Framework is a basic
structure that consists of certain abstract
blocks which represent the observational, the
experiential and the analytical/ synthetical
aspects of a process or system being
conceived. The interconnection of these
blocks completes the framework for certain
expected outcomes.
Mugenda, (2008) defines conceptual
framework as a concise description of the
phenomenon under study accompanied by a
graphical or visual depiction of the major
variables of the study. Kombo and Tromp,
(2009) defines it as a set of broad ideas and
principles taken from relevant fields of inquiry
and used to structure a subsequent
presentation. It is a research tool intended to
assist a researcher to develop awareness and
understanding of the situation under scrutiny
and to communicate this. Bell, (2010)
describes it as a diagrammatical
representation that shows the relationship
between dependent and independent
variables. A conceptual framework assists a
researcher to organize their thinking and
complete an investigation successfully. It also
explains the relationship among interlinked
concepts and explains the possible connection
between the variables (Kombo & Tromp,
2009).
The conceptual framework comprises of the
independent variables also known as the
exploratory variables and which are the
presumed cause of changes in the dependent
variable and the dependent variable also
called the criterion or predictor variable which
the researcher wishes to explain (Kothari,
2004). Independent variables Dependent variable
Figure 2.1: Conceptual Framework
2.3.1 Customer Satisfaction
Customer satisfaction
Quality of service,
Customer loyalty
Customer service care
Speed of complaint
processing
Ease of reporting
complaint &
friendliness
Price/tariff structure
Price fairness
Tariffs
Cus tomer Retention
Customer intention
to stay
Customer intention
to leave
Sales - promotion
Monetary form
Non- monetary
form
- 1634 - | P a g e
Customer satisfaction is one of the key factors in
modern marketing and customers‘ behavior
analysis. Generally speaking, if the customers are
satisfied with the provided goods or services, the
probability that they use the services again
increases (Kaplan & Atnkson, 2009). Also, satisfied
customers will most probably talk enthusiastically
about their buying or the use of a particular service;
this will lead to positive advertising (Anderson,
2004). On the other hand, dissatisfied customers
will most probably switch to a different brand; this
will lead to negative advertising. The importance of
satisfying and keeping a customer in establishing
strategies for a market and customer oriented
organization cannot be neglected Hollenson, 2015).
Customer satisfaction is often considered the most
important factor in thriving in today‘s highly
competitive business world.
Services have unique characteristics that
distinguish them from the physical goods
(Rust et al., 2004). Services are often
characterized by intangibility, inseparability,
heterogeneity, and perishability (Chaundri &
Holbrook, 2004). The importance of the above
characterizations is that using them for
evaluation before, while, and after using a
particular service by the customers is often
very hard.Because of the quality of being
intangible, understanding how the customers
would evaluate the quality of the
organization‘s services is often very hard
(Verhoef, 2003).
In addition, the services are realtime, i.e. they
are used by the customers as soon as offered.
They cannot be stored and quality passed like
physical goods. Therefore any bad service will
most probably be experienced by a customer,
which results in customer‘s dissatisfaction
while using the service (East, 1997).
Researchers have studied customer
satisfaction in different contexts, e.g. Chen
and Ko (2007) proposed fuzzy linear
programming models to determine the
fulfillment levels of parts characteristics under
the requirement to achieve the determined
contribution levels of design requirements for
customer satisfaction. Grigoroudis et al.
(2008), considered the problem of measuring
user satisfaction in order to analyze user
perceptions and preferences to assess
website quality. Hsu (2008) proposed an index
for online customer satisfaction, which is
adapted from an American Customer
Satisfaction Index (ACSI). Bodet (2008)
explored the satisfaction–loyalty relationships
according to an empirical analysis in a sports-
service context (Yang and Peng 2008).
The impact of satisfaction on loyalty has been
the most popular subject of studies. Several
studies have revealed that there exists a direct
connection between satisfaction and loyalty:
satisfied customers become loyal and
dissatisfied customers move to another
vendor. (Kaplan & Atnkson, 2009) The primary
objective of creating ACSI (American
Customer Satisfaction Index) in 1984 was to
explain the development of customer
retention. In ACSI model customer satisfaction
has three antecedents: perceived quality,
perceived value and customer expectations.
(Anderson et al. 2000) In the ECSI (European
Customer Satisfaction Index) model perceived
quality is divided into two elements: ―hard
ware‖, which consists of the quality of the
product or service attributes, and ―human
ware‖, which represents the associated
customer interactive elements in service, i.e.
the personal behaviour and atmosphere of
the service environment. (Gronholdt et al.
2000)

- 1635 - | P a g e
In both model increased satisfaction should
increase customer retention. When the
satisfaction is low customers have the option
to exit (e.g. going to a competitor) or express
their complaints. Researches have shown that
60–80% of customers who defect to a
competitor said they were satisfied or very
satisfied on the survey just prior to their
defection. (Reichheldet al. 2000) So it‘s clear
that there must be also other factors besides
satisfaction that have a certain impact on
customer retention. An early pioneer in the
study of equity, George Homans stated that
the essence of equity was contained in a "rule
of justice" (as cited in Oliver, 1997). In
fundamental terms, equity is an evaluation of
fairness, rightness, or deservingness that
customers make in reference to what others
receive (Verhoef, 2003). In the satisfaction
literature, equity theory considers the ratio of
the customer's perceived outcome/input to
that of the service provider's outcome/input
(Reichheldet al. 2000). Bolton and Lemon
(1999) extended this concept of
outcome/input to the perspective of
perceived value. They declared that equity
referred to customers' evaluation of the
perceived sacrifice (input) of the offering
(outcome). Perceived sacrifices include
purchase price and other possible costs such
as time consumption (Yang, 2001).
A positive perception of value may bring
customers back to make another transaction
(Lichntestein et al, 2004). When customers
believe they are being treated fairly in an
exchange, they will be satisfied with the
transaction if their outcome-to-input ratio is
in some sense adequate (Lichntestein et al,
2004). Fredericks and Salter (1998) pointed
out that quality, price, and company or brand
image were three factors that comprise the
customer value package. In other words,
customers will make an explicit comparison
between what they give and what they get.
The positive relationship between equity and
satisfaction was supported in the literature
(Oliver, 1993; Oliver and Swan, 1989a, 1989).
However, customers expect prices to be lower
in an online store than in a traditional sales
channel (Lichntestein et al, 2004). They may
expect to get more value from an online store
than from a physical store.
Customer care service
Customer service is a system of activities that
comprises customer support systems,
complaint processing, speed of complaint
processing, ease of reporting complaint and
friendliness when reporting complaint (Kim,
Park and Jeong, 2004). Customer services are
the opportunities for telecom service
providers that are added to mobile network
other than voice services in which contents
are either self-produced by service provider or
provided through strategic compliance with
service provider (Kuo, Wu and Deng, 2009).
The improved customer services are the focal
point of the telecom service providers for
social as well as for economic reasons. From a
social point of view, services should be
available to the customers on reasonable
terms. As far as economic factor is concerned,
services should satisfy the needs of the
customers (Zeithamul, 2009).
For developing satisfaction among customers,
the telecom service providers need to be extra
careful for the customer services they
provide. Satisfaction of customer is
determined by his evaluation of service
provided by a brand (Gustafsson, Johnson and

- 1636 - | P a g e
Roos, 2005). The study of Dabholkar, 2015)
shows that when the customers, do not get
their complaints considered properly, they
start looking for other brands. It happens
because either the customer service centers
do not handle the complaints or the
customers are not able to address them
properly. Sometimes, telecom service
providers take considerably longer time to
resolve the problems like network coverage or
call quality, the customers do not wait for long
and hence they lose satisfaction with that
particular brand (Dabholkar, 2015).
Furthermore, the friendly attitude and
courteous behavior of the service workers at
service firms leaves a positive impression on
the customer which lead towards customer
satisfaction (Soderlund and Rosengren, 2008).
On the other hand, if a telecom service
provider lacks in providing services (call drops)
to its customers it experiences customer
churn. Kim, Park and Jeong (2004) argued that
service provider should provide customer
oriented services in order to heighten up
customer satisfaction. It was also found that
the customers get satisfied to a brand more if
they get all the needed services accumulated
in that very brand (Lichntestein et al, 2004).
Sales promotion
It has been established in literature that only
consumers with repeat purchases are
profitable (Pauwels, 2004). It is not every
repeat purchase that is connected to
customer retention of a brand. However,
customer retention is important for a repeat
purchase. Therefore, business operators need
to develop marketing programmes that will
not only reinforce customer‘s commitment
but also encourage repeat purchases. A part
of the functions of sales promotion is not only
to reinforce commitment of consumers but to
encourage repeat purchases. Effects of sales
promotion on consumer behavior have been
widely studied in literature (Nagar, 2009).
Sales promotion has effects on various aspects
of consumer‘s purchase decisions such as
brand choice, purchase time, quantity and
brand switching (Dabholkar, 2015);
consumers ‘ sensitivity to price (Van et al,
2003).
However, whether the effect of consumer
loyalty and purchasing behavior could be
moderated by sales promotions has not yet
been examined extensively. Regardless of a
widespread interest in the relationship
between sales promotion and purchasing
behavior, most studies of this kind focus on
the effect of sales promotions on choice at the
time they are offered (DelVecchio, Henard,
Freling, 2006). Only a few have investigated
the lag effect of sales promotions on brand
preference and the resultant buying behavior
once the promotion campaign is rescinded.
Sales promotions could be in form of
monetary and non-monetary ones. These
types provide both utilitarian and hedonic
benefits to the consumers. Utilitarian benefits
refer to such benefits such as quality,
convenience in shopping, saving in time
efforts and cost (Luk and Yip, 2008). Hedonic
benefits on the other hand refer to value
expression, exploration, entertainment,
intrinsic stimulation and self-esteem (Va et al,
2003). According to Luk and Yip (2008)
monetary promotions are incentive-based

- 1637 - | P a g e
and transactional in nature and provide
immediate rewards and utilitarian benefits to
the customers. However, non-monetary
promotions provide hedonic benefits but
weaker utilitarian benefits (Kwok and Uncles,
2005) Monetary promotion have been
reported to be preferred over non-monetary
promotion across all consumer goods in terms
of their ability to elicit purchase intentions
(Luk and Yip, 2008; Kwok and Uncles, 2005).
Several other studies had reported different
impact of sales promotion on consumer
behavior. For example, Blatterger and
Wisniewski (1989) reported that consumer
gain more from price cut when buying an
established up-market brand than a mass
market brand. Pauwels, Hanssens and
Siddarth (2002) argued that price promotion
elicits temporary changes in brand and
product choices and purchased quantity for
established brand in mature market. These
changes are because up-market brands are
associated with prestigious brand with high
level of reliability, low level of risks, greater
concerns for customer‘s needs and stronger
hedonic benefits (Luk and Yip, 2008). It is not
settled in literature whether sales promotion
can enhance or undermine brand preference
beyond the time they are offered (Luk and Yip,
2008; DelVecchio, Henard, Freling, 2006)
Monetary sales promotions could lead to
negative impact on brand preference and
trust.
This is because monetary promotion can divert
attention to financial incentives which may
encourage brand switching behaviour, increase
price sensitivity and make quality criterion less
important (Aaker, 1996; Manaled et al, 2007).
Gedenk and Neslin (1999) argued further that
sales promotion can lead to a significant decrease
in brand loyalty.
Price structure
Price/tariff plays a vital role in
telecommunication market, especially for the
mobile telecommunication service providers.
The correlation between price and customer
loyalty which explains that satisfaction of
customers in telecom market depends on
factors like attractive call rate, internet
browsing fees, price schedule variation and so
on. Thus price structures of the operators
influence the loyalty of users a lot. Price seems
one of the very significant factors to derive
satisfaction and make users loyal. In this
regard, operators should be more careful in
determining and maintaining price structure
of call and variety of services offered to
customers, otherwise switching tendency of
customers across operators will be increased
and resulting lessening the loyalty of
customers.
From the consumer's perspective, the
monetary cost of something is what is given
up or sacrificed to obtain a product (Zeithaml,
1988). Thus, in studies on related topics, price
has often been conceptualized and defined as
a sacrifice (Anderson, Fornell and Lehmann,
1994; Sweeney, Soutar, and Johnson, 1999).
There are three components to the concept of
price: objective price, perceived non-
monetary price, and sacrifice (Zeithaml,
1988). The objective monetary price (simply
put, the amount of money paid for product) is
not equivalent to the perceived price (that is,
the price as understood and recorded in the
mind of consumer) since consumers do not
always know or remember the actual price

- 1638 - | P a g e
paid for a product. Instead, they encode the
price in a way that it is meaningful to them
(Zeithaml, 1988).
The theoretical formation of price perception
in services remains largely unexplored (Varki
and Colgate, 2001). This study suggests that
the perception of price fairness plays an
important role in any exchange transaction.
The feeling of fairness depends on the gain-
loss ratio felt by both partners in the
exchange. From the consumer's perspective,
the gain is the product to be received,
whereas the loss is the money to be paid.
When a consumer pays a higher price than
others do, or when a consumer receives a
lesser product than anticipated (either in
terms of quantity or quality), perceived
negative price inequity occurs. On the other
hand, perceived positive price inequity may
result from either receiving a larger or better
product than others, who paid the same price,
or paying a lower price but receiving the same
product. Price fairness should have an
influence on customer satisfaction
(Parasuraman, Zeithaml, and Berry, 1994) as
well as on behavioral intentions (Varki and
Colgate, 2001). This study, then, proposes that
the perceived fairness of price should directly
affect customer retention, and should also
affect it indirectly via customer satisfaction.
Customer Retention
Much attention has been paid to customer
loyalty by practitioners and through literature
in recent decades (Nawaz and Usman, 2010).
People in the field have used both attitudinal
and behavioral measures to define and assess
customer loyalty (Zeithaml, 2000). Loyalty,
from an attitudinal stand point, implies a
specific desire to continue a relationship with
supplier and provider (Reza and Rehman,
2012). This means that a customer is loyal to a
brand or firm if they have a positive and
preferential attitude towards it. Whereas
behavioral loyalty is when a customer
repeatedly buys from the same company,
(Reza and Rehman, 2012) thus the customer is
faithful to the company. Oliver (1997) defined
customer loyalty as ―a deeply held
commitment to re-buy or repatronize a
preferred product/service consistently in the
future, thereby causing repetitivesamebrand
purchasing, despite situational influences and
marketing efforts having the potential to
cause switching behavior. According to
Ahmed and Moosavi (2013) ―brand loyalty is
the customer‘s willingness to stay with a
brand when competitors come knocking with
offers that would be considered equally
attractive had not the consumer and brand
shared a history.‖Rahman, et al., (2010) and
Deng, Lu, Wei, Zhang (2010), expressed that
same notion.
Furthermore, Reza and Rehman (2012) note
that customer loyalty represents the repeat
purchase and referring the company to other
customers. They also stated that customer
loyalty is a figure that may be measured
directly by measuring the actual repeated
sales to customers. Additionally, due to
intense competition in the market place,
businesses have increased efforts to
implement the customer retention strategy in
order to maximize the lifetime value of
customers (Boshoff and du Plessis, 2009).It is
important to note that Cheng et al. (2011)
proposed that it is costeffective to maintain
existing customers than obtaining new ones.
To this the authors proceeded to state that
the cost of developing a new customer is
between five and nine times the cost of
maintaining existing customers. By the same

- 1639 - | P a g e
token, (Lee, 2012; Kumar and Vandara,
2011;Boshoff and du Plessis, 2009), believe
that the benefits of customer loyalty are that
loyal customers are cheap to maintain, are
price insensitive, spread free positive word-of-
mouth, always provide suggestions, and
always try the company‘s new products.
Several authors suggested that loyal
customers are a competitive asset and that a
way of increasing customer retention is
through secure and collaborative relationship
between customer and service providers
(Rajeswari and Pradha, 2011;
WichaiandSiriluck, 2010; Shannon, 2010).
Brand loyalty takes precedence in the services
sector, especially with regards to those
providing services with little differentiations
and ones competing in aggressive conditions,
for example, the telecommunications sectors
(Santouridis and Trivellas, 2010). Therefore, it
is incumbent on providers to accommodate
customer‘s expectations in this tough
competitive environment by developing
strategies to strengthen brand loyalty. Thus,
with regards to the telecommunication
sector, it is significant to ensure a good
relationship between customers and mobile
service providers. Rahman, et al., (2010)
stated that in order to create brand loyalty in
customers, companies must help customers
acquire new ways of purchasing and reinforce
those ways as new habits by reminding them
of the value of their purchase while
encouraging them to continue purchasing
those products in the future.
Empirical review
According to Reichheld (1996), Lee and
Cunningham (2001), perception of a customer
affects his judgment and it turns his loyalty
towards the product or services. Loyalty
provides the foundation of a company's
sustained competitive edge. By developing
and increasing loyalty, companies can ensure
its proper growth and economic performance.
So the marketing strategy of the companies
should be framed in such a way that they will
be able to try to retain the existing customers
by increasing their loyalty and value (Kim et
al., 2004). Many definitions describe loyalty as
a desire to retain a valuable or important
relationship (Morgan et al 1994; Moorman et
al. 1992). That way the establishment of
loyalty is predetermined by the importance of
relevant relationship or selection. Weiss
(2001) points out three aspects that may
increase the importance of the relationship:
Strategic importance of a product, High risks
involved in the transaction or Costs incurred
by cancellation of contracts.
The concept of customer retention often used
in the literature incorporates behavioral and
attitudinal measures (Otim and Grover,
2006).loyalty is defined as building and
sustaining a trusted relationship with
customers that leads to the customers‘
repeated purchases of products or services
over a given period of time (Lam, Shankar,
Erramilli, and Murthy, 2004). Customer
retention, in general, increases profit and
growth to the extent that increasing the
percentage of loyal customers by as little as
5% can increase profitability by as much as
30% to 85%, depending upon the industry
involved (Gefen, 2002). Loyal customers are
typically willing to pay a higher price and
understand when something goes wrong.
- 1640 - | P a g e
They are easier to satisfy because the vendor
knows the customers‘ expectations better
(Gefen, 2002). It has been found that loyal
customers are less price sensitive and lower
costs are incurred by providers as the expense
of pursuing new customers is reduced (Rowley
and Dawes, 2000). The presence of a loyal
customer base provides the firm with valuable
time to respond to competitive actions
(Rowley & Dawes, 2000). Customers
demonstrate their loyalty in several ways.
They may choose to stay with a provider,
whether this continuance is defined as a
relationship or not, or they may increase the
number of, or the frequency of, their
purchases (Rowley and Dawes, 2000).
Trustworthiness of the partner is a factor that
has certain impact on the establishment of
loyalty – nobody expects a long-term relation
with a partner that cannot be trusted.
Trustworthiness is one criterion for measuring
the value of the partner. (Doney et al. 1997)
Spekman (1988) calls trust a cornerstone of
the strategic partnership. Morgan and Hunt
(1994: 22) posit that trust is a major
determinant of relationship commitment:
brand trust leads to brand loyalty because
trust creates exchange relationships that are
highly valued. Chauduri and Holbrook (2001:
91) have showed that brand trust is directly
related to both purchase and attitudinal
loyalty. Many authors have accented that
trust is important in conditions of uncertainty
(Moorman et al. 1992; Doneyet al. 1997;
Dwyeret al. 1987; Morgan et al. 1994).
Uncertainty may be caused by dependence or
large choice: people tend then to prefer
popular or familiar brands or partners.
Reichheld and Schefter (2000) stress that
loyalty via relationship development and
improvement is necessary or even the best-
designed electronic commerce model will
collapse. Another determinant of customer
retention is the degree of trust that customers
have in the vendor (Reichheld and Schefter,
2000)—trust is important in managing
relationship (Komiak, Wang and Benbasat,
2005). The use of Web tools may have an
effect on the relationship between trust and
customer retention because trust is a
precursor to customer retention. Trust is a
willingness to rely on an exchange partner in
whom one has confidence (Berry, 1995).
Becoming a trusted partner is key to
maintaining relationships.
Self-service is an important concept to be
applied to business-to-consumer e-
commerce. Online shoppers look for items
they want to purchase on the Internet, add
items into an online basket, and click the
submit button to send an order to online
stores. The growing level of online sales every
year is the evidence that consumers
increasingly prefer to "help themselves" and
demand to obtain instant information
(Bondeand Cahill, 2005). Time saving is the
biggest advantage of self-service according to
50% of 1,008 survey respondents, whereas
lack of human contact is the biggest
disadvantage of self-service by 43% of
respondents (Howard &Worboys, 2003).
Sweeney and Soutar (2001) used a
multidimensional model of four dimensions to
measure customers‘ perceived values of a
product or a service. Originally, there are 19
items that revealed a stable structure of the
four dimensions: emotional, social, functional
(value-for-money), functional
(performance/quality). Lim et al (2006)

- 1641 - | P a g e
adopted the framework of measuring
customers‘ perceived values of a product or a
service suggested by Sweeney and Soutar
(2001) in determining the customers‘
perceived value of mobile services. According
to them, three value dimensions – economic,
emotional, and social values - are treated as
the most relevant to mobile service
experience. Economic value is related to
perceived economic benefits received by
users of mobile phone services in comparison
to the monetary cost of the services.
Many researchers found a significant role of
consumers‘ perceived monetary value in
satisfaction and future decisions (McDougall
and Levesque, 2000, Chen, 2003). Emotional
value is the utility derived from the feelings or
affective states that a product/service
generates (Sweeney and Soutar, 2001). Social
value is the utility derived from the product‘s
or service‘s ability to enhance social self-
concept (Sweeney and Soutar, 2001). Bloemer
and Kasper (1995) have investigated the
relationship between consumer satisfaction
and brand loyalty. In their definition of loyalty,
repeat purchasing is differentiated from
brand loyalty. Repeat purchasing is seen not
to take into account the degree of
commitment as does brand loyalty. This
concept is then further divided into true brand
loyalty and spurious loyalty. True brand
loyalty is based on commitment and therefore
the customer insists on buying the same brand
next time there is a need to buy the same
product. When spurious loyalty prevails, the
buyer lacks attachments to the brand and is
easily persuaded to buy some other brand.
Critique of the Existing Relevant Literature
All companies strive to make profits. Having a
customer retention base appears to be one
way to cost advantages as well as to other
non-measurable benefits. Loyal customers
expect to be rewarded by their loyalty in
terms of price discounts or better service. The
second argument is that loyal customers are
willing to pay premium. This is because
changing the supplier would be even more
expensive to the customer and due to these
switching costs they stay loyal to the
company. The research offers the opposite
results, as loyal customers appear to be more
price sensitive and indeed assume to deserve
price discounts that random customers do
not. How about the assumption that loyal
customers do effective word-of-mouth
marketing for the company?
This dimension is very hard to measure, but
what stands out is that customers who are
loyal based on their attitude as well as
purchase behavior are more likely to market
the company than customers, whose loyalty is
measured with just purchase behavior.
Reinartz and Kumar (2002) further suggest
that companies should segment their
customers based on their profitability and
potential, because even long-term customers
are not always the most profitable. The basic
idea in customer relationship management is
just that, identifying and focusing on the most
profitable customers.
A study carried by Joseph et al. (2003) found
that reliable and accurate services include
customer services; personalized services; and
accurate records are some of the factors
which are considered by the customers in
their choice of a given type of service delivery
channel. However, the study was not carried

- 1642 - | P a g e
out in a developing country in Kenya and thus
the findings, although relevant to the current
study, cannot fully depict the situation in
Kenya. Zhou (2004) who studied dimension-
specific analysis of performance-only
measurement of service quality and
satisfaction failed to enrich the current
phenomenon since it analyzed performance
only measurement of service quality.
Research Gap
Studies on the influence of service quality on
customer retention in firms are numerous.
Most of the studies conducted by Bitner et al.
(2000), Palmer, Bailey, and Faraj, (2000),
Metters et al. (2006) etc. were based in
developed economies. Locally, there is no
study in Kenya that has looked at the influence
of service quality on customer retention. This
study therefore, sought to fill the knowledge
gap by establishing the influence of service
quality on customer retention in Kenyan
communication companies.
RESEARCH METHODOLOGY
Introduction
This chapter discusses the research design, target
population, sample and sampling procedure,
research instruments, piloting of the instruments,
data collection and data analysis procedure.
Research design
This study adopted a descriptive approach.
According to Coopers and Schindler (2006)
descriptive studies are more formalized and
typically structured with clearly stated
hypotheses or investigative questions. It
serves a variety of research objective such as
descriptions of phenomenon or
characteristics associated with a subject
population, estimates of proportions of a
population that have these characteristics and
discovery of associations among different
variables. This study will adopt a descriptive
design since it has a variety of research
objective or characteristics associated with a
subject population.
Target population
The population of the study consisted of top
level management, middle level management
and lover level management employees of
Airtel Kenya at the head office in Nairobi. The
sample consisted of 680 from the top, middle
and low level management category.
Table 3.1: Target Population
Population Percentage
Top level management 45 5.5%
Middle level management 270 38.9%
Low level management 365 55.6%
Total 680 100%
3.4 Sample Size

- 1643 - | P a g e
Conventionally, a sample size of 30 elements
is acceptable for research purpose (Mugenda
& mugenda, 2003). The study had a sample
size of 45 which was sufficiently
representative of the target population. A
stratified random sampling technique was
employed to select the respondents who were
stratified based on the various employment
levels in the organization. The sample size was
obtained from Airtel Kenya head office in
Nairobi. This sample size was justifiable as it
represented 10% of the total population.
According to Mugenda & Mugenda (2003), a
sample size of 10% is good representation of
the whole population.
Table 3.2: Sampling Frame
Population Sample ratio Sample size
Top level management 45 0.1 4
Middle level management 270 0.1 27
Low level management 365 0.1 36
Total 680 0.1 68
Data Collection Methods
The primary data was collected by use of a
questionnaire which was used to record
respondent’s responses. The questionnaire
was ideal because the researcher gave the
respondents time to respond to the items
during their free time bearing in mind that
they will be administered when the
respondents are on duty. The respondents
were issued with questionnaires to fill by
themselves. Secondary data was obtained
from company records. Secondary data was
useful in providing collaborative information
on the problem of the study.
Data collection utilized questionnaires for
managers and their staff who carry out
administrative activities in the respective
departments. The questionnaires were ideal
because the confidentiality of the
respondents will be upheld. The questionnaire
items sought to elicit background information,
competition, and strategic responses applied
by the company.
Pilot Test
According to Bordens &Abbott (2008), pilot study is
as a small-scale version of the study used to
establish procedures, materials and parameters to
be used in the full study. Pilot study was conducted
in determining if there were flaws, limitations, or
other weaknesses within the data collection
instrument to make the necessary revisions prior to
the implementation of the study. It is recommended
that 10% of the sample should constitute the pilot

- 1644 - | P a g e
test (Neumann, 2006). A pilot study was undertaken
on at least 7 respondents of the sample size to test
the reliability and validity of the questionnaire. The
findings of the pilot study were not included in the
actual study (Mugenda & Mugenda, 2008).
Reliability and validity of the research
instruments
Reliability is the extents to which a research
instrument yields findings that are consistent
each time it is administered to same subjects
(Mugenda&Mugenda, 2003).The
measurement of reliability provides
consistency in the measurement
variables(Kumar,2000)). Cronbach alpha is the
basic formula for determining the reliability
based on internal consistency (Kim & Cha,
2002). The standard minimum value of alpha
of 0.7 is recommended Gupta (2004) as the
minimum level for item loadings. Higher alpha
coefficient values means there is consistency
among the items in measuring the concept of
interest. Suppose that we assume a sum of K
components (K-items or test lets)
X=Y1+Y2+……Yk. Cronbach‘s α
If the items are scored 0 and 1, a shortcut formula is
where . This is the same as KR-20
can be defined as
Where is as above, the average variance of each
component (item), and the average of
where the Variance of the observed total test scores, and the variance component i for
the current sample of persons.
is the proportion scoring 1 on item i , and
Alternatively, Cronbach's
- 1645 - | P a g e
all covariance‘s between the components across the current sample of persons (that is, without including the
variances of each component).
Validity is the degree to which the sample of
the test item represent the content that is
designed to measure, that is, the instrument
measures the characteristics or trait that is
intended to measure (Mugenda & Mugenda,
2008). Data need not only to be reliable but
also true and accurate. If a measurement is
valid, it is also reliable (Creswell, 2003). The
research adopted content validity which
refers to the extent to which a measuring
instrument provides adequate coverage of
the topic under study. The content validity
was achieved by subjecting the data collection
instruments to an evaluation group of experts
who provided their comments and relevance
of each item of the instruments and the
experts indicate whether the item is relevant
or not.. The content validity formula by Yin
(2003) was used in this study. The formula is;
Content Validity Index = (No. of judges
declaring item valid) / (Total no. of items). It is
recommended that instruments used in
research should have CVI of about 0.78 or
higher and three or more experts could be
considered evidence of good content validity
(Yin, 2003).
Data Analysis
The questionnaire was checked for
completeness and consistency of information
at the end of every field data collection day
and before storage. Data capturing was done
using Excel software. The data from the
completed questionnaires will be cleaned, re-
coded and entered into the computer using
the statistical packages for social sciences
(SPSS) for Windows for analysis. The SPSS
computer program was commanded to
produce frequency tables, graphs, pie charts
and the necessary measures of variances for
interpretation.
Descriptive statistics (that is frequency
analysis) was computed for presenting and
analyzing the data. Descriptive statistics
enables the researcher to describe the
aggregation of raw data in numerical terms
(Neuman 2004). Descriptive statistics by use
of standard deviation, percentages and
frequency distribution will be used to analyze
data.
Data was presented in the form of frequency
distribution tables, graphs and pie charts that
facilitated description and explanation of the
study findings. Correlation will be used to
analyze the degree of relationship between
the variables in the study. The multiple
regression analyses determined whether the
groups of factors proposed together predict
or determinant affecting effective customer
retention (Neuman, 2000). The study also
used a five point Likert scale ranging from
1=strongly disagree to 5=strongly agree for
item analysis purpose. Likert scale is easy to
use in respondent –centered and stimulus-
centered studies (Patton, 2002).
The dependent variable was determinants
effective customer retention while the
independent variables will be customer
satisfaction, customer care service, Price and
tariff structure and sales promotion. The study

- 1646 - | P a g e
sought to find out the determinant of these
parameters singly and jointly on the factors
affecting effective customer retention in Airtel
Kenya. In this case, determinant affecting
effective customer retention is represented
by 4 parameters: customer satisfaction,
customer care service, Price and tariff
structure and sales promotion. According to
the model used to represent the relationship
between determinant affecting effective
customer retention as a linear function of the
independent variables i.e. customer
satisfaction, customer care service,
Price and tariff structure and sales promotion,
with έ representing the error term. The study
appreciates that there are other determinants
that may determine effective customer
retention apart from the variables being
investigated hence the need to incorporate
the error term. The βs in the above equation
represent the estimated parameters as
indicated below.
Yi = α + β1(CS) + β2(CSC) + β3(PTS) + β4(SP)+ έ .
Where; Yi= determinant affecting effective
customer retention α = Constant
CS= customer satisfaction
CCS= customer care service
PTS= Price and tariff structure
SP= sales promotion
B1….B4= Coefficients
DATA ANALYSIS, PRESENTATIONS AND
INTERPRETATIONS
Introduction
This chapter discusses the interpretation and
presentation of the findings obtained from
the field. The chapter presents the
background information of the respondents,
findings of the analysis based on the
objectives of the study. Descriptive and
inferential statistics have been used to discuss
the findings of the study.
Response Rate
The study targeted a sample size of 68
respondents from which 41 filled in and
returned the questionnaires making a
response rate of 60.29%. This response rate
was satisfactory to make conclusions for the
study as it acted as a representative.
According to Mugenda&Mugenda (2003), a
response rate of 50% is adequate for analysis
and reporting; a rate of 60% is good and a
response rate of 70% and over is excellent.
Based on the assertion, the response rate was
good. This high response rate can be
attributed to the data collection procedures,
where the researcher pre-notified the
potential participants and applied the drop
and pick method where the questionnaires
were picked at a later date to allow the
respondents ample time to fill the
questionnaires. The response rate was
therefore adequate for the study to make
relevant conclusions basing on the responses.

- 1647 - | P a g e
Table 4.1 Response Rate
Questionnaires Questionnaires
Percentage
Administered filled & Returned
Pilot Test Results
Reliability Results
A pilot study was carried out to determine
reliability of the questionnaires. The pilot
study involved sampling respondents in
various strata in the organizations. Reliability
analysis was subsequently done using
Cronbach‘s Alpha which measured the
internal consistency by establishing that
certain items within a scale measures the
same construct. Cortina (2008) established
the Alpha value threshold at 0.7 and above is
regarded as most reliable, thus forming the
study‘s benchmark. This illustrates that all the
four variables were reliable as their reliability
values exceeded the prescribed threshold of
0.7 thus the data collection instrument was
reliable.
Table 4.2: Reliability Test Results
Scale Cronbach's Alpha Number of Items
Customer satisfaction 0.781 5
Customer care service 0.816 5
Sales promotion 0.789 4
Price/Tariff Structure 0.799 5
Validity analysis
If a measurement is valid, it is also reliable
(Joppe, 2000).The content validity formula by
Amin (2005) was used in this study. The
formula is; Content Validity Index = (No. of
judges declaring item valid) / (Total no. of
items). It is recommended that instruments
used in research should have CVI of about 0.78
or higher and three or more experts could be
considered evidence of good content validity
(Amin, 2005). From the results in table 4.3, it
illustrates that all the four variables were valid
as their CVI values exceeded the prescribed
Respondents 68 41 60.29 %

- 1648 - | P a g e
threshold of 0.78.This infers that the
instrument for data collection was valid as
emphasized by Amin (2005) as validity of test
yielded an average index score of 87.60%.
Table 4.3; Content Validity Index
Variable Valid items Fraction Comment
Customer satisfaction 6 0.789 Accepted
Customer care service 6 0.789 Accepted
Sales promotion 6 0.786 Accepted
Price/Tariff Structure 6 0.788 Accepted
Overall 0.876 Accepted
Demographic Information
Demographic information provides data
regarding research participants and is
necessary for the determination of whether
the individuals in a particular study are a
representative sample of the target
population and testing appropriateness of the
respondent in answering the questions for
generalization purposes. The demographic
information comprised of the gender, age,
highest level of education and duration of
service.
Gender of the respondent
The study sought to determine the gender of
the respondent and therefore requested the
respondent to indicate their gender. The
findings are as shown in Figure 4.1. The study
found that majority of the respondent as
shown by 53.7% were males whereas 46.3% of
the respondent were females, this is an
indication that both genders were involved in
this study and thus the finding of the study did
not suffer from gender biasness. This implies
there were more male than female
respondents though with less disparity
meaning that there is gender balance among
the employees in the organization. Carter and
Shaw (2007) found that organizations with
gender balance were motivated to perform
better towards organization goal as women
and men compete favorably to deliver on their
assignments.
53.7%
males
46.3%
females

- 1649 - | P a g e
Figure 4.1: Gender of the respondent
Age distribution
On respondent‘s age distribution, the findings
were as shown in Figure 4.2. The findings
revealed that; most of the respondents as
shown in Figure 4.2 by 42% were aged
between 41 to 50 years, 30 % of the
respondents 30 to 40 years, 16% of the
respondents were aged below 30 years,
whereas 12% of the respondents were aged
above 50 years. This implies participants were
well distributed in terms of their age. This also
implies that majority of the respondents were
at their maturity stage and therefore able to
handle their roles responsibly. The findings
support the move by the organizations giving
emphasis on maturity and experience during
the implementation of various projects.
Baines &Hardill(2008) found that age is
associated with experience and responsibility
at work place.
Figure 4.2: Age distribution
Duration of service
The study went further to establish the period
of working at the organization and the results
were as shown in Figure 4.3. According to the
findings, majority of the respondents as
shown by (54%) had worked with the
organization for duration of5-10 years. 23%
had worked with the organization for a period
less than 6 years and the same percentage
worked for a period of 6 to 10 years. 15 % had
worked with the organization for more than
10 years whereas 8% had worked with the
organization for not more than a year. This
implies that majority of the respondents had
worked with the organisation for a
considerable period of time and thus they
were in a position to give credible information
relating to this study.The findings collaborate
MCclartyet al, (2012) observation that the
longer employees stick with their organization
the more they demonstrated an explicit
motivation that was not for financial gain but
a wish to make a difference. This meant that
16 %
30 %
42 %
12 %
0
5
10
15
20
25
30
35
40
45
Below 30 years 30 - years 40 41 - 50 years Above 50 years

- 1650 - | P a g e
they would invest time and effort to make
sure they succeed. It may also imply that work
related experiences are important in
developing motivation for becoming good in
an organization. The study therefore observes
that the respondents are experienced people
who are in their respective departments for
the long haul. Longevity at the organization
therefore becomes a trait that ensures
continuity and perpetuation of the vision of an
organization. Customer retention would
ordinarily thrive under such circumstances
where their management remains focused in
realizing both their objectives and economic
outcomes.
Level of education
The researcher requested the respondents to
indicate their highest level of education
achieved and the results are as shown in
Figure 4.4. From the findings, it was revealed
that majorityof the respondents as shown by
34% of the respondents held bachelor‘s
degrees, 27% of the respondents were
holders of college diploma certificates, 25% of
the respondents were holders of masters
degrees whereas 14% of the respondents held
PhD, this implies that respondents were well
educated which means that they were in a
position to respond to research questions
with ease. Hazernberg (2012) associated the
education level of project managers with
findings that, those with higher levels of
education are more successful because higher
education provides them knowledge and
modern managerial skills, making them more
conscious of the reality of the organization
management world and thus in a position to
use their learning capabilities to enhance
organization and delivery. The findings
therefore indicate that the respondents have
the capacity, skills and management acumen
to a small extent to service delivery and
customer satisfaction. These skills may help
them handle and interpret their respective
services and the emerging issues in customer
retention to the best level possible.
Customer Satisfaction
Figure 4. 3 : Duration of service
0
20
40
60
Below 1 year 1 - 5 years 5 - 10 years above 10 years
% 8
% 23
54 %
% 15

- 1651 - | P a g e
The study sought to investigate whether
customer satisfaction influence customer
retention in the organization. The results were
as shown in Table 4.4. From the research
findings in Table 4.4, majority of the
respondents as shown by 58.24% were of the
opinion that customer satisfaction influence
customer retention whereas 31.48% of the
respondents were of the contrary opinion.
This implies that customer satisfaction
influence customer retention in the
organization. The findings of the study are in
agreement with Kohli&Jaworski (2010) who
stated that if the customers are satisfied with
the provided goods or services; the probability
that they use the services again increases.
Also, satisfied customers will most probably
talk enthusiastically about their buying or the
use of a particular service; this will lead to
positive advertising (File & Prince, 2012) and
(Richens, 2003). On the other hand,
dissatisfied customers will most probably
switch to a different brand; this will lead to
negative advertising. The importance of
satisfying and keeping a customer in
establishing strategies for a market and
customer oriented organization cannot be
neglected customer satisfaction is often
considered the most important factor in
thriving in today‘s highly competitive business
world.
Table 4.4: Influence of customer satisfaction on customer retention
Opinion Frequency Percent
Yes 24 58.54
No 17 41.46
Total 41 100
Figure 4 . 4 Level of education :
0
10
20
30
40
Diploma level Bachelor‘s Degree
Masters Level Post Graduate
% 27 % 34
% 25
14 %

- 1652 - | P a g e
The study sought to investigate the extent to
which customer satisfaction influence
customer retention in the organization. The
results were as shown in Figure 4.5. From the
research findings, majority of the respondents
(68%) stated that the customer satisfaction
influence customer retention to a high extent,
23% of the respondents cited to a moderate
extent whereas 9% of the respondents
indicated to a low extent. This implies that
customer satisfaction influence customer
retention to a high extent on the
organization.Accoording to Kohli&Jaworski,
2010, customer satisfaction boost customer
retention to a great extent and it is a
significant factor.
Figure 4.5: Extent of customer satisfaction
influence customer retention
The study sought to establish the extent to
which the respondents following aspects of
customer satisfaction influence customer
retention in the organization. A scale of 1-5
was used. The scores ―Very great extent‖ and
―great extent‖ were represented by mean
score, equivalent to 1 to 2.5 on the continuous
Likert scale (1 ≤ Agree≤ 2.5). The scores of
‗moderate‘ were represented by a score
equivalent to 2.6 to 3.5 on the Likert scale (2.6
≤ Neutral ≤ 3.5). The score of ―small extent‖
and ―very small extent‖ were represented by
a mean score equivalent to 3.6 to 5.0 on the
Likert Scale (3.6 ≤ Disagree ≤ 5.0). The results
were presented in mean .The mean was
generated from SPSS version 21 and is as
illustrated in Table 4.5:
Table 4.5:Elements of customer satisfaction influence customer retention
0 %
20 %
40 %
60 %
80 %
High Moderate Low
68 %
23 %
9 %

- 1653 - | P a g e
Statement
Reduced company image 45% 25% 11% 2% 6% 1.6
Increased company image. 35% 35% 20% 2% 8%
1.4
No change on company 55%
image
25% 11% 2% 7% 1.2
From the results in Table 4.9; respondents
agreed that to a great extent that lack of
customer satisfactionreduced company image
by a mean of 1.6; customer satisfaction
increase company imageby a mean of 1.4; to
change on company image. This infers that
lack of these factors of customer satisfaction
affected customer retention. In addition the
findings of the study corroborate with
literature review by the Chen &Ko (2007) who
indicated that customer satisfaction is
determined by company image because of the
services are real time that is they are used by
the customers as soon as offered.
Customer Care Service
The study sought to investigate whether customer
care service influence customer retention in the
organization. The results were as shown in Table
4.6.
Table 4.6: Influence of of customer care service on customer retention
Opinion Frequency Percent
Yes 31 75.61
No 10 24.39
Total 41 100

- 1654 - | P a g e
From the research findings in Table 4.6,
majority of the respondents as shown by
75.61% were of the opinion that customer
care service influence customer retention
whereas 24.39% of the respondents were of
the contrary opinion. This implies that
customer care service influence customer
retention in the organization. The findings of
the study are in agreement with literature
review by Kim, Park and Jeong (2004) who
argued that service provider should provide
customer oriented services in order to
heighten up customer satisfaction.
The study sought to investigate the extent to
which customer care service influence customer
retention in the organization. The results were as
shown in Figure 4.6.
Figure 4.6: Extent of customer care service
influence customer retention
From the research findings in Figure 4.6,
majority of the respondents (45%) stated that
the customer care service influence customer
retention in the organization to a very great
extent, 35% of the respondents cited to a
great extent, 14% of the respondents
indicated to moderate extent, 5% cited a small
extent whereas 1% of the respondents
indicated to a low extent. This implies that
customer care service influence customer
retention in the organization to a very great
extent in the organization. The study findings
corroborates with literature review by Ahn,
Han and Lee (2006) who showed that when
the customers, do not get their complaints
considered properly, they start looking for
other brands. It happens because either the
customer service centers do not handle the
complaints or the customers are not able to
address them properly. Sometimes, telecom
service providers take considerably longer
time to resolve the problems like network
coverage or call quality, the customers do not
wait for long and hence they lose satisfaction
with that particular brand thus customer care
service influenced customer retention to a
great extent in telecom service providers.
The study sought to establish the extent to which
the respondents following aspects of customer
0 % % 5 % 10 15 % % 20 25 % 30 % % 35 40 % 45 %
Very great extent
Great extent
Moderate extent
Small extent
No extent
45 %
% 35
% 14
5 %
% 1

- 1655 - | P a g e
care service influence customer retention in the
organization in the organization. The scores
―Strongly agree‖ and ―Agree‖ were
represented by mean score, equivalent to 1 to
2.5 on the continuous Likert scale (1 ≤ Agree≤
2.5). The scores of ‗Neutral‘ were
represented by a score equivalent to 2.6 to 3.5
on the Likert scale (2.6 ≤ Neutral ≤ 3.5). The
score of ―Disagree‖ and
―Strongly disagree‖ were represented by a
mean score equivalent to 3.6 to 5.0 on the
Likert Scale (3.6 ≤ Disagree ≤ 5.0). The results
were presented in mean. The mean was
generated from SPSS version 21 and is as
illustrated in Table 4.7:
Table 4.7: Elements of customer care service influence customer retention
Statement
Effects of organizational
performance on customer care
service
45% 25% 11% 2% 6% 1.6
The customer care service relate
well with your mobile phone service
needs
55% 15% 11% 2% 6% 1.3
The customer care service are better
as compared to those from other
service providers
45% 25% 9% 2% 8% 1.7
The customer care service enable
you to achieve your goals
45% 15% 11% 2% 16% 1.5
The customer care service
enhance your identity
25% 45% 11% 2% 6% 1.6

- 1656 - | P a g e
From the results in Table 4.7; respondents
agreed that to a effects of organizational
performance on customer care service by a
mean of 1.6; the customer care service relate
well with the organization mobile phone
service needs by a mean of 1.3; The customer
care service are better as compared to those
from other service providers by a mean of 1.7,
The customer care service enable you to
achieve your goals by a mean of 1.5 and The
customer care service enhance your identity
by a mean of 1.6 . This implies that lack of
these factors of customer satisfaction
influence customer retention.The findings of
the study are in agreement with literature
review byKuo, Wu and Deng (2009) who
stated that customer service is a system of
activities that comprises customer support
systems, complaint processing, speed of
complaint processing, ease of reporting
complaint and friendliness when reporting
complaint (Kim, Park and Jeong, 2004).
Customer services are the opportunities for
telecom service providers that are added to
mobile network other than voice services in
which contents are either self-produced by
service provider or provided through strategic
compliance with service provider. The
improved customer services are the focal
point of the telecom service providers for
social as well as for economic reasons.
From a social point of view, services should be
available to the customers on reasonable
terms. As far as economic factor is concerned,
services should satisfy the needs of the
customers thus enhancing customer
retention.
Sales Promotion
The study sought to investigate whether sales
promotion influence customer retention in the
organization. The results were as shown in Table
4.8.
Table 4.8: Influence of sales promotion on customer retention
Opinion Frequency Percent
Yes
29 70.73
No 12 29.27
Total 41 100
From the research findings in Table 4.8,
majority of the respondents as shown by
70.73% were of the opinion that sales
promotion influence customer retention
whereas 29.27% of the respondents were of
the contrary opinion. This implies that sales
promotion influence customer retention in
the organization. According to Luk& Yip (2008)
sales promotions are incentivebased and
transactional in nature and provide
immediate rewards and utilitarian benefits to
the customers thus enhancing customer
retention.

- 1657 - | P a g e
The study sought to investigate the extent to
which sales promotion influence customer
retention in the organization. The results were
as shown in Figure 4.7.
Figure 4.7: Extent of sales promotion influence on customer retention
From the research findings in Figure 4.4,
majority of the respondents (45%) stated that
the sales promotion influence customer
retention in the organization to a very great
extent, 40 % of the respondents cited to a
great extent, 10% of the respondents
indicated to moderate extent, 2% cited a small
extent whereas 3% of the respondents
indicated to a nm extent at all. This implies
that sales promotion influence customer
retention in the organization to a very great
extent in the organization. According to Luk
and Yip (2008) sales promotions are incentive-
based and transactional in nature and provide
immediate rewards and utilitarian benefits to
the customers. He further argues that both
monetary and non-monetary promotions
provide benefits thus enhancing customer
retention.
The study sought to establish the extent to
which the respondents following aspects of
sales promotion influence customer retention
in the organization in the organization. The
scores ―Strongly agree‖ and ―Agree‖ were
represented by mean score, equivalent to 1 to
2.5 on the continuous Likert scale (1 ≤ Agree≤
2.5). The scores of ‗Neutral‘were represented
by a score equivalent to 2.6 to 3.5 on the Likert
scale (2.6 ≤ Neutral ≤ 3.5). The score of
―Disagree‖ and
―Strongly disagree‖ were represented by a mean
score equivalent to 3.6 to 5.0 on the Likert Scale
(3.6 ≤ Disagree ≤ 5.0). The results were presented
in mean. The mean was generated from SPSS
version 21 and is as illustrated in Table 4.9.
From the results in Table 4.9; respondents
agreed that to a Airtel Kenya sales-promotion
matches with the changing environment by a
mean of 1.6; Airtel Kenya has a wide range of
sales-promotion to suit different people by a
mean of 1.3; Airtel Kenya offers continuous
Salepromotion to its customers by a mean of
1.7, Sale-promotion of Airtel Kenya are
appreciated by its customers by a mean of 1.5
and Airtel Kenya offers more sale-promotion
than its competitors by a mean of 1.6 . This
implies that lack of these factors of sales
promotion influence customer retention. The
findings of the study are in agreement with
0 %
20 %
% 40
60 %
Very great extent
Great extent Moderate extent
Small extent No extent
45 % 40 %
% 10 2 % % 3
- 1658 - | P a g e
the literature review by Pauwels,Hanssens &
Siddarth (2002) argued that sales promotions
could lead to negative or negative impact on
brand preference and trust. This is because
both non-monetary and monetary promotion
can divert attention to financial incentives
which may encourage brand switching
behaviour, increase price sensitivity (Aaker,
1996; Manaled et al, 2007). Gedenk and
Neslin (1999) argued further that sales
promotion can lead to a significant decrease
or increase in brand loyalty thus customer
retention.
Table 4.9: Elements of sales promotion influence on customer retention
Statement
Airtel Kenya sales-promotion
matches with the changing
environment
45% 25% 11% 2% 6% 1.6
Airtel Kenya has a wide range of
sales-promotion to suit different
people
55% 15% 11% 2% 6% 1.3
Sale-promotion are able to meet
most of Airtel Kenya needs
55% 15% 11% 2% 6% 1.3
Airtel Kenya offers continuous Sale-
promotion to its customers
45% 25% 9% 2% 8% 1.7
Sale-promotion of Airtel Kenya are
appreciated by its customers
45% 15% 11% 2% 16% 1.5
Airtel Kenya offers more
Salepromotion than its competitors
15% 55% 11% 2% 6% 1.6
Price Structure
The study sought to investigate whether price
structure influence customer retention in the
organization. The results were as shown in Table
4.10.

- 1659 - | P a g e
Table 4.10: Influence of Price/ Tariff Structure on customer retention
Opinion Frequency Percent
Yes 32 78.05
No 9 21.95
Total 41 100
From the research findings in Table 4.10,
majority of the respondents as shown by
78.05% were of the opinion that price/tariff
structure influence customer retention
whereas 21.95% of the respondents were of
the contrary opinion. This implies that price/
tariff structure influence customer retention
in the organization. The study results are in
agreement with literature review by Kim et
al.(2004) satisfaction of customers in telecom
market depends on factors like attractive call
rate, internet browsing fees and price
schedule variation. Thus price structures of
the operators influence the loyalty of users a
lot. Price seems one of the very significant
factors to derive satisfaction and make users
loyal. In this regard, operators should be more
careful in determining and maintaining price
structure of call and variety of services offered
to customers, otherwise switching tendency
of customers across operators will be
increased and resulting lessening the loyalty
of customers.
The study sought to investigate the extent to
which price/ tariff structure influence customer
retention in the organization. The results were as
shown in Figure 4.8.
Figure 4.8: Extent of price structure influence on
customer retention
From the research findings in Figure 4.8,
majority of the respondents (45%) stated that
the price/ tariff structure influence customer
retention in the organization to a very great
extent, 35% of the respondents cited to a
great extent, 14% of the respondents
indicated to moderate extent, 5% cited a small
extent whereas 1% of the respondents
indicated to a low extent. This implies that
price/ tariff structure customer retention in
0 % % 5 % 10 15 % % 20 25 % 30 % % 35 40 % 45 %
Very great extent
Great extent
Moderate extent
Small extent
No extent
45 %
% 35
% 14
5 %
% 1
- 1660 - | P a g e
the organization to a very great extent in the
organization. Kim et al.(2004) stated that tariff
structure plays a vital role in
telecommunication market, especially for the
mobile telecommunication service providers.
Satisfaction of customers in telecom market
depends on factors like attractive call rate,
internet browsing fees and price schedule
variation. They argued that price structures of
the operators influence the loyalty of users a
lot to a great extent.
The study sought to establish the extent to
which the respondents following aspects of
price/ tariff structure influence customer
retention in the organization in the
organization. The scores ―Strongly agree‖
and ―Agree‖ were represented by mean
score, equivalent to 1 to 2.5 on the continuous
Likert scale (1 ≤ Agree≤ 2.5). The scores of
‗Neutral‘ were represented by a score
equivalent to 2.6 to 3.5 on the Likert scale (2.6
≤ Neutral ≤ 3.5). The score of ―Disagree‖ and
―Strongly disagree‖ were represented by a mean
score equivalent to 3.6 to 5.0 on the Likert Scale
(3.6 ≤ Disagree ≤ 5.0). The results were presented
in mean. The mean was generated from SPSS
version 21 and is as illustrated in Table 4.11:
Table 4.11: Elements of price/ tariff structure on customer retention
Am totally satisfied with the prices
offered by the service provider
45% 25% 11% 2% 6% 1.6
Price is an indicator of the
quality of service
55% 15% 11% 2% 6% 1.3
Airtel Kenya offers cheap and 45% 25% 9% 2% 8% 1.7
affordable products as compared to
other mobile companies
From the results in Table 4.11; respondents
agreed that they are totally satisfied with the
prices offered by the service provider by a
mean of 1.6; price is an indicator of the quality
of service by a mean of 1.3; Airtel Kenya offers
cheap and affordable products as compared
Statement

- 1661 - | P a g e
to other mobile companies by a mean of 1.7.
This implies that lack of these factors of price/
tariff structure influence customer retention.
The findings of the study are in agreement
with literature review by Kim et al.(2004) who
indicated that tariff structure plays a vital role
in telecommunication market, especially for
the mobile telecommunication service
providers. Satisfaction of customers in
telecom market depends on factors like
attractive call rate, internet browsing fees and
price schedule variation. Thus price structures
of the operators influence the loyalty of users
a lot. Price seems one of the very significant
factors to derive satisfaction and make users
loyal. In this regard, operators should be more
careful in determining and maintaining price
structure of call and variety of services offered
to customers, otherwise switching tendency
of customers across operators will be
increased and resulting lessening the loyalty
of customers.
Customer Retention
The study sought to establish the extent to
which the respondents agreed with the
following statements of customer retention in
Airtel Kenya. The scores ―Strongly agree‖ and
―Agree‖ were represented by mean score,
equivalent to 1 to 2.5 on the continuous Likert
scale (1 ≤ Agree≤
2.5). The scores of ‗Neutral‘ were represented
by a score equivalent to 2.6 to 3.5 on the
Likert scale (2.6 ≤ Neutral ≤ 3.5). The score of
―Disagree‖ and ―Strongly disagree‖ were
represented by a mean score equivalent to 3.6
to 5.0 on the Likert Scale (3.6 ≤ Disagree ≤ 5.0).
The results were presented in mean. The
mean was generated from SPSS version 21
and is as illustrated in Table
4.12. From the results in Table 4.12, respondents
agreed that customers often think of leaving
Airtel Kenya by a mean of 1.6; Customers are
switching to other networks by a mean of 1.3;
Customers love Airtel Kenya by a mean of 1.7.
Customers are hoping to stay with Airtel
Kenya forever by a mean of 1.4; customers
recommend Airtel Kenya to any other
customer by a mean of 1.5 and Customers
often think of leaving Airtel Kenya by a mean
of 1.7. This implies that customer retention is
low in airtel Kenya and as in telecom market
depends on factors like attractive call rate,
internet browsing fees and price schedule
variation. Thus price structures of the
operators influence the loyalty of users a lot.
Price seems one of the very significant factors
to derive satisfaction and make users loyal. In
this regard, operators should be more careful
in determining and maintaining price
structure of call and variety of services offered
to customers, otherwise switching tendency
of customers across operators will be
increased and resulting lessening the loyalty
of customers.
Table 4.12: Statements relating to customer retention
Statement
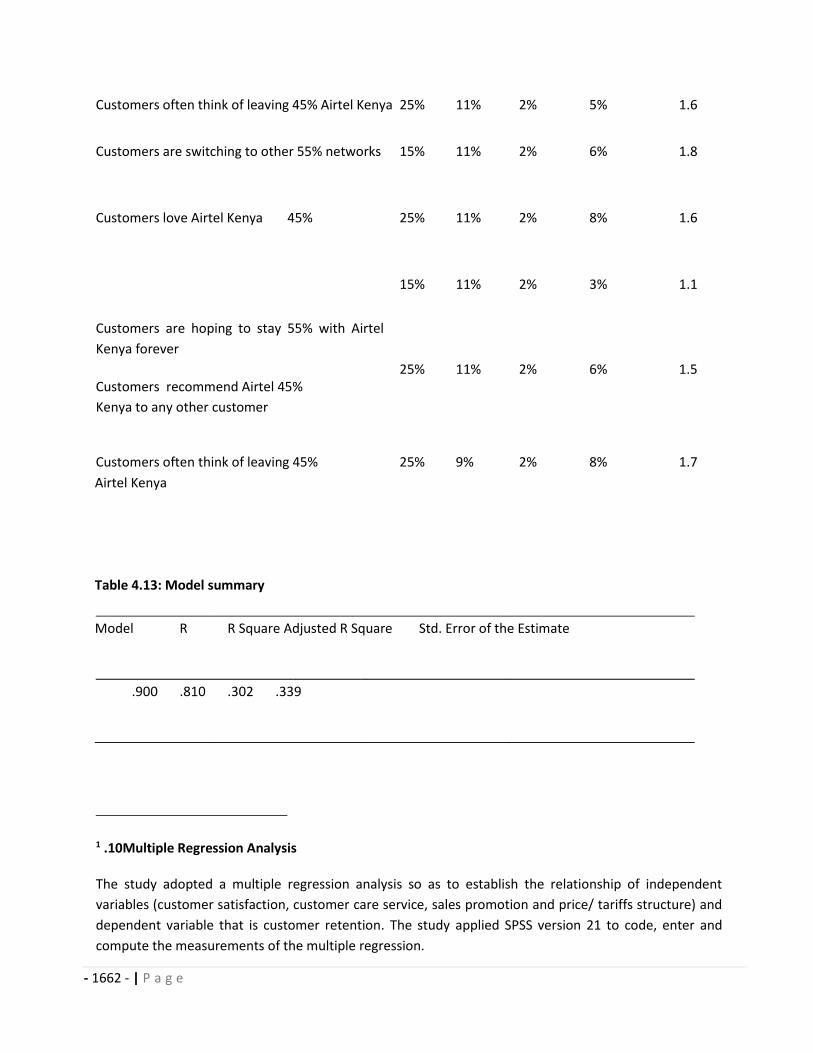
- 1662 - | P a g e
Customers often think of leaving 45% Airtel Kenya 25% 11% 2% 5% 1.6
Customers are switching to other 55% networks 15% 11% 2% 6% 1.8
Customers love Airtel Kenya 45% 25% 11% 2% 8% 1.6
Customers are hoping to stay 55% with Airtel
Kenya forever
15% 11% 2% 3% 1.1
Customers recommend Airtel 45%
Kenya to any other customer
25% 11% 2% 6% 1.5
Customers often think of leaving 45% 25% 9% 2% 8% 1.7
Airtel Kenya
Table 4.13: Model summary
Model R R Square Adjusted R Square Std. Error of the Estimate
.900 .810 .302 .339
1 .10Multiple Regression Analysis
The study adopted a multiple regression analysis so as to establish the relationship of independent
variables (customer satisfaction, customer care service, sales promotion and price/ tariffs structure) and
dependent variable that is customer retention. The study applied SPSS version 21 to code, enter and
compute the measurements of the multiple regression.

- 1663 - | P a g e
R is the correlation coefficient which shows the
relationship between the study variables, from
the findings shown in the Table 4.13 is notable
that there exists strong positive relationship
between the study variables as shown by
0.900.Adjusted R squared is coefficient of
determination which tells us the variation in the
dependent variable due to changes in the
independent variable. The four independent
variables that were studied explain 81.00% of
the customer retention as represented by the
R2. This therefore means that other factors not
studied in this research contribute 19% of the
customer retention. This implies that these
variables are very significant therefore need to
be considered in any effort to boost customer
retention in mobile telecommunications
industry in Kenya. The study therefore identifies
variables as critical determinants of customer
retention in mobile telecommunications
industry.
4.11 Analysis of Variance
Table 4.14: Analysis of Variancea
Model Sum of Squares df Mean Square F Sig.
a. Dependent Variable: Customer retention
b. Predictors: (Constant), customer satisfaction, customer care service, sales promotion and price/
tariffs structure
c. Critical value =1.3997
The significance value is 0.011which is less
that 0.05 thus the model is statistically
significance in predicting how customer
satisfaction, customer care service, sales
promotion and price/ tariffs structure
influence the customer retention in Airtel
Kenya. The F critical at 5% level of significance
was 2.2373. Since F calculated is greater than
the F critical (value = 1.3997), this shows that
the overall model was significant.
Regression Coefficients
Table 4.15: Regression Coefficients
Model Unstandardized Standardized T Sig.
Coefficients Coefficients
1
Regression
Residual
4.543
24.860
4
36
1.135
.5073
2.2373
.011b
Total 90.403 40

- 1664 - | P a g e
B Std. Error Beta
Constant
Customer satisfaction
1 Customer care service
45.208
.837
.667
.453
.060
.068
.198
.245
2.865
3.950
3.397
.016
.014
.025
Sales promotion .639 .075 .008 3.187 .043
Price structure -.781 .064 .031 4.391 .021
a. Dependent Variable: Customer retention in Airtel Kenya
The finding revealed that holding
independent variables constant(customer
satisfaction, customer care service, sales
promotion and price/ tariffs structure) to a
constant zero, customer retention would be
at 45.208 , a unit increase in customer
satisfaction would lead to increase in
customer retention by a factor of 0.837, a unit
increase in customer care service would lead
to increase in customer retention by factor of
0.667, a unit increase in sales promotion
would lead to increase in customer retention
by a factor of 0.639 and unit increase in price/
tariffs structure would lead to decrease in
customer retention by a factor of (-0.781).
From the data in Table 4.16, it was established
that regression equation was Y = 45.208 +
0.837X1 + 0.667 X2 + 0.639 X3 - 0.781
X4.Therefore, customer retention in Airtel
Kenya = 45.208 + (0.837 x customer
satisfaction) + (0.667 x customer care service)
+ (0.639 x sales promotion) + (- 0.781 x price/
tariffs structure). From the results of this
study, customer satisfaction influenced more
to the customer retention on Airtel Kenya. At
5% level of significance, customer
satisfaction had a p-value of 0.014; customer
care service had a p-value of 0.025; sales
promotion had a p-value of 0.043; price/
tariffs structure had a p-value of 0.021. The
significance values of all the independent
variables were less that 0.05 thus they
statistically significantly predict how they
influence the customer retention in Airtel
Kenya Therefore; the most significant factor
was customer satisfaction.
SUMMARY, CONCLUSIONS AND
RECOMMENDATIONS
Introduction
This chapter presented the discussion of key
data findings, conclusion drawn from the
findings highlighted and recommendation
made there-to, the conclusions and
recommendations drawn were focused on
addressing the objective of the study. The
researcher intended to establish how
customer satisfaction, customer care service,
sales promotion and price/ tariffs structure
influence customer retention in Kenya.
Summary of the findings
The summary of the findings are presented in
the section. The study sought to establish the
influence of customer satisfaction, customer
care service, sales promotion and price on
customer retention
Customer Satisfaction

- 1665 - | P a g e
According to literature reviewed, customer
satisfaction can help promote an organization
and make it retain customers or they can cause
high turnover. This underscores the fact that
customer satisfaction is critically important in
customer retention. Therefore, the study
sought to find out if the customer satisfaction
influences customer retention in Airtel Kenya.
Descriptive analysis showed that customer
satisfaction influences customer retention in
Airtel Kenya. The respondents agreed effects
of organizational performance on customer
care service , the customer care service relate
well with the organization mobile phone
service needs ,the customer care service are
better as compared to those from other
service providers and customer care service
enable them to achieve your goals. Further,
the variable statistically and significantly
influenced customer retention in Airtel Kenya
at 0.05 level of significance. This implies that
the more customer satisfaction becomes the
more the customer retention in Airtel Kenya.
Therefore, from these descriptive and
qualitative results show that the research
which sought to establish the influence of
customer satisfaction on customer retention in
Airtel Kenya was achieved because it
established that customer satisfaction
influences customer retention in Airtel Kenya.
Customer Care Service
Customer care service can help promote an
organization and make it attractive to
customers or it can cause high customer
turnover. This underscores the fact that
customer care service is critically important in
customer retention. Therefore, the study
sought to find out if the customer care service
influences customer retention in Airtel Kenya.
The descriptive analysis showed that
customer care service influences customer
retention in Airtel Kenya. The study also found
out that respondents the customer care
service relate well with the organization
mobile phone service needs , disagreed that
the customer care service are better as
compared to those from other service
providers and the customer care service
enable them to achieve their goals and The
customer care service enhance their identity.
Additionally, the variable statistically and
significantly influenced customer retention in
Airtel Kenya at 0.05 level of significance. This
implies that the more Price/ tariff Structure
becomes the more the customer retention in
Airtel Kenya. Therefore, from these
descriptive and qualitative results show that
the research which sought to establish the
influence of customer care service on
customer retention in Airtel Kenya was
achieved because it established that Price/
tariff Structure influences customer retention
in the organization.
Sales Promotion
According to literature reviewed, sales
promotion can help promote an organization
and make it retain customers or they can
cause high turnover. This underscores the fact
that sales promotion is critically important in
customer retention. Therefore, the study
sought to find out if the sales promotion
influences customer retention in Airtel Kenya.
The descriptive analysis showed that sales
promotion influences customer retention in
Airtel Kenya. The study established that sales
promotion does not match with the changing
environment, the organization does not have
a wide range of sales-promotion to suit

- 1666 - | P a g e
different people , does not offer continuous
sale promotion to its customers, sale-
promotion of Airtel Kenya is not appreciated
by its customers and the organization does
not offer more sale-promotion than its
competitors. Further, the variable statistically
and significantly influenced customer
retention in Airtel Kenya at 0.05 level of
significance. This implies that the more sales
promotion becomes the more the customer
retention in Airtel Kenya. Therefore, from
these descriptive and qualitative results show
that the research which sought to establish
the influence of sales promotion on customer
retention in Airtel Kenya was achieved
because it established that sales promotion
influences customer retention in the
organization.
Price/ Tariff Structure
Price/ Tariff Structure can help promote an
organization and make it attractive to
customers or they can cause high turnover.
This underscores the fact that Price/ tariff
Structure is critically important in customer
retention. Therefore, the study sought to find
out if the Price/ tariff
Structure influences customer retention in
Airtel Kenya. The descriptive analysis showed
that Price/ tariff Structure influences
customer retention in Airtel Kenya. The study
also found out that respondents disagreed
that they are totally satisfied with the prices
offered by the service provider, agreed that
price is an indicator of the quality of service
and disagreed that Airtel Kenya offers cheap
and affordable products as compared to other
mobile companies. Additionally, the variable
statistically and significantly influenced
customer retention in Airtel Kenya at 0.05
level of significance. This implies that the
more Price/ tariff Structure becomes the more
the customer retention in Airtel Kenya.
Therefore, from these descriptive and
qualitative results show that the research
which sought to establish the influence of
Price/ tariff Structure on customer retention
in Airtel Kenya was achieved because it
established that Price/ tariff Structure
influences customer retention in the
organization.
Conclusion
The study established that customer
satisfaction influences customer retention in
Airtel Kenya. Customer satisfaction
statistically and significantly influenced
customer retention in Airtel. This implies that
the lack of customer satisfaction affected the
customer retention in Airtel Kenya. This
indicates the fact that customer satisfaction is
critically important in customer retention in
the organization.
The customer care service do not relate well
with the their customers‘ needs, the customer
care service are not better as compared to
those from other service providers and
customer care service enable them to achieve
your goals. This indicates the fact that
customer care service is critically important in
customer retention in the organization.
The study also found out that sales promotion
influences customer retention in Airtel Kenya.
The sales-promotion does not match with the
changing environment, the organization does
not have a wide range of sales-promotion to

- 1667 - | P a g e
suit different people , does not offer
continuous sale promotion to its customers,
sale-promotion of Airtel Kenya is not
appreciated by its customers and the
organization does not offer more sale-
promotion than its competitors.
The study revealed that out Price/ tariff
Structure influences customer retention in
Airtel Kenya. The respondents disagreed that
they are totally satisfied with the prices
offered by the service provider, agreed that
price is an indicator of the quality of service
and disagreed that Airtel Kenya offers cheap
and affordable products as compared to other
mobile companies.
Recommendations
The study recommends that the organization
to develop policies to ensure that there is
customer satisfaction is well taken care of as
it influences customer retention in Airtel
Kenya. The organization should relate well
with its customers by ensuring quality services
than its services in order to maintain its
customers.
The study recommends for effective customer
care service can help promote an organization
and make it attractive to customers or it can
cause high customer turnover. An effective
customer care service is critically important in
customer retention. Therefore, the study
recommends for enactment of effective
strategies to enhance customer care service in
the organization to boost customer retention.
Additionally, the study recommends that sales
promotion should match with the changing
environment, the organization should have a
wide range of sales-promotion to suit different
people, offer continuous sale-promotion to its
customers, enact strategies to ensure that
there is sale-promotion of Airtel Kenya and
appreciated by its customers and the
organization should offer more sale-
promotion than its competitors.
Finally, study recommends that Price
structure influences customer retention and
there is need to ensure customers are
satisfied with the prices offered by the service
provider as the price is an indicator of the
quality of service and need for the
organization to offer relatively cheaper and
affordable products as compared to other
mobile companies.
Recommendations for Further Research
Since this study sought to establish the
determinants of customer retention on
mobile telecommunications in Kenya, it was
established that from literature review there
are scanty studies are available in Africa and
specifically in Kenyan mobile
telecommunications industry set up.
Additionally, very little has been undertaken
to explore determinants influencing customer
retention on mobile telecommunications in
Kenya thus the researcher call for further
studies to be undertaken in Kenya for
generalization of the findings of this study.
This study used qualitative and quantitative
techniques. It was also a cross sectional study
and hence other studies using longitudinal
design could be carried out to establish
whether customer retention is actualized.

- 1668 - | P a g e
Also, an exploratory study would enrich
findings because such a study would have a
wide range of factors that influence customer
retention on mobile telecommunications
industry in Kenya addressed other than the
ones identified in this study.
This study confined itself to the one mobile
telecommunications industry in Kenya. A
comparative study should be carried out to
compare whether the findings also apply for
others in Kenya in order to validate whether
the findings can be generalized to other
players in the industry.
- 1669 - | P a g e
REFERENCES
Anderson, E. W., Fornell, C., & Mazvancheryl, S. K. (2004). Customer satisfaction and shareholder value. Journal
of Marketing, 68(4), 172-185.
Allida, K. J. A., De los Santos, E. M. G., Mateus, C. H. T., Olivo, M. J. A., Pacana, L. A. H., Soriano, S. A. D., &
Sagarino, E. V. (2013). Level of Knowledge and Consumer Response on Integrated Marketing
Communication of Selected Fast Food Centers in Davao City. The Ledger, 1(1).
Adamska, M., & Minárová, M. (2014). Role of learning organization in building consumer confidence.
Arantola, H. (2003). Relationship Drivers in Provider-Consumer Relationships. Empirical Studies of Customer
Loyalty Programs (första upplagan slutsåld/sold out,'print on demand'60€). Svenska
handelshögskolan.
Alford, J., & Hughes, O. (2008). Public value pragmatism as the next phase of public management. The
American Review of Public Administration.
Becker, J. U., Greve, G., & Albers, S. (2009). The impact of technological and organizational implementation
of CRM on customer acquisition, maintenance, and retention. International Journal of Research in
Marketing, 26(3), 207-215.
Carson, D., Gilmore, A., & Walsh, S. (2004). Balancing transaction and relationship marketing in retail
banking. Journal of Marketing Management,20(3-4), 431-455.
Chaudhuri, A., & Holbrook, M. B. (2001). The chain of effects from brand trust and brand affect to brand
performance: the role of brand loyalty. Journal of marketing, 65(2), 81-93.
Coopers, D. R., & Schindler, P. S. (2006). Business Research Methods, Mac Grow–Hill. Publishing Co. Ltd. New
Delhi. India.
Dabholkar, P. A. (2015, January). How to improve perceived service quality by increasing customer
participation. In Proceedings of the 1990 Academy of Marketing Science (AMS) Annual Conference
(pp. 483-487). Springer International Publishing.
Eriksson, K., & Vaghult, A. L. (2000). Customer retention, purchasing behavior and relationship substance in
professional services. Industrial marketing management, 29(4), 363-372.
Edward, M., & Sahadev, S. (2011). Role of switching costs in the service quality, perceived value, customer
satisfaction and customer retention linkage.Asia Pacific Journal of Marketing and Logistics, 23(3),
327-345.
Gilmore, A., & McMullan, R. (2009). Scales in services marketing research: a critique and way forward.
European Journal of Marketing, 43(5/6), 640-651.
1670
Gustafsson, A., Johnson, M. D., & Roos, I. (2005). The effects of customer satisfaction, relationship commitment
dimensions, and triggers on customer retention. Journal of marketing, 69(4), 210-218.
Hollensen, S. (2015). Marketing management: A relationship approach. Pearson Education.
Hsieh, Y. C., Chiu, H. C., & Chiang, M. Y. (2005). Maintaining a committed online customer: a study across search-
experience-credence products. Journal of Retailing, 81(1), 75-82.
Hughes, M., & Churchill, S. (2005, May). Attacking profiles of successful and unsuccessful teams in Copa America
2001. In T. Reilly, J. Cabri, & D. Araújo (Eds.), Science and football V: The proceedings of the fifth world
congress on science and football (pp. 222228).
Kandampully, J., & Suhartanto, D. (2000). Customer loyalty in the hotel industry: the role of customer satisfaction
and image. International journal of contemporary hospitality management, 12(6), 346-351.
Kaplan, R. S., & Atkinson, A. A. (2015). Advanced management accounting. PHI Learning.
Kivetz, R., Urminsky, O., & Zheng, Y. (2006). The goal-gradient hypothesis resurrected: Purchase acceleration,
illusionary goal progress, and customer retention. Journal of Marketing Research, 43(1), 39-58.
Kim, S. Y., Jung, T. S., Suh, E. H., & Hwang, H. S. (2006). Customer segmentation and strategy development based
on customer lifetime value: A case study. Expert systems with applications, 31(1), 101-107.
Kim, K. H., Kim, K. S., Kim, D. Y., Kim, J. H., & Kang, S. H. (2008). Brand equity in hospital marketing. Journal of
business research, 61(1), 75-82.
Kombo, D. K., & Tromp, D. L. (2006). Proposal and thesis writing: An introduction. Nairobi: Paulines Publications
Africa, 10-45.
Kuo, Y. F., Wu, C. M., & Deng, W. J. (2009). The relationships among service quality, perceived value, customer
satisfaction, and post-purchase intention in mobile valueadded services. Computers in human behavior,
25(4), 887-896.
Lambert, D. M. (2009). Customer relationship management as a business process. Journal of Business & Industrial
Marketing, 25(1), 4-17.
Lai, F., Griffin, M., & Babin, B. J. (2009). How quality, value, image, and satisfaction create loyalty at a Chinese
telecom. Journal of Business Research, 62(10), 980-986.
Larivière, B., & Van den Poel, D. (2005). Predicting customer retention and profitability by using random forests
and regression forests techniques. Expert Systems with Applications, 29(2), 472-484.
Lee, Y. K., Lee, C. K., Lee, S. K., & Babin, B. J. (2008). Festivalscapes and patrons' emotions, satisfaction, and
loyalty. Journal of Business Research,61(1), 56-64.

1671
Lewis, M. (2004). The influence of loyalty programs and short-term promotions on customer retention. Journal
of Marketing Research, 41(3), 281-292.
Lichtenstein, D. R., Drumwright, M. E., & Braig, B. M. (2004). The effect of corporate social responsibility on
customer donations to corporate-supported nonprofits. Journal of marketing, 68(4), 16-32.
Malthouse, E. C., Friege, C., Gensler, S., Lobschat, L., Rangaswamy, A., & Skiera, B. (2010).
The impact of new media on customer relationships. Journal of service research, 13(3), 311-330.
Meyer-Waarden, L. (2007). The effects of loyalty programs on customer lifetime duration and share of wallet.
Journal of Retailing, 83(2), 223-236.
Mugenda, A. G. (2008). Social science research: Theory and principles.Nairobi: Applied.
Mugenda, O. M. Mugenda. AG (2003). Research Methods, Qualitative and Quantitative Approaches.
Neuman, W. L., & Robson, K. (2004). Basics of social research. Pearson.
Parasuraman, R., & Matthews, G. (2008). Vigilance requires hard mental work and is stressful. Human Factors:
The Journal of the Human Factors and Ergonomics Society, 50(3), 433-441.
Pauwels, K., Silva-Risso, J., Srinivasan, S., & Hanssens, D. M. (2004). New products, sales promotions, and firm
value: The case of the automobile industry. Journal of marketing, 68(4), 142-156.
Reinartz, W., Thomas, J. S., & Kumar, V. (2005). Balancing acquisition and retention resources to maximize
customer profitability. Journal of Marketing,69(1), 63-79.
Rust, R. T., Lemon, K. N., & Zeithaml, V. A. (2004). Return on marketing: Using customer equity to focus marketing
strategy. Journal of marketing, 68(1), 109-127.
Seo, D., Ranganathan, C., & Babad, Y. (2008). Two-level model of customer retention in the US mobile
telecommunications service market.Telecommunications Policy, 32(3), 182-196.
Sharma, N. (2003). The role of pure and quasi-moderators in services: an empirical investigation of ongoing
customer–service-provider relationships.Journal of Retailing and Consumer Services, 10(4), 253-262.
Sharma, S., Kaufman, P., & Raman, P. (2005). The role of relational information processes and technology use in
customer relationship management. Journal of marketing, 69(4), 177192.
Sharma, A., & Mehrotra, A. (2007). Choosing an optimal channel mix in multichannel environments. Industrial
Marketing Management, 36(1), 21-28.
Thomas, J. S. (2001). A methodology for linking customer acquisition to customer retention. Journal of Marketing
Research, 38(2), 262-268.
1672
Van Heerde, H. J., Gupta, S., & Wittink, D. R. (2003). Is 75% of the sales promotion bump due to brand switching?
No, only 33% is. Journal of Marketing Research, 40(4), 481-491.
Verhoef, P. C. (2003). Understanding the effect of customer relationship management efforts on customer
retention and customer share development.Journal of marketing, 67(4), 30-45.
Winer, R. S. (2001). A framework for customer relationship management.California management review, 43(4),
89-105.
Venetis, K. A., & Ghauri, P. N. (2004). Service quality and customer retention: building longterm relationships.
European Journal of marketing, 38(11/12), 1577-1598.
Zeithaml, V. A., Bitner, M. J., & Gremler, D. D. (2006). Services marketing: Integrating customer focus across the
firm.