determinants of customer retention in … of customer retention in hotel ... peshawar pakistan....
TRANSCRIPT

Journal of Applied Economics and Business
42 JOURNAL OF APPLIED ECONOMICS AND BUSINESS, VOL.1, ISSUE 3 – OCTOBER, 2013, PP. 42-64
DETERMINANTS OF CUSTOMER
RETENTION IN HOTEL INDUSTRY
Shahzad Khan*
City University of Science and Information Technology, Peshawar, Pakistan
Abstract
The customer retention is very important for the hotel to maintain the old customer and attract the new customer. This
is very difficult job for the hotels and for each company to retain the old customer and for that reason the hotel offers
different package for their customers to retain. The main aim of the research is to find out which factor play important
role in the customers retention. Research conducted in order to find out which hotels are better in comparing Grand
hotel and Park Inn hotel. In this line, study has applied both qualitative and quantitative techniques. The primary data
were collected through questionnaire, which was distributed among the customers of these hotels. Furthermore, the
secondary data were collected from different journal articles, textbooks, magazines etc. The sample size was 140, out of
which 70 were filled up by customers of the Grand hotel, and 70 were filled up from the customers of the Park Inn
hotel. The main intention of this research was to investigate that which hotel customers are more retained by
respective hotels.
Keywords
Hotels; Retention; Customers; Security; Peshawar Pakistan.
Introduction
Hotel industry is much more dynamic and we may see day by day change in hotel industry.
Mostly hotels in Pakistan are targeting their consumers through quality services and by offering
different packages regarding per buffet charges and other services as well. Mostly hotels in
Peshawar are targeting their customer by different packages and services offering.
We also know that major contribution in GDP is from services side and round about 70% is added
by services side each year in our gross domestic product of Pakistan. There for due to high growth
in services sector mostly hotel sector in Pakistan trying to retain their customer by offering
different packages. Service sector Industries includes education, retailing, tourism hospitality and

Journal of Applied Economics and Business
43
medical services. According to Clow (1998) they find out in their study that despite the efforts of
services industry to attract and manage the supply and demand of the consumer still consumer are
not loyal for this hospitality sector needs to develop high level strategies and offering as well as
with these efforts organization who providing services in this sector needs to change the taste and
also change their routine offering for the sake to retain the customer to achieve their goals in most
effective way.
Martin (2001) find out and show that relational ship marketing how build long lasting relation
with consumer and in this manner organization can achieve their ultimate goal which they have to
operate this business. Zeithaml (2006) find out that organization how aware the term of customer
retention they do hard efforts for it and adopt different mechanism to cut their cost and remain the
consumer as loyal to the business organization.
We have noted that in hospitality industry in Khyber Puktoon khwa facing a down fall due to lack
of innovation and mostly this sector offering is based on old is gold policy that’s the main reason of
failure in service sector in KPK, according to (Boshoff and Staude, 2003) they explain that hotel
businesses need to reshape their strategies to going back the customer to the state of satisfaction.
According to Griffin the hotel business organization should need to implement a ‘win-back’
strategy to return their valuable customer which they have lost due to poorer services business
organization needs to think ahead regarding their services recovery and by this they can achieved
better market share and high portion of profit.
The questionnaires is about at the looking of which sort of activities have been adopted by the
hotel management between these two hotels grand hotel and park inn hotel that what types of
strategy they are adopted on the services quality. The present study is regarding hotel park view
and grand regarding the importance of retention the consumer and building long lasting
relationship with the consumer.
Objective
The main objective of the research is to find out that which facilities are there in the hotel which are
most like by the customer and is to stay there. Research has compared two hotel one is grand hotel
and the other one is park inn hotel and both are located in the Peshawar city.
Literature Review
Customer retention
Customer retention- defines many researchers that the customer retention are too much important
for the customer and they explain that to attract the customer and then retain that customer are too
much important for the customers. Gets and Thomas (2001) state that a customer retention occurs

Shahzad Khan
Determinants of Customer Retention in Hotel Industry
44 JOURNAL OF APPLIED ECONOMICS AND BUSINESS, VOL.1, ISSUE 3 – OCTOBER, 2013, PP. 42-64
when customer purchase a product or services in again and again this phenomenon is called
customer retention over an extended period of the time. For product or services for short purchase
time the customer purchase the product or services over a specified time period.
For product or services with long purchase time the customer purchase the product or services
over a next occasions or the regular basis this is basically called the customer retention this two
situation is called the customer retention according to the Get and Thomas. In this line, Pyne (2000)
states that the customer retention explain the percentage rate at the start of the time period and the
customer who still remain customer in the end of the time period.
The concept of customer retention
Jobber (2001) states that for many years in hospitality marketing activities of the organization as
much as possible to get as many new customers goal. Mature and intense competition in the hotel
industry, it fails to win a lot of marketing. The hotel away from customer gaining and customer
retention and loyalty by moving their marketing strategy.
According to Richards (1996) intense competition in the hotel industry, hoteliers customer
acquisition to customer retention and simultaneously shift their strategy, information technology,
increase customer retention and loyalty continue to make inroads in 's. Industry standard loyalty
program, winning and maintaining customer loyalty is an important source for hotels (Kotler and
Armstrong, 2006). The hospitality industry, the high quality of service can add value to the image
and amicably as well as photographs, customer retention and loyalty will lead the have.
Factors influencing customer retention
According to Bolton (2000) the customers are important, but keeping and customer satisfaction is
more important. What is changing or maintaining the consumer is expected to maintain that if
companies want to improve your product or service. A consistently high customer loyalty through
the provision of services is achieved.
According to Reichheld (1996) 5% increase in customer loyalty can produce 25-80% rise in profits
advised. He added that the profit derived from a single customer during the business relationship
that grows argued. 60% of new customers to increase sales in the form of customer loyalty,
customer recommendations could be attributed. Furthermore, the same author notes that a 5%
increase in customer retention produces 75% of the current value argument. He said most
businesses that says loyal customer willing to pay premium prices. The benefits of long-term loyal
customer supplier relationships in a hospitality firm might therefore cleared headed.
According to Prabhu (2003) the customer retention customer satisfaction and quality services are
the pre-requisites and significant impact on purchase intentions says. Maintained or be loyal to a
customer and hotel patronage factors include: satisfaction, quality service, brand image, service
performance, customer identification, positive experiences, flexibility and technology.

Journal of Applied Economics and Business
45
According to Gronroos (1994) a complaint must focus on retaining customers is one of the best tips
says. A mind that customer complaints and customer testimonials to discover more about the
product helps keep right and that should always be considered. The same author, (1990) notes that
the event marketing customers to maintain an expensive option, but it says it works. Event,
seminars, discussion groups and can be by conference. Customers also active on these events can
be invited to participate. Business activities to create a good reputation and people tend to trust
well-known organization. Customer Service with a smile is respected and feels comfortable and
can control any untoward situation helps.
According to Bolton (2000) customer loyalty programs to their customers as loyal are going to help
the organization to maintain. Some points to reach a common loyalty program or participating
hotel to spend a specific amount of customers who reward points, discounts and customer
subscription includes. Hoteliers use technology related loyalty programs. To help foster loyalty,
hotel reservations and other information to access a WAP-enabled device that provides a regular
guest. Internet use by hoteliers to develop loyalty online personal web site, e-mail coupons and e-
mail marketing allows you to create.
Richards (1996) has served the hospitality industry that can add value high quality and amicably
so will lead to customer retention and loyalty that is one of the main factors within the control
recognizes the United States, good picture quality as well as service from their competitors
differentiate themselves and retain loyal customers and loyal to their ability to achieve key
hoteliers.
According to Gronroos (1994) the firm's customer loyalty dominant factor in the success of a
business organization is recognized as the states. The hotel's photo and interior, reception, food
and beverage, and price performance with positive customer satisfaction and customer loyalty are
indicative of the fact correlated. Corporate image and service quality, which in turn affect customer
loyalty; customer satisfaction is influenced by equally customer retention
Therefore customer retention in an organization and its customers by maintaining, customer
loyalty is tested. Customer retention increases profits for the success of the hospitality industry is
very tough. Business Retention hotel or group of customers depends on the image. Hotel
customers to maintain or gain loyal customers need to present a positive business image. The
quality of services, identify customer needs, and to provide users with the products and services
required in the use of technology.
Picture this business than pleasant, attractive and is concentrating on knowledge. This creates the
impression that creating and maintaining a professional image to help, word of mouth and
reputation makes is good. It is such a huge impact on customer satisfaction and thus affects

Shahzad Khan
Determinants of Customer Retention in Hotel Industry
46 JOURNAL OF APPLIED ECONOMICS AND BUSINESS, VOL.1, ISSUE 3 – OCTOBER, 2013, PP. 42-64
customer retention. Factor, Providing the products and services the flexibility that customers feel
recognized and respected; offer quality services and thereby using loyalty programs by trained
personnel who remember the name of the guest For example, the identity of the client should not
point to maintain clients in hotels, discount and customer membership card. This increase in
customer retention in hotels that are part of a business image.
According to Winer (2001) implication of client-based image management, that highlights the most
important part. Customer focus to customer service firms' management to make sense of primary
responsibility, but the customers to gain market awareness is very hard to recognize not only that.
Consumer behaviour, and best employee benefits such as higher quality goods and services,
assured the belief that a business with a favourable brand image to repurchase and
recommendation are. loyal customers and the "can become potential customers in the future for
people who photographs hotel business. According to Keller (2006) a global hospitality industry
changed from a traditional and local industry, as technology becomes more important to
consumers and businesses better picture. Hotel Internet users to leverage
According to Patterson (1999) the organization of facial identity and sense of belonging helps
remind shows. As a result, a sense of belonging and develop close customer relationships hotel
loyalty leads to better business and a better image. Upon application and flexibility such as non-
smoking rooms, simple customer friendly services from the Check in and checkout times, more
customer loyalty play a more important role. Through the provision of high quality, or service to a
business is a huge impact
Gronroos (1991 and 1994) state that services are intangible activities or services of activities that are
more or less intangible in nature normally, take place between customer and services and services
provider, which are provided the customer problem solution. On the other side, Zeithaml and
Bitner (1996) state that services is an activity that are happening between the customer and services
provider .other factor which play an important role in the services activities that are physical
resources and the environment.
After the above definitions about service, the author can easily evaluate the importance of service
in a way to check the performance of an organization ddepartment through the interaction
between service providers and its stakeholders. A well brand oriented hotel as we are going to see
through the literature needs to take into consideration issues such as customization, experiences
provision and emotional bonds with its guests in its function and that is the reason why we chose
to study the issue of brand as a way for a mid-scale hotel to achieve emotionally bonded guests.
A strong brand can give the hotel truly loyal guests and as we are going to see in a separate
chapter, brand is according to Chernatony (1997), a guarantee for consistent service quality and
risk reducer, it is the value that the traveler receives, and it is an identity that distinguishes the
hotel from the others. Moreover, the brand according to Kapferer (2004) is based on a relationship

Journal of Applied Economics and Business
47
between the hotel and the guest. It seems worthy therefore for a mid-scale hotel to focus on
building a strong brand. We are going to see through our study how the brand comes to provide
customization, experiences and treat the guests consistently and in the way, each of them wants to
be treated. This as we are going to see results in a repeated delight felt by the guests who become
emotionally bonded and loyal to the hotel brand. Furthermore, we are going to see that the brand
comes to help the hotel build a positive image which can be a good defense against the fierce
competition created by the well-known hotel brands.
According to Trott (2001) a well brand oriented hotel, as we are going to see through the literature,
needs to take into consideration issues such as customization, experiences provision and emotional
bonds with its guests in its function and that is the reason why we chose to study the issue of
brand as a way for a mid-scale hotel to achieve emotionally bonded guests. A strong brand can
give the hotel truly loyal guests and as we are going to see in a separate chapter, brand is according
to Chernatony (1997) a guarantee for consistent service quality and risk reducer, it is the value that
the traveler receives, and it is an identity that distinguishes the hotel from the others.
Moreover, the brand according to Kepfehrer (2004) is based on a relationship between the hotel
and the guest. It seems worthy therefore for a mid-scale hotel to focus on building a strong brand.
We are going to see through our study how the brand comes to provide customization, experiences
and treat the guests consistently and in the way, each of them wants to be treated. This as we are
going to see results in a repeated delight felt by the guests who become emotionally bonded and
loyal to the hotel brand. Furthermore, we are going to see that the brand comes to help the hotel
build a positive image, which can be a good defence against the fierce competition created by the
well-known hotel brands.
The control of business image and to be able to manage it properly implies strong assumption that
hoteliers require and must keep a top propriety in order for them to retain loyal customers. The
possibly increase of the size of the customers gives the fact that the business must have to secure
and update its business image to loyal customers and to people who can be in a way become
potential customers in the hotels. Customer retention is therefore sustaining the customers in an
organization and through this, customer loyalty is experienced. Customer retention is paramount
for the success of the hospitality industry on increased profitability.
The retention of customers depends on the business image of the hotel or organization. The hotels
need to portray a positive business image in order to retain customers or to have loyal customers.
This entails provision of quality services, recognition of customer needs, and utilization of
technology in providing the products and services to the customers (Boubakri et al, 2013).
In addition to that, business image is also concentrating on being pleasant, attractive and

Shahzad Khan
Determinants of Customer Retention in Hotel Industry
48 JOURNAL OF APPLIED ECONOMICS AND BUSINESS, VOL.1, ISSUE 3 – OCTOBER, 2013, PP. 42-64
knowledgeable. This will help to create and maintain the kind of business image that creates first
impression, gets good word-of- mouth and builds credibility. This thus has a great impact on
customer satisfaction and thus influences customer retention. Customer retention in hotels is a
major factor to be considered because lack of customers in the hotels will lead to lower sales thus
closing up of the establishment. Retaining loyal customers for hoteliers is essential and a core
factor in keeping the hospitality (hotels) in shape and competitive enough to level up the changing
trends that has impacted such business and economic activities of the hotel markets.
Therefore, to retain customers in the hotels there should be customer recognition for example
recalling the guest name; this makes the customers feel recognized and respected; flexibility of the
products provided and services; trained personnel who will offer standardized services and by
using loyalty programmers like: points, discounts and customer membership cards. All this are
aspects of a business image that enhances customer retention in the hotels.
What is quality? Different definitions of different aspects. Holbrook (1994) suggests that ‘issues
regarding the meaning of “quality” appear to pose formidable barriers to clear thinking’. Zeithaml
(1998) calls it ‘superiority’, Juran (1988) refers to quality as ‘fitness for the purpos’ and Bagram &
Khan (2012) defined it as ‘conformance to requirements, not Elegance’.
What all of these definitions have in common is an acknowledgement that the quality of a product
in some way rates it against a standard, whether it be real or implied. This standard may be
defined by the customer, either explicitly or implicitly, or set by other similar products with which
it is compared (Fan et al, 2013).
It can be defined as “the process by which consumers interpret price and attribute value to a good
or service”. It has interested researchers for several years. It is a well known fact that price and
quality are two important factors of value (Boubakri et al, 2013). They both lead to customer
satisfaction and customer retention, which help increase the profits of any business. Therefore, for
a manager of quick service restaurant it is important to know customers perception of price and
value.
Previous studies examining the impact of price on perceived value have suggested a negative link:
the higher the price, the lower the product value is perceived (Dodds et al, 1991). This is a general
phenomenon that when customers go out for shopping they tend to buy products, which have
lower, prices so they get better value. This is supported by Huit (2000) can be defined as “the
process by which consumers interpret price and attribute value to a good or service”. It has
interested researchers for several years. It is a well-known fact that price and quality are two
important factors of value. They both lead to customer satisfaction and customer retention, which
help increase the profits of any business. Therefore, for a manager of quick service restaurant it is
important to know customers perception of price and value.

Journal of Applied Economics and Business
49
Previous studies examining the impact of price on perceived value have suggested a negative link:
the higher the price, the lower the product value is perceived (Grewal, 1998). This is a general
phenomenon that when customers go out for shopping they tend to buy products, which have
lower prices so they get better value. This is supported by (Hutton, 1995) claiming that now more
consumers are trying to maximize value for money spent, demanding better quality at lower
prices. Although this may not be entirely true for all the customers because some customers are
willing to pay more if they really like a product. Higher perceived value results in a greater
willingness by the consumer to adopt a new product (Sternquist, 1998).
Customers who are willing to pay higher prices for a product or service tend to be brand-
conscious and prestige sensitive. They also believe price is an indicator of quality or prestige
(Sproles and Kendall, 1986) once customers are convinced that they are getting the best quality
product or service, they will tend to develop loyalty to it in the long run.
A research conducted by Suhartanto (2003) on hospitality industry found a positive relationship
between price and customer loyalty. After studying the literature review, the following hypothesis
is developed. Ton (1995) claiming that now more consumers are trying to maximize value for
money spent, demanding better quality at lower prices. Although this may not be entirely true for
all the customers because some customers are willing to pay more if they really like a product.
Higher perceived value results in a greater willingness by the consumer to adopt a new product
(McGowan and Sternquist, 1998).
Customers who are willing to pay higher prices for a product or service tend to be brand-
conscious and prestige sensitive (Khan and Hussain, 2013). They also believe price is an indicator
of quality or prestige (Sproles and Kendall, 1986).
Once customers are convinced that they are getting the best quality product or service, they will
tend to develop loyalty to it in the long run. Research conducted by Kandampully and Suhartanto
(2003) on hospitality industry found a positive relationship between price and customer loyalty.
Methodology
This chapter includes the research design, research model, tested variable (dependent and
independent) hypothesis, population, sample size, questionnaire reliability; data gathering
procedure, statistical analysis method and the response rate all these things are discussed in this
chapter. The research is based on qualitative and quantitative methods. The primary data are
collected from customers of two hotels: the Park Inn hotel and the Grand hotel. The questionnaires
were with easy design and were distributed among male and female customers present at that time
in the hotels. The secondary data were collected from the journal articles, books and conference
meetings used in the literature review.
Shahzad Khan
Determinants of Customer Retention in Hotel Industry
50 JOURNAL OF APPLIED ECONOMICS AND BUSINESS, VOL.1, ISSUE 3 – OCTOBER, 2013, PP. 42-64
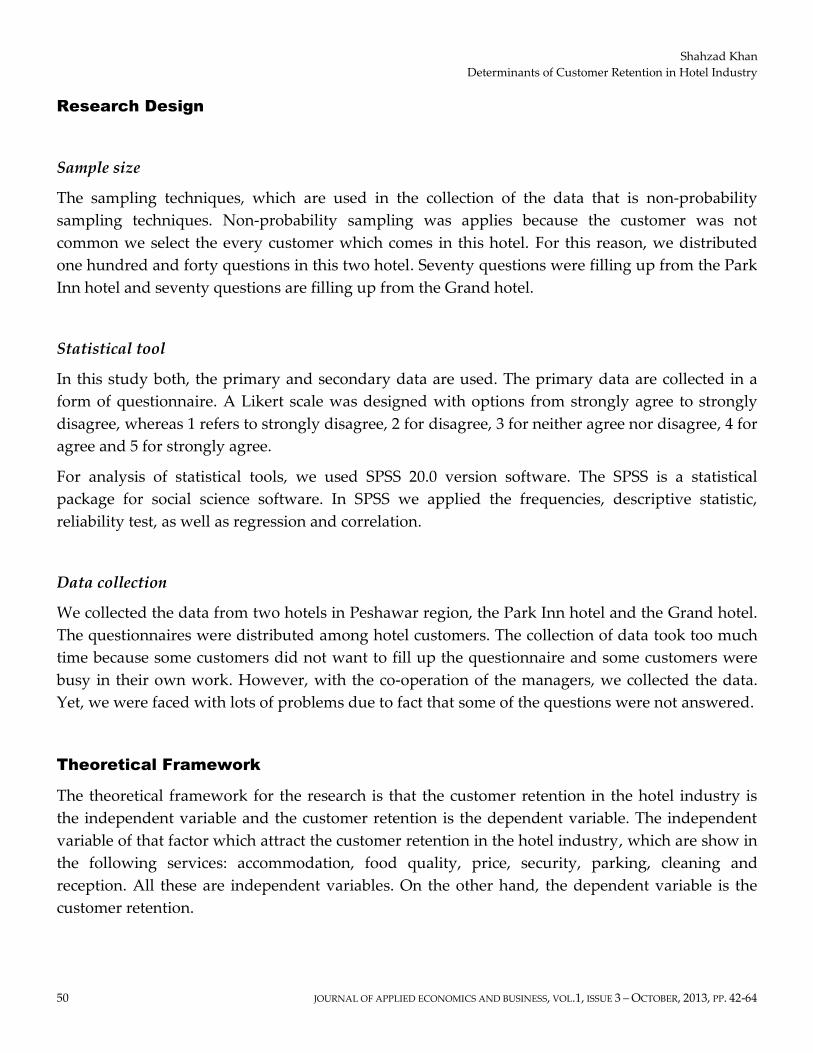
Research Design
Sample size
The sampling techniques, which are used in the collection of the data that is non-probability
sampling techniques. Non-probability sampling was applies because the customer was not
common we select the every customer which comes in this hotel. For this reason, we distributed
one hundred and forty questions in this two hotel. Seventy questions were filling up from the Park
Inn hotel and seventy questions are filling up from the Grand hotel.
Statistical tool
In this study both, the primary and secondary data are used. The primary data are collected in a
form of questionnaire. A Likert scale was designed with options from strongly agree to strongly
disagree, whereas 1 refers to strongly disagree, 2 for disagree, 3 for neither agree nor disagree, 4 for
agree and 5 for strongly agree.
For analysis of statistical tools, we used SPSS 20.0 version software. The SPSS is a statistical
package for social science software. In SPSS we applied the frequencies, descriptive statistic,
reliability test, as well as regression and correlation.
Data collection
We collected the data from two hotels in Peshawar region, the Park Inn hotel and the Grand hotel.
The questionnaires were distributed among hotel customers. The collection of data took too much
time because some customers did not want to fill up the questionnaire and some customers were
busy in their own work. However, with the co-operation of the managers, we collected the data.
Yet, we were faced with lots of problems due to fact that some of the questions were not answered.
Theoretical Framework
The theoretical framework for the research is that the customer retention in the hotel industry is
the independent variable and the customer retention is the dependent variable. The independent
variable of that factor which attract the customer retention in the hotel industry, which are show in
the following services: accommodation, food quality, price, security, parking, cleaning and
reception. All these are independent variables. On the other hand, the dependent variable is the
customer retention.

Journal of Applied Economics and Business
51
Independent Dependent
Factor of customer retention Factor of customer retention
FIG. 1 CUSTOMER RETENTION MODEL
Price
Accommodation
Security
Parking
Cleaning
Staff
Reception
Brand image
Food quality
Services
Customer retention
Factor influence
customer
Customer
retention

Shahzad Khan
Determinants of Customer Retention in Hotel Industry
52 JOURNAL OF APPLIED ECONOMICS AND BUSINESS, VOL.1, ISSUE 3 – OCTOBER, 2013, PP. 42-64
Statistical Results and interpretation of Grand hotel
TABLE 1. MODEL SUMMARY
Model R R2 Adjusted R2 Std. Error and Estimate
1 .755a .586 .544 .430
a Predictors (Constant): Parking, Staff, Security, Services, Price, Brand image, Reception, Accommodation, Cleaning, Food quality
The R value is .755 which means that the independent variables are 75.5% correlated with
dependent variable. The R2 value is .586 this mean that independent variables will explain 58.6%
the dependent variable. The adjusted R2 value is .544.
TABLE 2. ANOVA
Model Sum of Squares df Mean Square F Sig.
1
Regression 12.061 6 5.010 14.589 .000b
Residual 10.858 68 .160
Total 22.918 74 b Predictors (Constant): Parking, Staff, Security, Services, Price, Brand image, Reception, Accommodation, Cleaning,
Food quality
The f-value is 14.589 which are greater than mean value 5.010 and the p-value is 0.000 which shows
the statistical model is 99%.
TABLE 3. COEFFICIENTS
Model Unstandardized Coefficients Standardized Coefficients t Sig.
B Std. Error Beta
1 (Constant) .878 .301 3.247 .002
Services .545 .055 .411 3.890 .000
Staff .331 .059 .204 1.371 .185
Reception .088 .057 .137 1.189 .309
Brand image .088 .057 .056 1.012 .405
Food quality .198 .051 .302 2.911 .009
Cleanings .220 .054 .229 2.597 .012
parking .017 .031 .363 2.833 .008
Accommodation .024 .039 .366 2.170 .040
price .335 .044 .388 3.756 .000
security .208 .042 .334 2.117 .078
The independent variable services beta value is. 411, meaning that the independent variable
services explains 41.1% of dependent variable customer retention. The p-value is .000, which shows
significant association of services with the customer retention. The independent variable staff beta
value is .204, meaning that the independent variable staff explains 20.4% of dependent variable
customer retention. The p-value is .185, which shows insignificant association of staff with the

Journal of Applied Economics and Business
53
customer retention. The independent variable reception beta value is .137, meaning that the
independent variable ambulance explains 13.7% of the dependent variable. The p-value is .309
which shows insignificant association of reception with the customer retention. The independent
variable brand image beta value is .056 this mean that the independent variable brand image
explain 5.6% of the dependent variable customer retention. The p-value is .405 which shows
insignificant association of brand image with the customer retention. The independent variable
food quality beta value is .302 this mean that the independent variable food quality explain 30.2%
of the dependent variable customer retention. The p-value is .009, which shows significant
association of food quality with the customer retention. The independent variable cleaning beta
value is .012, thus meaning that the independent variable cleaning explains 1.2% of the dependent
variable customer retention. The p-value is .012, which shows significant association of restaurants
with customer retention.
The independent variable parking and the beta value is. .363 This mean that the independent
variable accident and emergency, explain 36.3% of dependent variable customer retention. The p-
value is .008, which shows significant association of parking with customer retention. The
independent variable reception accommodation, the beta value is .366 meaning that the
independent variable accommodation explains 36.6% of dependent variable customer retention.
The p-value is .040, which shows insignificant association of accommodation with customer
retention. The independent variable price and the beta value is .388, meaning that the independent
variable price explains 38.8% of dependent variable customer retention. The p-value is .000, which
shows insignificant association of price with the customer retention. The independent variable
security beta value is .336, meaning that the independent variable security explains 33.6% of the
dependent variable customer retention. The p-value is .078, which shows insignificant association
of security with customer retention.
Statistical Results and interpretation of Park Inn hotel
TABLE 4. MODEL SUMMARY
Model R R2 Adjusted R2 Std. Error and Estimate
1 .805a .646 .544 .430
aPredictors (Constant): Parking, Staff, Security, Services, Price, Brand image, Reception, Accommodation, Cleaning,
Food quality
The R value is .805 which means that the independent variables are 80.5% correlated with
dependent variable. The R2 value is .646 this mean that independent variables will explain 64.6%
the dependent variable. The adjusted R2 value is .544.

Shahzad Khan
Determinants of Customer Retention in Hotel Industry
54 JOURNAL OF APPLIED ECONOMICS AND BUSINESS, VOL.1, ISSUE 3 – OCTOBER, 2013, PP. 42-64
TABLE 5. ANOVAa
Model Sum of Squares df Mean Square F Sig.
1
Regression 12.061 6 8.010 14.589 .000b
Residual 10.858 68 .160
Total 22.918 74 bPredictors (Constant): Parking, Staff, Security, Services, Price, Brand image, Reception, Accommodation, Cleaning,
Food quality
The f-value is 14.589 which is greater than the mean value 8.010 and the p-value is 0.000 showing
that the statistical model is 99%.
TABLE 6. COEFFICIENTS
Model Unstandardized
Coefficients
Standardized
Coefficients
t Sig.
B Std. Error Beta
1 (Constant) .878 .301 3.247 .002
Services .545 .055 .331 3.890 .000
Staff .331 .059 .234 1.371 .155
Reception .088 .057 .307 1.189 .249
Brand image .088 .057 .126 1.012 .205
Food quality .198 .051 .402 2.911 .002
Cleanings .220 .054 .359 2.597 .122
Parking .017 .031 .253 2.833 .004
Accommodation .024 .039 .366 2.170 .040
Price .335 .044 .388 3.756 .000
Security .208 .042 .334 2.117 .078
The independent variable services beta value is. 331 this means that the independent variable
services explains 33.1% of the dependent variable customer retention. The p-value is .000, which
shows significant association of services with the customer retention. The independent variable
staff beta value is .234 this means that the independent variable staff explains 23.4% of the
dependent variable customer retention. The p-value is .155, which shows insignificant association
of staff with the customer retention. The independent variable reception beta value is .307 this
means that the independent variable staff explain 30.7% of the dependent variable customer
retention. The p-value is .249, which shows insignificant association of reception with the customer
retention. The independent variable brand image beta value is .126 this means that the
independent variable brand image explain 12.6% of the dependent variable customer retention.
The p-value is .205, which shows insignificant association of brand image with the customer
retention. The independent variable food quality beta value is .402 this means that the independent
variable food quality explains 40.2% of the dependent variable customer retention. The p-value
is .002, which shows significant association of food quality with the customer retention. The

Journal of Applied Economics and Business
55
independent variable cleaning beta value is .352 this means that the independent variable cleaning
explains 35.2% of the dependent variable customer retention. The p-value is .122, which shows
significant association of restaurants with the customer retention.
The independent variable parking and the beta value is. .253 This mean that the independent
variable accident and emergency explain 25.3% of the dependent variable customer retention. The
p-value is .004, which shows significant association of parking with the customer retention. The
independent variable reception accommodation beta value is .366 this means that the independent
variable accommodation explains 36.6% of the dependent variable customer retention. The p-value
is .040, which shows insignificant association of accommodation with the customer retention. The
independent variable price and the beta value is .388 this means that the independent variable
price explains 38.8% of the dependent variable customer retention. The p-value is .000, which
shows insignificant association of price with the customer retention. The independent variable
security beta value is .336 this means that the independent variable security explains 33.6%of the
dependent variable customer retention. The p-value is .078which shows insignificant association of
security with the customer retention.
Demographic characteristics
The demographic characteristic used in this research is the age, gender, and the education. The
gender contains both the male and the female. The age contains four groups, such as one (1)
stands for the 20-30, two (2) stands for 30-40, three (3) stands for 40-50 and four 4) stands for 50-
60. The education contains ten, such as 1 for MBA, 2 for BA, 3 for Doctor, 4 for Engineer and so on.
TABLE 7. FREQUENCY TABLE FOR THE GENDER OF THE GRAND HOTEL
Frequency Percent Valid Percent Cumulative Percent
Valid
Female 33 45.8 47.1 47.1
Male 37 51.4 52.9 100.0
Total 70 97.2 100.0
Missing System 2 2.8
Total 72 100.0
TABLE 8. FREQUENCY TABLE FOR THE PARK INN HOTEL
Frequency Percent Valid Percent Cumulative Percent
Valid
Female 29 41.4 41.4 41.4
Male 41 58.6 58.6 100.0
Total 70 100.0 100.0
Table 7 shows that the response rate of the questionnaire which was distributed among the
customer of the hotel. Therefore, this table shows that the respond rate is hundred percent and
there is not only a single missing value. The male response rate is 52.9% and the female response

Shahzad Khan
Determinants of Customer Retention in Hotel Industry
56 JOURNAL OF APPLIED ECONOMICS AND BUSINESS, VOL.1, ISSUE 3 – OCTOBER, 2013, PP. 42-64
rate is 47.1%.
Table 8 show that the response rate of the questionnaire which I have distributed among the
customer of the hotel this table show that the respond rate is hundred percent there is not only a
single missing value. The male response rate is 58.6 and the female response rate is 41.4%.
Table 9 shows that the age range is between 20 to 60, but the most customers of the age is 20 to 30
and their percentage rate is 50%.
TABLE 9. FREQUENCY TABLE FOR AGE OF PARK INN HOTEL
Frequency Percent Valid Percent Cumulative Percent
Valid
20-30 35 50.0 50.0 50.0
31-40 19 27.1 27.1 77.1
41-50 13 18.6 18.6 95.7
51-60 3 4.3 4.3 100.0
Total 70 100.0 100.0
Table 10 shows that the age range is between 20 to 60 and the most customers of the Grand hotel
are at the age between 20 to 30 and their percentage rate is 40%.
TABLE 10. FREQUENCY TABLE FOR AGE OF GRAND HOTEL
Frequency Percent Valid Percent Cumulative Percent
Valid
20-30 24 33.3 34.3 34.3
31-40 31 43.1 44.3 78.6
41-50 14 19.4 20.0 98.6
51-60 1 1.4 1.4 100.0
Total 70 97.2 100.0
Missing System 2 2.8
Total 72 100.0
Results
Testing Hypothesis 1
Hypothesis 1 proposed that there are significant differences in services offered by Hotel Grand and
Park Inn hotel. In order to evaluate the differences independent sample t-test was conducted. The
results of the test are summarized in Table 11.
The results presented in Table 12 show that there are significant differences in services offered by
Park Inn Hotel (M = 3.21, SD = .83) and Hotel Grand (M = 3.59, SD = .84); t (138) = -2.71, p = 0.007.
Further analysis of the means show that since higher the services score better the perception of
services. In this line, the results shows that services offered by Hotel Grand are better than Park Inn
Hotel.

Journal of Applied Economics and Business
57
TABLE 11. GROUP STATISTICS
Hotel N Mean Std. Deviation
Services Park Inn 70 3.2107 .83908
Grand 70 3.5964 .84086
TABLE 12. INDEPENDENT SAMPLE TEST
Levine’s Test for Equality of Variances
t-test for Equality of Means
F Sig T df Sig (2-tailed)
Services Equal variances assumed .043 .836 -2.717 138 .007
Equal variances not assumed -2.717 137.999 .007
Testing Hypothesis 2
Hypothesis proposed that there are insignificant differences in security that are offered by the hotel
Park Inn and Grand Hotel. In order to evaluate the independent sample, the t-test was conducted.
The result is summarizing in Table 13.
TABLE 13. GROUP STATISTICS
Hotel N Mean Std. Deviation
Security Park Inn 70 2.5214 1.15293
Grand 70 3.2571 1.15075
TABLE 14. INDEPENDENT SAMPLE TEST
Levene's Test for Equality of
Variances
t-test for Equality of Means
F Sig. t df Sig. (2-tailed)
Security
Equal variances assumed .122 .727 -3.779 138 .000
Equal variances not
assumed
-3.779 138.000 .000
The results shows that there are insignificant difference in security in hotel the park Inn (M=2.52,
SD=1.15) and the hotel Grant (M=3.25, SD=1.15; t (138) = -3.779 p= .000.
Further analysis of the means show higher the security score better the perception of the security,
the result show that the security of the Grant hotel is better than the Park Inn hotel.
Testing Hypothesis 3
Hypothesis proposed that there are insignificant differences in price that are offered by the hotel
Park Inn and the hotel Grand. In order to evaluate independent sample, a t-test was conducted.
The results are summarized in Table 15.

Shahzad Khan
Determinants of Customer Retention in Hotel Industry
58 JOURNAL OF APPLIED ECONOMICS AND BUSINESS, VOL.1, ISSUE 3 – OCTOBER, 2013, PP. 42-64
The results presented in Table 16 show that there are insignificant differences in price in hotel Park
Inn (M=3.60, SD= .67) and the hotel Grand (M=3.40, SD=.82; further analysis of the means show that
higher the price score higher the perception of the price. The results shows that the price of the
Park INN hotel is better than the Grand hotel.
TABLE 15. GROUP STATISTICS
Hotel N Mean Std. Deviation
price Park Inn 70 13.6000 .67769
Grand 70 3.4048 .82804
TABLE 16. INDEPENDENT SAMPLES TEST
Levene's Test for Equality of
Variances
t-test for Equality of Means
F Sig. t df Sig. (2-tailed)
Price
Equal variances assumed .423 .516 79.719 138 .000
Equal variances not
assumed
79.719 132.807 .000
Testing Hypothesis 4
Hypothesis proposed that there are significant differences in the staff that are working in Park Inn
hotel and the hotel of the Grand. In order to evaluate independent sample t test was conducted to
find out the result. The results are summarized in Table 17.
The results in Table 18 show that there are significant difference in the staff that are working in
hotels Park Inn (M=3.17, SD=.86) and the hotel Grand (M=3.30, SD=.79). Further analysis of the
means show that that staff of the Grand hotel are better than the staff of the park inn hotel because
the means value of the Grand hotel is greater than the means value of the park Inn hotel.
TABLE 17. GROUP STATISTICS
Hotel N Mean Std. Deviation
Staff Park Inn 70 3.1714 .86240
Grand 70 3.3000 .79126
TABLE 18. INDEPENDENT SAMPLE TEST
Levene's Test for Equality of
Variances
t-test for Equality of Means
F Sig. t df Sig. (2-tailed)
Staff
Equal variances assumed .725 .396 -.919 138 .360
Equal variances not
assumed
-.919 136.989 .360

Journal of Applied Economics and Business
59
Testing Hypothesis 5
The hypothesis proposed that there are significant difference in the parking facilities that are in the
Park Inn hotel and the Hotel Grand. To find out the result independent sample t test was
conducted. The results are summarized in Table 19 and Table 20.
TABLE 19. GROUP STATISTICS
Hotel N Mean Std. Deviation
Parking Park Inn 70 3.4381 .94884
Grand 70 3.4333 .86691
TABLE 20. INDEPENDENT SAMPLES TEST
Levene's Test for Equality of
Variances
t-test for Equality of Means
F Sig. t df Sig. (2-tailed)
parking
Equal variances assumed 1.017 .315 .031 138 .975
Equal variances not
assumed
.031 136.890 .975
The results show that there are significant differences in the parking that are in the Park Inn
(M=3.4381, SD=.94) hotel and the Hotel Grand (M=3.4333, SD=.86). Further analysis of the means
show that there are a small difference in the parking facilities of these two hotels. Yet, the means
score of the Park Inn is greater than the hotel of the Grand. However, the park Inn hotels facilities
of the Park Inn is better their Grand hotel.
Testing Hypothesis 6
The hypothesis proposed that there are insignificant difference in the reception facilities of the
hotel Park Inn and the hotel of the Grand. To find out the means value we conducted independent
sample t test and get the result. Tables 21 and 22 summarize the results.
TABLE 21. GROUP STATISTICS
Hotel N Mean Std. Deviation
Reception Park Inn 70 2.8357 1.17868
Grand 70 3.3857 .90558
TABLE 22. INDEPENDENT SAMPLES TEST
Levene's Test for Equality of
Variances
t-test for Equality of Means
F Sig. t df Sig. (2-tailed)
Reception
Equal variances assumed 10.309 .002 -3.096 138 .002
Equal variances not
assumed
-3.096 129.411 .002

Shahzad Khan
Determinants of Customer Retention in Hotel Industry
60 JOURNAL OF APPLIED ECONOMICS AND BUSINESS, VOL.1, ISSUE 3 – OCTOBER, 2013, PP. 42-64
The result shows that there are insignificant difference in the reception services of the Park Inn
hotel and the Grand hotel. The Park Inn (M=2.83, SD=1.17 and the hotel Grand (M=3.38, SD=.90).
The means result show the means score of the Grand hotel is higher than the mean score of the
Park Inn hotel. Therefore, its show that the reception facilities of the Grand hotel are betters then
the reception facilities of the Park inn hotel.
Testing Hypothesis 7
The hypothesis proposed that there are significant difference in the food quality, which is offer by
the Park Inn hotel and the hotel grand. In order to evaluate the difference we conducted the
independent sample t test. The results are shown in Table 23 and 24.
TABLE 23. GROUP STATISTICS
Hotel N Mean Std. Deviation
Food quality Park Inn 70 2.8786 .66314
Grand 70 3.3643 .78676
TABLE 24. INDEPENDENT SAMPLES TEST
Levene's Test for Equality of
Variances
t-test for Equality of Means
F Sig. t df Sig. (2-tailed)
Food quality
Equal variances assumed 2.703 .102 -3.949 138 .000
Equal variances not
assumed
-3.949 134.155 .000
The result shows that there are significant difference in the food quality of the Park Inn hotel and
the hotel of the Grand. The means score of the Park Inn (M=2.87, SD=.66) and the means score of
the Grant hotel is (M=3.36, SD=.78)
The result show that the means score of the grand hotel is high as compare of the Park Inn hotel. So
its show that the food quality of the Grand hotel is better as compare to the Park Inn hotel.
Testing Hypothesis 8
The hypothesis proposed that there are significant difference in the accommodation facilities,
which offer by the Park Inn hotel and the hotel of the Grand. In order to evaluate the difference
independent sample t test was conducted. The results are summarized in Tables 25 and 26.
TABLE 25. GROUP STATISTICS
Hotel N Mean Std. Deviation
Accommodation Park Inn 70 2.8786 .84350
Grand 70 3.3107 .77837
The result show that there are significant difference in the accommodation facilities of the park Inn
(M=2.87.SD=.84) hotel and the hotel of the Grand (M=3.31, SD=.77). Further analysis of the means
show that accommodation score better the perception of the accommodation. As in Table 26, the

Journal of Applied Economics and Business
61
means score of the Grand hotel is higher than the mean score of the park Inn hotel its show that the
accommodation facilities of the Grand hotel is better than the Park Inn hotel.
TABLE 26. INDEPENDENT SAMPLES TEST
Levene's Test for Equality of
Variances
t-test for Equality of Means
F Sig. t df Sig. (2-tailed)
Accommodation
Equal variances
assumed 2.055 .154 -3.150 138 .002
Equal variances not
assumed
-3.150 137.118 .002
Testing Hypothesis 9
The hypothesis proposed that there are significant difference in the cleaning of the hotel of these
two which are the Grand hotel and the Park Inn hotel. To find out the differences we apply the
independent sample t test to find out the result. The result is summarized in Table 27.
TABLE 27. GROUP STATISTICS
Hotel N Mean Std. Deviation
Cleaning Park Inn 70 2.9643 1.01910
Grand 70 3.4929 1.00178
TABLE 28. INDEPENDENT SAMPLES TEST
Levene's Test for Equality of
Variances
t-test for Equality of Means
F Sig. t df Sig. (2-tailed)
Cleaning
Equal variances
assumed .207 .650 -3.095 138 .002
Equal variances not
assumed
-3.095 137.959 .002
The results in Table 28 show that there are significant differences in the cleaning of the Park Inn
hotel and the hotel of the Grand. The score of the mean of the park Inn hotel is (M=2.96, SD=1.01)
and on the other hand the means value of the Grand hotel is (M=3.49, SD=1.00).the result show that
the mean score of the Grand hotel is high as compare of the park Inn hotel so the cleaning of the
hotel are the Grand hotel are better as compare to the Park Inn hotel.
Testing Hypothesis 10
The hypothesis proposed that there are significant difference in the parking facilities of the Grand
hotel and the Park Inn hotel. In order to evaluate the difference independent sample t-test is

Shahzad Khan
Determinants of Customer Retention in Hotel Industry
62 JOURNAL OF APPLIED ECONOMICS AND BUSINESS, VOL.1, ISSUE 3 – OCTOBER, 2013, PP. 42-64
conducted. The results are summarized in the Tables 29 and 30. Namely, the result shows that
there are significant difference in the parking facilities, which are in the Grand hotel and the hotel
of the Park Inn hotel. When we apply independent sample t test and the means comes out it show
that the means score of the Park Inn is 3.4381 and the SD is .94 and the mean score of the Grand
hotel is 3.4333 and the SD is .86. The means score is almost the same it show that the facilities of the
hotel, which they are offered is almost the same.
TABLE 29. GROUP STATISTICS
Hotel N Mean Std. Deviation
Parking Park Inn 70 3.4381 .94884
Grand 70 3.4333 .86691
TABLE 30. INDEPENDENT SAMPLES TEST
Levene's Test for Equality of
Variances
t-test for Equality of Means
F Sig. t df Sig. (2-tailed)
Parking
Equal variances assumed 1.017 .315 .031 138 .975
Equal variances not
assumed
.031 136.890 .975
Summary of the results
The summary of the results is discussed in the following. We conducted a comparison between the
Park Inn and the Grand hotel. From the results, we may see that there are ten variables in the
research questionnaires which were distributed in these hotels. After a data acquisition in SPSS, it
is found that the overall results of the Grand hotel are far better than the Park Inn hotel due to fact
that the customers are much happier with provided services.
Limitation of the research
We may note the following limitations during the research: (1) Hotels are situated in the Peshawar
(Khyber pukhtoon khwa) Pakistan; and (2) The sample size is restricted only to 140 respondents.
Conclusion
It has been concluded from the study that hotel Grand customers retain on the basis of services
they offered. While in Park Inn hotel the retention factors is food quality. Now it depends upon
management of each hotels that how further they improve their factors of retention and how they
make them more valuable to their customers.
References
Bagram, M. M. and Khan, S. (2012) Attaining Customer Loyalty! The Role of Consumer Attitude
and Consumer Behavior. International Review of Management and Business Research. 1(1), 1-8.
Bolton. (2000). Customer retention. European Journal of Business and Management, 185-193.

Journal of Applied Economics and Business
63
Bolton. (2000). Services quality. European Journal of Business and Management, 185-193.
Boshoff and Staude. (2003). Need to reshape the hotel industry. African Journal of Marketing
Management, 032-042.
Boubakri, W., Zghidi, A. B. F. and Zaiem, I. (2013). The Effect of Export Stimuli on Export
Performance: The Case of the Tunisian Industrial Firms International Review of Management and
Business Research. 2(1). 155-167.
Chernatony. (1997). European Journal of Business and Management, 185-193.
Chernatony. (1997). Journal of Marketing, 210-218.
Clow, K. a. (1998). impect of the customer retention in hotel. African Journal of Marketing
Management , 032-042.
Fan, X., Chang, E ., Molin and Zhang,Y. (2013) The Influence of Negative Information from a Co-
brand: The Moderating Roles of Involvement and Brand Popularity. International Review of
Management and Business Research. 2(2). 302-312.
Grewal and Huit. (1998). Price. Global Journal of Mangement, 49-68.
Gronroos. (1990). Service Management and Marketing. European Journal of Business and
Management, 185-193.
Gronroos and Holbrook. (1994). Services of marketing. European Journal of Business and
Management , 185-193.
Jobber. (2001). Principles and practice of marketing. European Journal of Business and
Management , 185-193.
Juran. (1988). Business Process Management , 210-220.
Kapferer. (2004). Journal of Service Research, , 143-148.
Kapferer. (2004). Journal of Marketing , 210-218.
Keller, K. (2006). Principles of Marketing. European Journal of Business and Management, 185-193.
Khan. S. and Hussain, M. (2013). Determinants of Consumer Happiness and Its Role in Customer
Loyalty. International Review of Management and Business Research. 2(1). 11-19.
Kotler and Armstrong. (2006). Services quality. European Journal of Business and Management,
185-193.
Martin. (2001). Services of the hotel. African Journal of Marketing Management, 32-42.
McGowan and Sternquist. (1998). The Johns Hopkins University Press, 185-193.

Shahzad Khan
Determinants of Customer Retention in Hotel Industry
64 JOURNAL OF APPLIED ECONOMICS AND BUSINESS, VOL.1, ISSUE 3 – OCTOBER, 2013, PP. 42-64
Patterson, S. (1999). Model of relationship. European Journal of Business and Management, 185-
193.
Prabhu, R. (2003). The influence of satisfaction, trust and switching barriers on customer retention
in a continuous purchasing setting. European Journal of Business and Management, 185-193.
Reichheld. (1996). Customer retention. European Journal of Business and Management, 185-193.
Reichheld. (1996). Learning from customers defections. European Journal of Business and
Management, 185-193.
Richards. (1996). Using the conversion model to optimize customer retention. European Journal of
Business and Management, 185-193.
Richards. (1996). European Journal of Business and Management, 185-193.
Sproles and Kendall. (1986). European Journal of Business and Management, 320-330.
Sternquist, M. (1998). Global Journal of Management, 300-324.
Suhartanto, K. (2003). European Journal of Business and Management, 340-355.
Temporal-Trott. (2001). Journal of Service Research, 143-148.
Winer, R. (2001). Customer relationship management. European Journal of Business and
Management, 185-193.
Zeithaml and Bitner. (1996). Services marketing. African Journal of Marketing Management, 32-42.
Zeithaml. (1998). European Journal of Business and Management, 185-193.
Zeithaml. (2006). Services of the hotel industry. African Journal of Marketing Management. 1(1),
32-42.