determinants of commercial bank performance in transition · pdf filedeterminants of...
TRANSCRIPT
POLICY RESEARCH WORKING PAPER 2850
Determinants of Commercial BankPerformance in Transition
An Application of Data Envelopment Analysis
David A. Grigorian
Vlad Manole
The World Bank MEurope and Central Asia Region i
Private and Financial Sector Development UnitJune 2002
Pub
lic D
iscl
osur
e A
utho
rized
Pub
lic D
iscl
osur
e A
utho
rized
Pub
lic D
iscl
osur
e A
utho
rized
Pub
lic D
iscl
osur
e A
utho
rized
Pub
lic D
iscl
osur
e A
utho
rized
Pub
lic D
iscl
osur
e A
utho
rized
Pub
lic D
iscl
osur
e A
utho
rized
Pub
lic D
iscl
osur
e A
utho
rized
I POLICY RESEARCH WORKING PAPER 2850
Abstract
Banking sectors in transition economies have variables. In addition to stressing the importance of someexperienced major transformations throughout the bank-specific variables, the censored Tobit analysis1990s. While some countries have been successful in suggests that:eliminating underlying distortions and restructuring their * Foreign ownership with controlling power andfinancial sectors, in some cases financial sectors remain enterprise restructuring enhance commercial bankunderdeveloped and the rates of financial intermediation efficiency.continue to be quite low. * The effects of prudential tightening on the efficiency
Grigorian and Manole estimate indicators of of banks vary across different prudential norms.commercial bank efficiency by applying a version of Data * Consolidation is likely to improve efficiency ofEnvelopment Analysis (DEA) to bank-level data from a banking operations.wide range of transition countries. They further extend Overall, the results confirm the usefulness of DEA forthe analysis by explaining the differences in efficiency transition-related applications and may shed light on thebetween financial institutions and countries by a variety optimal architecture of a banking system.of macroeconomic, prudential, and institutional
This paper-a product of the Private and Financial Sector Development Unit, Europe and Central Asia Region-is part ofa larger effort in the region to disseminate the results of research on transition issues. Copies of the paper are available freefrom the World Bank, 1818 H Street NW, Washington, DC 20433. Please contact Sylvia Torres, room H6-216, telephone202-473-9012, fax 202-522-0005, email address [email protected]. Policy Research Working Papers are also postedon the Web at http://econ.worldbank.org. The authors may be contacted at [email protected] [email protected]. June 2002. (36 pages)
The Policy Research Working Paper Series disseminates the findings of work in progress to encourage the exchange of ideas aboutdevelopment issues An objective of the senes is to get the findings out quickly, even if the presentations are less than fully polished. Thepapers carry the names of the authors and should be cited accordingly. The findings, interpretations, and conclusions expressed in thispaper are entirely those of the authors. They do not necessanly represent the view of the World Bank, its Executive Directors, or thecountnes they represent.
Produced by the Research Advisory Staff
Determinants of Commercial Bank Performance in Transition:
An Application of Data Envelopment Analysis*
David A. GrigorianVlad Manole
At the time this research was initiated, David A. Grigorian was with Private and FinancialSector Development Unit, Europe and Central Asia Region, of the World Bank. He now works atthe Intemational Monetary Fund and can be reached at Dgrigoriani.mf.org. The coauthor isVlad Manole from Washington University who can be reached at manoleawueconc.wustl.edu.This research was funded by the ECA Regional Initiatives Fund of the World Bank. The authorswould like to thank Anahit Adamyan for excellent research assistance. They would also like toexpress their appreciation to colleagues in the World Bank country offices in Belarus, Bulgaria,Croatia, Hungary, Moldova, Romania, Russian Federation, Slovak Republic and Ukraine fortheir help in putting the dataset together. Comments and suggestions from Biagio Bossone, AlexFleming, Oleh Havrylyshyn, Giuseppe Iarossi, Roberto Rocha, and seminar participants at theWorld Bank at various stages of this research are gratefully acknowledged.

Chapter 1. Introduction
Banking sectors in transition economies of Eastem Europe and Former Soviet Union
have experienced major transformations throughout the 1990's. In the pre- and early-transition
periods, state policies generally distorted resource allocation, as credit (subject to a variety of
controls) was directed toward sustaining existing industries and maintaining living standards
through explicit and implicit subsidies to enterprises and households. Since the primary role of
the banking system was to channel funds to the real sector, efficiency and profitability were not
among the top priorities. The banks were not engaged in evaluating the credit conditions of their
borrowers, and therefore no risk management techniques were in use. Old statistical standards
were designed to serve the objective of easy planning as opposed to disclosure of the true
financial state of banks.
While some countries in the region have been successful in eliminating underlying
distortions and restructuring their financial sectors, in some cases financial sectors remain
underdeveloped and the rates of financial intermediation continue to be quite low (Table 1). This
is especially alarming in light of mounting evidence of the effect of financial sector development
on economic growth (see, for instance, Levine and Renelt (1992), King and Levine (1993), etc.).
Although part of the success across countries could be attributed to better initial conditions1 and
achievements of early macroeconomic stabilization programs, the importance of structural
reforms were the dominant force behind the success in performance (e.g., Berg et al., 1999).
Progress in legal and regulatory reforms, enterprise privatization, price and external trade
liberalization were partially responsible for the changes occurring in some transition countries.
These changes manifested themselves not only in the financial soundness of banking institutions,
but also in a wider range and sophistication of financial services provided by the latter. A few
countries in the region were able to transform their banking sectors from a state where dozens of
small banks were set up to serve individual enterprises (or worse, to operate as scam machines!),
to a state where putting all their eggs in one basket is considered suicidal, establishing
correspondent relationships with major Western banks is a matter of life and death, and internet
banldng is no longer a luxury. Reduced availability of centralized financing encouraged banks in
I Yet de Melo et al. (1997) and, subsequently, Havrylyshyn and van Rooden (2000) show that
although the initial conditions were important in defining the difference in performance across
countries, their significance diminished over time.
3
the region to look for altemative sources of financing and undertake measures aimed at deposit
mobilization. As economies grew, triggering an increase in savings, so did the number of
financial intermediaries (securities market institutions, pension funds, insurance companies, and
brokerage firms) claiming a share of the pie and exerting additional pressure on banks to
improve service provisions.
In light of these changes, it has become important to assess the relative role of different
institutional and policy settings in explaining the difference between outcomes across countries
and financial institutions. Yet, the effect and relative importance of various macro and
regulatory elements of financial reforms in transition countries have so far not been properly
evaluated. Nor is there a consensus on the scope and the scale of effective regulatory regime.
Studies on transition economies have yet to look into these issues.
One should note that different policy measures may have different, and often opposite,
effects on operational efficiency and technological improvements of banking operations. For
instance, although tightening prudential requirements may limit banks' profitability and reduce
the operating efficiency in the short run, doing so may encourage banks to look for new and
innovative ways to invest, thereby expanding the production possibilities frontier.3 It is therefore
essential for a policymaker to be able to identify policy instruments that are effective in bringing
about changes in productivity and efficiency and come up with the best (often least-cost) policy
response. This is of particular importance for economies in transition, where the choice of
instruments for policymakers can be rather limited as well as costly.
This paper aims to fill in the gap. Its purpose is to (1) calculate an appropriate measure
of commercial bank efficiency in a multiple-input/output framework and (2) evaluate the effects
of policy framework on the performance of commercial banks as measured by these efficiency
indicators. We do so in a wide range of transition countries and across a number of years. We
argue that to fully assess the efficiency of commercial bank operations, it is necessary to model
various types of functions performed by banks. In the beginning we skip the discussion on the
potential links between various policy measures and bank efficiency, only to discuss them later,
2 Exceptions are Claessens (1996) and, more recently, Barth et aL (2001).
'Regulations might also have the opposite effect of what was originally intended, that is,discouraging banks from taking unjustified risks. To see this, note that allowing banks to collectrents by imposing less stringent regulations may have the potential of deterring them from takingexcessive risks.
4

along with the final results of estimation. This paper is a product of ongoing research and is not
intended to provide answers to all questions raised in the paper. On the contrary, we realize that
more questions may have been created than answered.
The range of questions of concem are as follows: Do banks that are subject to tighter
prudential standards do better? Do banks with foreign ownership outperform their domestically
owned counterparts? Does competition necessarily improve efficiency? Does enterprise
restructuring affect bank performance in any significant way? What is the role of capital market
development in strengthening bank performance? Do a country's legal traditions and rule of law
affect bank efficiency indicators?
The paper is structured in the following way. Chapter 2 provides an overview of the
literature on bank efficiency analysis and describes the methodology used in the study. Chapter
3 describes the dataset and discusses the results of Data Envelopment Analysis in cross-country
and cross-regional settings. Chapter 4 explains differences in cross-bank efficiency indicators by
regressing them on the set of policy instruments and control variables. Finally, Chapter 5
concludes.
Chapter 2. Methodology
During the past few decades the banking sectors around the world experienced profound
regulatory and technological changes. Advanced applications in computer and communications
technology together with the introduction of new financial instruments have altered the way
banking is conducted. Such changes significantly modified the technology of bank production.
In this regard, a frequently asked question was about the effect of these changes on the efficiency
of banks. A large number of studies (see Berger and Humphrey (1997) for a survey) tried to
answer this question by proposing new methods to measure the efficiency of the banking sector.
The most widely used methods are Data Envelopment Analysis and the Stochastic Frontier
Approach. Below we present a short review of the productivity and efficiency literature with a
particular focus on the methodology to be used in this paper.
Studies on productivity growth in the baiking sector usually base their analysis on cost
ratio comparisons. There are several cost ratios to be used and each one of them refers to a
particular aspect of bank activity. Since the banking industry uses multiple inputs to produce
5
multiple outputs, a consistent aggregation may be problematic (see Kim, 1986). Some attempts
have been made to estimate average practice cost functions. While these approaches were
successful in identifying the average practice productivity growth, they failed to take into
account the productivity of the best practice banks. These problems associated with the,
"classical" approach to productivity led to the emergence of other approaches which incorporate
multiple inputs/outputs and take into account the relative performance of banks.
One string of literature uses frontier analysis to separate the banking units that perform
well from those that perform poorly, according to a specified set of criteria. The focus of this
literature is on the changes of the efficiency frontier and on how close banks are to operating on
the efficiency frontier. In an influential article, Farrell (1957) proposed two ways to estimate the
frontier. The first method called for identifying efficient production units and building a piece-
wise linear efficiency frontier using these efficient units. This was first implemented by Charnes
et al. (1978), who used linear-programming methods to identify the efficient units and coined the
term Data Envelopment Analysis (DEA).4
Throughout the past two decades, hundreds of articles have developed the Data
Envelopment Analysis and over a thousand papers have applied the method to different fields
ranging from banking to education.5 This study will estimate the efficiency of banks by using a
model which assumes a variable return to scale (VRTS). We start with presenting a model with
constant returns to scale (CRTS) and then extend it to allow for variable returns to scale. In the
case of a CRTS technology, the linear programming method establishes which of the decision-
making units (DMUs), in our case banks, determines the envelopment surface. The latter is
referred to as the empirical production function or efficient frontier. This benchmark frontier is a
linear combination of the efficient banks in the sample. The set of best practice or frontier
observations are those for which no other decision making unit or linear combination of units has
as much or more of every output (given a fixed amount of inputs - for an output oriented model)
or as little or less of every input (given a fixed amount of outputs - for an input oriented model).
4Their method is based on the assumption that the production units have constant returns toscale. Banker et al. (1984) later relaxed the assumption and proposed a model with units ofproduction with variable returns to scale. Theoretical extensions of these methods and empiricalapplications are discussed in Seiford (1996) and Cooper et al. (2000).
5For detailed surveys and recent developments in the field see Charnes et al. (1994) and Cooperet al. (2000).
6
The DEA frontier is formed as the piecewise linear combination that connects the set of these
best practice observations, yielding a convex production possibility set. The DEA provides a
computational analysis of relative efficiency for multiple input/output situations by evaluating
each decision-making unit and measuring its performance relative to an envelopment surface
composed of best practice units. Units that do not lie on the surface are termed inefficient. Thus
this method provides a measure of relative efficiency.
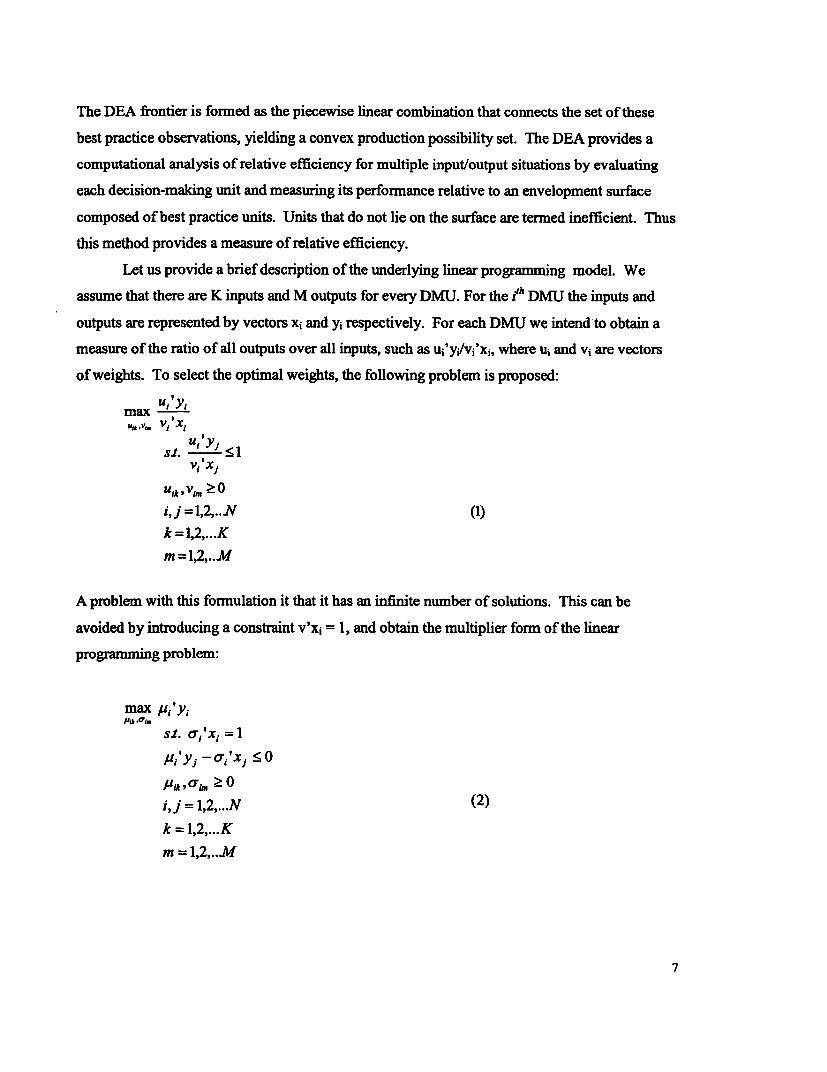
Let us provide a brief description of the underlying linear programming model. We
assume that there are K inputs and M outputs for every DMU. For the /h DMU the inputs and
outputs are represented by vectors xi and y2 respectively. For each DMU we intend to obtain a
measure of the ratio of all outputs over all inputs, such as ui'yi/vi'xi, where u; and v; are vectors
of weights. To select the optimal weights, the following problem is proposed:
max Ut Yiu,h,VI V1 X1
s. t < 1V, 'X}
Ulk Vh,, 2 0
i, j = 1,2,... N (1)
k = 1,2,...K
m = 1,2,..M
A problem with this formulation it that it has an infinite number of solutions. This can be
avoided by introducing a constraint v'x; = 1, and obtain the multiplier form of the linear
programming problem:
max W'y,
sj. ai' xi
/.i, !, xi 2 0
/a, ~7i. Ž 0i,j = 1,2,...N (2)
k =1,2,...K
m 1,2,..M
7
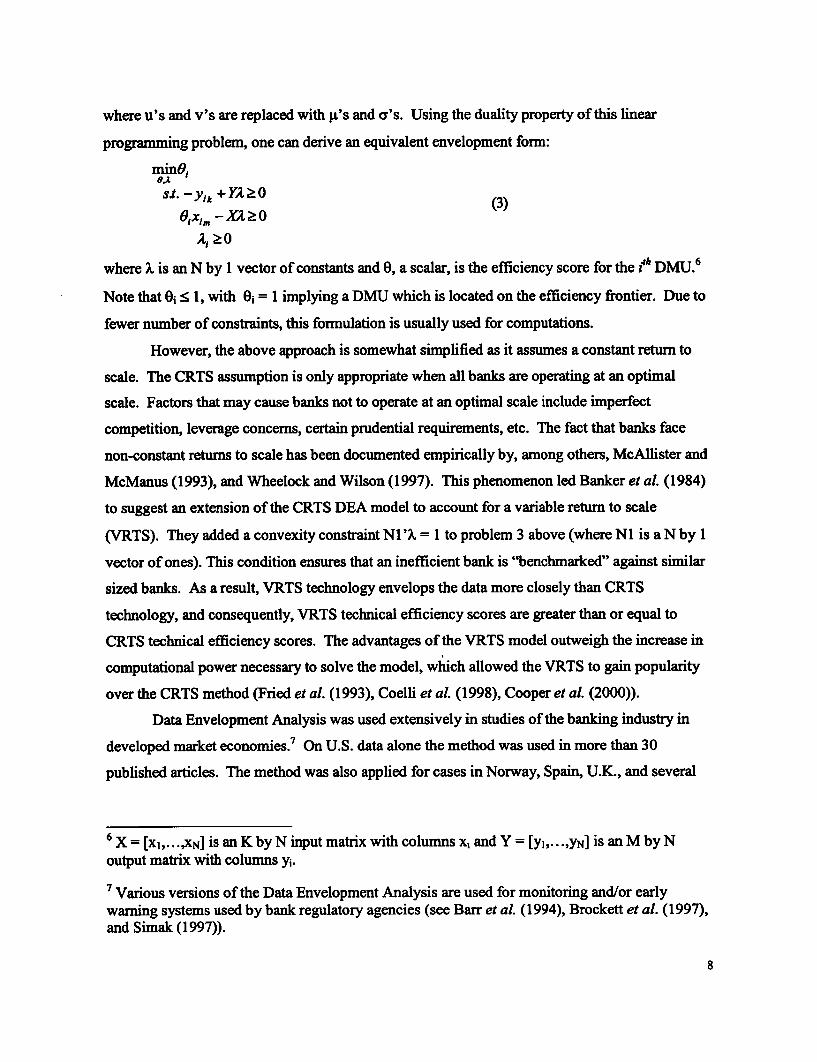
where u's and v's are replaced with p's and a's. Using the duality property of this linear
programming problem, one can derive an equivalent envelopment form:
minO1O,A
st.-Y,ik +YA20 (3)
°xim kR 2 0
A., Ž0
where X is an N by 1 vector of constants and 0, a scalar, is the efficiency score for the e4h DMU.6
Note that O • 1, with O0 = 1 implying a DMU which is located on the efficiency frontier. Due to
fewer number of constraints, this formulation is usually used for computations.
However, the above approach is somewhat simplified as it assumes a constant return to
scale. The CRTS assumption is only appropriate when all banks are operating at an optimal
scale. Factors that may cause banks not to operate at an optimal scale include imperfect
competition, leverage concerns, certain prudential requirements, etc. The fact that banks face
non-constant retums to scale has been documented empirically by, among others, McAllister and
McManus (1993), and Wheelock and Wilson (1997). This phenomenon led Banker et al. (1984)
to suggest an extension of the CRTS DEA model to account for a variable return to scale
(VRTS). They added a convexity constraint Ni ' = 1 to problem 3 above (where Ni is a N by 1
vector of ones). This condition ensures that an inefficient bank is "benchmarked" against similar
sized banks. As a result, VRTS technology envelops the data more closely than CRTS
technology, and consequently, VRTS technical efficiency scores are greater than or equal to
CRTS technical efficiency scores. The advantages of the VRTS model outweigh the increase in
computational power necessary to solve the model, which allowed the VRTS to gain popularity
over the CRTS method (Fried et al. (1993), Coelli et al. (1998), Cooper et al. (2000)).
Data Envelopment Analysis was used extensively in studies of the banking industry in
developed market economies.7 On U.S. data alone the method was used in more than 30
published articles. The method was also applied for cases in Norway, Spain, U.K., and several
6 X = [Xl,...,XN] is an K by N input matrix with columns x, and Y [yl,...,yN] is an M by Noutput matrix with columns y,.
7 Various versions of the Data Envelopment Analysis are used for monitoring and/or earlywarning systems used by bank regulatory agencies (see Barr et al. (1994), Brockett et al. (1997),and Simak (1997)).
8
other countries. 8 There is a vast literature which uses DEA for inter-countries comparisons. For
Scandinavian countries, a study by Berg et al. (1993) computed a separate frontier for every
country and a common frontier for all countries. The study found that Swedish banks were the
most efficient, a result sustained by a follow-up paper by Bukh et aL (1995). Bergendhal (1998)
studied the same countries using a slightly modified approach. In a broader context, Pastor et al.
(1994) applied DEA to 427 banks from 8 developed countries. They found a mean efficiency
value of 0.86, with the highest efficiency value of 0.95 for France and the lowest efficiency value
of 0.55 for the U.K.
Chapter 3. Data and Measurement Issues
The analysis presented below is based on a data set compiled by BankScope. 9 The set
contains comprehensive financial data on a large number of banks from transition economies.
The distribution of sample banks by countries for 1995-1998 is shown in Table 2. A total of
seventeen transition countries are represented. Table 3 contains the shares of assets of sarnple
banks in total assets of the banking system in each particular country. As one can see, the data
set is fairly representative: in some cases: (e.g. Croatia, Estonia, Slovenia) it covers over 90
percent of the banking sector at a point in time between 1995 and 1998. Poorly represented
banking sectors are those of Bulgaria, Russia and Ukraine, where the share of sample banks does
not exceed 40 percent for any particular year. The financial indicators of individual banks are
collected by BankScope using audit reports of banks completed by intemationally reputable
auditing firms, and are believed to be largely IAS compliant. As we foresee arguments
concerning the reliability of some of the indicators in an environment where serious misreporting
and non-compliance takes place, the choice of countries (those with relatively advanced banking
sectors compared with the overall population of transition economies' 0), and sample period
8 See Berger and Humphrey (1997) for a detailed survey.
9 In addition to making use of data collected by BankScope - which largely contained balancesheet and income statement information - with the help of World Bank field staff, we collecteddata on banks' employment and foreign ownership.
1 Belarus and Ukraine would be the exceptions.
(mid- as opposed to early-transition) for this paper are believed to reduce the extent of these
problems. Although there may be some pre-selection bias in the sample (since it could be argued
that only better performing banks are likely to have arranged for an audit by international
auditing firms) we believe that this would not jeopardize the validity of our (in essence cross-
country) arguments. Nevertheless, we acknowledge the presence of data problems specific for
the transition environment and discuss them in greater details in subsequent sections.
Definitions and Measurement issues
Before analyzing bank level productivity indicators, we start by defining a bank's objectives and
specifying its respective inputs and outputs. There is a long-standing debate over what exactly
constitutes banking output. In Fixler and Zieschang's (1992) view this output consists of
"transaction services and portfolio management services that banks provide to depositors while
acting as their intermediary". Arguably the range of services, as defined above, could be fairly
wide and largely dependent on the degree of the economy's financial development. One should
not be surprised to see both the width (variety) and the depth (complexity) of financial services
available to the general public change as the economy develops, so they should be expected to
differ across countries." The precise definition of a bank's "mandate" is important inasmuch as
the definition of inputs and outputs stems from the functions that banks perform. The latter is
essential for building our model.
The most commonly presented approaches to bank production could perhaps be
summarized under the following three headings: asset approach, user-cost approach, and value
added approach. Under the asset approach banks are considered only as financial intermediaries
between liability holders and fund beneficiaries (i.e. debtors). Loans and other assets are
considered to be the banks' outputs, while deposits and other liabilities are inputs to the
intermediation process (see, for instance, Sealey and Lindley (1977) for a discussion). While
this approach seems to be appropriate for large banks that purchase their funds in big chunks
from other banks and large institutional depositors, it may not be so for the majority of banks.
For the smaller banks this method fails to account for transaction services delivered by the latter
to their depositors, and therefore underestimates the overall value added of banking activities.
11 For simplicity, it is assumed that beyond the difference explained by general macro- as well asbusiness environment-related indicators no systemic differences exist between banking sectors inthe sample countries.
10
Under the user-cost approach, the net revenue generated by a particular asset or liability
item determines whether that financial product is an input or an output. Hancock (1991)
developed a model for bank production and was among the first to apply the user cost approach
to banking. Hancock stated that it is not clear ex ante whether monetary goods are inputs or
outputs in the production process. She goes on to say that if the financial returns on an asset
exceed the opportunity cost of funds (or if the financial cost of a liability is less than the
opportunity cost), then the instrument is considered to be a financial output. Otherwise, it is
considered to be an input. According to Hancock's rule, demand deposits would be classified as
outputs while time deposits would be classified as inputs. However, there are problems with this
approach. First of all, as interest rates fluctuate, so does the user cost. An item which is
considered to be an output in one period can tum into an input in the next period if the sign of its
user cost changes. Secondly, it is difficult to measure marginal revenues and costs for each
individual liability item. Th?us the answer to the question whether an item is an input or output
becomes a subject of significant measurement error and is sensitive to changes in data over time.
And finally, the value-added approach considers that both liability and asset categories
have some output characteristics. Nevertheless, only those categories that have substantial value
added are treated as outputs while the others are treated as either inputs or intermediate products
depending on the specific attributes of each category. The value added approach differs from the
user cost approach in that it is based on actual operating cost data rather than determining these
costs explicitly. This approach has been widely used in studies of the banking industry (Berger
et al. (1987), Berger and Humphrey (1997), etc.).
Taking into account the advantages and disadvantages of each method, the value added
approach was employed, which enabled the classification of inputs and outputs based on their
perceived value added. This method turns out to be quite attractive as it allows one to
differentiate between various functions performed by the banks. What are they and why does
one need to account for them? This too turns out to be crucial for the analysis. In analyzing the
functions performed by commercial banks, Bergendhal (1998) mentions five fundamental goals
of efficient bank management: profit maximization, risk management, service provision,
intermediation, and utility provision. To keep things simple, we argue, without the loss of
generality, that these five approaches could be pooled into two broadly defined ones: profit
maximization (combining features of Bergendhal's profit maximization and risk management)
and service provision (combining elements of service provision, intermediation and utility
provision). In reality any bank operation combines the elements of the two functions, as it is
hard to imagine a legitimate bank which is not trying to generate (if not maximize) profits or
establish a good rapport with its clients. Bearing this in mind, no weight is added to any of the
functions, but instead elements of the two are incorporated into the model. We nevertheless
specified two different output sets to incorporate the elements of both functions, each time to
have greater emphasis put on one of the two functions performed.
The following three inputs to the banking "production process" are defined: labor, fixed
assets and interest expenditures. Doing so accounts for all three essential inputs to commercial
bank operations: (1) personnel and management, (2) computer hardware and premises (which
also captures the extensiveness of a bank's branch network), and (3) leveraged funds
respectively. Holding output (however specified) and two other inputs constant, a lesser amount
of the third input used in the "production" would imply higher efficiency.
Next, we define the two sets of outputs as follows: (1) revenues12 , net loans'3 , and liquid
assets14 , and (2) deposits, net loans, and liquid assets. As mentioned above, the efficiency
indicator constructed based on the first set of outputs (hereafter denoted as DEAl) places greater
emphasis on profit generation.' 5 Similarly, an indicator based on the second set of outputs
(hereafter denoted as DEA2) would stress service provision as a goal. Both indicators, DEAI
and DEA2, however, recognize the quality of loans (and, therefore, ex post returns) and the
provision of liquidity services as objectives of a banks' operations. Since one of the objectives
of the paper is to search for potential links between policies and various functions performed by
a bank, contrasting these indicators and the ways they are affected by policy instruments will
prove interesting.
12 Revenues are defined as the sum of interest and non-interest income.
13 Net loans are defined as loans net of loan loss provisions.
14 Liquid assets include cash, balances with monetary authorities, and holdings of T-Bills.
15 The term "profit maximization" is intentionally not used here since it is not explicitly modeledin Equations 1-3. However, from the way the model is set up, one could think of the banks'objective as "conditional or constrained profit maximization": here the banks are assumed to bemaximizing their revenues conditional upon (or subject to) a fixed level of costs. For a givenlevel of costs, maximizing revenues would be identical to maximizing profits. Of course, owingto duality property, this problem is identical to minimizing costs subject to a fixed level ofrevenues.
12
Prior to tuming our attention to the results of the estimation, it is perhaps worth
reminding the reader about limitations of transition-specific data which are likely to have
implications for the analysis through its impact on output measures. Problems primarily stem
from imperfections in accounting standards which generally allowed doubtful treatments of some
transactions and financial positions. The most notorious of these was a commonly used practice
of rolling over the non-performing loans by extending fresh credits to delinquent borrowers and
immediately crediting the same amount (or a portion thereof) back in, showing it as interest
payment, hence inflating the balance sheet and overstating revenues. However, to the extent that
these practices were common in all transition countries and all banks (exceptions, of course,
apply), the analysis is unlikely to be significantly affected as a result of these imperfections in
our measures of bank revenues and net loans.
Yet in addition to accounting imperfections which defined the playing field for virtually
all financial institutions in transition countries, there were country specific differences in the
treatments of certain transactions. These primarily refer to differences in loan loss provisioning
rules and classification requirements. For instance, while all principal and interest repayment on
a loan had to be current for the loan to qualify as standard in Belarus, Croatia, Kazakhstan,
Latvia, Poland, Romania, and Slovenia (at least for a portion of the sample period), standard loan
classification guidelines in Bulgaria, Czech Republic, Lithuania and Slovakia allowed for up to a
30 day delay in repayments. Even when a loan is qualified as watch (the second group after the
category of standard loans), the regulations provided for different degrees of provisioning,
varying from 0 percent in Lithuania to 25 percent in Croatia and Bulgaria.16 17
However, the issue which may have the largest impact on the current analysis is the issue
of enforcement of prudential regulations (again, loan loss provisioning being the key one in this
respect) across types of financial institutions. The anecdotal evidence suggests that the strictness
with which regulations are being enforced varies not only across countries but also across types
of banks (e.g., state- vs. privately-owned, new vs. old, etc.). Although this differentiated
approach towards state- and privately-owned banks in the short run may be advocated on
grounds of systemic/economic impact of possible bank closures - since old state-owned banks
are likely to have a larger share of non-performing loans and are therefore likely to register
16 The treatments also differed by countries according to way the collateral entered the formulafor determining the required provisioning, ranging from full exclusion to full inclusion.
17 More details on these and other prudential standards are available from authors upon request.
13
negative capital if full provisioning is enforced - the existence of the differentiated approach is
likely to overstate the net loans of state-owned banks and therefore their performance as
measured by the DEA approach. Understandably, these and other data limitations (especially
those which are bank-specific and not country- or, more generally, transition-specific) may have
a heavy toll on the outcome of our analysis. Yet, by acknowledging the presence of these
problems (and, in fact, our inability to deal with some of them within the framework of this
paper), we still hope to be able to provide a useful framework for analyzing banking efficiency
by, among other things, flagging the potential problems as we unveil our results. With these
caveats in mind, let us now proceed to the results of the DEA analysis.
Results of Efficiency Analysis
The results of DEA analysis by countries using the model described in Equation 3 is presented in
Tables 4 and 5. Countries that produced the best outcome in terms of a revenue-based index (i.e.,
DEAl) are: Czech Republic (1995 and again in 1998), Slovak Republic (1996), and Croatia
(1997). The list of service-based index (i.e., DEA2) winners consists of Czech Republic (1995),
Slovenia (1996 and again in 1998), and Latvia (1997). Conversely, countries that yielded the
lowest revenue-based index in any one of the four years are: Lithuania (1995), Belarus (1996 and
1997) and Moldova (1998). Worst performers in terms of a service-based index are: Belarus
(1995 and 1996), Romania (1997) and Ukraine (1998).
To further check the consistency of the analysis, the countries were grouped together in
three relatively homogenous clusters (sub-regions).' 8 Figures 1 and 2 summarize the findings
across sub-regions. A number of interesting points are worth stressing here.
First of all, if looked at through the prism of medium term development, results vary
across functions that banks perform. It is interesting to note that while the catch-up rate19 of a
revenue-based index of the entire sample was less than 1 percent every year between 1995 and
18 The first cluster, Central Europe, includes Czech Republic, Hungary, Poland, Slovak Republicand Slovenia. The second cluster, Southem and Eastem Europe and the Baltic Republics,consists of Bulgaria, Croatia, Romania, Estonia, Latvia and Lithuania. Finally, the third cluster,the Commonwealth of Independent States, includes Armenia, Belarus, Kazakhstan, Moldova, theRussian Federation and Ukraine.
19 Since the DEA index is a relative measure of efficiency vis-a-vis the most efficient bank, theterm catch-up rate (symbolizing the reduction of distance between the bank in question and themost efficient bank) is a more appropriate one to use than the term growth rate.
14

1998, the average catch-up rate of a service-based index reached a level of 16.5 percent per
annum. This suggests that even though an average bank in the region might have reached a
satiation point in terms of its ability to improve upon revenue performance (either because it
knew a lot to start with or further improvements are outside of their control, or both), it had a lot
to leam in terms of reaching out and delivering transaction services to its clients.
Second, although experiencing less of a lag compared to banks in CE and SEE in terms
of revenue generating capacity, banks in CIS are clearly in a more disadvantageous position if
judged by the service-based index. However, it tums out there are dramatic differences between
the rate of catch-up in a service-based index across sub-regions: the DEA2 index for CIS
countries grew on average 30 percent per annum, followed by almost 16 percent in SEE
countries, and only 11 percent in CE countries.
Third, with the exception of 1997, banks in Central Europe are more efficient in terms of
both revenue generating capacity as well as the ability to provide services to their clients.
A skeptical reader should note that the presence of the sample bias - resulting because
countries with more advanced banking systems may have a larger share of their banks (i.e., both
strong and weak banks) presented in the sample - does not run in favor of CE banks. On the
contrary, eliminating the bias (by ensuring equal representation from all countries) is likely to
make the difference between CE and CIS look larger.
Overall, we conclude that the trends described above are largely consistent with one's
expectations about banking sectors in various transition countries, thereby indicating that the
DEA analysis could be successfully applied in studies of banking in transition economies.
Despite concems about the quality of data, the analysis provides a somewhat plausible outcome
in terms of the relative ranking of countries and sub-regions. Thus confident in the quality of the
indicators, we proceed to the next chapter where we evaluate the effects of various institutional
and policy settings on these indicators.
Chapter 4. Second Stage Regression Results
The purpose of this section is to take a step further in analyzing banking sector
productivity indicators by looking at their potential determinants. In doing so let us assume that
15
the provision of banking services could be presented, in a simplified setting, by the following
function:
Ya = f,(By,MRj,Ej) (5)
where yij measures output or efficiency of eth commercial bank operating in countryj, B1j denotes
bank specific variables, Mj describes the macroeconomic environment in countryj, and Rj and Ej
define the regulatory and general business environment respectively. Assuming that the above
factors affect the bank efficiency and productivity in additive fashion, the coefficients of interest
could be estimated using the following specification:
DEAU =a +XflpBv,p + I rkMJk + E X mRj,. + Y A.Ej.. + e- (6)p k m n
The dependent variable is the efficiency index, DEA, calculated earlier in Chapter 4.
To control for bank-specific features, we included (1) equity as a share of total assets, (2)
a bank's assets as a share of total assets of the banking system of its country of origin (i.e.,
market concentration), (3) a dummy variable for foreign controlled banks,20 and (4) a dummy
variable to account for new vs. old banks. 21 The following are indicators describing the
underlying macroeconomic environment: GDP per capita, annual average rate of inflation, and
monetary depth and size of the financial sector (measured by the ratio of broad money to
GDP)22. It should be noted that including inflation in Equation 6 is intended to capture the
20 This variable takes the value of 1 if a bank is more than 30 percent foreign owned, and 0otherwise.
21 This variable takes the value of 1 if a bank is newly established, and 0 if it was establishedbefore 1990.
22 Controlling for crisis in the region proved to be quite a challenging task, which we wereunable to complete. The primary reason for giving up the idea of controlling for crisis is themere definition of it. Although, it is the case that some events that affected transition countries inthe course of the 90's had little or no cross-boarder repercussions (examples of these eventswould be those in Estonia and Latvia in 1995, Bulgaria in 1996, Czech Republic and Romania in1997), at least one event in the history of the region had major sub-regional, if not regional,implications. It is the Russian crisis of August 1998. While this is clearly a major adverse shockto the banking sector and the economy of Russia as a whole (which one ideally would like to be
16
potential inefficiencies, which could take the form of both price- (e.g., high interest margins) and
non-price (e.g., excessive branching) behavior, common for high inflationary environments.2 3
Because of difficulties with obtaining a consistent series on a broad range of prudential
requireInents, the choice of indicators describing the regulatory environment was the most
difficult one to make. We, nevertheless, were able to construct a data series on (1) capital
adequacy, (2) maximum exposure to a single borrower, and (3) a limit on the foreign exchange
open position for four consecutive years, 1995-1998.
Differences relating to the institutional and general business environment are captured in
the regressions by including the EBRD indexes of legal/institutional quality and enterprise
restructuring. Developments in capital markets and non-bank financial institutions and their
effect on commercial bank performance are captured by (1) stock market capitalization, and (2)
EBRD index of securities markets and non-bank financial institutions development.
Finally, sub-regional dummy variables are used (distinguishing between Central
European, South-East European/Baltic and CIS countries) to capture any differences in
efficiency indicators not accounted for by the above measures.
Regression Outcome
Due to the limited nature of the dependent variable (note that the DEA index ranges between 0
and 1), a censored Tobit regression model was used to estimate Equation 6. Unlike a
conventional Ordinary Least Squares estimation, in cases with limited dependent variables, Tobit
models are known to generate consistent estimates of regression coefficients. The results of
estimation are presented in Table 9. Overall, the regressions provide a reasonably good fit and
are robust with respect to the inclusion of new variables. The outcome is definitely worth paying
some attention to!
able to control), it also had adverse effects on economies of the entire region (the FSU countriesin particular). It is a well documented fact that a number of countries in the region, (Armenia,Hungary, Kyrgyz Republic, Ukraine, to name a few) were perhaps hit almost as hard as Russiaitself in terms of the effect on quality of bank assets, the stock markets, purchasing power ofeconomic agents, etc. Now, the question is, do these countries qualify to get a value of 1 as faras the dummny variable for crises is concerned? Where does one draw the line? Yet, this said,we assume that the regression will still capture the events of the crisis since relevant informationis likely to be contained in the rate of inflation, stock market capitalization, and per capitaincome.
17
First, the results suggest that well capitalized banks are ranked higher in terms of their
ability to collect deposits than their poorly capitalized counterparts. This is in line with the
conventional wisdom of capital playing a role of implicit deposit insurance, which in turn
encourages more deposits. The rationale behind the link between capitalization and revenues is,
however, less evident. Although the causality might run both ways, most studies found that well
capitalized banks are more efficient (see, for example, Berger and Mester (1997)). A possible
explanation for this could be based on the theory of moral hazard: the managers of banks that are
closer to bankruptcy will be more inclined to pursue their own goals (knowing the end is near),
which are not necessarily in line with the owners' objectives.
Second, it appears that banks with a larger share of a given country's market are likely to
be more efficient than those with a smaller share. This might be the case if banks were to take
advantage of economies of scale (or at least a wider array of borrowers), or play the role of a
market maker on the loanable funds market. As far as the deposit-based performance is
concerned (DEA2), larger banks are likely to be viewed as too-big-to-fail, and therefore enjoy
higher credibility than their smaller counterparts. This phenomenon could subsequently show
itself in lower premiums the depositors charge banks for their willingness to deposit their savings
with them, hence lowering the banks' interest expenditures. In any case, this outcome is
consistent with Demirguc-Kunt and Detragiache (1998), who find that financial liberalization
(defined as removal of barriers to competition) makes a financial system weaker and a crisis
more likely.24 Therefore, we argue that given a level of institutional development - especially in
a fragile transition environment - lower concentration, and therefore, more competition is likely
to be associated with lower efficiency. As economic environment becomes stronger (and
hopefully so is the institutional framework surrounding the banking system), the banks should be
able to handle more competitive pressures by responding in the usual efficiency-enhancing
manner. The presence of this non-linearity in the behavior of competition-performance link
becomes compelling if one compares banking systems in countries that undertook the path to
consolidation (e.g., Estonia) with those where banking sectors remained relatively dispersed
(e.g., Latvia and Lithuania). Getting off to a somewhat similar start with neighboring Latvia and
2 3 Examples where high inflationary environment led banks to build excessive branch networksinclude Argentina, Brazil, Turkey, to name a few.24 The authors do show, however, that the impact of liberalization on banking sector fragility isweaker in countries with a more developed institutional environment.
18
Lithuania, the banking system in Estonia was able to consolidate and weather most of the shocks
which hit the banking system in the 1990's and become one of the success stories.2 5
Third, banks with controlling foreign ownership are likely to be more efficient than their
domestically owned counterparts (including state-owned and private domestic). This should
come as no surprise because of the ability of foreign owned banks to capitalize on their access to
better risk management and operational techniques, which is usually made available through
their parent banks abroad. In addition, as foreign ownership is likely to be concentrated, foreign
owned banks are less prone to typical corporate governance conflict between (dispersed) owners
and the management. The anecdotal evidence also shows that well capitalized foreign owned
banks are more likely to cherry-pick the best borrowers available on the market (especially those
from their own countries of origin), thereby improving the quality of their portfolio and
increasing expost returns. On the deposit side, owing to a popular perception that, if necessary,
a foreign owned bank will be bailed out by its more powerful parent institutions abroad, foreign
ownership plays a role of implicit deposit insurance. Therefore, foreign-owned banks would be
likely to attract deposits by paying lower rates than their domestically owned counterparts. 26
Fourth, on another bank specific variable included in the regressions (i.e., dummy
variable for new vs. old banks) the outcome is just as intriguing. It turns out that after
controlling for ownership, newly established banks are not necessarily more efficient than those
that existed prior to 1990. Note that if viewed as a proxy for overall private ownership2 7 (since
banks that were established after 1990 are likely to have a larger share of private ownership -
both domestic and foreign - than banks that existed prior to 1990), the results shed some light on
the effect of domestic private ownership on efficiency. It appears that although positive, its
effect is not statistically significant. If viewed together with the point made in the previous
25 The crisis of 1992 was caused by freezing by Russian authorities of accounts of 2 of the largestEstonian banks in Moscow, partly coupled with severe liquidity crunch imposed by the Bank ofEstonia (see Fleming et al. 1996). Yet this was relatively mild compared to the crises which hitLatvia and Lithuania in early and late 1995 respectively.
26 A notable example of this taking place in a transition environment is Yerevan-based HSBC-Armenia bank (originally set up as Midland-Armenia bank). For years being the only foreignowned bank in Armenia and offering deposit rates, which are 3-4 times lower than those offeredby its domestic counterparts, the bank has managed to increase its share of the deposits overtime.
27 It should be noted that the dataset did not contain information on state ownership of the banks,and therefore it was impossible for us to explicitly control for domestic private ownership.
19

paragraph, this suggests that unless privatization leads to a controlling foreign ownership,
privatization of banks does not lead to statistically significant improvements in efficiency. This
finding reiterates the importance of factors that are usually associated with foreign ownership for
banking operations in a transition environment: transfer of technology, better management, and
favorable (transition country) public opinion.
Fifth, although there seems to be some indication that prudential regulations have impact
on the efficiency of banks, the effects are not uniform across different prudential norms. Tighter
minimum capital adequacy ratios seem to be associated with improved revenue generating
capacity (DEAl) and more aggressive deposit taking behavior (DEA2).28 On the other hand, the
impact of a single borrower limit on efficiency is insignificant. 29 This is perhaps explained by
banks' own increasing interest in diversifying away from large credit exposures, which is in turn
facilitated by the availability of more advanced market instruments (including wider use of
Treasury securities). This suggests that diversification objectives of regulatory authorities are
generally in line with those of the banks, and that further tightening of single borrower exposure
limits should come at no cost to banks. This is consistent with Barth et al. (2001) who find no
link between diversification guidelines and banking development and efficiency. 30 Finally,
banks in countries with relatively lax foreign exchange exposure regulations seem to be doing'
better than those in countries with tighter policies. This could be explained by the fact that in
some countries in transition, foreign exchange earnings constitute a big share of non-interest
income, and tightening limits on foreign exposure effectively limits banks' ability to make extra
income on foreign exchange transactions. Tighter standards on foreign exchange positions seem
to affect banks' intermediation function as well (DEA2). This could be explained by the fact that
most depositors in the region, perhaps rationally so, still prefer foreign currency denominated
instruments to those denominated in domestic currency. Of course, should this be the case,
depending on their asset position, banks will be restricted in their ability to borrow in foreign
28 This result runs contrary to Barth et al. (2001) who find that there is no relationship betweenstringency of capital requirements and bank performance.
29 Note that, unlike capital adequacy ratio, higher values of single borrower and foreign exchangeexposure limits imply less stringent control.
30 The diversification index (an aggregate of diversification guidelines and foreign lendingrelated limits) was, however, found by Barth et aL. (2001) to have explanatory power in terms ofpredicting major banking crises in small countries.
20
currency. Overall, this indicates that further limiting foreign exchange related exposure is likely
to come at a cost.
Sixth, the coefficient on GDP per capita indicates that banks in higher per capita income
countries are more efficient in terms of attracting more deposits and generating stronger cash
flows than banks in low income countries. This should not be surprising as countries with higher
per capita income (i.e., more developed countries) tend to generate more savings, and hence
more deposits. 3 Concerning other elements of the macro environment, our findings on the effect
(or precisely lack thereof) of macro financial structure are consistent with those of Demirguc-
Kunt and Huizinga (2000) who report no effect of macro financial structure on commercial bank
performance. An interesting point to note in this regard is that unlike the experience of some
countries (notably in Latin America), high inflation is not necessarily associated with large-scale
inefficiencies, which could take the form of price- and non-price behavior, as hypothesized
earlier.
Seventh, the insignificance of the coefficient on the quality of institutions is surprising,
but by no means unexplainable. The effect of a developed legal and regulatory system is likely
to be captured by other factors, such as foreign ownership or per capita GDP. It could be argued
that a developed legal and regulatory regime is conducive to foreign entry, as it is likely to
reduce the transaction costs (associated with entry) and the likelihood of expropriation (of
foreign assets by the state). In addition, it has been demonstrated that a developed legal
framework and the rule of law are positively correlated with economic growth (see, for instance,
Knack and Keefer, 1995). Should this be the case, of course, foreign ownership and per capita
GDP indicators would be stealing some explanatory power away from the indicators of
institutional quality, possibly making their effect on banking efficiency insignificant. Finally,
since countries grouped in the same sub-region are likely to be similar at least in terms of the
enforcement of laws (i.e., a defacto indicator of rule of law), if not in terms of the development
of the legal system (i.e., a dejure measure), the effect of institutional quality indicators on
banking efficiency are likely to be captured also by sub-regional dummies.
Eighth, as one should have expected, the EBRD indicators of enterprise restructuring
have strong explanatory power in determining bank efficiency across countries. This carries a
31 The link between the level of a country's development and revenue-based efficiency is lessclear, as higher risks of investment projects may end up being outweighed by higher marginalreturns on investments.
21
strong message that privatization of state-owned enterprises, enterprise competition, and
corporate governance related improvements (i.e., to name a few criteria covered by the EBRD
enterprise restructuring index) are important in boosting commercial bank efficiency. This could
obviously work through (i) improved efficiency of enterprises themselves (which then results in
improved portfolio quality and revenue generation ability of banks), but also through (ii)
intensified corporate governance pressures exerted by the newly emerging and stronger private
sector on commercial banks.
Finally, there is some evidence that securities market and non-banik financial institutions
development hinders the efficiency of banks. The results indicate that higher securities market
capitalization reduces revenue-based efficiency, while more developed non-bank financial
institutions hinder deposit taking. As unusual as these links may sound at first, they are not
counter-intuitive. On the one hand, it is relatively straightforward to see that an opportunity to
raise funds on the stock market would reduce the demand for bank loans by the best borrowers
on the market. Less credits extended to the cream de la cream would then manifest itself into
lower ex post returns and result in lower efficiency of banking operations. In that sense, this
outcome supports the one on the competition-performance link made above. On the other hand,
more developed non-bank financial institutions (i.e., pension funds, insurance companies,
brokerage firms, etc.) would in all likelihood produce a greater demand for household savings,
thereby reducing the amount of bank deposits available to the banks and eventually transaction
services rendered by the banks.
Chapter 5. Conclusion
This paper argues that to fully assess the efficiency of commercial bank operations it is
necessary to model various types of functions performed by banks, and control for the inputs
necessary to provide a certain level of utility to owners (i.e., profits) and depositors (i.e.,
services) while performing those functions. We therefore use Data Envelopment Analysis
(DEA) to measure bank efficiency by stressing profit maximization and provision of transaction
services as banks' primary objectives.
One of the contributions of this paper is that it demonstrates that DEA could be
successfully applied to banking systems in transition countries. Despite certain concems about
22
the quality of data in less advanced transition countries and its incompatibility with that of more
advanced reformers, the analysis provides a plausible outcome in terms of the relative ranking of
countries and sub-regions.
This analysis is the first attempt to consider differences in commercial bank efficiency
across transition countries and a number of years against a wide array of variables describing
macro environment, regulatory regime, institutional quality, enterprise restructuring and non-
bank financial sector development. The paper is, therefore, able to provide some answers to a
range of fundamental questions of financial sector policy making in transition.
First of all, it sheds some light on the question of the optimal architecture of a banking
system. If combined together, the positive effects of capitalization and market concentration on
DEA indicators suggest that banking sectors with few large, well capitalized banks are likely to
generate better efficiency and higher rates of intermediation.
Second, interestingly enough, our findings on the effects of prudential tightening on the
efficiency of banks vary across different prudential norms. Although policy actions in this
regard may require deeper case-by-case analyses, we conclude that contrary to conventional
wisdom, not all prudential requirements are detrimental to efficiency. Specifically, we found
that (1) tighter minimum capital adequacy ratios are associated with stronger revenue generating
capacity and more aggressive deposit taking behavior, (2) banks in countries with relatively lax
foreign exchange exposure limits are doing better than those in countries with tighter policies,
and (3) the single borrower-related limits do not effect bank performance in a statistically
significant manner.
Finally, the results provide a useful lesson about the effect of private share ownership on
bank efficiency. They suggest that privatization of banks, beyond those involving a transfer of
controlling share to foreign owners, does not results in statistically significant improvements in
efficiency. It would, however, be interesting to study whether the efficiency gains introduced by
foreign ownership are due to better managerial control or to the transfer of technology from the
banks' foreign owners.
The paper has a number of drawbacks. First, as indicated above, the analysis may suffer
from a sample selection bias resulting from the fact that some countries (especially those in CIS)
are poorly represented in the dataset. Since it is more likely that only better performing CIS
banks are in the sample, the bias is likely to underestimate the gap between average bank
efficiency between CIS and other sub-regions. Second, some coefficients in the regression
23

(more than others) may suffer from endogeneity bias and, therefore, require proper treatment
(such as Instrumental Variable approach) to account for it. An example of this is the coefficient
measuring the impact of equity-to-asset ratio on performance. Clearly, as pointed out above, the
causality could run both ways, so a further treatment of this link may be necessary. Yet this
outcome is consistent with empirical findings of others, a fact that gave us sufficient confidence
to report it without unduly complicating the analysis. Third, on a more conceptual level, the
paper fails to account for any potential complementarity between a regulatory environment on
the one hand, and country- and individual bank-specific indicators on the other hand. Doing so
might have shed some light on differences between the effect of regulatory measures on
efficiency across countries with different levels of institutional and/or economic development.
Nevertheless, we acknowledge these shortcomings and leave it for further research to properly
address them.
24
References
Banker, R.D., A. Charnes and W.W. Cooper, 1984. Some Models for Estimating Technical andScale Inefficiencies in Data Envelopment Analysis. Management Science, 30, 1078-1092.
Barth, J., G. Caprio, and R. Levine, 2001. Bank Regulation and Supervision: What Works Best?,unpublished manuscript.
Barr R. S., L.M. Seiford, and T.F. Siems, 1994. Forecasting Bank Failure: A Non-ParametricFrontier Estimation Approach. Recherches Economiques de Louvain, vol. 60, no. 4, pp.417-429.
Berg, A., E. R. Borensztein, R. Sahay, and J. Zettelmeyer, 1999. The Evolution of Output inTransition Economies - Explaining the Differences. IMF Working Paper No. 99/73.
Berg, S.A., F.R. Forsund, L. Hjalmarsson, and M. Suominen, 1993. Banking Efficiency in theNordic Countries, Journal of Banking & Finance, vol. 17, no. 2-3, pp. 371-388.
Bergendahl G., 1998. DEA and Benchmarks - An Application to Nordic Banks, Annals ofOperations Research, vol. 82, pp. 233-249.
Berger, A.N., G.A.Hanweck, and D.B. Humphrey, 1987. Competitive Viability in Banking:Scale, Scope and Product Mix Economies. Journal of Monetary Economics, 20, 501-520.
Berger A.N. and D.B. Humphrey, 1997. Efficiency of Financial Institutions: International Surveyand Directions for Future Research. European Journal of Operational Research, vol. 98,no. 2, pp. 175-212, Apr 16.
Berger, A. N., and L. J. Mester, 1997. "Efficiency and Productivity Change in the U.S.Commercial Banking Industry: A Comparison of the 1980s and 1990s." Federal ReserveBank of Philadelphia working paper no. 97-5.
Brockett, P. L., A. Charnes, W. W. Cooper, Z.M. Huang, and D.B. Sun, 1997. DataTransformations in DEA Cone Ratio Envelopment Approaches for Monitoring BankPerformances, European Journal of Operational Research, vol. 98, no. 2, pp. 250-268,Apr 16.
Bukh, P.N.D., S.A. Berg, and F.R. Forsund, 1995. Banking Efficiency in the Nordic Countries:A Four-Country Malmquist Index Analysis. Working Paper, University of Aarhus,Denmark.
Charnes A., W. W. Cooper, A. Y. Lewin, and L. M. Seiford, 1994. Data Envelopment Analysis:Theory, Methodology and Applications Kluwer Academic Publishers.
Charnes A, W. W. Cooper, and E. Rhodes, 1978. Measuring the efficiency of decision makingunits. European Journal of Operations Research, no. 2: 429-44.
25
Claessens, S., 1996. Banldng Reform in Transition Countries. World Development Report,Washington D.C.
Coelli T., D.S.P. Rao, and G.E. Battese,1998. An Introduction to Efficiency and ProductivityAnalysi. Kluwer, Norwell, MA.
Cooper, W.W., L.M. Seiford and K. Tone, 2000. Data Envelopment Analysis. Kluwer AcademicPublishers, Norwell, MA.
de Melo, Martha, Cevdet Denizer, Alan Gelb and Stojan Tenev, 1997. " Circumstance ahdChoice: the Role of Initial Conditions and Policies in Transition Economies", The WorldBank Policy Research Working Paper No. 1866, Washington, D.C.
Demirguc-Kunt, A. and E. Detragiache, 1998. Financial Liberalization and Financial Fragility,IMF Working Paper No. 98/83, Washington, D.C.
Demirguc-Kunt and Huizinga, 2000. Financial Structure and Bank Profitability, The World Bankmimeo.
Farrell, M.J., 1957. The Measurement of Profit Efficiency. Journal of the Royal StatisticalSociety, Series A, CXX, Part 3, 253-290.
Fixler D. and K. Zieschang, 1992. An Index Number Approach to Measuring Bank Efficiency:an application to Mergers', Journal of Banking and Finance 17, 437-450.
Fleming, A., L. Chu, and M-R. Bakker, 1996. The Baltics - Banking Crises Observed. TheWor,d Bank Policy Research Working Paper No. 1647.
Fried, H.O., C.A.K. Lovell and S.S. Schmidt (eds.), 1993. The Measurement of ProductiveEfficiency. Oxford University Press, New York.
Hancock, D., 1991. A Theory of Production for the Financial Firm. Kluwer Academic.
Havrylyshyn, 0. and R. van Rooden, 2000. Institutions Matter in Transition, but so do Policies.IMF Working Paper No. 00/70.
Kim, H.Y., 1986. Economies of Scale and Economies of Scope in Multiproduct FinancialInstitutions: Further Evidence from Credit Unions: A Note. Journal of Money, Credit,and Banking ,18, 2, 220-26.
King R.G. and R. Levine, 1993. Financial Intermediation and Economic Development, inCapital markets andfinancial intermediation, Cambridge University Press, Cambridge;New York and Melbourne, 156-89.
Knack, Stephen and Keefer, Philip, 1995. Institutions and Economic Performance: EmpiricalTests using Altemative measures of Institutions, Economics and Politics, vol. 7, no.3.
26
Levine, R. and D. Renelt, 1992. A Sensitivity Analysis of Cross-Country Growth Regressions.American Economic Review, vol. 82, no. 4, 942-63.
McAllister, P.H. and D. McManus, 1993. Resolving the Scale Efficiency Puzzle in Banking.Journal of Banking and Finance, 17, 2-3, 389-405.
Pastor J.M., F. Perez, and J. Quesada, 1997. Efficiency Analysis in Banking Firms: AnInternational Comparison. European Journal of Operational Research, vol. 98, no. 2,395-407, Apr 16.
Sealey, C.W. and J.T. Lindley, 1977. Inputs, Outputs, and a Theory of Production and Cost atDepository Financial Institutions, Journal of Finance, vol. 32, no. 4,1251-66.
Seiford, L.M., 1996. Data Envelopment Analysis: The Evolution of the State of the Art (1978-1995). Journal of Productivity Analysis vol. 7, July 1996: 99-137.
Simak P.C., 1997. DEA-Based Analysis of Corporate Failure. M.A.SC. thesis, University ofToronto (Canada).
Wheelock, D. C. and P. W. Wilson, 1997. Technical Progress, Inefficiency, and ProductivityChange in U.S. Banking, 1984-1993. Journal of Money, Credit, and Banking vol. 31, no.2 (May 1999): 212-34
27
Summary of Indicators Used
Dependent Variables - Efficiency indicators
DEAl Individual bank DEA indicator with revenues, net loans and liquid assets used as outputsDEA2 Individual bank DEA indicator with deposits, net loans and liquid assets used as outputs
Individual Bank specific variables
Number of employeesValue of fixed assetsInterest expendituresValue of outstanding loans net of accumulated provisionsCash, balances with Monetary Authorities and Treasury billsInterest and non-interest incomeTotal value of depositsEquity of the bank over total assetsDummy for foreign ownership (1 if more than 30 percent owned, 0 otherwise)Whether the bank is established before or after 1990 (if new, 0 if old)Ratio of bank's total assets of the total assets of the banking system
Macroeconomic Indicators
GDP per capita, PPP adjusted (USD)Annual average rate of inflationRatio of M2 to GDP
Institutional quality and "Rule of Law" indicators
Overall score for extensiveness and effectiveness of law (EBRD)
Transition/Restructuring indicators
Enterprise restructuring (EBRD)
Prudential standards
Capital Adequacy ratioMaximum exposure to single borrowerLimit on foreign exchange open position
Capital Markets/Non-Bank Financial Institutions
Stock Market capitalization in percent of GDPSecurities markets & non-bank financial institutions (EBRD)
28
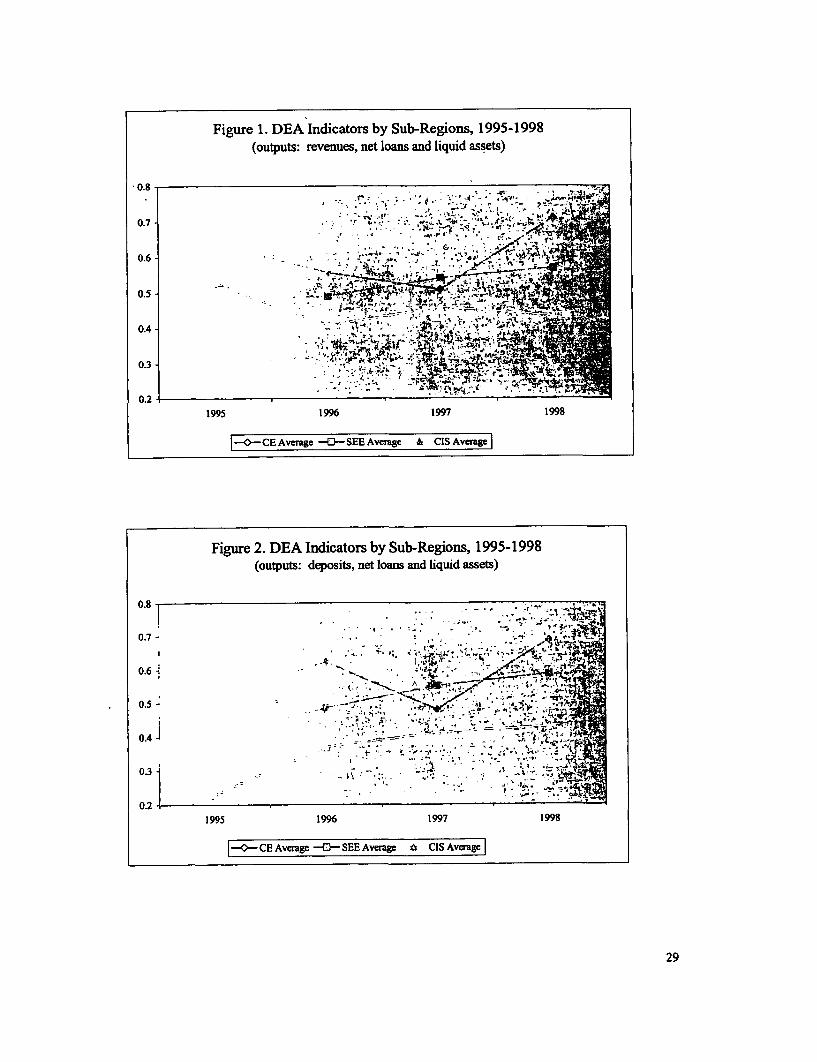
Figure 1. DEA Indicators by Sub-Regions, 1995-1998(outputs: revenues, net loans and liquid assets)
0.8
0.7
0.6 - . -
I~~~~~~~~~1 ,. A
0.5 -~~~~~~~~~~~~~~
0.3
0.2 W..1995 1996 1997 1998
1-C--CE Average -0-SEE Average & Cl_ Averag
Figure 2. DEA Indicators by Sub-Regions, 1995-1998(outputs: deposits, net loans and liquid assets)
0.8-- .
0.7-
0.46
0.3 - ,_
0.21995 1996 1997 1998
-- CE Average -0-- SEE Average A CIS Average
29
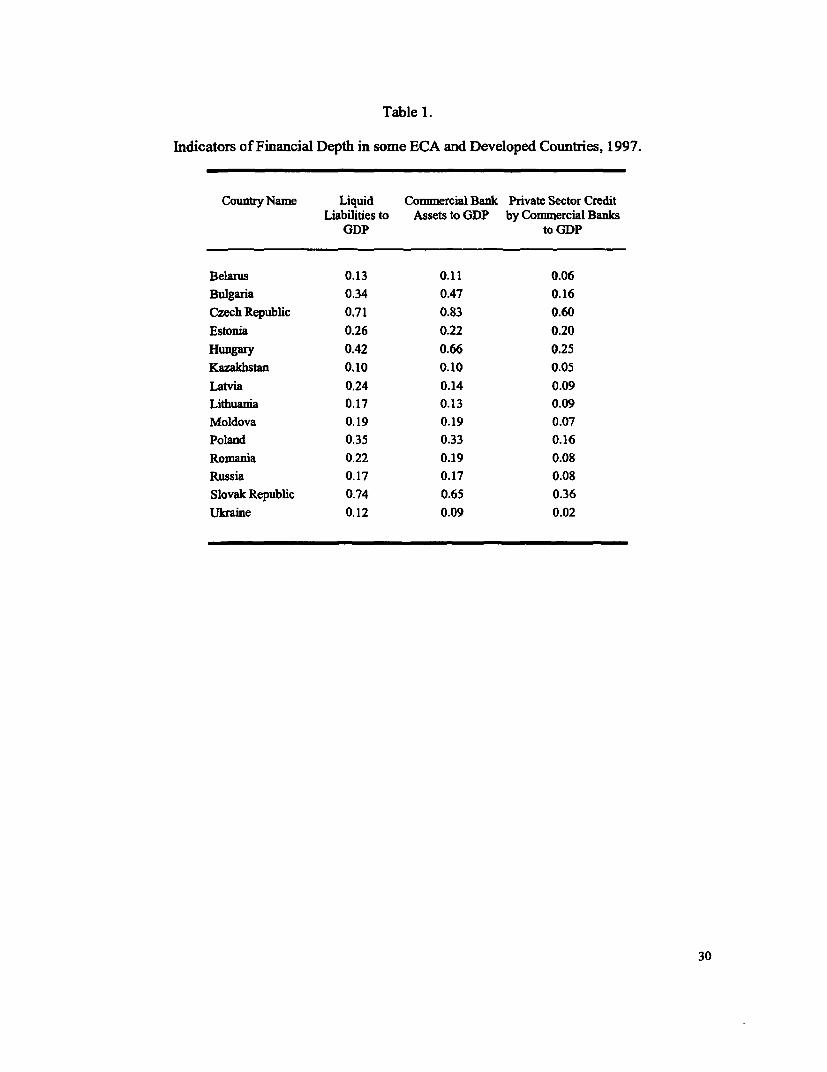
Table 1.
Indicators of Financial Depth in some ECA and Developed Countries, 1997.
Country Name Liquid Commercial Bank Private Sector CreditLiabilities to Assets to GDP by Commercial Banks
GDP to GDP
Belarus 0.13 0.11 0.06Bulgaria 0.34 0.47 0.16
Czech Republic 0,71 0.83 0.60Estonia 0.26 0.22 0.20Hungary 0.42 0.66 0.25Kazakhstan 0.10 0.10 0.05
Latvia 0.24 0.14 0.09Lithuania 0.17 0.13 0.09Moldova 0.19 0.19 0.07Poland 0.35 0.33 0.16
Romania 0.22 0.19 0.08Russia 0.17 0.17 0.08Slovak Republic 0.74 0.65 0.36Ukraine 0.12 0.09 0.02
30
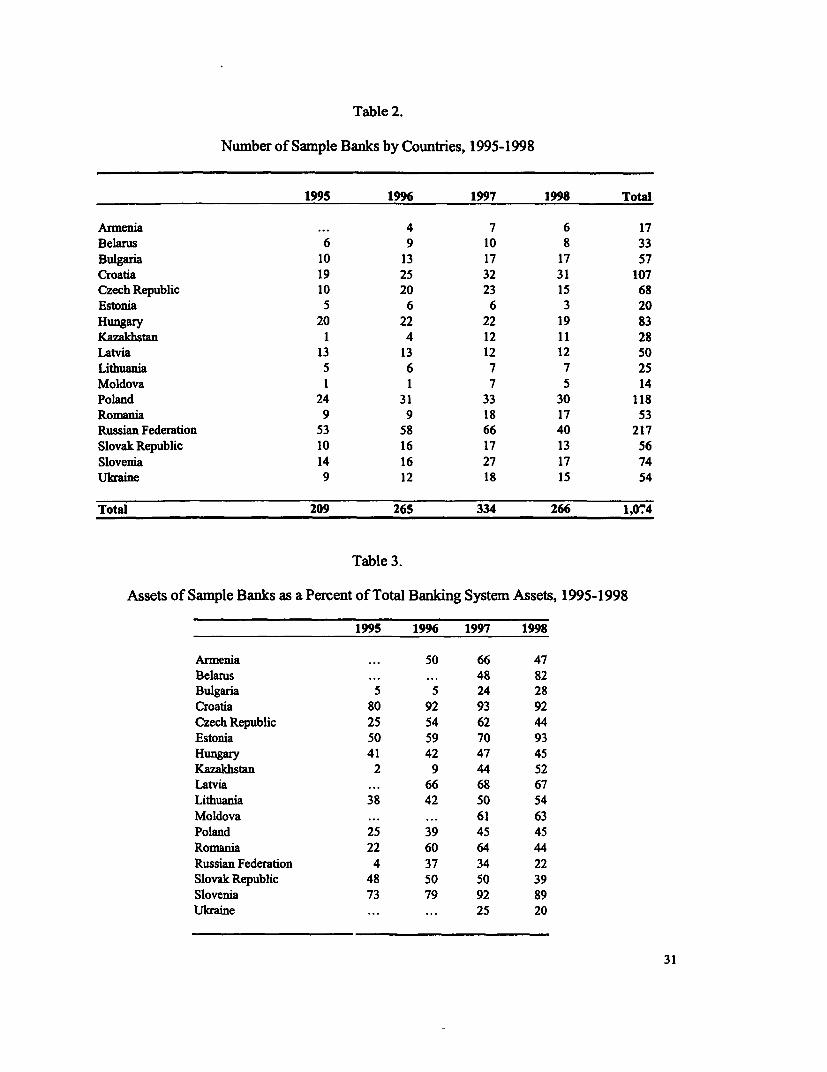
Table 2.
Number of Sample Banks by Countries, 1995-1998
1995 1996 1997 1998 Total
Annenia 4 7 6 17Belarus 6 9 10 8 33
Bulgaria 10 13 17 17 57
Croatia 19 25 32 31 107
Czech Republic 10 20 23 15 68
Estonia 5 6 6 3 20
Hungary 20 22 22 19 83
Kazakhstan 1 4 12 11 28
Latvia 13 13 12 12 50
Lithuania 5 6 7 7 25
Moldova 1 1 7 5 14
Poland 24 31 33 30 118
Romania 9 9 18 17 53
Russian Federation 53 58 66 40 217
Slovak Republic 10 16 17 13 56
Slovenia 14 16 27 17 74
Ukraine 9 12 18 15 54
Total 209 265 334 266 1,074
Table 3.
Assets of Sample Banks as a Percent of Total Banking System Assets, 1995-1998
1995 1996 1997 1998
Armenia ... 50 66 47Belarus ... ... 48 82Bulgaria 5 5 24 28Croatia 80 92 93 92
Czech Republic 25 54 62 44Estonia 50 59 70 93Hungary 41 42 47 45Kazakhstan 2 9 44 52Latvia ... 66 68 67Lithuania 38 42 50 54Moldova ... ... 61 63Poland 25 39 45 45Romania 22 60 64 44Russian Federation 4 37 34 22Slovak Republic 48 50 50 39Slovenia 73 79 92 89Ukraine ... ... 25 20
31
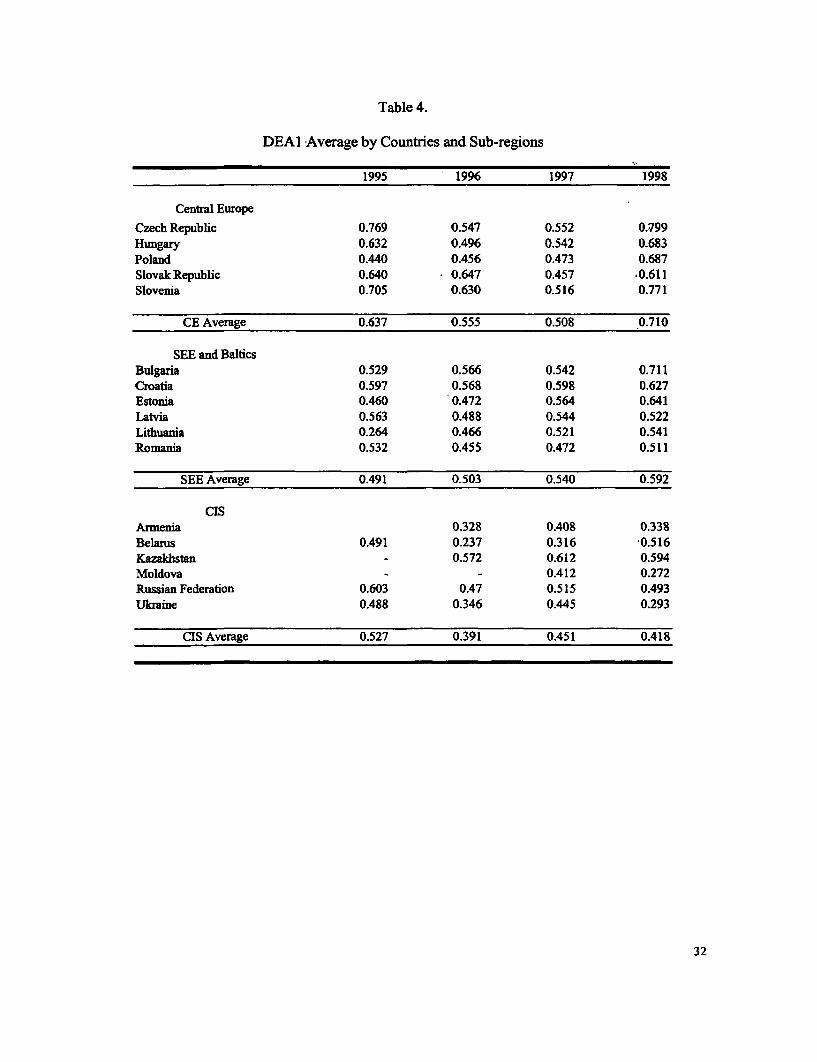
Table 4.
DEAI Average by Countries and Sub-regions
1995 1996 1997 1998
Central Europe
Czech Republic 0.769 0.547 0.552 0.799Hungary 0.632 0.496 0.542 0.683Poland 0.440 0.456 0.473 0.687Slovak Republic 0.640 0.647 0.457 .0.611Slovenia 0.705 0.630 0.516 0.771
CE Average 0.637 0.555 0.508 0.710
SEE and BalticsBulgaria 0.529 0.566 0.542 0.711Croatia 0.597 0.568 0.598 0.627Estonia 0.460 0.472 0.564 0.641Latvia 0.563 0.488 0.544 0.522Lithuania 0.264 0.466 0.521 0.541Romania 0.532 0.455 0.472 0.511
SEE Average 0.491 0.503 0.540 0.592
CIsArmenia 0.328 0.408 0.338Belarus 0.491 0.237 0.316 '0.516Kazakhstan - 0.572 0.612 0.594Moldova - - 0.412 0.272Russian Federation 0.603 0.47 0.515 0.493Ukrmine 0.488 0.346 0.445 0.293
CIS Average 0.527 0.391 0.451 0.418
32
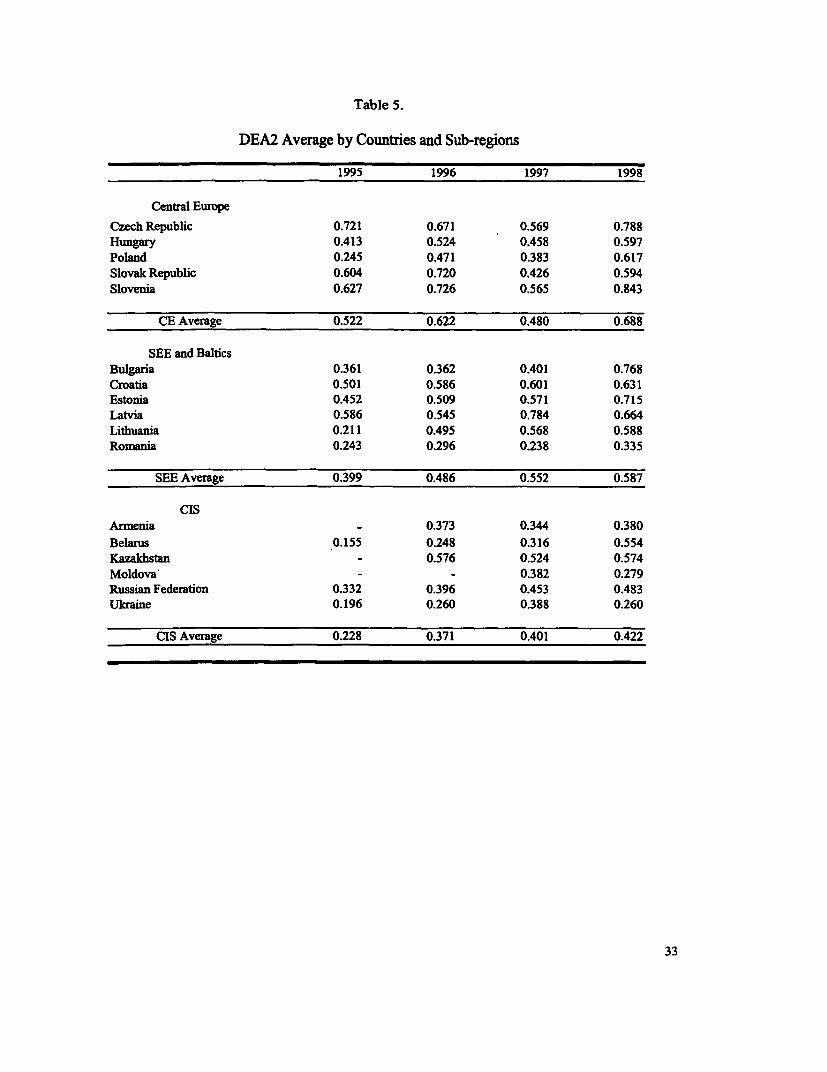
Table 5.
DEA2 Average by Countries and Sub-regions
1995 1996 1997 1998
Central Europe
Czech Republic 0.721 0.671 0.569 0.788Hungary 0.413 0.524 0.458 0.597
Poland 0.245 0.471 0.383 0.617Slovak Republic 0.604 0.720 0.426 0.594
Slovenia 0.627 0.726 0.565 0.843
CE Average 0.522 0.622 0.480 0.688
SEE and BalticsBulgaria 0.361 0.362 0.401 0.768
Croatia 0.501 0.586 0.601 0.631Estonia 0.452 0.509 0.571 0.715Latvia 0.586 0.545 0.784 0.664
Lithuania 0.211 0.495 0.568 0.588Romania 0.243 0.296 0.238 0.335
SEE Average 0.399 0.486 0.552 0.587
CISArmenia - 0.373 0.344 0.380
Belarus 0.155 0.248 0.316 0.554Kazakhstan - 0.576 0.524 0.574Moldova - - 0.382 0.279
Russian Federation 0.332 0.396 0.453 0.483Ukraine 0.196 0.260 0.388 0.260
CIS Average 0.228 0.371 0.401 0.422
33
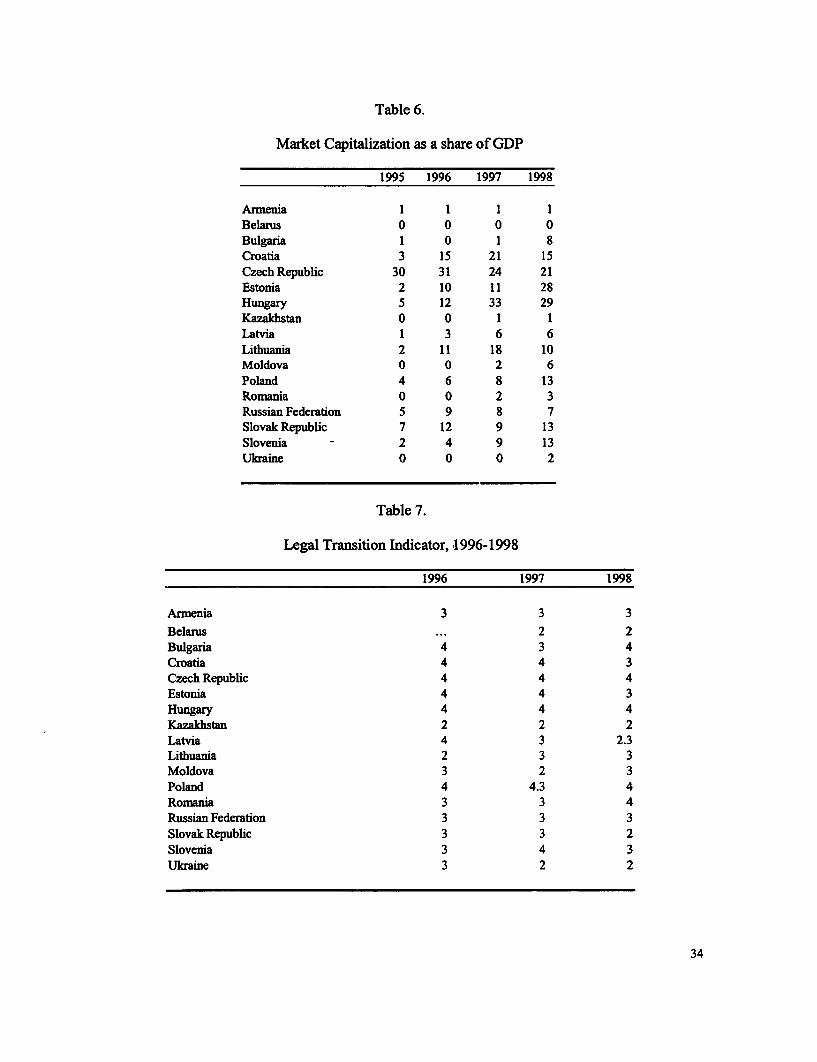
Table 6.
Market Capitalization as a share of GDP
1995 1996 1997 1998
Armenia 1 1 1 1Belarus 0 0 0 0Bulgaria 1 0 1 8Croatia 3 15 21 15Czech Republic 30 31 24 21Estonia 2 10 11 28Hungary 5 12 33 29Kazakhstan 0 0 1 1Latvia 1 3 6 6Lithuania 2 11 18 10Moldova 0 0 2 6Poland 4 6 8 13Romania 0 0 2 3Russian Federation 5 9 8 7Slovak Republic 7 12 9 13Slovenia - 2 4 9 13Ukraine 0 0 0 2
Table 7.
Legal Transition Indicator, 1996-1998
1996 1997 1998
Armenia 3 3 3Belarus ... 2 2Bulgaria 4 3 4Croatia 4 4 3Czech Republic 4 4 4Estonia 4 4 3Hungary 4 4 4Kazakhstan 2 2 2Latvia 4 3 2.3Lithuania 2 3 3Moldova 3 2 3Poland 4 4.3 4Ronania 3 3 4Russian Federation 3 3 3Slovak Republic 3 3 2Slovenia 3 4 3Ukraine 3 2 2
34
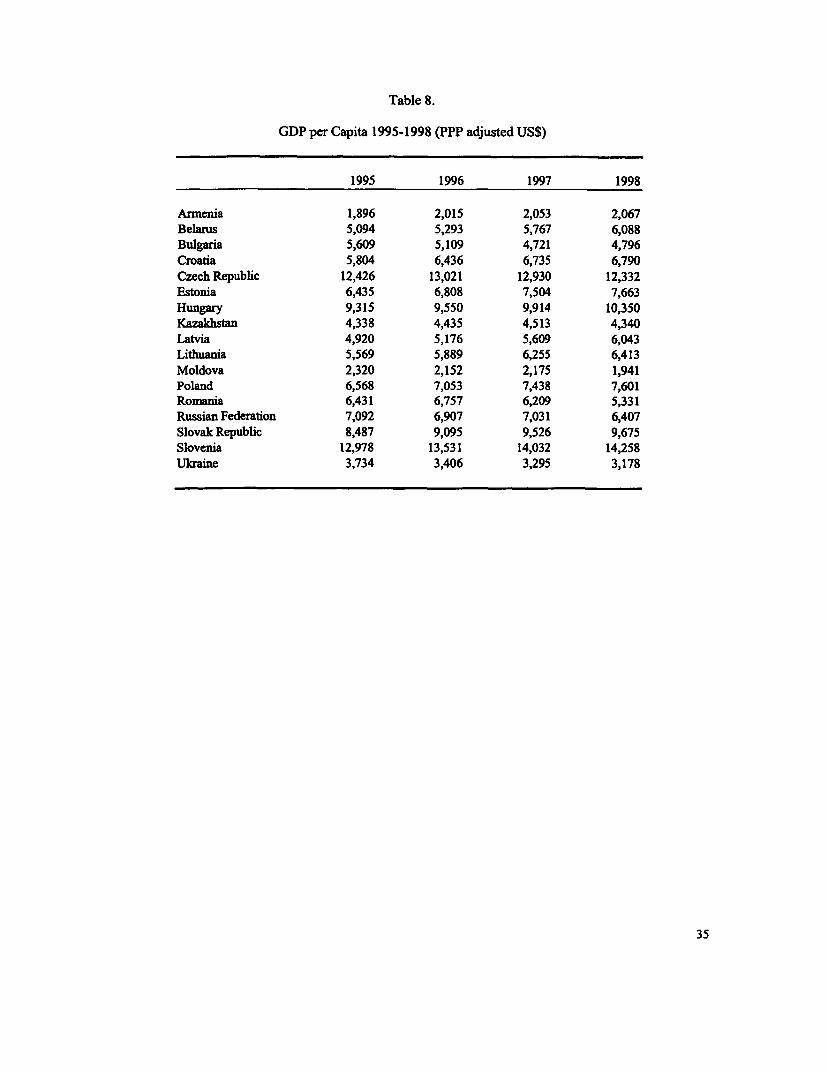
Table 8.
GDP per Capita 1995-1998 (PPP adjusted US$)
1995 1996 1997 1998
Armenia 1,896 2,015 2,053 2,067Belarus 5,094 5,293 5,767 6,088Bulgaria 5,609 5,109 4,721 4,796Croatia 5,804 6,436 6,735 6,790Czech Republic 12,426 13,021 12,930 12,332Estonia 6,435 6,808 7,504 7,663Hungary 9,315 9,550 9,914 10,350Kazakhstan 4,338 4,435 4,513 4,340Latvia 4,920 5,176 5,609 6,043Lithuania 5,569 5,889 6,255 6,413Moldova 2,320 2,152 2,175 1,941Poland 6,568 7,053 7,438 7,601Romania 6,431 6,757 6,209 5,331Russian Federation 7,092 6,907 7,031 6,407Slovak Republic 8,487 9,095 9,526 9,675Slovenia 12,978 13,531 14,032 14,258Ukraine 3,734 3,406 3,295 3,178
35
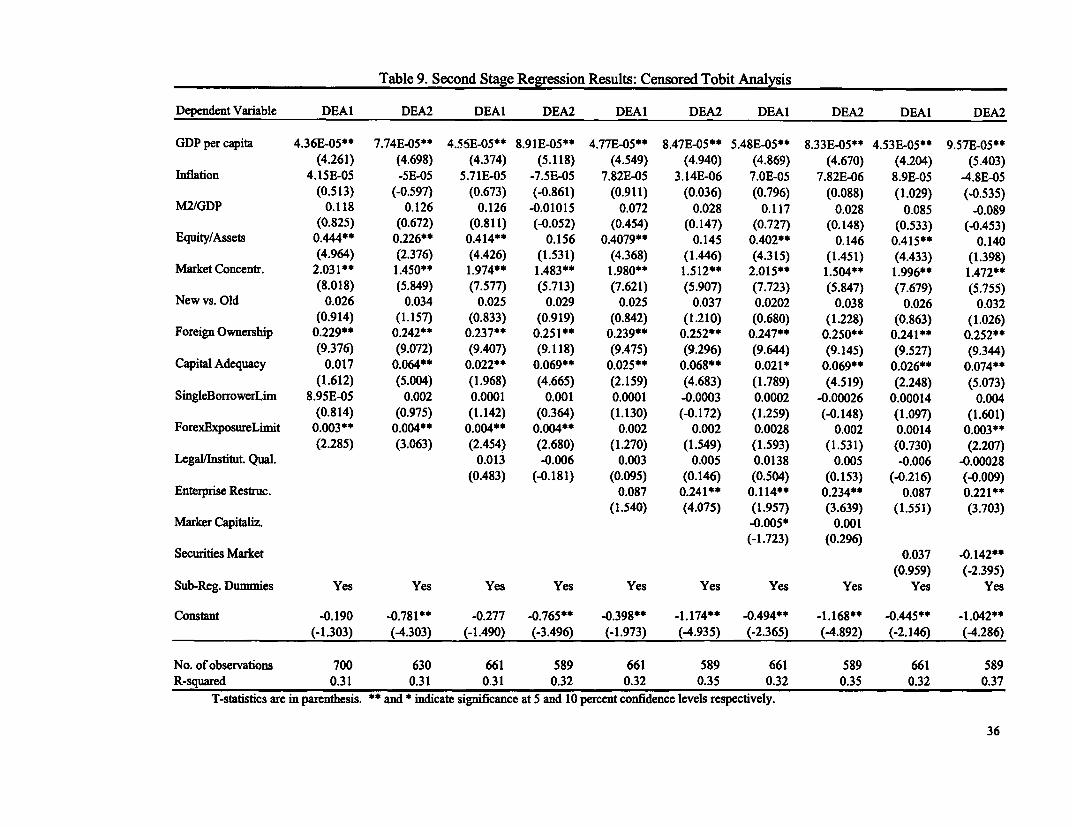
Table 9. Second Stage Regression Results: Censored Tobit Analysis
Dependent Variable DEAI DEA2 DEAI DEA2 DEAI DEA2 DEAI DEA2 DEAI DEA2
GDP per capita 4.36E-05** 7.74E-05** 4.56E-05** 8.91E-05** 4.77E-05** 8.47E-05** 5.48E-05** 8.33E-05** 4.53E-05** 9.57E-05**(4.261) (4.698) (4.374) (5.118) (4.549) (4.940) (4.869) (4.670) (4.204) (5.403)
Inflation 4.15E-05 -5E-05 5.71E-05 -7.5E-05 7.82E-05 3.14E-06 7.OE-05 7.82E-06 8.9E-05 4.8E-05(0.513) (-04597) (0.673) (-0.861) (0.911) (0.036) (0.796) (0.088) (1.029) (-0.535)
M2/GDP 0.118 0.126 0.126 -0.01015 0.072 0.028 0.117 0.028 0.085 -0.089(0.825) (0.672) (0.811) (-0.052) (0.454) (0.147) (0.727) (0.148) (0.533) (-0453)
Equity/Assets 0.444** 0.226** 0.414** 0.156 0.4079** 0.145 0.402** 0.146 0.415** 0.140(4.964) (2.376) (4.426) (1.531) (4.368) (1.446) (4.315) (1.451) (4.433) (1.398)
Market Concentr. 2.031** 1.450** 1.974** 1.483** 1.980** 1.512** 2.015** 1.504** 1.996** 1.472**(8.018) (5.849) (7.577) (5.713) (7.621) (5.907) (7.723) (5.847) (7.679) (5.755)
New vs. Old 0.026 0.034 0.025 0.029 0.025 0.037 0.0202 0.038 0.026 0.032(0.914) (1.157) (0.833) (0.919) (0.842) (1.210) (0.680) (1.228) (0.863) (1.026)
Foreign Ownership 0.229** 0.242** 0.237** 0.251** 0.239** 0.252** 0.247** 0.250** 0.241** 0.252**(9.376) (9.072) (9.407) (9.118) (9.475) (9.296) (9.644) (9.145) (9.527) (9.344)
Capital Adequacy 0.017 0.064** 0.022** 0.069** 0.025** 0.068** 0.021* 0.069** 0.026** 0.074**(1.612) (5.004) (1.968) (4.665) (2.159) (4.683) (1.789) (4.519) (2.248) (5.073)
SingleBorrowerLim 8.95E-05 0.002 0.0001 0.001 0.0001 -0.0003 0.0002 -0.00026 0.00014 0.004(0.814) (0.975) (1.142) (0.364) (1.130) (-0.172) (1.259) (-0.148) (1.097) (1.601)
ForexExposureLimit 0.003** 0.004** 0.004** 0.004** 0.002 0.002 0.0028 0.002 0.0014 0.003**(2.285) (3.063) (2.454) (2.680) (1.270) (1.549) (1.593) (1.531) (0.730) (2.207)
Legal/Institut. Qual. 0.013 -0.006 0.003 0.005 0.0138 0.005 -0.006 -0.00028(0.483) (-0.181) (0.095) (0.146) (0.504) (0.153) (-0.216) (-0.009)
Enterprise Restruc. 0.087 0.241** 0.114** 0.234** 0.087 0.221**(1.540) (4.075) (1.957) (3.639) (1.551) (3.703)
Marker Capitaliz. -0.005* 0.001(-1.723) (0.296)
Securities Market 0.037 -0.142**(0.959) (-2.395)
Sub-Reg. Dummies Yes Yes Yes Yes Yes Yes Yes Yes Yes Yes
Constant -0.190 -0.781** -0.277 -0.765** -0.398** -1.174** -0.494** -1.168** -0.445** -1.042**(-1.303) (-4.303) (-1.490) (-3.496) (-1.973) (4.935) (-2.365) (4.892) (-2.146) (4.286)
No. of observations 700 630 661 589 661 589 661 589 661 589R-squared 0.31 0.31 0.31 0.32 0.32 0.35 0.32 0.35 0.32 0.37
T-statistics are in parenthesis. *and * indicate significance at 5 and 10 percent confidence levels respectively.
36

Policy Research Working Paper Series
Contact
Title Author Date for paper
WPS2820 The Privatization of the Russian Igor Artemiev April 2002 V. JosephCoal Industry: Policies and Processes Michael Haney 32155in the Transformation of a MajorIndustry
WPS2821 Income, Wealth, and Socialization Daniel Lederman April 2002 P. Sotoin Argentina Provocative Responses 37892from Individuals
WPS2822 An Econometric Analysis of the David Mckenzie April 2002 C. MendozaCreditworthiness of IBRD Borrowers 80599
WPS2823 Real Exchange Rate Uncertainty Luis Serven April 2002 P. Sotoand Private Investment in Developing 37892Countries
WPS2824 Trade Policy and Labor Services Maurice Schiff April 2002 P. FlewittFinal Status Options for the West 32724Bank and Gaza
WPS2825 Demand fcr Imports in Venezuela: Mario A. Cuevas April 2002 M. GellerA Structural Time Series Approach 85155
WPS2826 Potential GDP Growth in Venezuela: Mario A. Cuevas Apnl 2002 M GellerA Structural Time Series Approach 85155
WPS2827 Learning to Export: Evidence from Marcel Fafchamps April 2002 E. KhineMoroccan Manufacturing Said El Hamine 37471
Albert Zeufack
WPS2828 Beyond Oaxaca-Blinder Accounting Frangois Bourguignon April 2002 F. Bourguignonfor Differences in Household Income Francisco H. G. Ferreira 31056Distributions across Countries Phillippe G. Leite
WPS2829 The Spatial Distribution of Poverty Nicholas Minot April 2002 R. Bonfieldin Vietnam and the Potential for Bob Baulch 31248Targeting
WPS2830 Labor Market Implications of Lodovico Pizzati April 2002 L PizzatiSwitching the Currency Peg in a 32259General Equilibrium Model for Lithuania
WPS2831 Health Outcomes in Poor Countries Limin Wang April 2002 L. Wangand Policy Options: Empirical Findings 37596from Demographic and Health Surveys
WPS2832 Poverty and Survival Prospects Adam Wagstaff April 2002 H. Sladovichof Vietnamese Children under Doi Moi Nga Nguyet Nguyen 37698
WPS2833 School Choice, Student Performance, Emiliana Vegas April 2002 H. Sladovichand Teacher and School Characteristics 37698The Chilean Case
WPS2834 Investor Protection, Ownership, and Charles P. Himmelberg April 2002 K Labriethe Cost of Capital R. Glenn Hubbard 31001
Inessa Love

Policy Research Working Paper Series
ContactTitle Author Date for paper
WPS2835 A Decade of Fiscal Transition Asad Alam May 2002 A. PantonMark Sundberg 85433
WPS2836 Ethnic Minority Development in Bob Baulch May 2002 E. KhineVietnam: A Socioeconomic Truong Thi Kim Chuyen 37471Perspective Dominique Haughton
Jonathan Haughton
WPS2837 Reform, Growth, and Poverty David Dollar May 2002 E Khinein Vietnam 37471
WPS2838 Economic Mobility in Vietnam Paul Glewwe May 2002 E Khinein the 1990s Phong Nguyen 37471
WPS2839 Marketing Externalities and M Shahe Emran May 2002 F. ShilpiMarket Development Forhad Shilpi 87476
WPS2840 Public Spending and Outcomes: Andrew Sunil Rajkumar May 2002 H. SladovichDoes Governance Matter? Vinaya Swaroop 37698
WPS2841 Contractual Savings in Countries Gregorio Impavido May 2002 P. Braxtonwith a Small Financial Sector Alberto R Musalem 32720
Dimitri Viltas
WPS2842 Financial Sector Inefficiencies Pierre-Richard Ag6nor May 2002 M. Gosiengfiaoand the Debt Laffer Curve Joshua Aizenman 33363
WPS2843 A Practical Guide to Managing David Scott May 2002 L. YearginSystemic Financial Crises. A Review 81553of Approaches Taken in Indonesia,the Republic of Korea, and Thailand
WPS2844 Money Demand in Venezuela. Mario A Cuevas May 2002 M GellerMultiple Cycle Extraction in a 85155Cointegration Framework
WPS2845 The Spatial Division of Labor Marcel Fafchamps May 2002 F. Shilpiin Nepal Forhad Shilpi 87476
WPS2846 Is India's Economic Growth Leaving Gaurav Datt May 2002 C Cunananthe Poor Behind9 Martin Ravallion 32301
WPS2847 The Nature and Dynamics of Poverty Hippolyte Fofack May 2002 P. WhiteDeterminants in Burkina Faso 81131in the 1990s
WPS2848 Administrative Barriers to Foreign Jacques Morisset May 2002 M. FeghaliInvestment in Developing Countries Olivier Lumenga Neso 36177
WPS2849 Pooling, Savings, and Prevention: Truman G. Packard May 2002 T. PackardMitigating the Risk of Old Age 75841Poverty in Chile