determinants of child mortality in a high density …
TRANSCRIPT

DETERMINANTS OF CHILD MORTALITY IN A HIGH DENSITY AREA
OF KATANGA TOWNSHIP IN NORTON
FUNGAYI S. MUZINDA
February 2012
A Thesis Submitted in Partial Fulfillment of the Requirements for the Master of Science
Degree in Population Studies
At the
Centre for Population Studies
Faculty of Social Sciences
University of Zimbabwe

ii
DEDICATION
To my husband and sons.

iii
ACKNOWLEDGEMENTS
My gratitude goes firstly to the Lord Almighty for the gift of life, for guidance and the strength to
carry out this research. Secondly, I would like to thank my supervisor Professor M. Mhloyi for the
mentorship throughout this research. I value the lessons taught and the principles instilled in me. To
all the staff at the Populations Studies Department, I salute you. My sincere gratitude also goes to
the staff of Norton Town Council and medical staff at the hospitals that spared some time to provide
information that made this thesis a success.
Special thanks to my husband for the support both moral and financial and to my boys for the moral
support. To the Mushakwe and Muzinda families for the prayers, I thank you for being there for me
in times of need. To all my friends, thank you for the prayers. Lastly, I would like to express my
gratitude to my colleagues for the good company and academic support. Special mention goes to
Ethel and Mavis for the support and for sparing time and resources to help me with my project.
Thank you all.

iv
ACRONYMS
AIDS…………. Acquired Immunodeficiency Syndrome
ANC……… Antenatal Care
ARI………….. Acute Respiratory Infection
ART…….. Anti-retroviral Treatment
CHD…….. Child Health Days
CMR……… Child Mortality Rate
CSO………. Central Statistical Office
DDT………. Dichloro Diphenyl Trichloroethane
EPI…………….. Expanded Immunization Program
HIV…………… Human Immunodeficiency Virus
IGME………… Inter-agency Group for Child mortality Estimation
IMCNI…… Integrated Management of Childhood and Neonatal Illnesses
ITN………… Insecticide Treated Net
LRI…………. Lower Respiratory Infection
MDG………… Millennium Development Goal
MIMS…………… Multiple Indicators Monitoring Survey
MOHCW…. Ministry of Health and Child Welfare
NID……… National Immunisation Days
ORS………….. Oral Rehydrating Salts
PMTC…… Prevention of Mother to Child Transmission
RDS………….. Respiratory Distress Syndrome
SIDS…………. Sudden Infant Death Syndrome
UCSF……... University of California San Francisco
UN……………… United Nations
UNICEF………. United Nations
URI…………. Upper Respiratory Infection
USA………….. United States of America
VCT………. Voluntary Counselling and Testing
WHO…………. World Health Organization
ZDHS………… Zimbabwe Demographic and Health Survey
ZEPI……… Zimbabwe Expanded Immunisation Programme

v
DEFINITION OF TERMS
Child- refers to any child below five years including infants.
Marriage- refers to a union between a man and a woman living together as husband and wife.

vi
Table of Contents
DEDICATION ....................................................................................................................... ii
ACKNOWLEDGEMENTS .................................................................................................. iii
ACRONYMS ......................................................................................................................... iv
DEFINITION OF TERMS...................................................................................................... v
LIST OF FIGURES ............................................................................................................... ix
LIST OF TABLES .................................................................................................................. x
CHAPTER ONE .................................................................................................................... 1
INTRODUCTION ................................................................................................................. 1
1.1 Introduction ....................................................................................................................... 1
1.2 Background ....................................................................................................................... 1
1.3 Problem Statement ............................................................................................................ 3
1.4 Justification ....................................................................................................................... 3
1.5 Objective of the study ....................................................................................................... 4
1.5.1 Specific objectives ........................................................................................................ 4
1.6 Methodology ..................................................................................................................... 4
1.7 Organization of the study. ................................................................................................. 4
CHAPTER TWO ................................................................................................................... 5
LITERATURE REVIEW ...................................................................................................... 5
2.1 Global Perspective ............................................................................................................ 5
2.2 Global Levels and Trends ................................................................................................. 7
2.3 North /South Divide .......................................................................................................... 8
2.4 Causes of death in Developed countries ........................................................................... 9
2.4.1 SIDS ............................................................................................................................ 10
2.4.2 Biological disorders .................................................................................................... 10
2.4.3 Birth Asphyxia ............................................................................................................ 11
2.4.4 Accidents ..................................................................................................................... 11
2.4.5 Abuse and negligence ................................................................................................. 12
2.5 Causes of death in Developing countries ........................................................................ 12
2.5.1 Diarrhoea ..................................................................................................................... 12
2.5.2 Acute respiratory infections (ARIs) ............................................................................ 13

vii
2.5.3 Malnutrition ................................................................................................................ 14
2.5.4 Malaria ........................................................................................................................ 16
2.5.5 Measles........................................................................................................................ 16
2.5.6 Neonatal Causes .......................................................................................................... 18
2.6 Sub Saharan Africa ......................................................................................................... 18
2.7 Zimbabwe........................................................................................................................ 19
2.7.1 Levels, Trends and Patterns ........................................................................................ 19
2.7.2 Rural Urban comparison ............................................................................................. 20
2.8 Interventions.................................................................................................................... 21
2.8.1 Zimbabwe Expanded Program of Immunisation ........................................................ 21
2.8.2 Integrated Management of Childhood and Neonatal Illnesses (IMCNI) .................... 22
2.8.3 National Immunisation days (NID) ............................................................................. 22
2.8.4 Other Interventions ..................................................................................................... 22
CHAPTER THREE ............................................................................................................. 23
METHODOLOGY .............................................................................................................. 23
3.1 Introduction ................................................................................................................... 23
3.2 Conceptual framework .................................................................................................... 23
3.2.1 Socio economic determinants ..................................................................................... 24
3.3 Geographical Location of the study ................................................................................ 26
3.4 Target population ............................................................................................................ 27
3.5 Study design ................................................................................................................... 27
3.6 Data collection methods and tools .................................................................................. 27
3.6.1 Survey ......................................................................................................................... 27
3.6.2 Key informant interviews ............................................................................................ 28
3.6.3 Field observations ....................................................................................................... 29
3.7 Data Processing and Analysis ........................................................................................ 29
3.8 Ethical considerations ..................................................................................................... 29
CHAPTER FOUR ............................................................................................................... 30
RESEARCH FINDINGS ..................................................................................................... 30
4.1 Introduction ..................................................................................................................... 30
4.2 Demographic Characteristics of the respondents ............................................................ 30
4.3 Household Characteristics............................................................................................... 34
4.4 Maternal factors .............................................................................................................. 39
viii
4.5 Environmental characteristics ......................................................................................... 47
4.6 Children’s demographic characteristics .......................................................................... 54
4.6.1 Nutrition ...................................................................................................................... 55
4.6.2 Immunisation .............................................................................................................. 57
4. 7 Disease occurrences among children ............................................................................. 61
4.7.1 ARIs ............................................................................................................................ 62
4.7.2 Diarrhoea ..................................................................................................................... 64
4.7.3 Injuries ........................................................................................................................ 66
4.7.4 Malnutrition ................................................................................................................ 68
4.7.5 Malaria ........................................................................................................................ 70
4.7.6 Perceived Health Status of children ............................................................................ 70
4.7.7 Perceived causes of morbidity .................................................................................... 71
4.7.8 Resultant Mortality ..................................................................................................... 72
CHAPTER FIVE ................................................................................................................. 74
DISCUSSION OF FINDINGS, CONCLUSIONS AND RECOMMENDATIONS ........ 74
5.1 Discussion ....................................................................................................................... 74
5.2 Conclusions ..................................................................................................................... 80
5.3 Recommendations ........................................................................................................... 81
5.3.1 Local Level ................................................................................................................. 81
5.3.2 National Level ............................................................................................................. 82
REFERENCES...................................................................................................................... 83
APPENDIX 1 ........................................................................................................................ 87
APPENDIX 2 ..................................................................................................................... 105
APPENDIX 3 ..................................................................................................................... 107
APPENDIX 4 ..................................................................................................................... 108
APPENDIX 5 ..................................................................................................................... 109

ix
LIST OF FIGURES
Figure 2.1 Major causes of death in neonates and children under five globally……………….........6
Figure 2.2 Under- five and infant mortality rates by WHO regions 2003……………….…………..7
Figure 2.3 Global under five mortality trend, 1980-2011………….……………………..................8
Figure 2.4 Comparison between rural and urban CMR trends between 1978 and 2006…………...20
Figure 3.1 Model of the operation of proximate determinants by Mosley and Chen…………........26
Figure 4.3.1 Percentage distribution by number of families living at one address………………...35
Figure 4.3.2 Percentage distribution of respondents by type of toilet used………………………...36
Figure 4.4.1 Percentage distribution of respondents by under-five children per woman……..........41
Figure 4.4.2 Percentage distribution of respondents by duration of pregnancy at first
attendance at ANC……………………………………….……………………………………........42
Figure 4.4.3 Percentage distribution of mothers by VCT experience……………………...............43
Figure 4.4.4 Percentage distribution of respondents by type of delivery…………………………..46
Figure 4.5.1 Percentage distribution of respondents’ perception of sewage system ………………48
Figure 4.5.2 Percentage distribution of respondents’ perception about Council’s response
to burst sewer………………………………………………………………………………….........49
Figure 4.5.3 Picture showing long grass in front of a house……………………………………….50
Figure 4.5.4 Picture showing a pool of raw sewage in front of a house…………………................51
Figure 4.5.5 Picture showing some children playing on garbage dumps……………………..........52
Figure 4.5.6 Percentage distribution of respondents by environmental
problems experienced……………………………………………………………………………….53
Figure 4.6.1 Percentage distribution of children by breastfeeding patterns in
the first six months…………………………………………………………………………………56
Figure 4.6.2 Percentage distribution of children by reason of missing immunization……………..59
Figure 4.6.3 Percentage distribution of children by growth index………………………………....61
Figure 4.7.1 A comparison of disease prevalence between hospital records and
survey results……………………………………………………………………….………….........62
Figure 4.7.2 Percentage distribution of children by respiratory disease experience………….........63
Figure 4.7.3 Percentage distribution of mother’s perception of cause of diarrhoea………………..65
Figure 4.7.4 Percentage distribution of children by injury experience……………………………..67
Figure 4.7.5 Percentage distribution of perceived health status of the children……………………70

x
LIST OF TABLES
Table 2.1 Levels and Trends in the under-five mortality rate by MDG Regions, 1990-2010
(deaths per 1000 live births)…………………………………………………………………..............9
Table 4.2.1 Percentage distribution o respondents by demographic characteristics………...............32
Table 4.2.2 Percentage distribution of respondents by marital status and income………………….33
Table 4.2.3 Percentage distribution of respondents by availability of information channels……….34
Table 4.3.1 Percentage distribution of respondents by type of accommodation…………………….34
Table 4.3.2 Percentage distribution of respondents water availability………………………………37
Table 4.3.3 Percentage distribution of respondents by water treatment methods…………...............37
Table 4.3.4 Percentage distribution of respondents by fuel used for cooking and lighting…………38
Table 4.3.5 Percentage distribution of children by malaria preventive strategies…………..............39
Table 4.4.1 Percentage distribution of women by age and children ever born……………………...40
Table 4.4.2 Percentage distribution of mothers by education and place of delivery………………..44
Table 4.4.3 Percentage distribution of mothers by religion and place of delivery…………………..45
Table 4.4.4 Percentage distribution of mothers’ complication experience………………………….47
Table 4.5.1 Percentage distribution of respondents by method of stool disposal…………………...54
Table 4.6.1 Percentage distribution of children by demographic characteristics……………………55
Table 4.6.2 Percentage distribution of children by the number of meals and snacks taken
per day……………………………………………………………………………………………….57
Table 4.6.3 Percentage distribution of children by immunization received…………………………58
Table 4.6.4 Percentage distribution of fully immunised children by mother’s
socio economic status……………………………………………………………………………….60
Table 4.7.1 Percentage distribution of children who suffered from ARI by mother’s
socio-economic background………………………………………………………………………...64
Table 4.7.2 Percentage distribution of children who suffered from diarrhoea by mother’s
socio-economic background………………………………………………..………………………..66
Table 4.7.3 Percentage distribution of children who suffered from injury by mother’s
socio-economic background……………………………………………..…………………..............68
Table 4.7.4 Percentage distribution of children by malnutrition experience………………………..69
Table 4.7.5 Percentage distribution of children who suffered from malnutrition by
mother’s socio-economic background………………..……………………………………………...69
Table 4.7.6 Percentage distribution of respondents’ perception of local health system….................72
Table 4.7.7 Percentage distribution of respondents’ perception of cause of morbidity……………..73

xi
Table 4.7.8 Percentage distribution of children by age and cause of death…………………………74

1
CHAPTER ONE
INTRODUCTION
1.1 Introduction
In 2000 Zimbabwe signed the United Nation Millennium Declaration along with 188 other
countries. The declaration includes eight Millennium Development Goals (MDGs) with 21
corresponding targets and 60 indicators for tracking progress. MDG No.4 aims at reducing
global child mortality by two thirds from an incidence of 93 deaths per 1000 live births in
1990 to 29 deaths per 1000 live births by 2015 (UN, 2000). Zimbabwe, in its indicators seeks
to reduce child mortality from 81/1000 in 1990 to 27/1000 by 2015 (MDG Report, 2010).
Many countries still lag behind in meeting the MDG targets, and Zimbabwe is one of them.
Rates of child morbidity and mortality have remained unacceptably high in Zimbabwe. The
current under five mortality rate stands at 89/1000 according to the World Bank (2011) and
86/1000 according to Multiple Indicator Monitoring Survey (MIMS, 2009). It is evident that
Zimbabwe will not meet the MDG targets in the remaining four years. The situation has been
worsened by the current state of the economy. The economic situation has increased poverty
and destroyed the public health system while reducing the standards of living including
nutrition. An understanding of the factors underlying high child mortality is thus necessary
given the current state of the economy.
1.2 Background
Nearly nine million children under the age of five still die every year throughout the world
(UNICEF, 2007). Global trends show that during the pre-transition period when men had
little control of the environment, child morbidity was very high with only about two thirds of
babies born surviving to their first birthday, and only about half of them living to their fifth
birthday (Weeks, 1996).
During the Modern Rise in population, McKeown (1976) and Weeks, (1996) emphasized that
improved nutrition resulting from increased agricultural production helped to improve health
in adults and children alike. Close contact with animals encouraged the spread of infectious

2
diseases. Little could be done to improve child morbidity and mortality until men became
more sedentary and began agricultural activities (ibid). However, Razzell (1974) emphasized
inoculation and improved hygiene as the main factors for improved mortality.
Preston (1978) on the other hand emphasized sewage and water improvements as factors
underlying mortality decrease. Although the underlying causes of mortality improved
globally, child morbidity and mortality levels remain at unacceptably high levels in most of
the developing countries including Zimbabwe where child mortality still at 86/1000 live
births (MIMS, 2009). In Zimbabwe household contamination is still a big problem. Piped
water is provided to a minority of households. Only 36 percent of households have water
piped water. Sanitation measures are still not adequate in Zimbabwe (Kembo and Van
Ginneken, 2009). Improvements in hygienic sanitation facilities lower mortality through the
mechanism of less exposure of children to contamination making them less susceptible to
disease and eventually death. Only 40 percent of households in Zimbabwe have access to
improved toilet (ibid)
In 1974 UNICEF introduced the Expanded Program on Immunization (EPI) globally. The
EPI’s goal was to ensure that by 2010 routine immunization of children less than one year of
age reached 90% nationally, and at least 80% coverage in every district or equivalent
administrative unit (UNICEF, 2010). When the EPI was introduced in 1974, less than 5% of
the world’s children were immunized against the six killer diseases during their first year of
life. Today, 79% receive these lifesaving vaccinations and increasing numbers are also
protected by vaccines such as hepatitis B worldwide (ibid).
A trend analysis of child mortality in Zimbabwe shows that mortality was on a declining path
from 1960 to 1990. The World Bank (2011), observed the following trends about child
mortality; 155/1000 live births in 1960, 121/1000 live births in 1970, 104/1000 live births in
1980, 81/1000 live births in 1990. , 106/1000 live births, 116/1000 live births in 2000 and
89/1000 live births by 2009. However, MIMS (2009) reported a small increase in the under-
five mortality rate of 86 per 1,000 live births compared to 82/ 1000 live births in 2005 a
figure which is unacceptably high, and way above the MDG expectations of 27/1000 live
births. Comparisons between rural and urban areas show higher morbidity and resultant
mortality in rural areas of 31/1000 live births compared to 19/1000 live births in urban areas
(World Bank, 2011).
3
Today, child morbidity is on the increase as a result of the country’s economic challenges.
According to UNICEF (2011) the number of children dying under the age of five has risen by
20% since 1990 (baseline year for the MDGs). Poor living conditions and a poor health
delivery system have contributed immensely to the current problems of child morbidity and
mortality. Hence, children continue to die of what the UN considers preventable diseases.
1.3 Problem Statement
Zimbabwe is one of the countries that are far from attaining the MDG 4 target of 27/1000 live
births by 2015 (Inter agency Group for Mortality Estimation, 2011). It is one of the Sub
Saharan African countries that have suffered a reversal in under-five mortality due to HIV
and AIDS, malnutrition and malaria. As a result, child mortality has remained high. The rate
of child mortality is currently at 89/1000 live births against a target of 27/1000 live births by
2015. Granted that the rate of child mortality is still unacceptably high despite many
interventions by the government and private health sector, it is important that more effort be
made to reduce child mortality both at local and national levels. It is the scope of this study to
assess the underlying causes of child morbidity in Katanga by examining demographic,
environmental and socio-economic factors and to make recommendations for workable
solutions.
1.4 Justification
National Surveys such as the Zimbabwe Demographic and Health Survey (ZDHS) and MIMS
cover large areas and tend to generalize findings. This study is specific to an area hence it
will have practical relevance. National surveys are quantitative in nature hence they only
show the extent of the problem without explaining the underlying causes of the problem. This
study will triangulate quantitative and qualitative research designs in order to provide a
balanced assessment of the underlying factors to child morbidity. The quantitative aspect of
the research will provide information on the extent of the problem. The qualitative aspect of
the research will give an insight into the underlying causes of morbidity and resultant
mortality.
It is important to note that when child mortality is reported in Zimbabwe, only the biological
causes of death are captured. This study aims to bring out the underlying socio economic
factors that result in disease and death among children. The information can be used to design
preventive measures in order to minimize morbidity.

4
This study is being carried out at a time when the country is facing economic challenges. The
findings of this study will add up to the information pool that is available, and will be useful
in finding affordable and sustainable solutions that are relevant during these difficult times.
1.5 Objective of the study
The broad objective of the study is to assess the underlying causes of morbidity among
under- five children in Katanga Township.
1.5.1 Specific objectives
The specific objectives of the study are:
To examine demographic determinants of morbidity in children under five;
To identify environmental determinants of child morbidity;
To evaluate the socio-economic determinants of child morbidity; and
To make recommendations for policy and interventions.
1.6 Methodology
The study triangulated quantitative and qualitative research designs. Quantitative data was
obtained from a survey that was carried out in Katanga Township. Hospital records also
provided another source of quantitative data. Survey data was collected using a structured
questionnaire. Qualitative data was obtained from structured key informant interviews with
health and environmental personnel from local hospitals and city council. An environmental
assessment was done through field observations to assess the physical environment in the
Township.
1.7 Organization of the study.
The research is organized in five Chapters. Chapter one introduces the study through the
background, problem statement and justification of the study. The introductory chapter also
gives the broad and the specific objectives of the study. Chapter two carries the literature
review. It gives an insight into what other authors have written on the subject of child
morbidity. Chapter three describes the methodology used. This includes the research design,
sampling methods, data collection methods and ethical considerations. Chapter four presents
the findings while Chapter five discusses the findings.
5
CHAPTER TWO
LITERATURE REVIEW
2.1 Global Perspective
In 2002, approximately 10 million children died globally before they reached the age of five
(WHO, 2003; UNICEF, 2004). These children died mainly from diseases such as neonatal
causes (37%), pneumonia (19%), diarrhoea (18%), malaria (8%), and measles (4%) while
malnutrition, injuries and HIV and AIDS accounted for the remaining 14% (ibid). The rate
of child mortality has however gone down since the inception of the MDGs in 2000.
According to IGME (2011), the rate of decline of under-five mortality accelerated from 1, 9%
a year between 1990 and 2000 to 2, 5% a year between 2000 and 2010. It however remains
insufficient to attain the required MDG rate of about 4, 4% per annum. This is particularly
true for sub Saharan Africa, Oceania, parts of Central and Southern Asia.
According to WHO (2010), 7, 6 million children under five still die each year mainly due to
four major causes namely pneumonia, diarrhoea, malaria and neonatal causes. Over 40% of
deaths under the age of five take place during the neonatal period mainly from preterm birth,
birth asphyxia and infections. Pneumonia and diarrhoea have emerged as top causes of post
neonatal deaths at 13% and 14% respectively (Figure 2.1). Malaria also contributes
significantly and it is estimated to cause a 9% of all child deaths in the world (IGME, 2011).
The disease burden from pneumonia is so high that it has been reported that one child dies
every second, 5500 children die every day and two million children die every year throughout
the world due to pneumonia (PneumoAction, 2011).

6
Figure 2.1: Major causes of death in neonates and children under five globally.
Source: World Health Statistics, WHO, 2010
It is interesting to note that about three quarters of all deaths occur in Africa, Eastern
Mediterranean and South –East Asia (Figure 2.2). Within countries, child mortality is higher
in rural areas and among poorer and less educated families (W.H.O, 2011). The lowest rates
of child mortality are found in Europe and the Americas owing to their high standards of
living.

7
Figure 2.2: Under five and infant mortality rates by WHO region, 2003.
Source: WHO Statistics, 2005
2.2 Global Levels and Trends
Globally, there has been substantial progress towards achieving MDG 4 (Figure 2.3). The
number of under five deaths worldwide has declined by 35% from111 deaths per 1000 live
births to 51/1000 live births between 1980 and 2011. This meant a reduction from more than
12million child deaths in 1990 to 7.6 million deaths in 2010 (WHO, 2011).
Although there has been a noticeable reduction of under-five mortality, the decline has not
been uniform across time and regions. Despite an overall decline in child mortality over the
past three decades, the gap between developing regions has widened. The better off countries
in the developing regions are improving at a fast rate while the poorer countries are moving at
a slower rate, stagnated or even reversed (WHO, 2003).

8
According to the W.H.O (2003), there are 14 countries in which child mortality has risen
since 1990 and eight of them are in Sub Saharan Africa. However, UNICF (2004) puts the
number at ten Sub Saharan countries namely Botswana, Zimbabwe, Swaziland, Kenya,
Cameroon, Cote D’Ivoire, South Africa, Rwanda, Zambia and Tanzania. The highest reversal
rates between 1990 and 2002 have been noted in Botswana with -5.3, Zimbabwe with -3.6,
Swaziland with -2.5, Kenya with -1.9 and Cote D’Ivoire with -1.1.
According to IGME (2011), under- five deaths are increasingly concentrated in Sub Saharan
Africa. In Sub Saharan Africa and Asia children die at the rate of 1 in 9 children, a rate which
is more than 16 times the average in developed countries (1 in 152 children). The share of
child deaths in the rest of the world dropped from 31% in 1990 to 17% in 2011.
Figure 2.3 Global under-five mortality trend, 1980-2011 and gap for achieving the
MDG 4 target.
Source: World Health Organisation, 2012
2.3 North /South Divide
A child’s chance of survival depends on where he or she is born. In 2002, seven of every
1000 children born died before reaching their fifth birthday in industrialised countries
UNICEF, 2003, 2004). In south Asia, 97 out of 1000 died before reaching five while in sub
Saharan Africa, under five mortality was 174 out of every 1000 live births a rate almost 25
times that of industrialised countries (ibid). It is important to note that almost 4 million of the
child’s deaths occurred in the neonatal period (Black, Morris and Bryce, 2003).

9
Developed regions have low child mortality rates and are on track in the progress to meet the
MDG targets (Table 2.1). Developing regions in general have made insufficient progress
towards attaining the MDG target. It is however interesting to note that North Africa and
Eastern Asia are on track towards meeting the MDG goals. Sub-Saharan Africa, Southern
Asia and the Oceania have failed to attain sufficient progress (IGME, 2011).
It is estimated that half of under- five deaths occur in only five countries namely India,
Nigeria, Democratic republic of Congo, Pakistan and China (IGME, 2011). This shows the
extent of the contribution of developing countries towards global child mortality. Over 70%
of these deaths occur within the first year of life (ibid).
Table 2.1: Levels and trends in the under-five mortality rate, by Millennium
Development Goal region, 1990-2010(deaths per 1000 live births)
Region 1990 1995 2000 2005 2009 2010 MDG
Target
2015
%
Decline
1990-
2010
Av.year
ly
decline
Rate
(%)
Prog. to
MDG 4
World 88 82 73 65 58 57 29 35 2.2 Insufficient
Developed Regions 15 11 10 8 7 7 5 53 3.8 On track
Developing regions 97 90 80 71 64 63 32 35 2.2 Insufficient
Northern Africa 82 62 47 35 28 27 27 67 5,6 On track
Sub Saharan Africa 174 168 154 138 124 121 58 30 1.8 Insufficient
Eastern Asia 48 42 33 25 19 18 16 63 4.9 On track
Southern Asia 117 102 87 75 67 66 39 44 2.9 Insufficient
Oceania 75 68 63 57 53 52 25 31 1.8 Insufficient
Source: IGME, 2011
2.4 Causes of death in Developed countries
The health delivery systems and living standards in the North are usually of a high standard.
The probability of a child dying from infectious diseases is very low at about 7/1000 (IGME,
2011). According to Al-nagger (2008), leading causes of death among children in developed
countries are congenital anomalies, Sudden Infant Death Syndrome (SIDS), Respiratory
Distress Syndrome (RDS), accidents, bacterial sepsis of new-born, diseases of the circulatory
disorders and intrauterine hypoxia and birth asphyxia.

10
2.4.1 SIDS
Sudden Infant Death Syndrome (SIDS) is a leading cause of death for infants between one
month and one year in developed countries. It is the sudden death of an infant that is
unexpected by medical history and remains unexplained after a thorough forensic autopsy
and a detailed death scene investigation. An infant is at the highest risk of SIDS during sleep
which is why it is sometimes referred to by the terms cot bed death or crib death. Causes of
SIDS are not known (Kids Health, 2002).
Risk factors include smoking, drinking and drug use during pregnancy, poor prenatal care,
prematurity or low birth weight, mothers younger than 20 years, tobacco smoke exposure,
overheating from excessive sleepwear and stomach sleeping. Most deaths occur between 2
and 4 months of age and incidence increases during cold weather (Kids Health, 2002).
2.4.2 Biological disorders
Biological disorders such as congenital anomalies, cerebrovascular diseases, and respiratory
disorders such as asthma are important causes of morbidity and mortality for under five
children in the developed countries (Taussig, 2008).
2.4.2.1 Congenital Anomalies
A congenital anomaly is a physical, metabolic or anatomic deviation from the normal pattern
of development that is apparent at birth or detected during the first year of life. These can
result in conditions such as Down’s syndrome, Wilm’s tumour and spinal bifida (Gale
Encyclopaedia of Public Health, 2002).Congenital anomalies of the heart have the highest
risk of death in infancy accounting for 28% of infant’s deaths. Chromosomal and respiratory
anomalies account for 15% while brain anomalies account for about 12 % (Taussig, 2008).
According to Czeizel (2005), causes of congenital abnormalities can be classified into three
main groups namely genetic, environmental and complex (multi-factorial). Genetic causes
include chromosomal aberrations such as Down’s syndrome and Mendelian single-gene
defects. The proportion of genetic congenital anomalies is estimated to be about 25 % of
total congenital abnormalities. Environmental causes which includes infectious diseases e.g.
rubella, maternal diseases such as diabetes mellitus or diseases with high fever, teratogenic
drugs, alcohol, smoking and environmental pollutants. The proportion of environmental
origin may be about 15% of total congenital abnormalities. Complex (multi-factorial) and

11
sporadic congenital anomalies are estimated to be about 60% of total congenital
abnormalities.
2.4.2.2 Cerebrovascular Diseases
Cerebrovascular disease includes a large group of conditions in which the arteries in the
brain, or those connected to the brain, are defective. Cerebrovascular disorders are among the
top ten causes of death in children (Lynch, 2004). According to NHS Encyclopaedia, 2011,
cerebrovascular diseases are less common in children than in adults and symptoms include
high fever, fits, seizures, nausea, and vomiting and vision loss.
2.4.2.3 Respiratory Distress Syndrome (RDS)
According to Mayo Clinic (2010), infant RDS is an acute lung disease present at birth which
usually affects premature babies. Acute RDS occurs when fluid builds up in the tiny elastic
air sacs (alveoli) in the lungs. More fluid in the lungs results in less oxygen reaching the
blood stream depriving organs of the oxygen they need to function. It manifests with severe
shortness of breath as the main symptom. The risk of death is relatively high; approximately
20% of all neonatal deaths and those who survive may experience a lasting damage to their
lungs (UCSF, 2004).
2.4.3 Birth Asphyxia
Birth asphyxia occurs when a baby does not receive enough oxygen before, during and after
birth .It is caused by inadequate oxygen levels in mother’s blood due to heart or respiratory
problems or lowered respiration caused by anaesthesia, low blood pressure in the mother and
placental abruption or compression of the umbilical cord (UCSF, 2001).
The symptoms in the baby before birth are abnormal heart rate and increased acid level in
baby’s blood. At birth, the baby can exhibit a bluish or pale skin colour, low heart rate, weak
muscle tone and weak cry, gasping and breathing. The disease often leads to death in babies
in developed countries (ibid).
2.4.4 Accidents
Accidents are the major contributor of unintentional deaths in children. Motor vehicle
accidents, poisoning, drowning, falls, electrocution and fires are major causes of death among
children above one year (Centre for Child Death Review, 2010).

12
2.4.5 Abuse and negligence
Child abuse and neglect contribute greatly to the death of children in the developed countries.
In the USA alone, close to 2000 children die of abuse and neglect (Centre for Child Death
Review, 2010). Of those children, 86% are under the age of six and half are infants. Risk
factors include children under the age of five, parents below that age of thirty, low income or
single parent homes, lack of stable childcare and substance abuse among caregivers (ibid).
2.5 Causes of death in Developing countries
Infectious and parasitic diseases remain the major killers of children under five in the
developing countries (WHO, 2009). Communicable diseases still present seven out of ten
causes of child deaths and account for about 60% of all children deaths (ibid). According to
International Medical Volunteers (2011), severe poverty is the root cause of the high
mortality rates in the developing world. Poverty results in malnutrition, overcrowded living
conditions, inadequate sanitation, and contaminated water. Routine vaccination is often
unavailable for both children and adults, and basic clinical care for the acutely ill is in short
supply. Thus, poverty creates a fertile environment for infectious and parasitic diseases.
Poverty also leads to illiteracy and inadequate education. Deficient education, especially of
females, is closely correlated with poor child health in developing countries (ibid).
Health delivery is often of very poor quality in both public and private sectors in low income
countries. For instance, the W.H.O ranked the performance of health systems in its World
Health Report 2000 taking into account both health status indicators and specific systems
indicators such as financing and responsiveness. Of 191countries in the survey, save for a few
exceptions, most countries in Sub-Saharan Africa ranked in the bottom 50% on the
performance of health systems. (Sekhiri, 2006). This is the reason why diseases which are
easily treated in developed countries cannot be managed in developing countries. Resultantly,
children in developing countries die of mainly infectious and parasitic diseases such as
diarrhoea, acute respiratory infections, malaria, malnutrition and measles, perinatal causes,
HIV and AIDS, sometimes referred to as “diseases of the poor” (IMVA, 2011).
2.5.1 Diarrhoea
Diarrheal diseases are among the leading cause of infectious disease deaths in the under- five
group and it is responsible for about 40% of all hospital admissions worldwide

13
(UNICEF/WHO, 2009). Diarrhoea is commonly defined by an increase in the frequency and
fluidity of bowel movements relative to the usual pattern of each individual (Black, 1984).
Diarrheal diseases are caused by ingesting certain bacteria, viruses and parasites. They are
transmitted via the faecal-oral route and are common in areas lacking adequate sanitation
systems. The disease is particularly harmful to children who have vitamin A deficiencies and
other infections that render them vulnerable to dehydration and electrolyte imbalances.
Diarrheal diseases can be spread through contaminated food, water and utensils and
unwashed hands (ibid).
Rotavirus is the most common cause of diarrhoea in children (Mayo Clinic, 2010). It causes
viral gastroenteritis normally referred to as stomach flu. Other common bacteria are shigella
and the e-coli bacteria that spread through contaminated food. Measles is an important cause
of death from diarrhoea, accounting for 10% of the total. Other causes of diarrhoea include
lactose intolerance, celiac disease and inflammatory bowel disease. (Gorge quoted in IMVA,
2010).
Diarrhoea can be easily treated with Oral Rehydration Salts (ORS) and prevented through
access to clean water, safe drinking water and proper hygiene and sanitation such as hand
washing and proper disposal of human waste (UNICEF, 2005). However, most children end
up suffering considerable dehydration which in turn leads to death if not treated promptly. In
2004, over 2.1 million people died from diarrheal diseases including rotavirus and cholera.
More than 80% of the deaths occurred in children under five (ibid).
Symptoms of diarrhoea include abdominal cramping or pain, urgent need to pass stool, faecal
incontinence, poor appetite, nausea and vomiting and presence of mucus or undigested food
in faeces (Mayo Clinic, 2010).
2.5.2 Acute respiratory infections (ARIs)
Acute respiratory infections particularly Lower Respiratory Tract Infections (LRTI) are the
leading cause of death among children under five and are estimated to be responsible for
between 1.9million and 2.2million childhood deaths globally (Madhi and Klugman, 2006).
ARIs are classified into two broad classes namely Upper respiratory infections (URI ) and
Lower Respiratory Infections (LRI). According to Simeos et al, (2009), URIs are more
14
common but less serious and they include infections of the nose, throat and ear. The usual
manifestations are cough, common cold and fever sometimes with associated nasal blockage.
Viral infections are more common in URIs than bacterial infections which make them less
life threatening.
Lower respiratory infections (LRI) on the other hand involve epiglottis, trachea and the
alveoli. They are more dangerous and even life threatening. Epiglottitis is potentially fatal
because the swelling can result in obstruction of air flow into lungs. The condition manifests
as fever, drooling of saliva and a noise when the child breathes (ibid). Among the most
common and dangerous LRIs is pneumonia.
2.5.2.1 Pneumonia
Pneumonia is one of the leading causes of infectious diseases deaths among children in
developing countries and it accounts for about 14% of all child deaths in children under five
(WHO, 2003). According to PneumoAction (2011), pneumonia is a lung inflammation
caused by bacterial or viral infection, in which the air sacs fill with pus and may become
solid. Inflammation may affect both lungs (double pneumonia) and only one (single
pneumonia). Pneumonia together with bronchitis and bronchiolitis, otherwise known as acute
lower respiratory infections account for a total of 20% of all child deaths (WHO, 2008).
Causative organisms are classified as bacterial and viral. The most common types of bacteria
that cause pneumonia are the streptococcus pnumoniae (pneumococcus) and Haemophilus
influenza ( Simoes et al, 2009). Low birth weight, malnourished and non-breastfed children
and those living in overcrowded conditions are at higher risk of getting pneumonia and dying
from it (ibid). In developing countries, the case fatality rate in children with viral pneumonia
ranges from 1.0 to 7.3% while bacterial pneumonia ranges from 10 to 14 % (ibid).
2.5.3 Malnutrition
According to WHO (2000), malnutrition is the underlying contributing factor in over one
third of all child deaths. It is a condition that develops when the body does not get the proper
amount of proteins, carbohydrates, vitamins and other nutrients it needs to maintain healthy
tissues. Under nutrition on the other hand, is a consequence of consuming inadequate energy
and other essential nutrients or using them more rapidly than they can be replaced (Bender,
15
2005). Malnutrition can be caused by an unbalanced or insufficient diet, or by medical
conditions such as infection that affect the digestion of food or absorption of nutrients from
food. The most common indicator of long-term under nutrition during childhood is a child’s
failure to reach genetic potential in height (Wilson, 2009).
Health or nutritional status of a child is usually assessed in three ways: measurement of
growth and body composition (anthropometric indicators such as height, weight, arm
circumference) and skin fold thickness (WHO Guidelines, 2005). According to W.H.O
(2000) severe malnutrition is often found in developing countries and it is often characterised
by infections and disease. More than 70% of children with protein-energy malnutrition live in
Asia, 26% live in Africa, and 4% in Latin America and the Caribbean. WHO (2000) also
identified malnutrition as the single most important risk factor for disease. Malnutrition
reduces a child’s resistance to disease by weakening the immune system, rendering the child
both more vulnerable to infection and less able to fight it. The vicious cycle of malnutrition
and infection leads to ever increasing weakness and often to premature death (ibid).
Worldwide, poverty and lack of food are the primary reasons why malnutrition occurs (Fyke
and Kaczkowski, 2006). Families of low-income households do not always have enough
healthy food to eat. When there is a household food shortage, children are the most
vulnerable to malnutrition because of their high energy needs (ibid).
According to Wiki Answers, 2011, symptoms of malnutrition vary, depending on what
nutrients are deficient in the body. Unintentionally losing weight may be a sign of
malnutrition. Children who are malnourished may be skinny or bloated and may be short for
their age (stunted). Their skin is pale, thick, dry, and easily bruised. Rashes and changes in
pigmentation are common. Hair becomes thin, tightly curled, and easily pulled out. Joints
ache and bones are soft and tender and gums bleed. The tongue may be swollen, or shrivelled
and cracked. Visual disturbances include night blindness and increased sensitivity to light and
glare. In some cases anaemia may result from malnutrition (ibid).
Malnutrition can have severe long term consequences. Children who suffer from malnutrition
are more likely to have slowed growth, delayed development, difficulty in school and high
rates of illness and may remain malnourished even in adulthood (Gale Encyclopaedia of Food
and Culture, 2002).

16
2.5.4 Malaria
Malaria infects 350-500 million people worldwide each year, mostly children in Africa
(UNICEF, 2005). It accounts for one in five of all childhood deaths and it contributes greatly
to anaemia among children, a major cause of poor growth and development. Malaria
infection in pregnant women causes severe anaemia and other illnesses in the mother and
contributes to low birth weight among new born infants. Low birth weight (LBW) is one of
the leading risk factors for infant mortality and sub-optimal growth and development (ibid).
Malaria is caused by a parasite known as plasmodium. The infection is transmitted to people
through bites from infected mosquitoes. Symptoms can be classified into three categories in
children. In the early stages of malaria, children may display irritability, drowsiness, loss of
appetite and difficulty in sleeping (Tramilton, 2010).
Secondary symptoms include chills that develop into fever characterised by extreme fast
breathing. When the fever subsides, the body temperature rapidly returns to normal and the
child experiences extreme sweating .In the third stage, the symptom repeat often going into a
pattern of alternating fever and chills for approximately two days (UNICEF, 2005, Tramilton,
2010). Other common symptoms in children include nausea, headaches, body pains, enlarged
spleen and in some case it can affect the brain and a child might lose consciousness or
experience convulsions (ibid).
Malaria is preventable and treatable by simple measures. Sleeping under an Insecticide
Treated Nets (ITNs) can reduce overall child mortality by 20% (UNICEF, 2007). Prompt
access to effective treatment when the disease manifests can further reduce deaths (UNICEF
2007, WHO 2009). Unfortunately, many African children continue to die from malaria as
they do not sleep under ITNs and are unable to access lifesaving treatment within 24hours of
the onset of symptoms. Recent data presented by UNICEF (2009), reveal low coverage of
ITNs, only around 5% across Africa.
2.5.5 Measles
Measles and pertussis are still important causes of acute respiratory mortality. In 2008 there
were 164 000 measles deaths globally; more than 95% occurred in low income countries with
weak health infrastructures (WHO, 2012). Measles is a highly contagious disease caused by a
virus of the paramyxovirus family. The measles virus normally grows in the cells that line the
17
back of the throat and lungs and is only found in humans. It is transmitted by coughing and
sneezing, close personal contact with infected nasal or throat secretions (ibid).
Measles occurs in stages starting with a high fever which begins about 10 to 12 days after
exposure to the virus. The fever usually lasts four to seven days. Fever is often accompanied
by a runny nose, persistent cough, inflamed eyes (conjunctivitis) and sore throat (Mayo
Clinic, 2008). After several days, a rush usually erupts on the face and upper neck and it
spreads over three days eventually reaching the hands and feet. The rash lasts for five to six
days then it fades off. On average, the rash occurs 14 days after exposure to the virus. Those
who recover from measles become immune for the rest of their lives (WHO, 2012).
According to WHO Fact Sheets (2012), severe measles is more likely among poorly
nourished young children especially those with insufficient vitamin A or those whose
immune systems have been weakened by HIV and AIDS or other diseases. There are
complications associated with measles and the most common types include blindness,
encephalitis (an infection that causes brain swelling), severe diarrhoea and related
dehydration, ear infections or severe respiratory infections such as pneumonia (WHO, 2012).
Consequently, about 10% of measles cases result in death among impoverished populations
with high levels of malnutrition and lacking adequate health (ibid)
Severe cases of measles can be treated by rehydration by administering ORS, ensuring a good
diet and antibiotics to treat eye and ear infections and pneumonia. According to W.H.O
(1999) regulations, all children diagnosed with measles in developing countries should
receive two doses of vitamin A supplements, given 24hours apart to prevent eye damage and
blindness.
Measles continues to be a serious problem in the developing world for many years, because
of its high contagiousness, and because 20 to 30% of cases in the crowded urban areas of sub-
Saharan Africa occur in children less than 9 months of age, for whom the current vaccine is
only about 50% effective (WHO, 2012).
18
2.5.6 Neonatal Causes
Another important cause of death in the under-five age group is neonatal tetanus, resulting
from unhygienic childbirth practices, especially non-aseptic cutting of the umbilical cord, and
from lack of maternal tetanus immunization. According to WHO Statistics (2005), neo-natal
causes constitute about 41% of all deaths in under five children. Three major causes of
neonatal deaths in developing countries are infections such as sepsis, pneumonia, tetanus and
diarrhoea making up 36% of total neonatal deaths. Birth asphyxia contributes 28%, preterm
births contribute 23% while other causes constitute 13%.
2.6 Sub Saharan Africa
It is estimated that one in every six children born in Sub Saharan Africa dies before reaching
the age of five. Malaria, diarrhoea and respiratory diseases particularly pneumonia are still
major causes of mortality in sub-Saharan Africa (Macro Int, 1994 quoted in Bakwin and
Modise, 2004). Malaria still kills about 8% of the children, diarrhoea killing about 18%,
pneumonia about 19% while neonatal deaths still account for about 37% of deaths in children
under five (UNICEF, 2004).
An important cause of morbidity which emerged in the mid-1980s is HIV and AIDS.
According to NCBI (2004), mother to child transmission of HIV ranges between 15 and 45%
and up to 20% result from breast feeding. The Joint United Nations Program on HIV and
AIDS (UNAIDS 2000), estimated that 590 000 new paediatric HIV cases were recorded
which translates to 10% of total new infections. Almost all of them were mother to child
transmission. UNAIDS (2000) also concluded that in East and Southern Africa, infant and
child mortality rates have become two thirds higher than they would have been in the
absence of HIV. These figures show the extent of the effect that maternal factors have on
child morbidity and mortality.
Benson and Shekar (2006) reiterate that globally, progress has been made in reducing under
nutrition among children under five. However, the numbers of undernourished children in
Africa has actually increased in the 1980s. Between 1980 and 2000, the number of stunted
children increased by 12 million. It is estimated that between 1985 and 1990, 4.1 million

19
children died annually before their fifth birthday and were deprived of the most basic
requirements for a healthy life (Ewbank et al, 1993).
Poor living conditions and substandard health delivery systems still continue to pose a health
hazard for children under five. Children living in houses with poor ventilation, rustic floors
and unsafe windows are more likely to suffer an accident, a disease or early death (WHO,
2003). W.H.O further identified a set of risk factors for mortality among them being unsafe
drinking water (one of the cause of diarrheal disease), malnutrition and indoor smoke from
burning solid fuels (important cause of respiratory conditions). Access to water and
sanitation is a large element of the definition of decent safe housing and it has large direct
and indirect impacts on children’s health. WHO ( 2002) estimated that water related diseases
account for 4% of all deaths and 5, 7% of the total disease burden in children. In Africa,
most children are exposed to risks associated with the above mentioned factors.
2.7 Zimbabwe
Zimbabwe is one of the countries that are making insufficient progress towards attaining the
MDG 4 targets. A trend analysis of child mortality shows a reversal of the gains that were
accrued in the 1980s in reducing child mortality. According to the MOHCW Health Profile
(2007) and UNICEF (2009) leading causes of childhood deaths in Zimbabwe like most
countries in Sub- Saharan Africa have remained the same. Among them are respiratory
infections (13%), malaria (3%), diarrhoea (9%), AIDS (21 %), neonatal complications (29%)
while malnutrition is an underlying cause in most of the deaths.
2.7.1 Levels, Trends and Patterns
World Bank statistics (2011) show that child mortality was on the decrease in Zimbabwe
from 1970 to 1990. It decreased from 121/1000 in 1970 to 81/100 by 1990. However, in 1995
it rose again to 106/1000 in before declining to 82/1000 in 2005 (MOHCW, 2007). The
MIMMs survey report of 2009 reported an increase in the under-five mortality rate to
86/1000 live births compared to 82/1000 in 2005. The rise in mortality is mainly attributed to
the direct and indirect impact of the HIV and AIDS epidemic and the concomitant rise in
poverty levels.
Maternal factors have also contributed to the rise in child mortality. A low percentage of
women, 34%, were tested for HIV during pregnancy with more rural women not being tested.

20
Hence they have missed out on the opportunity to reduce or eliminate vertical transmission of
HIV. As a result, there has been a subsequent rise in child mortality from HIV infection
(Maternal and Perinatal Mortality Study, 2007). Furthermore, child care practices in the
country are currently not optimal because of household constraints such as low income, food
insecurity, lack of mosquito nets, lack of access to safe water and poor access to effective
health services (ibid).
Low birth weight as a result of nutrient deficiency of the mother during pregnancy has been
on the increase in Zimbabwe. According to WHO (2007), the number of infants with low
birth weight increased from 2, 1% in 1988 to 11% in 2005/6. Those suffering from moderate
or severe underweight increased from 12% in 2003 to 16% by 2009. This could be attributed
to the deteriorating economic conditions in the past decade. Most families could not afford
decent meals due to economic hardships.
Socio-economic factors also play a major role in determining child morbidity and resultant
mortality. In Zimbabwe, household contamination is still a big problem. Piped water is
provided to a minority of households. Only 36% of households have piped water while 5%
use a public tap. Only 40% of households in Zimbabwe have access to improved toilet
facilities not shared with other households (CSO, Macro Int. 2007).
2.7.2 Rural Urban comparison
Comparisons between rural and urban areas show that infant and child mortality is higher in
rural areas than in urban areas. According to Kembo and Van Ginneken (2009), living in
rural areas increases the risk of childhood mortality by 26% relative to living in urban areas.
UNICEF (2011) reported that half of the rural women are giving birth at home due to
unaffordability of hospital fees. Rural child mortality rate was at 31/1000 compared to
19/1000 in urban areas it was (MIMS, 2009). A trend analysis of CMR for rural and urban
areas shows that rural mortality rates are always higher than those of urban areas though the
graph follows the same pattern (Figure 2.4).
According to MOHCW (2007), there was a general decrease in CMR in the decade between
1978 and 1988 mainly as a result of Health for all policies instituted by the government
during independence. Between 1988 and 1999 CMR was increasing as the economic situation

21
started to deteriorate. After 1999, CMR started to decrease again though it was short lived as
the socio economic situation further deteriorated. Poor health services and living conditions
in rural areas resulted in higher CMR than in urban areas where conditions are better (ibid).
Figure 2.4: Comparison between rural and urban CMR trends between 1978 and 2006.
Source: MOHCW 2007 Health profile.
2.8 Interventions
The Ministry of Health and Child Welfare has put in place Health Programs aimed at
reducing the unacceptably high child morbidity and mortality rates.
2.8.1 Zimbabwe Expanded Program of Immunisation
Zimbabwe introduced, the Zimbabwe Expanded Program of Immunization (ZEPI) in 1982
based on the UNICEF initiative of 1974. The aim of the program was to increase coverage of
all ZEPI vaccines to 90% by the year 2000 (MOHCW). By 2001, coverage for BCG was
60%, it rose to 75% in 2006 then fell to 70% in 2008. DPT3 followed the same trend with
coverage of 30%, then 70% and 65% in 2001, 2006 and 2008 respectively. The ZEPI has
been faced with challenges including fragmentation of responsibility, lack of funding,
outreach problems as well as gas shortages in recent times. (MOHCW, 2007). ZDHS (2005-
6) reported that 21% of children in the 12-23 months age group had not received any
vaccinations at all. The MIMS survey of 2009 recorded only 49% of children aged 12-23

22
months being fully immunised. However, the investment in ZEPI has led to the elimination of
maternal and neonatal tetanus and polio.
2.8.2 Integrated Management of Childhood and Neonatal Illnesses (IMCNI)
IMCNI was adopted and institutionalised in 1999 to address child health problems and to
ensure maximum development of the child with the aim of reducing child morbidity and
mortality. The Program uses an integrated approach combining improved management of
common childhood illnesses with aspects of nutrition, immunisation and other factors such as
maternal health. It has three components covering health worker skills development, health
systems performance improvement and household and community aspects of child survival
(MOHCW, 2007).The IMCNI has been affected by low morale among health workers and
lack of resources for capacity building among community members.
2.8.3 National Immunisation days (NID)
The NIDs have been held every four to five years since 1998. They are aimed at vaccinating
those children not reached by routine immunisation and also to boost overall vaccination
coverage. NIDs held in June 2007 achieved an immunisation coverage rate of 80, 4% for
children between 6-59 months. The coverage of selected antigens was also very high with
BCG recorded at 96,5%, DPT at 96,7%, Measles at 92,3% and vitamin A supplementation
being 85,5% (MOHCW,2007).
2.8.4 Other Interventions
Child health days (CHD) were introduced in 2005 as a measure to mitigate the reported
decline in routine immunisation. Other programs include the Prevention of Mother to Child
Transmission (PMTCT), Kangaroo Mother Care, Baby friendly Hospital Initiative, promotion
of exclusive breastfeeding in the first six months and the Child supplementary feeding
Program (MOHCW, 2007).
Overall, the socio-economic challenges of the past decade have combined to negatively affect
the Child Health days and Expanded Programme of Immunisation. Inadequate foreign
currency resulted in failure to purchase vaccines, LP gas, cold chain equipment and other key
equipment like vehicles for outreach services necessary for the continuous provision of
immunisation to children under five (UNICEF, 2009).

23
CHAPTER THREE
METHODOLOGY
3.1 Introduction
This chapter discusses the methods that were employed to obtain data about child morbidity
in Katanga Township. Also included in this chapter is the conceptual framework that has
been chosen to explain child morbidity.
3.2 Conceptual framework
The conceptual framework that was adopted for this study is the Analytical framework for the
Study of Child Survival in Developing Countries by Mosley and Chen (1984). The
framework was based on five premises as follows:
1. In an optimal setting, 97% of new born infants can be expected to survive through the
first five years of life;
2. Reduction in this survival probability in any society is due to the operation of social,
economic, biological and environmental forces;
3. Socio-economic determinants (independent variables) must operate through the more
basic proximate determinants that in turn influence the risk of disease and the
outcome;
4. Specific diseases and nutrient deficiencies observed in a surviving population may be
viewed as biological indicators of the operations of the proximate determinants; and
5. Growth faltering and ultimately mortality in children (the dependent variable) are the
cumulative consequences of multiple disease processes and their biosocial
interactions. Only infrequently is a child’s death the result of a single isolated disease
episode.
It also assumes child morbidity to be a function of proximate determinants that work through
the socio economic factors to determine a child’s health.
Mosley and Chen identified a set of proximate determinants that they grouped into five
categories namely maternal factors, environmental contamination, nutrient deficiency, injury
and personal illness control. The maternal factors are age, parity and birth interval. These
factors influence pregnancy outcome and infant survival through its effects on maternal
health. Environmental contamination refers to the transmission of infectious agents to

24
children via the air which is the route of spread of respiratory and other contact diseases.
Food, water and fingers are the principal route for the spread of diarrhoeal and intestinal
diseases. Skin, soil and inanimate objects are key in the spread of skin infections while insect
vectors transmit parasitic and viral diseases. WHO (2003) identified a set of risk factors for
mortality among them unsafe drinking water (one of the cause of diarrheal disease),
malnutrition and indoor smoke from burning solid fuels (important for respiratory
conditions).
Nutrient deficiency relates to the intake of the three majors classes of nutrients, calories,
protein and the micronutrients. The survival of the child is influenced by the availability of
balanced nutrients to both the mother and the child. Maternal diet and nutrition during
pregnancy affect birth weight and during lactation influence the quantity and quality and
nutrient quality of breast milk.
Injury on the other hand, includes physical injury, burns and poisoning. The pattern and
frequency of accidental injuries in a population reflect on the environmental risks that differ
according to socio economic and environmental contexts. Injuries may however be
intentionally inflicted and most extreme examples being infanticide. The above four
categories of proximate determinants influence the rate at which healthy persons shift
towards illness.
Personal illness control influences both the rate of illness via the use of preventive measures
like immunization and the rate of recovery via the use of appropriate treatments for manifest
illnesses.
3.2.1 Socio economic determinants
Mosley and Chen (1984) further described the socioeconomic determinants as including
community, household and individual level characteristics. At individual level, characteristics
of parents or other caretakers operate on proximate determinants to influence the child’s
wellbeing. These include productivity and adherence to traditions, norms and attitudes or
beliefs. Productivity in cooperates skills (commonly measured by educational attainment),
demands on time for both child/family care and income generation and personal health.
Cultural traditions and societal norms can result in discriminatory behaviour based on a

25
child’s gender and age. As a result, other children may be prioritised in intra household food
distribution and use of resources to obtain preventive and curative health care at the expense
of others. Beliefs about the cause of disease or about feeding practices can result in reluctance
to obtain recommended immunization or treatment hence causing the first delay in seeking
medical care.
At household level, socioeconomic determinants are highly correlated with income and
wealth. Income and wealth determine the availability of adequate nutrients and food (nutrient
deficiency), the quality and quantity of water, adequacy of food storage, sanitation facilities
and housing quality such as ventilation, and cleanable floors. Also affected by income and
wealth is adequacy of fuel supply to ensure proper cooking and cleaning and for warmth, and
the ability to access (transportation) and pay for both preventive and curative care (personal
illness control). Income also influences access to information through radio, television,
newspapers, magazines, books and informal channels. Households can obtain information
about proper nutrition, hygiene, contraception and immunization.
At community level, the ecological setting which includes climate, soil, rainfall, temperatures
and altitude can have a strong influence on child survival especially in rural areas. They
affect the quality and variety of food crops produced. Vector borne disease transmission, rate
of proliferation of bacteria in stored foods, sewage drainage, and survival of parasite are also
affected by the ecological setting. Physical infrastructure such as roads, rail, and electricity
and telephone systems can influence health by providing access to medical care. Availability
of sewage infrastructure and clean water supply influence the rate of environmental
contamination.
Institutionalization actions such as immunization, vector control, programs such as the
Dichloro Diphenyl Trichloroethane (DDT) program for the control of malaria in Zimbabwe
can be used in order to reduce morbidity (personal illness control.) In some cases
governments provide subsidies so that children get affordable health services. This helps to
control the risk of mortality causing diseases hence has a positive effect on child survival.
Public information, education and motivation can also be part of government subsidies. The
role of technology cannot be underestimated. Technology covers such things as information,
vaccines, ART treatment, and insecticides (though some may have adverse effects e.g. DDT).

26
The framework by Mosley and Chen (1984) is of importance in this study as it brings out the
underlying causes of disease. Socio economic factors alone cannot adequately explain the
emergency of disease in a population. They have to work through the basic proximate
determinants in order to adequately explain determinants of morbidity in children. Below is a
diagram that summarises how proximate determinants work through socio-economic
determinants to influence child morbidity.
Fig 3.1 Model of the operation of proximate determinants by Mosley and Chen (1984)
Adopted from Mosley and Chen 1984
3.3 Geographical Location of the study
The study was carried out in Katanga Township in Norton. Katanga Township is the largest
high density suburb in Norton and it is one of the oldest suburbs in the town. Its infrastructure
is no longer able to cope with the large population and problems such as inadequate sewage
treatment, inadequate water supply and poverty are common. When compared with other
Socio- economic determinants
Community Household Individual
Ecological setting Income/wealth productivity,
Political economy traditions, norms
Health systems attitudes
traditions
Health system norms/attitudes
Maternal
factors
Environmental
contamination
Nutrient
deficiency
Injury
Healthy Sick
Growth
faltering
Mortality
Personal illness control
27
townships in Norton, Katanga has the highest rates (60%) of child morbidity and mortality
owing to its large population (Norton Hospital Records, 2011). Hence it was chosen as the
area of study.
3.4 Target population
Women in the reproductive age groups with children under the age of five were targeted.
They are the most common caregivers for children and they spend more time with their
children than all the other members of the household.
3.5 Study design
The study triangulated quantitative and qualitative research methods. Quantitative data was
obtained from a survey that was carried out in Katanga Township. Hospital records also
provided another source of quantitative data. Survey data was collected using a structured
questionnaire. Qualitative data was obtained from structured key informant interviews with
health and environmental personnel from local hospitals and city council respectively. An
environmental assessment was done through field observation to assess the physical
environment in the Township. Below is a discussion on the respective methods.
3.6 Data collection methods and tools
3.6.1 Survey
A survey (using an interviewer administered questionnaire) was administered to 174
households targeting mothers of children below five years. The questionnaire had three
majors sections. The first sections collected data on population and household characteristics
covering demographic characteristics, accommodation type and environmental factors.
Section two covered questions on maternal factors, such as birth history and new-born health.
Section three collected data on under -five health and nutritional status. The survey was used
to quantify the magnitude of the issues relating to demographic, environmental and socio-
economic determinants of child morbidity.
3.6.1.1 Sample size determination
The sample size was determined using Census results for 2002. Katanga had a total
population of 19538. The target population being women in the reproductive age groups was

28
2551.The total number of women in the reproductive age groups was used by this researcher
to calculate the sample size using the formula:
n=z2pq/e
2
z2= (1.96*1.96) =3.8416
p= proportion of the target population= (2551/19538) =0.1305
q= proportion of the total population excluding the target population = (1-0.1305) =0.8695
e= margin of error at 5 %=( 0.05*0.05) =0.0025
Therefore n = 3.8416*0.1305*0.8695)/0.0025
=174
Thus, the sample size was estimated at 174 mothers. It was expected that this sample of
mothers would yield a sample of 200 under five children.
3.6.1.2 Sampling procedure
To come up with a representative sample, the systematic random sampling of Katanga
Township was done. According to the 2002 census, the estimated number of households in
Katanga was 2459. The number of households was divided by the calculated sample size of
174 so as to achieve uniform coverage of households as follows:
2 459/ 174 = 14.13
Numbers 1-14 were then placed in a hat and one number was randomly picked. The house
with the number that was picked became the starting point for administering questionnaires.
Thereafter, every 14th
house was selected following house numbers in lines.
3.6.1.3 Sample coverage
Some interviews were refused owing to the fact that some households did not have children
under- five years of age. Hence 169 respondents constituting 97% of calculated sample
responded to the questionnaire yielding 205 children.
3.6.1.4 Training and Pre-testing
Some training was done for the research assistant to familiarise with the questionnaire and
pre-sting of 5% of the sample size was done. Some changes were then made to the
questionnaire before the final survey was carried out.
3.6.2 Key informant interviews
Key informant interview guides were used to collect qualitative data. Interviews were held
with four health personnel. Two were from the local public health facility and two from a
29
private health facility. Another key informant interview was held with an environmental
officer from the local town council. Key informant interviews were undertaken to
compliment data on demographic, environmental and socio-economic determinants of child
morbidity. Hospital records from the health centres provided a source of quantitative data.
The data showed the extent of child morbidity and mortality in the area.
3.6.3 Field observations
A series of observations guided by an Environmental Assessment Guide were obtained. Of
interest was physical infrastructure, quality of housing and health hazards. Some photographs
were taken for visual presentation of the environmental situation.
3.7 Data Processing and Analysis
Quantitative data was processed using Statistical Package for Social Sciences (SPSS)
Frequency distributions and cross tabulations were used to analyse the data. Qualitative data
was analysed by thematic narrative analysis which complimented data analysed by SPSS.
Data management included coding data by assigning number codes to responses and in some
cases assigning number categories which could be useable in SPSS Analysis. This was done
in a manner which maintained data integrity as much as possible, hence correct data which
represented the respondent’s opinions’ was used.
3.8 Ethical considerations
Participants were assured that no identities were to be written along with the results to ensure
anonymity. The information was treated with strict privacy and confidentiality as some of the
information obtained was sensitive and bears on participant’s personal experiences and
perceptions. The participants were also advised not to answer any questions they did not want
to answer and to pull out of the interview if they felt they could no longer continue.
Participants were also advised to participate in the interview only on voluntary basis.

30
CHAPTER FOUR
RESEARCH FINDINGS
4.1 Introduction
This chapter presents research findings from quantitative data obtained through the survey
and qualitative data obtained from key informant interviews and field observations.
4.2 Demographic Characteristics of the respondents
A total of 196 women of the reproductive ages responded to the survey questionnaires
yielding 205 children below the age of five. The majority of respondents, 66%, were young
women below the age of 30 (Table 4.2.1). About 36% of the respondents were in the 25-29
age group. Age groups 20-24 and 30-34 comprised 21% and 19% of the total sample
respectively. Interestingly, among the respondents were women below the age of 15
constituting 2% and an equal proportion being women over the age of 44. Note that child
bearing in the extreme ages increase the chances of child morbidity and mortality.
Most of the respondents were in a relationship. About 89% reported that they were married.
Single women constituted 7%, while divorced and separated women comprised
approximately 3%. Widows were only 1% of the total sample.
The sample reflected a fairly literate population with only 1% reported having no education at
all. The proportion of those who attended secondary school constituted the majority, 82%.
Those who attended primary school only comprised 8%, and an almost equal proportion had
attended tertiary education.
Data showed a low level of employment both formally and informally. The majority of
respondents, 77%, reported that they were unemployed, relying on spouses and/ or family
members for income. About 14% of respondents reported that they were informally
employed while the smallest proportion, 9%, comprised those who were formally employed.
The mean household income was $220, falling into the $150-$300 income group. About
67% were in the low income brackets surviving on monthly incomes below $300. The group
comprised of 25% of respondents with incomes below $150, and about 42% with monthly

31
household incomes ranging between $150 and $300. Those earning above $300 comprised
33% of the sample.
The religious backgrounds of the respondents were quite diverse. The largest proportion of
the sample, 68%, reported that they were Christian. A considerable proportion, 29%, reported
that they belonged to the apostolic sect. Only about 3% of respondents reported being
traditionalist and Muslims. Less than 1% reported that they were atheists.

32
Table 4.2.1: Percentage distribution of respondents by demographic characteristics
CHARACTERISTICS PERCENT
AGE
Below 15 1.8
15-19 6.5
20-24 21.3
25-29 36.1
30-34 19.5
35-39 12.4
40-44 1.8
Above 44 0.6
Total 100.0
MARITAL STATUS
Single 6.5
Married 89.3
Widowed 1.2
Divorced/separated 3.0
Total 100.0
EDUCATION
Never been to school 1.2
Primary 8.3
Secondary 81.7
Tertiary 8.9
Total 100.0
EMPLOYMENT
Unemployed 76.9
Formal employment 8.9
Informal employment 14.2
Total 100.0
HOUSEHOLD INCOME
Below $150 25.3
$151-300 42.0
$301-$500 22.0
Above $500 10.7
Total 100.0
RELIGION
Main line 30.2
Pentecostal 37.3
Apostolic 28.4
Traditional 0.6
Muslim 1.8
Atheists 1.8
Total 100.0
N=169
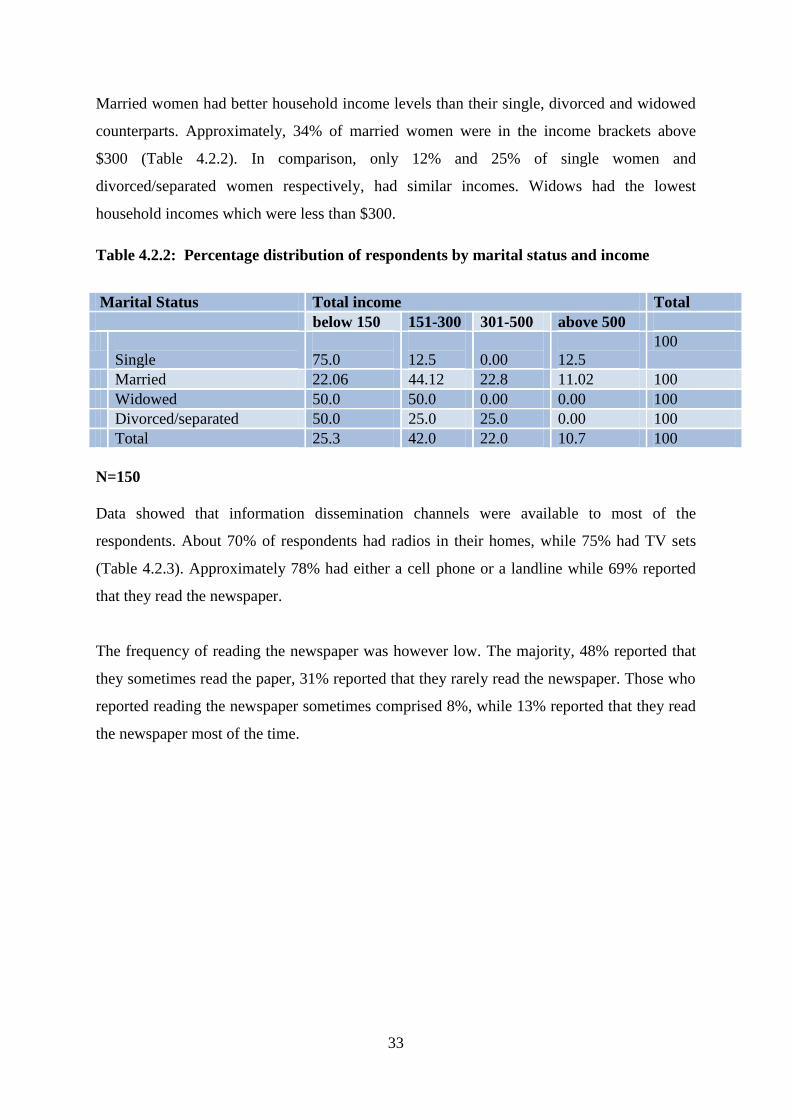
33
Married women had better household income levels than their single, divorced and widowed
counterparts. Approximately, 34% of married women were in the income brackets above
$300 (Table 4.2.2). In comparison, only 12% and 25% of single women and
divorced/separated women respectively, had similar incomes. Widows had the lowest
household incomes which were less than $300.
Table 4.2.2: Percentage distribution of respondents by marital status and income
Marital Status Total income Total
below 150 151-300 301-500 above 500
Single
75.0
12.5
0.00
12.5
100
Married 22.06 44.12 22.8 11.02 100
Widowed 50.0 50.0 0.00 0.00 100
Divorced/separated 50.0 25.0 25.0 0.00 100
Total 25.3 42.0 22.0 10.7 100
N=150
Data showed that information dissemination channels were available to most of the
respondents. About 70% of respondents had radios in their homes, while 75% had TV sets
(Table 4.2.3). Approximately 78% had either a cell phone or a landline while 69% reported
that they read the newspaper.
The frequency of reading the newspaper was however low. The majority, 48% reported that
they sometimes read the paper, 31% reported that they rarely read the newspaper. Those who
reported reading the newspaper sometimes comprised 8%, while 13% reported that they read
the newspaper most of the time.

34
Table 4.2.3: Percentage distribution of respondents by availability of information
channels
Household goods Percentage
Television set 75.1
Telephone/cell phone 78.1
Radio 70.4
Do you read the newspaper? 69.2
Frequency of reading the newspaper
Regularly 7.9
Most of the time 13.3
nnSometimes 48.2
Rarely 30.6
Total 100.0
N=169
4.3 Household Characteristics
Type of accommodation included semi-detached, detached, flats and even shacks. The
majority of respondents, 47%, lived in detached dwellings (Table 4.3.1). Around 41% lived
in semi-detached units while approximately 11% lived in flats while 1% lived in shacks that
were built from wooden material.
Most of the housing units were properly ventilated with 96% of houses having glass
windows. Three percent reported that they had cardboard and another 3% reported that they
used plastic to cover their windows.
Table 4.3.1: Percentage distribution of respondents by type of accommodation
ACCOMMODATION TYPE Percentage
Detached 47.3
Semi detached 41.4
Flat 10.7
Shack 0.6
Total 100.0
VENTILATION TYPE
Glass window 96.4
Cardboard 1.8
Plastic 1.8
Total 100.0
N=169
Data showed that families were generally crowded. Only 38% reporting that they did not
share their housing unit with other families. The majority, 62%, of respondents reported that

35
they shared the houses with other families (Figure 4.3.1). Of those who shared, about 25%
reported sharing their house with one family, 18% reported having three families at their
residence. Of interest to note is the fact that as many as eight families shared a house and one
particular dwelling was reported to be shared by 11 families.
Figure 4.3.1: Percentage distribution by number of families living at one address.
N=169
Most of the respondents lived in housing units with toilets. Only 1% of respondents reported
having no toilet facility at all (Figure 4.3.2). Data showed that 2% of respondents used a
public flush toilet. Thirteen per cent had pit latrines, while 84% had indoor flush toilets.
However, most of these toilets were shared as most of the housing units were shared by more
than one family.

36
Figure 4.3.2: Percentage distribution of respondents by the type of toilet used.
N=169
The majority of respondents, 57%, reported having an erratic supply of running water (Table
4.3.2). Only 9% of respondents reported always having running water in their homes and
34% reported having running water most of the time. From data collected during the survey,
the respondents reported facing challenges when they needed to clean, cook, wash and flush
their toilets. Although the majority of respondents, 85%, reported having indoor flush toilets,
the toilets were not fully functional because of lack of water. In some cases they had to walk
long distances to fetch water from boreholes and unprotected wells. Some (37%) have
attributed their children’s sickness to the water shortage problem given that most of the
houses were overcrowded (see Table 4.7.7).
A key informant interview with environmental personnel revealed that there was a water
supply problem in the town.
“Water supply is erratic and the quality of water is poor. Currently, water is being
supplied by City of Harare and it’s in short supply.

37
Asked about their main source of drinking water, the majority of respondents, 67%, reported
that they drank water from the tap. About 19% reported they made an effort to look for
borehole water while 8% used water from protected wells. Due to financial constraints, only
4% reported buying bottled water for drinking. Nearly 2% reported that they drank water
from unprotected wells.
Table 4.3.2: Percentage distribution of respondents by water availability
RUNNING WATER AVAILABILITY PERCENTAGE
Always available 8.9
Mostly available 33.7
Rarely available 47.3
Never available 10.1
Total 100.0
SOURCE OF DRINKING WATER
Bottled 4.1
Tap 66.9
Protected well 8.3
Unprotected well 1.8
Borehole 18.9
Total 100.0
N=169
As a follow up to the question about the main source of drinking water, respondents were
asked if they treated water to make it safe for drinking. The majority of households, 78%,
reported that they do not treat water before drinking it (Table 4.3.3). Only 22% of
respondents reported treating water before drinking. Of those who treated water, 46%
resorted to boiling, 50% added bleach or chlorine while 4% used filters to purify drinking
water.
Table 4.3.3: Percentage distribution of respondents by water treatment methods.
WATER TREATMENT
Boiling 46.15
Bleach/chlorine 50.0
Use of filters 3.85
Total 100.0
N=52
As expected in urban areas, most of the dwelling units had electricity. However, electricity
was reported to be in short supply. The majority of respondents constituting 85% had

38
electricity in their homes (Table 4.3.4). Only 15% of the respondents did not have electricity
in their homes. Though in short supply, electricity emerged as the main source of fuel for
cooking and lighting. About 78% of respondents reported using electricity for lighting and
65% reported used it for cooking. Other fuels used for cooking include firewood, 22%,
charcoal, 3%, and paraffin, 9%. Besides electricity, candles, 21% and paraffin, 1%, were also
used for lighting.
Table 4.3.4: Percentage distribution of respondents by fuel used for cooking and
lighting
CHARACTERISTICS Percentage
Electricity availability 85.0
MAIN FUEL USED FOR COOKING
Electricity 65.1
Firewood 21.9
Charcoal 0.6
Gas 3.6
Paraffin 8.9
Total 100.0
MAIN FUEL USED FOR LIGHTING
Electricity 78.1
Candles 20.7
Paraffin 1.2
Total 100.0
N=169
Despite Norton being referred to as a malaria free zone, the majority of respondents, 77%,
reported that they took at least one measure to prevent malaria. Those who reported cutting
grass around their houses were about 25% (Table 4.3.5). Other methods in use were mosquito
coils and repellents, 12%, and mosquito nets, 56%. Though 56% of respondents reported that
they had mosquito nets, only 50% reported that their children were sleeping under them.

39
Table 4.3.5 Percentage distribution of children by malaria preventive strategies.
Question Percentage
Prevention 76.92
Cutting grass 24.9
Draining open water bodies 1.8
Use of mosquito coils and repellants 12.4
Use of preventive medicine 5.9
Use of mosquito nets 56.2
Children sleeping under a mosquito net 50.24
N=169
4.4 Maternal factors
Maternal factors such as age, parity and birth interval influence pregnancy outcome and
infant survival through its effects on maternal health. The sample population was made up of
women of youthful ages hence their children were mainly of the first, second and third
parities.
An analysis of data of children ever born to the respondents showed that all respondents had
had at least one child. Women who had given birth to less than three children constituted the
majority making up about 65% (Table 4.4.1). As expected, the number of children ever born
was positively related to age. Those who had three children constituted 17% while 12%
comprised of those who had four children. Only about 5% had had five children.
Data showed an early onset of child bearing as some women gave birth before they were
15years old. Early child bearing showed that there was no sterility in the sample population.
In the age group 15-19, the majority of women, 91%, only had one child while those with two
children constituted only 9%. In the 20-24 age groups, still the majority of women, 81%, had
one child, but there was an increase in the percentage of women with two children, 11%,
compared to the 9% in the previous age group. As age progressed into the 25-29 age groups,
48% of women had at least two children. The percentage of women with one child decreased
to 23% compared to 81% in the previous age group. At the same time, the percentage of
women with three children increased to 21% compared to 3% in the previous age group.
Parities four and five were most prevalent in the 40-44 age groups constituting only 17% of
the total sample. It is interesting to note that even the older women did not have more than
five children. This is testimony to the successful uptake of contraceptives among the
respondents.

40
Table 4.4.1: Percentage distribution of women’s age and children ever born.
Children ever born
Age One Two Three Four Five Total
Below 15 66.67 33.33 0.00 0.00 0.00 100
15-19 90.90 9.10 0.00 0.00 0.00 100
20-24 80.55 11.11 2.77 5.57 0.00 100
25-29 22.95 47.54 21.31 3.27 4.93 100
30-34 9.1 51.51 21.21 18.18 0 100
35-39 0.05 0.05 33.33 38.1 28.47 100
40-44 0.00 0.00 0.00 66.67 33.33 100
Above 44 0.00 0.00 100.0 0.00 0.00 100
Total 34.9 31.4 17.2 11.8 4.7 100
N=169
The average spacing of the children was two and a half years. The majority of the
respondents, 78%, had only one surviving child under the age of five, while 21% had two
surviving children under -five years (Figure 4.4.1). Only 1% had three surviving children
under the age of five.

41
Figure 4.4.1: Percentage distribution of respondents by under- five children per woman.
N=205
Mothers were asked about their antenatal care practices during the last pregnancy. Some
mothers reported having started to attend ANC during the first month of pregnancy. Data
showed that about 40% of respondents had started attending ANC in the first four months of
pregnancy (Figure 4.4.2). The largest proportion of mothers, 22%, started attending at four
months. Approximately 17% started attending ANC at five months while 14% started at six
months. About 9% of mothers reported that they had never attended antenatal clinic while
less than 1% were not sure about the period that they started attending.
W.H.O recommends first attendance at ANC in the first four months of pregnancy. Key
informant interviews by medical personnel revealed that antenatal attendance by expecting
mothers was generally good. In the words of one sister in charge:
“Antenatal care attendance by expecting mothers is good. Usually they start
attending at 4months into their pregnancy”

42
Figure 4.4.2: Percentage distribution of respondents by duration at first attendance at
ANC.
N=169
Women were asked whether they had received counselling about HIV. About 91% reported
that they received counselling on HIV and AIDS (Figure 4.4.3). However, 89% reported that
they had actually been tested. Health personnel in both private and public institutions noted
that mothers were willing to attend Voluntary Counselling and Testing and hospitals had
made it a priority for all expectant mothers to be tested.
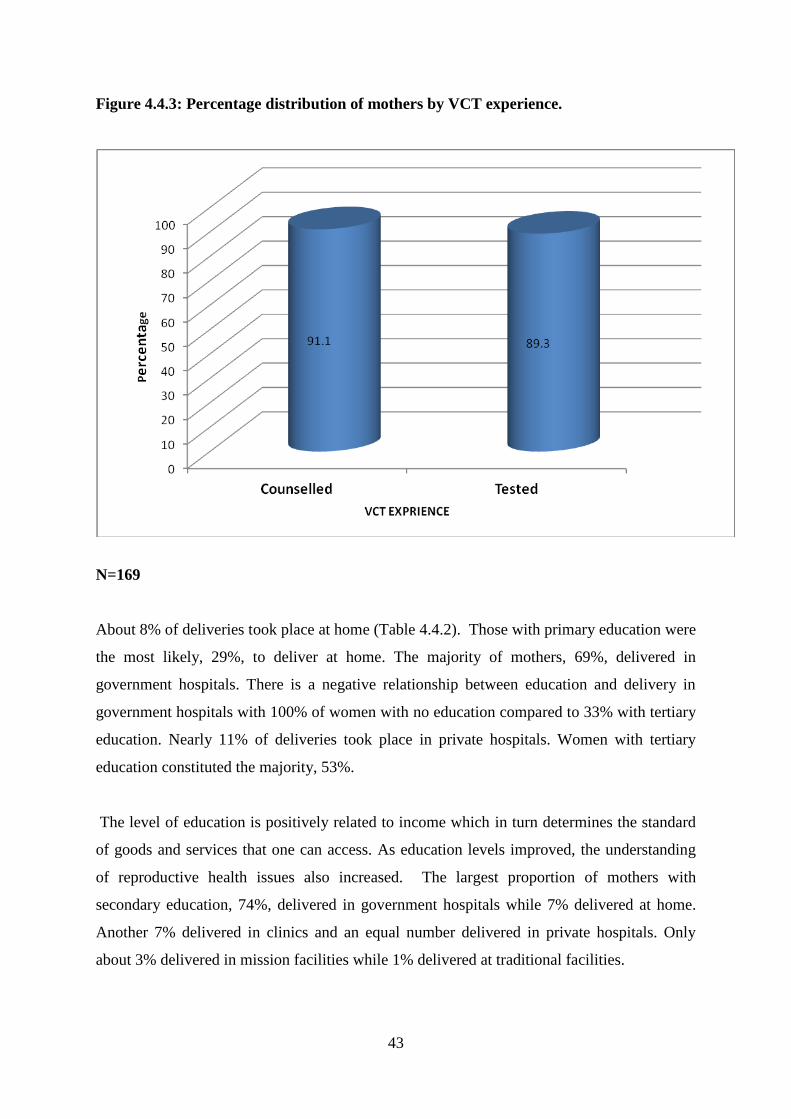
43
Figure 4.4.3: Percentage distribution of mothers by VCT experience.
N=169
About 8% of deliveries took place at home (Table 4.4.2). Those with primary education were
the most likely, 29%, to deliver at home. The majority of mothers, 69%, delivered in
government hospitals. There is a negative relationship between education and delivery in
government hospitals with 100% of women with no education compared to 33% with tertiary
education. Nearly 11% of deliveries took place in private hospitals. Women with tertiary
education constituted the majority, 53%.
The level of education is positively related to income which in turn determines the standard
of goods and services that one can access. As education levels improved, the understanding
of reproductive health issues also increased. The largest proportion of mothers with
secondary education, 74%, delivered in government hospitals while 7% delivered at home.
Another 7% delivered in clinics and an equal number delivered in private hospitals. Only
about 3% delivered in mission facilities while 1% delivered at traditional facilities.

44
Mothers with tertiary education were likely to have better incomes hence they constituted the
largest proportion of those who delivered in private hospitals at 53%. About 33% delivered
in government hospitals and 13% delivered in mission facilities. It is interesting to note that
all mothers with tertiary education were attended by a skilled worker at delivery.
Table 4.4.2: Percentage distribution of mothers by education and place of delivery
At
Home
Govt.
Hosp.
Clinic Private
Hosp.
Mission
Hosp.
Traditional
facility
Total
No
education
0.00 100.0 0.00 0.00 0.00 0.00 100
Primary 28.57 57.14 7.14 0.00 7.14 0.00 100
Secondary 7.24 73.91 7.24 7.24 2.90 1.45 100
Tertiary 0.00 33.33 0.00 53.33 13.34 0.00 100
Total 8.28 69.23 6.50 10.65 4,14 1.18 100
N=169
To a lesser extent, religion affected place of birth. About 8% of total deliveries took place at
home with women from the apostolic sect constituting the majority, 22% (Table 4.4.3).
However, there was a negative relationship between religion and delivery in government
hospitals. Results showed that the majority of women from all religions delivered in
government hospitals. About 72% from main line churches, 67% from Pentecostal churches,
67% from apostolic sects, 67% Muslims and 100% atheists delivered in government
hospitals.
The largest proportion of those who delivered at private hospitals was Pentecostal
constituting 17% followed by those from mainline churches comprising 11%. A total of 4%
of respondents used mission facilities with the majority being Muslim, 33%, while about 6%
were from mainline churches. Traditional facilities were used by a total of 1%.

45
Table 4.4.3: Percentage distribution of mothers by religion and place of delivery
At Home Govt.
Hosp.
Clinic Private
Hosp.
Mission
Hosp.
Traditional
facility
Mainline 0.00 71.70 11.32 11.32 5.66 0.00
Pentecostal 4.76 66.67 7.94 17.46 3.17 0.00
Apostolic 22.92 66.67 0.00 6.25 2.08 2.08
Traditional 0.00 0.00 0.00 0.00 0.00 100
Muslim 0.00 66.67 0.00 0.00 33.33 0.00
Atheist 0.00 100.0 0.00 0.00 0.00 0.00
Total 8.28 69.23 6.50 10.65 4,14 1.18
N=169
Generally, mothers experienced safe delivery of their babies. About 70% reported that they
delivered normally, while 23% reported that they delivered normally but had to have stitches
(Figure 4.4.4). Nearly 4% had caesarean section and an even smaller proportion, 2%,
reported that they were induced while about 1% had had vacuum extraction.

46
Figure 4.4.4: Percentage distribution of respondents by type of delivery
N=169
Data from the survey showed that a small proportion, 9%, had experienced complications
during delivery. Of those who experienced complications, about 22% reported having
experienced prolonged labour which exceeded 12hours (Table 4.4.4). Nearly 11%
experienced post-partum haemorrhage, 2% reported having high fever accompanied by bad
smelling vaginal discharge. Less than 1% reported having convulsions. According to medical
personnel from the public hospital, the most common complications during child delivery
were post-partum haemorrhage, spiking temperature, psychosis and depression.

47
Table 4.3.4: Percentage distribution of mother’s complication experiences
Type of complication Percentage
Long labour exceeding 12hours 21.3
Post-partum hemorrhage 10.7
Fever with smelling vaginal discharge 2.4
Convulsions not caused by fever 0.6
Total 100.0
N=15
Some babies were affected by complications experienced by their mothers. Of those who had
complications, only 4% reported that their babies had problems. Of those babies who had
problems 46.2% had blood in the eyes, 5.6% developed infections, 13.2% delayed first cry
at birth , 33.8% of the babies were weak at birth and other problems constituted 1.2%.
Data from in-depth interviews showed that those women who delivered at home were at risk
of having complications. Apostolic sect members were reported to be the most likely to have
complications, however in some cases they ended up bringing their children to hospital, often
in very critical conditions.
4.5 Environmental characteristics
Environmental contamination refers to the transmission of infectious agents to children via
the air, food, water fingers inanimate objects and vectors such as insects and rodents.
Environmental personnel reported that the environment in Katanga was generally poor and
conducive for the spread of diseases due to the fact that it is a high density area and there is
overcrowding.
The majority of respondents, 64%, who used the council sewage system, reported that the
sewage systems were fully functional (Figure 4.5.1). Fifteen per cent reported that sewers
were always bursting mainly in the older parts of the suburb, while 20% reported that they
were occasional sewer bursts

48
Figure 4.5.1: Percentage distribution of respondents’ perception on sewage system.
0%
Fully functional64%
Always bursting
15%
Occassinally bursting
21%
N=155
As a follow up to the question on sewage system efficiency, respondents were asked to give
their opinions about Council’s response to sewer bursts. Of those who responded, 7%
reported that the response was excellent (Figure 4.5.2). Those who felt that response was very
good constituted 32%. About 26% felt the response by council towards sewer burst was good
while 35% felt the service was poor. According to council environmental personnel, sewer
bursts were not attended on time due to financial and human resources constraints within the
council.

49
Figure 4.5.2: Percentage distribution of respondents’ perception about council’s
response to burst sewer
N=169
Environmental assessment showed the presence of long grass in areas surrounding the houses
(Figure 4.5.3). With the onset of the rainy season, council reported lacking the capacity to cut
the grass frequently. The presence of long grass promotes the breeding of mosquitoes, snakes
and rodents. In the words of one environmental officer:
“As Council, we try to make sure that the environment is clean, however we are
facing many challenges due to financial constraints. We will do our best given the
available resources.”

50
Figure 4.5.3: Picture showing long grass in front of a house.
Drainage systems showed signs of poor maintenance resulting in stagnant pools of water in
front of houses. During environmental assessment, some pools of stagnant water could be
seen in front of the vending stalls at the main shopping centre. In some cases, sewage water
was pooled in front of houses (Figure 4.5.4).The water becomes breeding ground for flies,
mosquitoes and bacteria.

51
Figure 4.5.4: A picture showing a pool of raw sewage in front of a house.
Garbage heaps were a common feature especially in open areas and other places near the
houses and schools. Forty-eight per cent of respondents reported that there were some
garbage heaps near their homes. Asked how long the rubbish heaps have been there, various
responses emerged ranging from a few weeks to as long as two years. Some children were
seen playing on the dumping areas (Figure 4.5.5).
Environmental personnel acknowledged that open dumping was a serious problem. The
Town Council had no capacity to enforce laws concerning open dumping. Only recently were
by-laws enacted to curb open dumping.

52
Figure 4.5.5 Picture showing some children playing on garbage dumps.
Various problems were reported as emanating from the garbage heaps. Such problems
included bad smell as reported by 75% of respondents (Figure 4.5.6). About 76% reported
problems of flies; 50% reported having problems with rodents. Water contamination and
poisoning were reported by 34% and 17% respectively.

53
Figure 4.5.6: Percentage distribution of respondents by environmental problems
experienced
N=84
Cloth and disposable nappies were reported to be commonly used by the respondents. The
majority of respondents, 73%, reported that they used cloth nappies on their children (Table
4.5.1). About 10% reported using disposable nappies only. The remaining 17% used either
panties or a combination of both types of nappies.
Disposal of stool from cloth nappies seemed to be handled fairly well by respondents. Those
women who reported using cloth nappies were asked about how they disposed of the stool.
Two ways of disposal emerged, 98%, reported rinsing into toilet or pit latrine and the other
2% reported rinsing into a drain
The respondents who used disposable nappies reported various ways of disposal among them
being placing in a bin, 83%, burying in the ground, 3%, placing into a rubbish pit 7% and
throwing into pit latrine, 7%.

54
Table 4.5.1: Percentage distribution of respondents by method of stool disposal
TYPE OF NAPPY USED Percentage
Cloth nappies 72.8
Disposable nappies 9.5
Panties 6.5
Combination 11.2
Total 100.0
N=169
STOOL DISPOSAL
Cloth nappies and panties
Rinse into toilet/pit latrine 97.8
Rinse into drain 2.2
Total 100.0
N=137
Disposable nappies
Place in a bin 82.8
Bury in ground 3.4
Place in rubbish pit 6.9
Throw into pit latrine 6.9
Total 100
N=29
4.6 Children’s demographic characteristics
Most of the children sampled were in the one year age group, 27%, followed by those in the
four year age group, at 21% (Table 4.6.1). Those below one year constituted 20%, while the
two years old made up 17%. The smallest proportion was that of the three year olds at 14%.
Data showed an almost equal gender distribution of the children with slightly more girls than
boys. Boys constituted 49% while girls constituted 51%.The majority of the children were
born from single pregnancies, 97%. Only 3% of the children were born from multiple
pregnancies.
The mean birth weight for the children was 2.84 kilograms. Of those children who were
weighed at birth, only about 6% were born with weight below 2,5kgs. Approximately 52%
were born with weight ranging between 3.1 and 4kgs. About 36% weighed between 2.5 and
3kgs at birth, while another 6% weighed between 4.1 and 5kgs.

55
Table 4.6.1 Percentage distribution of children by demographic characteristics
CHILDREN’S DEMOGRAPHIC CHARACTERISTICS Percentage
AGE
Below one year 20.49
One year 26.83
Two years 17.07
Three years 14.15
Four years 21.46
Total 100.0
SEX
Male 49.27
Female 50.73
Total 100.0
PREGNANCY TYPE
Single 97.07
Multiple 2.93
Total 100.0
BIRTH WEIGHT
Below 2,5kgs 5.67
2.5-3.0kgs 36.08
3.1-4.0kgs 52.06
4.1-5.0kgs 6.18
Total 100.0
N=205
4.6.1 Nutrition
Breastfeeding remains a key practice in maintaining a baby’s good health and data showed
that the practice was well taken up by respondents. The larger proportion of babies, about
97%, was breastfed at birth with only 3% reported not having been breastfed at all. Of the
babies who were breastfed, 39% were exclusively breastfed in the first six months of life
(Figure 4.6.1). The largest proportions, 45%, were supplemented with solid food while 13%
were supplemented with water. About 3% were supplemented with formula.

56
Figure 4.6.1: Percentage distribution of children by breastfeeding patterns in the first
six months
N=200
Respondents were asked about the number of meals their children took per day. The largest
proportion of children, 53%, took three meals a day (Table 4.6.2). About 22% took two meals
a day while 14% took four meals a day. Of interest was the fact that 9% of children ate only
one meal a day. About 2% of the children’s mothers were not sure of the exact number of
meals that their children took per day.
Mothers were also asked if they gave their children snacks in between meals. Eighty-eight
per cent of the children were reported to eat snacks in between meals. About 22% took one
snack in between meals. About 39% took two snacks per day while about 18% took snacks a
day. Those who took four and five snacks a day constituted 12% and 6% respectively. About
3% of the children’s mothers could not tell the exact number of snacks they gave per day.
In order to get an indication of whether the children were getting a balanced diet, mothers
were asked to recollect the food they had given to their children in the 24hours preceding the
survey. Results showed that though most children were getting the basic nutrients dairy
products lacking in their diets.
At least 93% of the children were reported to have taken some water in the 24 hours
preceding the survey. Only 4% had taken some milk while 76% had eaten porridge at
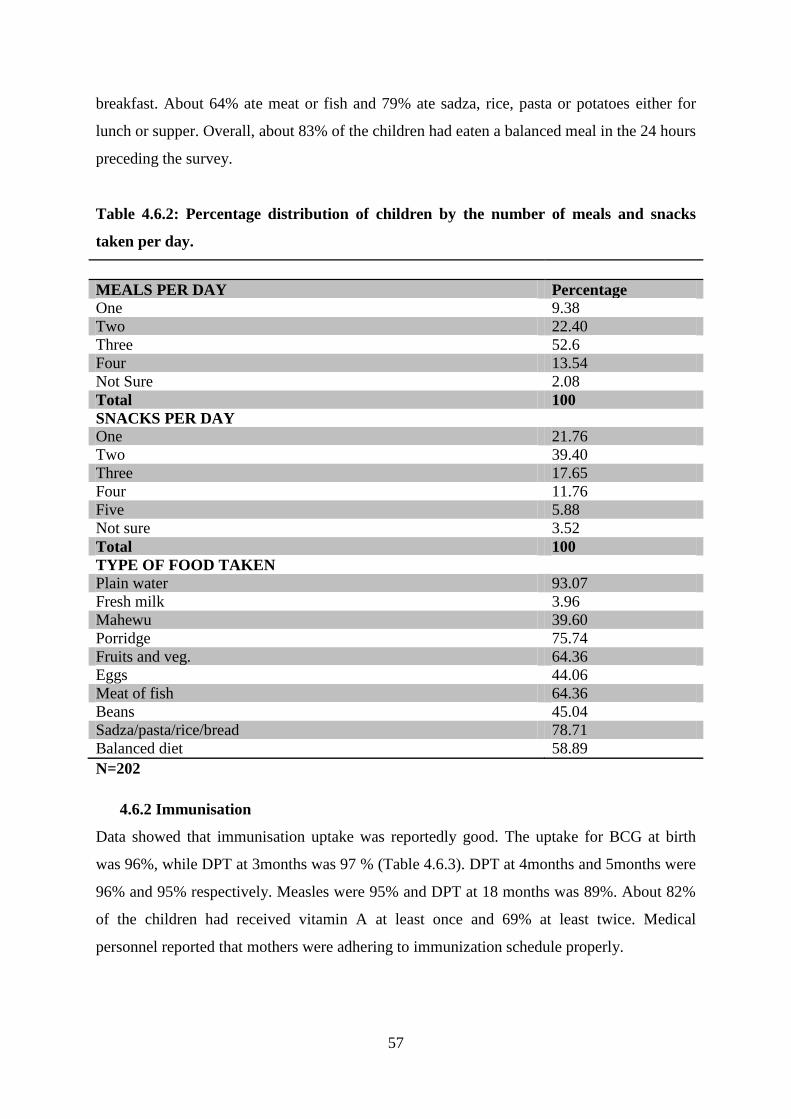
57
breakfast. About 64% ate meat or fish and 79% ate sadza, rice, pasta or potatoes either for
lunch or supper. Overall, about 83% of the children had eaten a balanced meal in the 24 hours
preceding the survey.
Table 4.6.2: Percentage distribution of children by the number of meals and snacks
taken per day.
MEALS PER DAY Percentage
One 9.38
Two 22.40
Three 52.6
Four 13.54
Not Sure 2.08
Total 100
SNACKS PER DAY
One 21.76
Two 39.40
Three 17.65
Four 11.76
Five 5.88
Not sure 3.52
Total 100
TYPE OF FOOD TAKEN
Plain water 93.07
Fresh milk 3.96
Mahewu 39.60
Porridge 75.74
Fruits and veg. 64.36
Eggs 44.06
Meat of fish 64.36
Beans 45.04
Sadza/pasta/rice/bread 78.71
Balanced diet 58.89
N=202
4.6.2 Immunisation
Data showed that immunisation uptake was reportedly good. The uptake for BCG at birth
was 96%, while DPT at 3months was 97 % (Table 4.6.3). DPT at 4months and 5months were
96% and 95% respectively. Measles were 95% and DPT at 18 months was 89%. About 82%
of the children had received vitamin A at least once and 69% at least twice. Medical
personnel reported that mothers were adhering to immunization schedule properly.

58
Table.4.6.3: Percentage distribution by immunisation received.
Question Percentage
Was your child given a BCG injection at birth? 96.0
Was your child immunized against polio (3mnths) 97.39
Was your child immunized against polio (4mnths) 95.70
Was your child immunized against polio (5mnths) 95.06
Was your child immunized against measles (9mnths) 95.0
Was your child immunized against polio (18mnths) 89.19
Has your child received Vitamin A drops at least once? 82.0
Full Immunisation 91.21
N=205
About 91% of children were fully immunised according to their various ages. Nearly 9% of
the children were reported to have missed immunization for different reasons. The major
reason for missing immunization was reported to be unavailability of vaccines at 39 %
(Figure 4.6.2). About 28% missed immunization because of religious reasons. An equal
proportion, 28%, missed immunization due to negligence of mothers and 5% due to lack of
information.

59
Figure 4.6.2: Percentage distribution of children by reason for missing immunization.
N=18
Socio-economic factors largely influenced immunisation uptake. About 60.8% of mothers
who had secondary education had their children fully immunised (Table 4.6.4).
Approximately 27.1% of mothers with primary school education had their children fully
immunised while mothers with tertiary education and those who never attended school had
10.6% and 1.5% of their children fully immunised respectively.
Families with incomes between $300-500 constituted the largest number of fully immunised
children 41.6%, while those with income between $151-300 constituted 28.5%. About 18.7%
of fully immunised children came from families with incomes above $500 while only 11.2%
came from families with income below$150.
The majority of fully immunised children came from families who belonged to main line
churches, 48.1%, followed by Pentecostal churches at 41.6%. Those belonging to apostolic
sects constituted 0nly 3.7%, while atheist constituted another 3.9%.Traditionalist and
Muslims constituted 1.1% and 1.6% respectively.

60
Table 4.6.4 Percentage distribution of fully immunised children by mother’s socio-
economic characteristics.
EDUCATION
Never been to school 1.5
Primary 27.1
Secondary 60.8
Tertiary 10.6
Total 100.0
HOUSEHOLD INCOME
Below $150 11.2
$151-300 28.5
$301-$500 41.6
Above $500 18.7
Total 100.0
RELIGION
Main line 48.1
Pentecostal 41.6
Apostolic 3.7
Traditional 1.1
Muslim 1.6
Atheists 3.9
Total 100.0
N=186
Mothers were asked to present their children’s immunization cards to assess their health
based on the weight for age index. Of those who presented their cards, about 76% of the
children had their weight within the upper and lower limit in a straight line indicating normal
growth (Figure 4.6.3). Nearly 19% had their weight within limits but fluctuating due to
various health problems. About 4% of the children were underweight and 2% were
overweight. Reasons given for weight loss included flue, diarrhoea, appetite loss and in some
cases injuries.

61
Figure 4.6.3: Percentage distribution of children by growth index
N=193
4. 7 Disease occurrences among children
Child morbidity is the dependant variable in this study and it is a function of proximate
determinants that work through the socio economic factors to determine a child’s health.
An analysis of the disease occurrence showed that child morbidity was high. About 67% of
the children suffered from at least one disease in the two weeks preceding the survey.
Hospital records for the month of October 2011 showed that 367 under five cases were
treated from Katanga. The most prevalent cases, 65%, were respiratory disease followed by
diarrhoea at 29%. Injuries constituted 5% while malaria was 1%. No cases of malnutrition
had been attended to at the clinic (Figure 4.7.1).
A comparison of hospital records and survey data showed similarities in the pattern and
prevalence of disease. Both hospital records and survey results showed that ARIs were the
most prevalent diseases among children below the age of five. Hospital records showed a
prevalence of about 65% while survey results showed a prevalence of about 45%. Diarrhoea
was the second most prevalent disease in both cases with hospital records showing a
prevalence of about 29% and 32% for survey results. Injuries followed after diarrhoea
becoming the third most prevalent morbidity with about 5% and 14% for hospital records and
survey results respectively. Although hospital records show no cases of malnutrition, a small

62
proportion, 9%, was reported in survey data. Malaria was the least prevalent disease
constituting only about 1% in both cases.
Data from key informant interviews with medical staff showed that there were no gender or
age differentials in child morbidity except for injuries which were reported to be more
common among boys than girls.
Figure 4.7.1: A comparison of disease prevalence between hospital records and survey
results.
4.7.1 ARIs
About 45% of the children were reported to have suffered from ARIs. Of those who suffered
from respiratory diseases, 26% had problems in the chest, indicating lower respiratory
infections, 62% had blocked nose indicating upper respiratory while 11% experienced both
(Figure 4.7.2). Flue was reported to be the most common respiratory problem suffered by the
children and it was easily spread in the overcrowded accommodation.

63
Figure 4.7.2 Percentage distribution of children by respiratory diseases experience.
N=61
An analysis of the mother’s characteristics showed that there is a positive relationship
between mother’s education, household income and child morbidity. The majority of
mothers, 74%, whose children suffered from respiratory diseases were unemployed (Table
4.7.1). About 13% were formally employed while an equal proportion was informally
employed.
The largest proportion of children who suffered from respiratory diseases came from
households with incomes below $300 per month constituting about 57%. Nearly 20% came
from households with incomes between $301 and $500 while 23% had incomes above $500.
Children from shared detached and semi-detached houses constituted the majority of those
who suffered from respiratory disease at about 63% followed by those from unshared
detached and semi-detached homes at about 30%.Those who lived in flats constituted 7%
only.

64
Table 4.7.1: Percentage distribution of children who suffered from ARI by mother’s
socio-economic background
CHARACTERISTICS PERCENTAGE
MOTHER’S EMPLOYMENT STATUS
Unemployed 73.78
Formally employed 13.11
Informally employed 13.11
Total 100.0
HOUSEHOLD MONTHLY INCOME
Below $150 24.59
$151-$300 32.79
$300-$500 19.67
Above $500 22.95
Total 100.0
TYPE OF ACCOMODATION
Detached (shared) 32.79
Semi-detached (shared) 29.51
Detached (not shared) 19.67
Semi-detached (not shared) 9.84
Flat 8.2
Total 100.0
N=61
4.7.2 Diarrhoea
Diarrhoea emerged to be one of the most common morbidities among the children.
Approximately, 22% of the children suffered from diarrhoea in the two weeks preceding the
survey (Figure 4.7.3). Mothers were asked about their perception of cause of diarrhoea.
About 30 % attributed it to poor sanitation due to water shortages in overcrowded
environments. About 25% of mothers attributed diarrhoea to the poor quality of water that the
children were drinking. Those who reported that flies from garbage heaps were causing
diarrhoea constituted about 16% while about 14% reported that flowing raw sewage was the
source of contamination resulting in diarrhoea. Smaller proportions, 7% and 9% reported
food poisoning and teething respectively as the causes of diarrhoea in their children.

65
Figure 4.7.3: Percentage distribution of mothers’ perception about cause of diarrhoea.
N=44
The majority of children, 77%, who suffered from diarrhoea had unemployed mothers (Table
4.7.2). About 14% had formally employed mothers while 9% had informally employed
mothers.
The largest proportion of children who suffered from diarrhoea, 40%, came from households
with incomes below $150 a month. These were followed by those with monthly incomes
between $151 and $300 at 36%. Those in the higher income groups constituted the remaining
24%.
Children who lived in shared semi-detached and detached homes constituted the majority of
those who suffered from diarrhoea at about 64%. Those from unshared detached homes
comprised about 18%, while unshared semi-detached homes comprised about 9%. Small
proportions lived in flats and shacks comprising nearly 5% each.
Households who reported using tap water as their main source of drinking water constituted
the majority of children, 64%, who suffered from diarrhoea. Those who used boreholes and
protected wells comprised about 25% while those who used bottled water constituted about
9%. A small proportion, 2%, was reported to drink water from unprotected wells.

66
Table 4.7.2: Percentage distribution of children who suffered from diarrhoea by
mother’s socio-economic background
CHARACTERISTICS PERCENTAGE
MOTHER’S EMPLOYMENT STATUS
Unemployed 77.27
Formally employed 13.63
Informally employed 9.10
Total 100.0
HOUSEHOLD MONTHLY INCOME
Below $150 40.48
$151-$300 35.71
$300-$500 19.04
Above $500 4.77
Total 100.0
TYPE OF ACCOMODATION
Detached (shared) 20.45
Semi-detached (shared) 43.18
Detached (not shared) 18.18
Semi-detached (not shared) 9.09
Flat 4.55
Shack 4.55
Total 100.0
MAIN SOURCE OF DRINKING WATER
Tap 63.63
Borehole 11.36
Protected well 13.63
Unprotected well 2.27
Bottled 9.09
Total 100.0
N=44
4.7.3 Injuries
Two weeks preceding the survey, about 10% of children suffered from injuries. The largest
proportion, 57%, suffered from open wounds while 24% suffered from burns (Figure 4.7.4).
About 5% had fractured arms, 10% had head injuries and 4% suffered due to poisoning.
Medical staff reported a higher incidence of injuries among boys than girls especially
between three and five years.
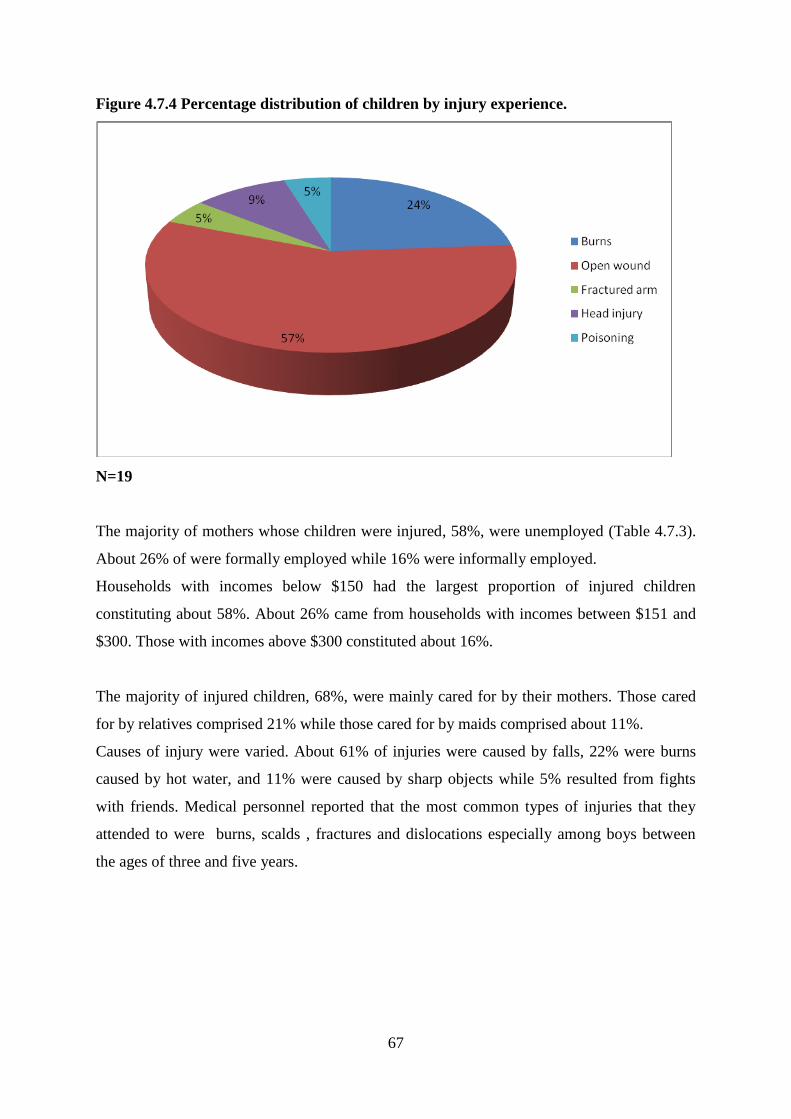
67
Figure 4.7.4 Percentage distribution of children by injury experience.
N=19
The majority of mothers whose children were injured, 58%, were unemployed (Table 4.7.3).
About 26% of were formally employed while 16% were informally employed.
Households with incomes below $150 had the largest proportion of injured children
constituting about 58%. About 26% came from households with incomes between $151 and
$300. Those with incomes above $300 constituted about 16%.
The majority of injured children, 68%, were mainly cared for by their mothers. Those cared
for by relatives comprised 21% while those cared for by maids comprised about 11%.
Causes of injury were varied. About 61% of injuries were caused by falls, 22% were burns
caused by hot water, and 11% were caused by sharp objects while 5% resulted from fights
with friends. Medical personnel reported that the most common types of injuries that they
attended to were burns, scalds , fractures and dislocations especially among boys between
the ages of three and five years.

68
Table 4.7.3: Percentage distribution of children who suffered from injury by mother’s
socio-economic background
CHARACTERISTICS PERCENTAGE
MOTHER’S EMPLOYMENT STATUS
Unemployed 57.89
Formally employed 26.32
Informally employed 15.78
Total 100.0
HOUSEHOLD MONTHLY INCOME
Below $150 57.89
$151-$300 26.32
$300-$500 10.53
Above $500 5.26
Total 100.0
MAIN CAREGIVER
Mother 68.42
Relative 21.05
Maid 10.53
Total 100.0
CAUSE OF INJURY
Fall 61.11
Cut with sharp objects 11.11
Fights 5.56
Burnt with hot water 22.22
Total 100.0
N=19
4.7.4 Malnutrition
Mothers were asked if their children had shown signs of malnutrition in the two weeks
preceding the survey. Only 3% of the children were reported to have shown symptoms of
malnutrition such as being skinny with swollen limbs and bloated tummies. Some had tightly
curled hair, pale dry scaly skin and discoloured nails (Table 4.7.4). Of those who showed
signs of malnutrition, only about half were treated. It was noted that some members of the
apostolic sect had not taken their children for treatment; instead they had taken them to their
shrine for prayers.
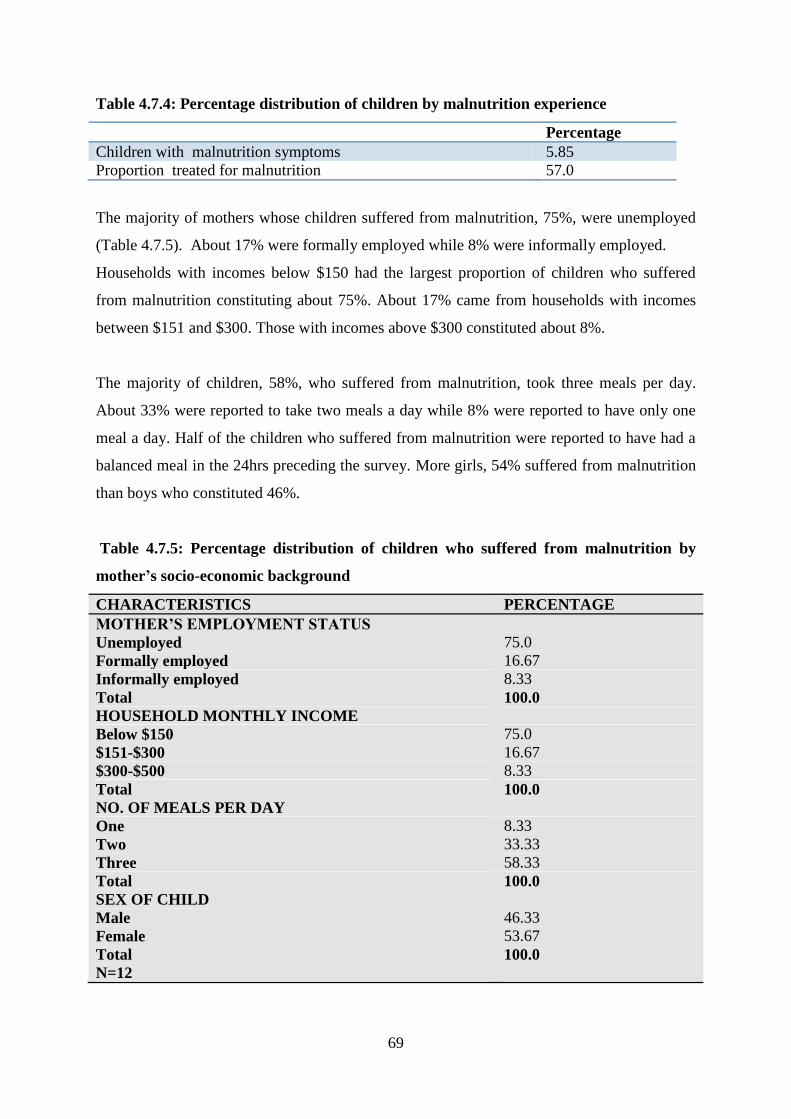
69
Table 4.7.4: Percentage distribution of children by malnutrition experience
Percentage
Children with malnutrition symptoms 5.85
Proportion treated for malnutrition 57.0
The majority of mothers whose children suffered from malnutrition, 75%, were unemployed
(Table 4.7.5). About 17% were formally employed while 8% were informally employed.
Households with incomes below $150 had the largest proportion of children who suffered
from malnutrition constituting about 75%. About 17% came from households with incomes
between $151 and $300. Those with incomes above $300 constituted about 8%.
The majority of children, 58%, who suffered from malnutrition, took three meals per day.
About 33% were reported to take two meals a day while 8% were reported to have only one
meal a day. Half of the children who suffered from malnutrition were reported to have had a
balanced meal in the 24hrs preceding the survey. More girls, 54% suffered from malnutrition
than boys who constituted 46%.
Table 4.7.5: Percentage distribution of children who suffered from malnutrition by
mother’s socio-economic background
CHARACTERISTICS PERCENTAGE
MOTHER’S EMPLOYMENT STATUS
Unemployed 75.0
Formally employed 16.67
Informally employed 8.33
Total 100.0
HOUSEHOLD MONTHLY INCOME
Below $150 75.0
$151-$300 16.67
$300-$500 8.33
Total 100.0
NO. OF MEALS PER DAY
One 8.33
Two 33.33
Three 58.33
Total 100.0
SEX OF CHILD
Male
Female
Total
N=12
46.33
53.67
100.0

70
4.7.5 Malaria
As reported earlier, Norton is considered a malaria free zone; hence malarial morbidity is rare
among children. Only about 1% of the children suffered from malaria in the two weeks
preceding the survey. Medical personnel had this to say about malaria:
“Usually people who suffer from malaria would have travelled to other areas where
malaria is likely.”
It is interesting to note that occurrence of all major diseases among the children was most
prevalent among children with unemployed mothers, low income households and shared
accommodation. It is the reason why these diseases are sometimes referred to as diseases of
poverty as living condition promote their spread.
4.7.6 Perceived Health Status of children
Mothers were asked about their perception about their children’s health status. About 14%
were reported to have excellent health (Figure 4.7.5). Approximately 42% were reported to
be in a very good state of health while 25% were reported to be in good health. Those
perceived to have poor and very poor health were 4% and 2% respectively.
Figure 4.7.5: Percentage distribution of perceived health status of
children
N=169

71
Asked of their opinion about the health delivery system, only about 1% reported that it was
excellent (Table 4.7.6). About 3% rated it very good while 47% rated it good. Thirty-seven
per cent reported that it was poor; about 10 % reported it to be very poor, while 2% did not
know.
Table 4.7.6: Percentage distribution of respondents’ perception of local health system
HEALTH DELIVERY SYSTEM
Percentage
Excellent 1.18
Very good 2.95
Good 47.34
Poor 37.28
Very poor 9.47
Don’t know 1.78
Total 100.0
N=169
4.7.7 Perceived causes of morbidity
Finally, respondents were asked what they considered to be the main cause of morbidity for
children in Katanga. The majority of the respondents, 37%, blamed the water shortages and
the poor quality of water, while about 16% attributed children’s sicknesses to uncollected
garbage (Table 4.7.7). Sewer bursts were reported to be among the major contributors to
children’s’ illnesses at 15%. About 7% attributed it to lack of food while an equal proportion
blamed poor sanitation for the problems. The remaining 25% reported other causes such as
mother to child transmission of the HIV virus, lack of immunisation, overcrowding,
unhygienic vending stalls and electricity cuts resulting in lack of refrigeration.
Medical personnel reported that among the major cause of child morbidity in Katanga were
malnutrition with anti-retroviral weakness, respiratory problems and water contamination
resulting in diarrhoea. Environmental personnel attributed child morbidity to poor quality of
air, poor sanitation, and open refuse dumping, overcrowding and underground water
contamination among other things. It was reported that there was no assessment of ground
water that was being done to make sure that the water was safe for drinking.

72
Table 4.7.7: Percentage distribution of respondents’ perception of cause of morbidity
Cause of morbidity Percentage
Garbage 15.98
Water shortage and poor quality 36.68
Poor sanitation 7.10
Lack of food 7.10
MTCT 5.33
Sewage 14.79
Lack of Immunisation 3.55
Electricity cuts 2.96
Unhygienic vending 2.96
Overcrowding 3.55
Total 100.0
N=169
4.7.8 Resultant Mortality
In some cases, morbidity was reported to have resulted in mortality. About 9% of respondents
had lost at least a child born alive. Of those children who died, 47% died during the first
week of life (Table 4.7.8). Approximately 18% died between one week and six months while
35% died after reaching one year.
Causes of death varied with fever and pneumonia contributing to 42% of the deaths. Other
major contributors were reported to be premature birth constituting about 18% while
prolonged labour and dehydration constituted 12% each. The remaining 22% of deaths were
due to negligence by hospital staff, infections and malnutrition.

73
Table 4.7.8: Percentage distribution of children by age and cause of death
AGE AT DEATH
Age Percentage
First week of life 47.05
Between one week and one year 17.65
Over one year 35.3
Total 100.0
CAUSE OF DEATH
Pneumonia 17.60
Fever 23.54
Premature birth 17.64
Long labour by mother 11.76
Dehydration 11.76
Negligence 5.88
Throat infection 5.88
Malnutrition 5.88
Total 100.0
N=17
74
CHAPTER FIVE
DISCUSSION OF FINDINGS, CONCLUSIONS AND
RECOMMENDATIONS
5.1 Discussion
Findings reflected a youthful population with the majority of respondents, 66%, aged below
30, while about 4% were in the extreme ages below 15years and above 44 years of age. The
age of the mother is an important factor in determining the child’s health. Study findings
show that the mother’s age did not have a significant impact on child morbidity as only a
small proportion, about 4%, was in the extreme ages. Furthermore the proportion of mothers
who experienced complications due to age was very low at only 4%. Although there was a
low number of complications reported in this study, WHO (2003) observed that in low- and
middle-income countries, babies born to mothers under 20 years of age face a 50% higher
risk of being still born or dying in the first few weeks versus those born to mothers aged 20-
29.
About 82% of the respondents reported that they attended secondary school while 8%
attended tertiary education. Only 1% had no education at all. This reflected a fairly literate
population and it was expected that they could read and write and communicate fairly well.
Despite being a fairly literate population, the levels of education attained could not usher
them into formal employment hence most of the women, 77% were unemployed. A small
proportion of the sample, 23%, reported that they were employed either formally or
informally.
An analysis of employment and income showed that that there was a positive relationship
between education/income and disease occurrences as 74% of children who suffered disease
in the two weeks preceding the survey had unemployed mothers and 69% came from
households with incomes below $300. UNESCO (2009) reported that having a mother with
secondary or higher education reduces the risk of child mortality by 50% compared to having
a mother with no education. Kembo and Van Ginneken (2009) also noted that mortality
among children whose mothers completed primary or secondary education is reduced by 24
percent and 41 percent, respectively when compared with mothers without education at all.

75
The majority reported that they relied on spouse and or family members for income given
that married women, 89%, constituted the majority of the respondents, while single, divorced,
and separated and widows constituted the remaining 11%. The marriage union to some
extent provided stability within households and better incomes. More than 80% of the
respondents had incomes below the poverty datum line. The mean household income was
however, $220 which was below the poverty datum line of $467 per month. Hence, the
majority of households were in poverty. MDG Report (2010) reported that about 62.6% of
people in Zimbabwe had incomes below the poverty datum line and are deemed to be poor.
As a result of low incomes, it followed that housing standards were low. About 57% of the
respondents lived in shared accommodation with shared toilet facilities resulting in
overcrowding. Overcrowding provided an environment conducive for the spread of
communicable diseases such as diarrhoea and flu. Keraka and Wamicha (2003), in their
study, concluded that poverty is a major factor in child morbidity and mortality because low
income levels meant families were not able to improve sanitation and in turn unable to
improve the health status of the children. W.H.O (2002) also estimated that water related
diseases account for 4% of all deaths and 5.7% of the total disease burden in children. It
reiterated that in Africa, most children are exposed to risks associated with the above
mentioned factors.
Findings showed that running water availability was reportedly erratic. According to Kembo
and Van Ginneken (2009), only 36% of Zimbabwean households had piped water. About
57% of respondents reported that running water was either rarely available or never available,
while 34% reported that they always had running water in their homes. City council officials
acknowledged the problem of water shortages in the town. About 67% reported that they
used the tap as their main source of drinking water while 27% used water from boreholes and
protected wells. Those who used bottled water were 4%. Water treatment was done by a
small proportion constituting only 22%. They treated either by boiling, adding bleach,
chlorine or using filters. Seventy eight percent of respondents reported that they did not treat
water before drinking.
Unavailability of water coupled with the use of unsafe water sources for drinking were
among the major determinants of diarrheal morbidity in Katanga. Granted that most houses
were overcrowded and shortages of water rendered flush toilets useless, the hygiene and

76
sanitation standards of households were greatly compromised. Findings also suggest that
many families were exposed to water borne diseases. Tap water was reportedly the most
common source for drinking water yet it was reported to be of very poor quality. Evidence
showed that the majority, 63%, of children who suffered from diarrhoea were using tap water
for drinking. It was also reported by Environmental personnel that water from underground
sources was not assessed for quality hence some of it could be contaminated. According to
ZDHS (2011) diarrhoea is somewhat more prevalent among children whose households do
not have an improved source of drinking water 16 % compared with children from
households that do 12 %. Similarly, the prevalence of diarrhoea is higher among children
whose households do not have an improved toilet facility or who share a facility with other
households 14 % compared with households that have an improved, unshared toilet facility
11 %. MIMS (2009) has asserted that unsafe drinking water can be a significant vehicle for
diseases such as diarrhoea, cholera and typhoid.
Environmental Assessments showed that there were some serious environmental problems
associated with lack of water, dusty roads, burst sewer pipes, open garbage dumps and long
uncut grass. The presence of burst sewer pipes and flowing raw sewage was a cause for
concern. Quick response to sewer bursts was reported to be hampered by lack of resources in
the Council. Most respondents, 35%, reported a poor response to sewer bursts by council
hence sewage streams could flow for weeks without being attended to as evidenced by some
pools of sewage seen right in front of houses.
Open dumping had become a common culture in the township. About 48% of the respondents
reported that there were some garbage dumps near their houses and they admitted dumping
their rubbish in those areas. A study carried out in Chinhoyi revealed that failure by Council
to collect household waste has resulted in households using other methods to dispose their
household waste, which included; burning, dumping in open pits and/or burying at home,
illegally dumping in the street corners or storm drains and compositing posing hazards to the
environment and increasing the health risk of the residents (Musademba et al, 2011).
Of the problems emanating from the garbage dumps, 76% reported problems of flies and
50% reported rodents while others were concerned with underground contamination of their
sources of drinking water. In a nutshell, the environment was conducive for the spread of
diseases especially diarrhoea. Chifamba (2007) observes that accumulation of copper (Cu),
77
lead (Pb), and zinc (Zn) is found within waste disposal sites. Mismanagement of solid wastes
not only pollutes the land but also contaminates surface and underground water.
The majority of respondents, 83%, reported placing disposable nappies in bins while
remaining 17% reported placing them in rubbish pits or burying them in the ground. This
exposed the children to health hazard as some of the rubbish from bins ended up in open
dumping areas. Hence faecal matter was supposedly finding its way back to the children’s
food in their nails as some of them played in the garbage dumps. Stool buried in the ground
could end up contaminating sources of drinking water causing a vicious cycle of disease. No
comparisons were made with other studies concerning disposal of nappies.
Antenatal practices during pregnancy have serious implications on the health of a child.
WHO Focused Antenatal Care Protocol ( 2001) recommends that a pregnant woman should
seek ANC in the first four months of pregnancy. Results of this study show that only 39% of
respondents reported that they started attending ANC in the first four months of their
pregnancy. Although timely ANC first attendance was reportedly low, there were few
complications, 9%, that were reported in mothers during and after delivery with only 4% of
children being affected as a result. However, UNICEF (2004) has attributed 20% 0f the
burden of disease in children below five to poor maternal health and nutrition coupled with
quality of care at delivery.
According to survey results, HIV counselling and testing was taken up by 89% of the mothers
during ANC. Comparatively, the Maternal and Perinatal Mortality study, (2007) reported a
low percentage of women, 34%, being tested for HIV during pregnancy hence they missed
out on the opportunity to reduce or eliminate vertical transmission of HIV. Despite the good
uptake of HIV counselling and testing in the survey results, mother to child transmission of
HIV remained a cause for concern for medical personnel. According to Hospital personnel,
lower respiratory infections (LRI) such as pneumonia were among the major causes of
morbidity and they were mainly due to compromised immune system as a result of HIV
infection.
Findings suggested a high level of hospital use during delivery with 90% reporting that they
delivered in hospitals. Most of the women, 69%, delivered in government hospitals while
11% delivered in private hospitals. About 8% delivered at home and the remaining 12%
delivered in clinics, mission facilities and traditional facilities. While it is important that child
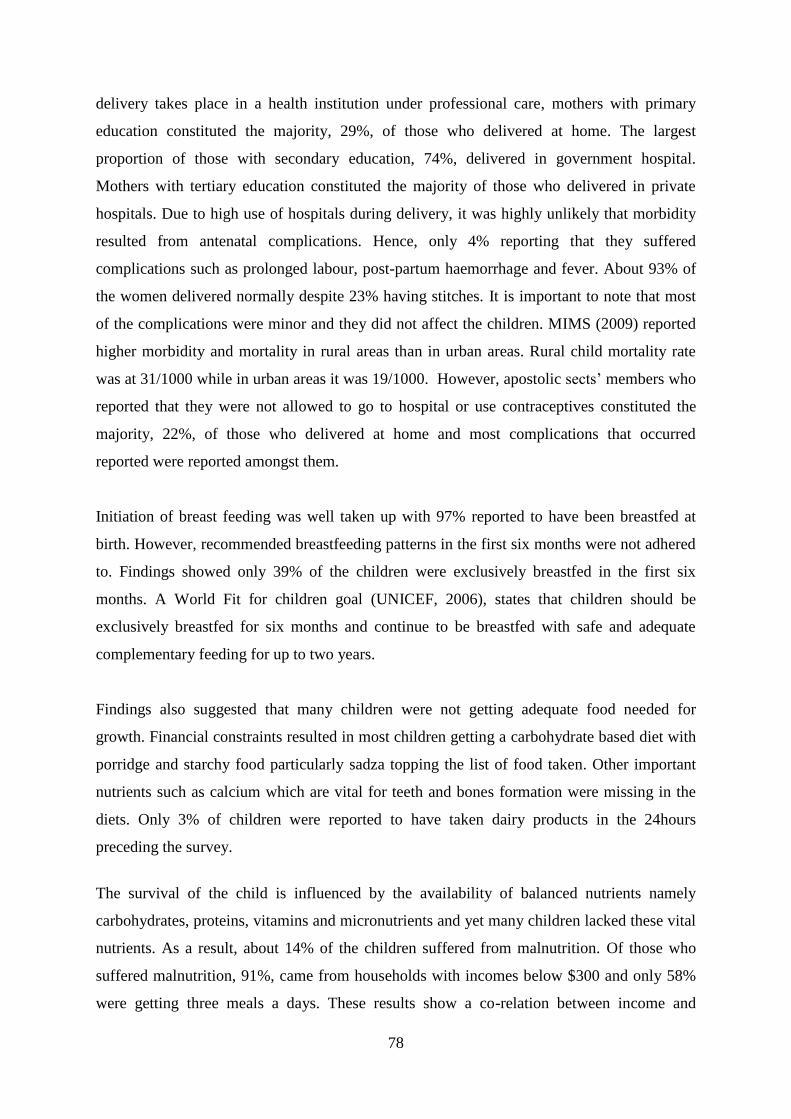
78
delivery takes place in a health institution under professional care, mothers with primary
education constituted the majority, 29%, of those who delivered at home. The largest
proportion of those with secondary education, 74%, delivered in government hospital.
Mothers with tertiary education constituted the majority of those who delivered in private
hospitals. Due to high use of hospitals during delivery, it was highly unlikely that morbidity
resulted from antenatal complications. Hence, only 4% reporting that they suffered
complications such as prolonged labour, post-partum haemorrhage and fever. About 93% of
the women delivered normally despite 23% having stitches. It is important to note that most
of the complications were minor and they did not affect the children. MIMS (2009) reported
higher morbidity and mortality in rural areas than in urban areas. Rural child mortality rate
was at 31/1000 while in urban areas it was 19/1000. However, apostolic sects’ members who
reported that they were not allowed to go to hospital or use contraceptives constituted the
majority, 22%, of those who delivered at home and most complications that occurred
reported were reported amongst them.
Initiation of breast feeding was well taken up with 97% reported to have been breastfed at
birth. However, recommended breastfeeding patterns in the first six months were not adhered
to. Findings showed only 39% of the children were exclusively breastfed in the first six
months. A World Fit for children goal (UNICEF, 2006), states that children should be
exclusively breastfed for six months and continue to be breastfed with safe and adequate
complementary feeding for up to two years.
Findings also suggested that many children were not getting adequate food needed for
growth. Financial constraints resulted in most children getting a carbohydrate based diet with
porridge and starchy food particularly sadza topping the list of food taken. Other important
nutrients such as calcium which are vital for teeth and bones formation were missing in the
diets. Only 3% of children were reported to have taken dairy products in the 24hours
preceding the survey.
The survival of the child is influenced by the availability of balanced nutrients namely
carbohydrates, proteins, vitamins and micronutrients and yet many children lacked these vital
nutrients. As a result, about 14% of the children suffered from malnutrition. Of those who
suffered malnutrition, 91%, came from households with incomes below $300 and only 58%
were getting three meals a days. These results show a co-relation between income and
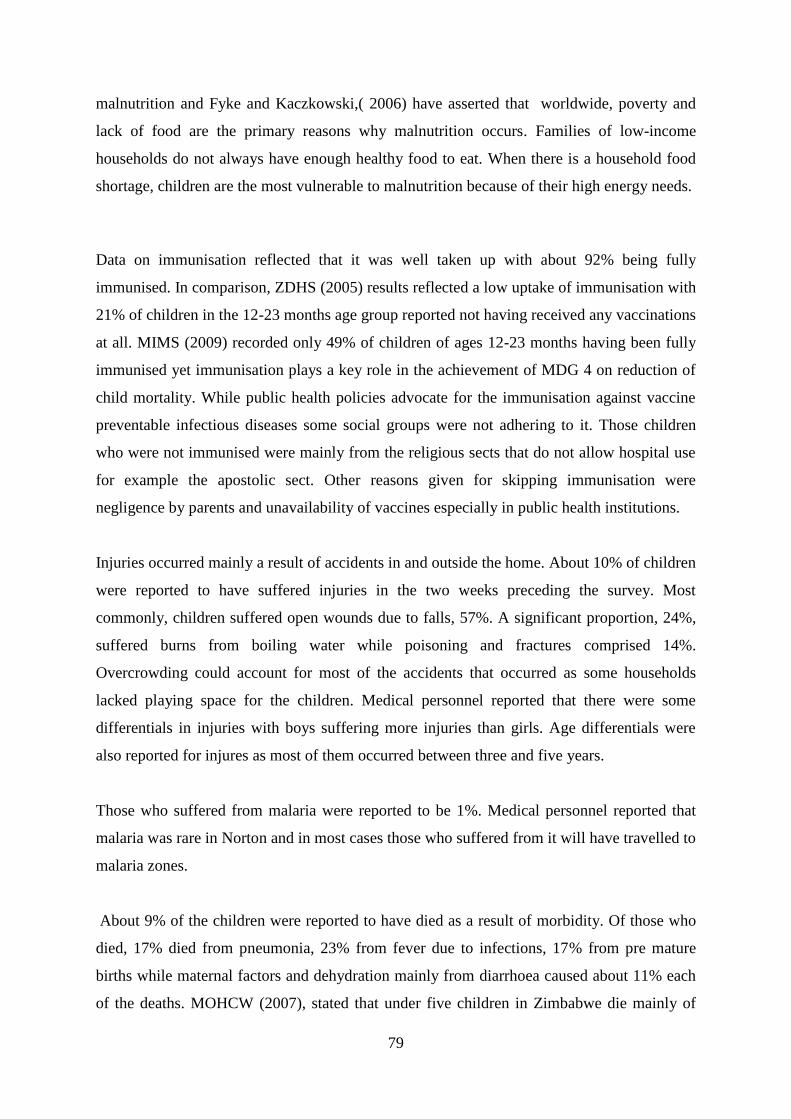
79
malnutrition and Fyke and Kaczkowski,( 2006) have asserted that worldwide, poverty and
lack of food are the primary reasons why malnutrition occurs. Families of low-income
households do not always have enough healthy food to eat. When there is a household food
shortage, children are the most vulnerable to malnutrition because of their high energy needs.
Data on immunisation reflected that it was well taken up with about 92% being fully
immunised. In comparison, ZDHS (2005) results reflected a low uptake of immunisation with
21% of children in the 12-23 months age group reported not having received any vaccinations
at all. MIMS (2009) recorded only 49% of children of ages 12-23 months having been fully
immunised yet immunisation plays a key role in the achievement of MDG 4 on reduction of
child mortality. While public health policies advocate for the immunisation against vaccine
preventable infectious diseases some social groups were not adhering to it. Those children
who were not immunised were mainly from the religious sects that do not allow hospital use
for example the apostolic sect. Other reasons given for skipping immunisation were
negligence by parents and unavailability of vaccines especially in public health institutions.
Injuries occurred mainly a result of accidents in and outside the home. About 10% of children
were reported to have suffered injuries in the two weeks preceding the survey. Most
commonly, children suffered open wounds due to falls, 57%. A significant proportion, 24%,
suffered burns from boiling water while poisoning and fractures comprised 14%.
Overcrowding could account for most of the accidents that occurred as some households
lacked playing space for the children. Medical personnel reported that there were some
differentials in injuries with boys suffering more injuries than girls. Age differentials were
also reported for injures as most of them occurred between three and five years.
Those who suffered from malaria were reported to be 1%. Medical personnel reported that
malaria was rare in Norton and in most cases those who suffered from it will have travelled to
malaria zones.
About 9% of the children were reported to have died as a result of morbidity. Of those who
died, 17% died from pneumonia, 23% from fever due to infections, 17% from pre mature
births while maternal factors and dehydration mainly from diarrhoea caused about 11% each
of the deaths. MOHCW (2007), stated that under five children in Zimbabwe die mainly of

80
respiratory infections (13%), malaria (3%), diarrhoea (9%), AIDS (21 %), neonatal
complications (29%) while malnutrition is an underlying cause in most of the deaths. A
comparison of the figures shows that survey results to a greater extent reflect on the country
situation on under five causes of death.
Mainly women of the apostolic sect had lost children due to the fact that they are not attended
by skilled workers at delivery and they did not attend hospital when their children got sick.
Timely intervention could have saved the majority of children who died especially from
dehydration and infections.
The pattern noted was that disease occurred mostly among children from low income
household and who lived in shared accommodation. The children in these households were
likely to be surviving on unbalanced diets due to financial constraints. Overcrowding also
contributed in the quick spread of communicable diseases such as diarrhoea and flue and to
the likely occurrence of injuries.
5.2 Conclusions
From the findings, it can be concluded that underlying factors for child morbidity in Katanga
are mainly environmental factors and maternal factors working through deteriorated socio-
economic structures. Socio–economic factors such as education of the mothers, income,
accommodation type and religious beliefs affect the outcome of a child’s health. Findings
suggested that most mothers were unemployed and household incomes were low. Hence,
provision of goods and services necessary for child growth and survival were compromised.
Accommodation was mainly shared and facilities such as toilets were overburdened. These
conditions provided a conducive environment for the spread of disease. The influence of
religion and culture cannot be underestimated in determining child morbidity. It was clear
that religions that prohibit hospital and contraceptive use put both mother and child at risk of
sickness. Most morbidities and mortality occurred among children from apostolic sects.
Institutional arrangements have also deteriorated such that the basic provisions such as water,
garbage collection and maintenance of sewer systems could no longer be met. As a result, the
environment was greatly compromised. The environment was generally dirty with
indiscriminate open dumping, flowing raw sewage, dust and uncut grass. Lack of clean

81
running water resulted in the malfunctioning of indoor toilets. It also resulted in people
drinking dirty water from various water sources. Coupled with overcrowding, it aided the
spread of diarrheal diseases.
Maternal factors particularly the mother’s health also played a role in child morbidity. Some
mothers gave birth in the extreme ages below 15 years and above 44 years. Another
important maternal factor was the mother to child transmission of the HIV virus. This
resulted in a number of children being born underweight and some suffered from ARIs in
some cases leading to death.
5.3 Recommendations
The findings support the need for workable strategies to reduce child morbidity given the
economic situation. The following are some of the proposed recommendations that may help
to achieve MDG 4 at local and national levels.
5.3.1 Local Level
The Town Council should consider institutional arrangements that improve the water
supply situation such as drilling boreholes and give priority to the establishment of a
water treatment plant for the town.
The Town Council should consider waste management options that encourage
recycling as guided by the three Rs of waste management i.e. reuse, recycle and
reduce waste. Also encourage separation of biodegradable and non-biodegradable
waste as a way of promoting reuse and recycling.
The Town Council must improve timely response to sewer bursts, giving it priority
over other non-life threatening issues.
The Local government should fast track the introduction of punitive measures for
open dumping and other environmental offences such as burning litter at the same
time improving on timeous garbage collection.
The Town Council must intensify the campaign for hospital use among members of
the apostolic sects and other cultural groups.
82
5.3.2 National Level
The Ministry of Education and Culture should promote education of the girl child and
encourage income generation among females so as to improve household incomes
through partnerships with advocacy groups and organisations.
Ministry of Education and Culture should intensify the campaign against HIV and
AIDS by promoting good behaviour in schools so as to instil a sense of responsibility
at an early age.

83
REFERENCES
1. AL-NAGGER, N.S. (2009). Perspectives of Paediatric Nursing. Viewed on
www.slidefinder.net.
2. BAKWIN, K.N and MADISE. (2004). Spatial Determinants of Childhood Morbidity
in Sub-Saharan Africa, Implications for Child survival, Southampton: University of
Southampton.
3. BENDER, D. A. (2005). Dictionary of Food and Nutrition. London: Oxford
University Press.
4. BENSON, T and SEKAR, M. (2006). Trends and Issues in Child Under nutrition,
National Centre for Biotechnology Information, Bethesda: US National Library of
Medicine.
5. BLACK, R.E. MORRIS, S.S and BRYCE, J. (2003). Where and why are ten million
children dying every year? Lancet. 361. pp. 2226-2234.
6. BLACK, R.E. (1984). Diarrheal Diseases and Child Morbidity and Mortality.
Population and Development Review. 10. pp. 141-161.
7. CALDWELL, J.C. REDDY, P.H. and CALDWELL, P. (1988). The causes of
Demographic Change. Experimental Research in South India. Madison: University of
Wisconsin Press.
8. CHIFAMBA, P. (2007). Trace Metal Contamination of Water at a Solid Waste
Disposal at Kariba. Zimbabwe. African Journal of Aquatic Science. 32(1). pp 71-78.
9. CZEIZEL, A.E. (2005). Birth Defects are Preventable. International Journal of
Medical Sciences. 2. pp. 91-129.
10. DE COOK, K.M. et al. (2000). Prevention of Mother-to -child HIV Transmission in
Resource poor Countries. Chicago. JAMA.
11. EWBANK, D.C and GRIBBLE, J.N. (1993). Effects of Health Programs on Child
Mortality in Sub Saharan Africa. Washington D.C. National Academy Press.
12. FYKE, M.K and KACZKOWSKI, C.H. (2006). Malnutrition. Michigan. Thomas
Gale.
13. http://kidshealth.org/parent/infections/parasitic/malaria.html
14. http://www.ceeindi.org.mdgs/goal-4html
15. http:www.en.wikipedia.org/wiki/congenital
16. http://www.unesco.org/new/en/education/themes/leading-the-international-
agenda/education-for-all/education-and-the-mdgs/goal-4/
84
17. INTER-AGENCY GROUP FOR CHILD MORTALITY ESTIMATION. (2011)
Levels and trends in child Mortality, New York .United Nations.
18. KATZ, S.H. and WEAVER, W.W. (2002). Gale encyclopaedia of Food and Culture,
Michigan. Thomas Gale.
19. KEMBO, J. and VAN GINNEKEN, J.K. (2009). Determinants of Infant and Child
mortality in Zimbabwe: results of multivariate hazard analysis. Demographic
Research. 21. pp. 367-384.
20. KARAKA, M.N and WAMICHA, W.N. (2003). Child Morbidity and Mortality in
Slum Environments along Nairobi River. East African Social Science Research
Review. 19(1). pp. 41-57.
21. KEUZETA, J.J. et al. (1988). Infant and Child Morbidity and Mortality due to
diarrheal disease in Central Africa. Bethesda MD. NCBI.
22. LONGE, J.L. and BLANCFIELD, D. (2002). The Gale Encyclopaedia of Medicine.
Michigan: Gale Group.
23. LYCNH, J.K. (2004). Cerebrovascular Disorders in Children. Current Neurology and
Neuroscience Reports. 4. pp. 129-138.
24. MADHI, S.A. & KLUGMAN, K.P. (2006). Disease and Mortality in Sub-Saharan
Africa, Washington D.C: World Bank.
25. McKEOWN, T. (1976). The Modern rise of Population. London: Butler and Turner.
26. Ministry of Health and Child Welfare. (2010). The Millennium Development Goals
Status Report, Harare: C.S.O.
27. Ministry of Health and Child Welfare. (2007). Maternal and Perinatal Mortality
Study, Harare: MOHCW.
28. MOSLEY, W.H. and CHEN, L.C. (1984). An Analytical Framework for the Study of
Child Survival in Developing Countries. Population and Development Review .10. pp.
25-45.
29. MUSADEMBA, D. et al. (2011). Municipality Solid Waste Management Challenges
in Chinhoyi Town in Zimbabwe: Opportunities of Waste Reduction and Recycling.
Journal of Sustainable Development in Africa. 13(2) pp 168-180.
30. PRESSAT, R. (1988).The Dictionary of Demography. Great Britain:Detosios
Printers.
31. RAZALLE, P.E. (1974). An Interpretation of the Modern Rise of Population in
Europe. A Critique. Journal of Demography. 28 (1). pp. 5-17.

85
32. SEKHIRI, N. (2006). From Funding to Action. Strengthening Healthcare Systems in
Sub-Saharan Africa. Geneva: World economic Forum.
33. SIMOES, E.A.F et al. (2009). Acute Respiratory Infections in Children, Disease
Control Priorities in Developing Countries, Bethesda M.D: NCBI.
34. TAUSSIG, L.M. (2008). Paediatric Respiratory Medicine. Philadelphia: Mosby Inc.
35. TRAMILTON, L. (2010). Malaria symptoms in Children. University of Liverpool.
England viewed on www.e-how.com
36. UNICEF . (2008).The state of the World’s Children. New York: United Nations.
37. UNICEF/WHO. (2009). Diarrhoea, why children are still dying and what can be done.
Geneva: United Nations.
38. UNITED NATIONS. (2010). The Millennium Development Goals Report. New
York: United Nations.
39. WEEKS, J.R. (1986). Population, An Introduction to concepts and Issues. Belmont:
Wadsworth Publishing Company.
40. WILSON, S. L. (2009). Determinants of Childhood Morbidity and the Role of
Malnutrition. Evidence from Indonesia. Baltimore: University of Maryland.
41. WORLD HEALTH ORGANISATION (1999). Guidelines for Epidemic Preparedness
and Response to Measles outbreaks. Geneva:W.H.O.
42. WORLD HEALTH ORGANISATION. (2005). Technical updates of the guidelines
on Integrated Management of childhood Illnesses. Evidence and Recommendations
for further adaptations. New York: United Nations.
43. WORLD HEALTH ORGANISATION. (2003). The World Health Report. Geneva.
44. WORLD HEALTH ORGANISATION. (2000). Turning the Tide of Malnutrition
Responding to the Challenge of the 21St
Century. Geneva.
45. www.imva.org/pages/deadtext.html
46. www.nhs.co.uk
47. www.nhsdirect.wales.nhs.uk/encyclopaedia/c/article/cerebrovasculardisease/
48. www.ucsfbenioff children’s.org
49. www.ucsfbenioofchildrens.org/pdf/manuals/25-RDS.pdf
50. www.unicef.org./index.php
51. www.unicef.org/media/files/child-mortality
52. www.unicef.org/progress for children/2004/subsaharan africa.php
53. ZIMSTAT .(2002). Zimbabwe Census: National Report. Harare: Central Statistical
Office.
86
54. ZIMSTAT. (2002). Zimbabwe Census. Mashonaland West Provincial Profile, Harare:
Central Statistical Office.
55. C.S.O/ MACRO INTERNATIONAL INC. (2005). Zimbabwe Demographic and
Health Survey Country Report: Harare Central Statistical Office.
56. ZIMSTAT and UNICEF. (2009). Multiple Indicator Monitoring Survey, Harare:
ZIMSTAT.

87
APPENDIX 1
STRUCTURED QUESTIONNAIRE FOR MOTHERS
My name is ………………………… I am a student at the University of Zimbabwe. I am
carrying out a study assess the determinants of child morbidity in Katanga Township. I would
like to interview mothers with children under the age of five years. I am appealing for your
assistance in my research by answering the questions that I am going to ask you.
You are encouraged to answer all questions; however you should not answer questions that
you are not comfortable with. In case you do not wish to continue, please feel free to
withdraw from the interview. Your name will not be written on this form and all the
information given will be treated with confidentiality. Thank you for your cooperation.
Questionnaire ID number………………………………………………………………..
Date of Interview…………. /……………. /……………………………………………….
Results Code: Completed 1; Refused 2; Partially completed 3; Other 4
SECTION ONE – POPULATIONAND HOUSEHOLD CHARACTERISTICS
Questions about demographic characteristics
D1 How old are you?
…………………..years
Below 15……1
15-19………...2
20-24………...3
25-29………...4
30-34………...5
35-39………...6
40-44…………7
Above 44…….8
D2 Marital Status Single
Married
Widowed
Divorced/separated
Other…………………………..
1
2
3
4
D3 Highest education
level attained
No education
Primary
Secondary
Tertiary
Other……………………….
1
2
3
4
5
D4 Occupation Unemployed
Formal
Informal
Other………………………….
1
2
3
4
D5 Spouse’s Education No education
Primary
1
2
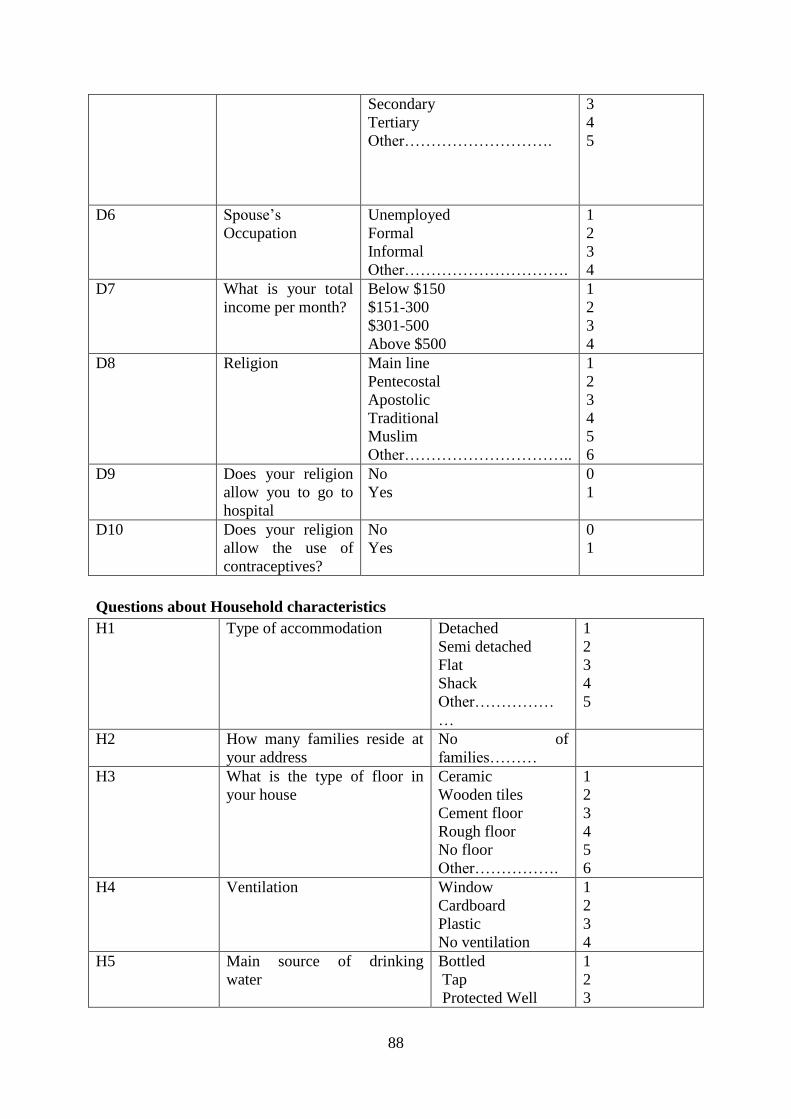
88
Secondary
Tertiary
Other……………………….
3
4
5
D6 Spouse’s
Occupation
Unemployed
Formal
Informal
Other………………………….
1
2
3
4
D7 What is your total
income per month?
Below $150
$151-300
$301-500
Above $500
1
2
3
4
D8 Religion Main line
Pentecostal
Apostolic
Traditional
Muslim
Other…………………………..
1
2
3
4
5
6
D9 Does your religion
allow you to go to
hospital
No
Yes
0
1
D10 Does your religion
allow the use of
contraceptives?
No
Yes
0
1
Questions about Household characteristics
H1 Type of accommodation Detached
Semi detached
Flat
Shack
Other……………
…
1
2
3
4
5
H2 How many families reside at
your address
No of
families………
H3 What is the type of floor in
your house
Ceramic
Wooden tiles
Cement floor
Rough floor
No floor
Other…………….
1
2
3
4
5
6
H4 Ventilation Window
Cardboard
Plastic
No ventilation
1
2
3
4
H5 Main source of drinking
water
Bottled
Tap
Protected Well
1
2
3
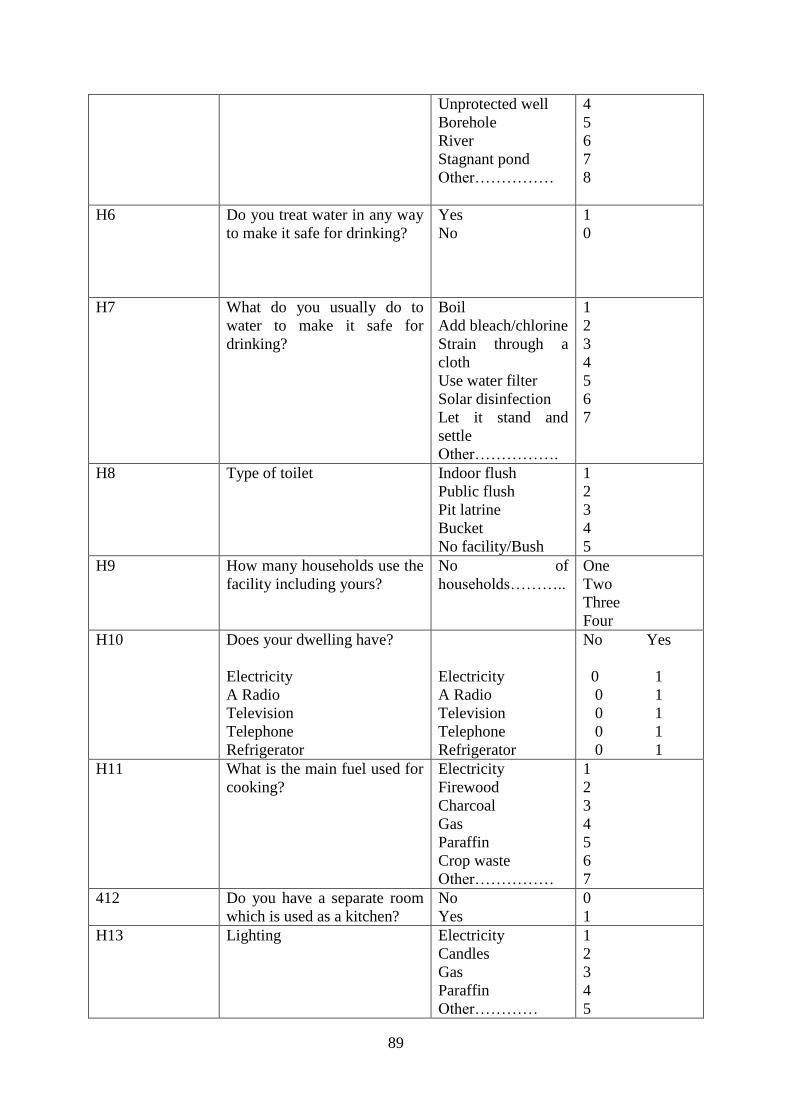
89
Unprotected well
Borehole
River
Stagnant pond
Other……………
4
5
6
7
8
H6 Do you treat water in any way
to make it safe for drinking?
Yes
No
1
0
H7 What do you usually do to
water to make it safe for
drinking?
Boil
Add bleach/chlorine
Strain through a
cloth
Use water filter
Solar disinfection
Let it stand and
settle
Other…………….
1
2
3
4
5
6
7
H8 Type of toilet Indoor flush
Public flush
Pit latrine
Bucket
No facility/Bush
1
2
3
4
5
H9 How many households use the
facility including yours?
No of
households………..
One
Two
Three
Four
H10 Does your dwelling have?
Electricity
A Radio
Television
Telephone
Refrigerator
Electricity
A Radio
Television
Telephone
Refrigerator
No Yes
0 1
0 1
0 1
0 1
0 1
H11 What is the main fuel used for
cooking?
Electricity
Firewood
Charcoal
Gas
Paraffin
Crop waste
Other……………
1
2
3
4
5
6
7
412 Do you have a separate room
which is used as a kitchen?
No
Yes
0
1
H13 Lighting Electricity
Candles
Gas
Paraffin
Other…………
1
2
3
4
5

90
H14 Do you read the newspaper No
Yes
0
1
H15 If yes, how often Regularly
Most of the times
Sometimes
Rarely
1
2
3
4
Environmental Assessment
E1 What type of napkins do you
use for the baby?
Cloth nappy
Disposable nappy
Panties
Other……………..
E2 When you use cloth nappies
and panties, how do you clean
them and dispose of stool?
Rinse into toilet
Rinse into drain or
ditch
Throw waste into
garbage
Burry the waste
Left in the open
Other..................
1
2
3
4
5
6
E3 If you use disposable nappies,
how do you dispose of them?
Place in bin
Bury in ground
Place in rubbish pit
Throw into pit
latrine
Throw into the bush
Other………..
1
2
3
4
5
6
E4 Do you have any problems
with your sewage system?
Fully functional
Always bursting
Sometimes bursting
1
2
3
E5 In case of sewage bursts, how
quick is the response by
council to rectify problem?
Excellent
Very good
Good
Poor
No response
1
2
3
4
5
E6 What is the current water
supply situation?
Available always
Mostly available
Rarely available
Never available
1
2
3
4
E7 Is there long grass surrounding
your house/area?
No
Yes
0
1

91
E8 Are they any stagnant water
pool around your area?
No
Yes
0
1
E9 How often is garbage collected
in your area?
Once a week
Once a month
Never
1
2
3
E10 Any garbage heaps around
your area?
No
Yes
0
1
E11 How long have they been
there?
Weeks………
Months……..
Years………
1
2
3
E12 What problems emanate from
those heaps
Bad smell
Flies
Rodents
Water contamination
Poisoning
Yes No
1 0
1 0
1 0
1 0
1 0
1 0
E13 Do your children sometimes
play near the garbage heaps?
Yes
No
1
0
SECTION TWO- MATERNAL QUESTIONS
BIRTH HISTORY-(to include all births even children who have died)
BH1
Number
of child
BH2
Was it
single or
multiple
BH3
Sex
BH4
Date of
birth
BH5
Age in full
years
BH6
Is
child
still
alive
BH7
If alive
do you
live
with
child?
BH8
If dead at what
age?
BH9
Would
you like
to tell the
cause of
death
sin mul B G dd/mm/yr y n y n
01
1
2
1
2
…/…/…..
…….years
1
2
1
2
Days………..
Months……….
Years…………
02
1
2
1
2
…/…/…..
…….years
1
2
1
2
Days
Months
Years…….
03
1
2
1
2
…/…/…..
…….years
1
2
1
2
Days
Months
Years…….
04
1
2
1
2
…/…/…..
…….years
1
2
1
2
Days
Months
Years…….
05
1
2
1
2
…/…/…..
…….years
1
2
1
2
Days
Months
Years…….
06
1
2
1
2
…/…/…..
…….years
1
2
1
2
Days
Months
Years…….

92
MATERNAL AND NEWBORN HEALTH - (Information in this section relates to the
last birth)
MN1 When you were pregnant, did you
attend antenatal clinic?
No
Yes
0
1
MN2 If yes, who did you did you see? Doctor
Nurse
Community Midwife
Traditional attendant
Relative/friend
Other…………….
1
2
3
4
5
6
MN3 How many months pregnant were you
when you first attended antenatal
care?
No of months………..
Not sure………………
MN4 How many times did you attend
during the pregnancy?
No of times………..
Not sure……………
MN5 During antenatal, did you receive
information and counselling about
HIV?
No
Yes
0
1
MN6 I don’t want to know the result, but
were you tested for HIV as part of
antenatal care?
No
Yes
0
1
MN7 Do you have a mosquito net in your
home?
No
Yes
0
1
MN8 Did you sleep under a mosquito net
during pregnancy?
No
Yes
0
1
MN9 During pregnancy, did you take any
medicine to prevent malaria?
No
Yes
0
1
MN1
0
Who assisted you with the delivery of
your baby?
Doctor
Nurse/Midwife
Community Midwife
Traditional attendant
Community Health worker
Relative/Friend
Other………….
No-one
1
2
3
4
5
6
7
8
MN1
1
Where did you deliver your child? At home
Govt Hospital
Clinic
1
2
3

93
Private Hospital
Mission facility
Traditional facility
Other……………………..
4
5
6
7
MN1
2
Type of delivery Normal
Vacuum extraction
Caesarean section
Induced
Other………………….
1
2
3
4
5
MN1
3
At the time of delivery, did you have:
a) Long labour i.e. contractions
lasting more than 12 hours
b) Excessive bleeding
c) High fever with bad smelling
vaginal discharge
d) Convulsions not caused by
fever
e) Any other complication
Specify………………………….
Long labour i.e.
contractions lasting more
than 12 hours
Excessive bleeding
High fever with bad
smelling vaginal discharge
Convulsions not caused by
fever
Any other complication
No
Yes
0 1
0 1
0 1
0 1
0 1
MN1
4
Did your child suffer any problems as
a result of the complication?
Yes
No
1
0
MN1
5
Is yes, please specify ……………………………
……………………………
……
SECTION THREE- UNDER-FIVE CHILDREN
Questions about Nutrition and child growth
Last birth
Child…………..0
1
Next to last birth
Child………..02
Second from last
birth…………03
NC1 Child’s age Days…………
Months……….
Years…………
Days…………
Months……….
Years…………
Days…………
Months……….
Years…………
NC2 Child’s birth
weight
No of
k.gs……………
Don’t
know……………
…
No of
k.gs……………
Don’t
know……………
…
No of
k.gs……………
Don’t
know……………
…
NC3 Did you ever No Yes No Yes No Yes

94
breastfeed the
child?
0 1
0 1
0 1
NC4 How did you
breastfeed your
child in the first
six months?
Exclusive breast
milk …….1
Milk and water
only……………
…2
Supplemented
with
formula…………3
Supplemented
with solid
food………4
Other……………
5
Exclusive breast
milk …….1
Milk and water
only……………
…2
Supplemented
with
formula…………3
Supplemented
with solid
food………4
Other…………5
Exclusive breast
milk …….1
Milk and water
only………………
2
Supplemented with
formula…………3
Supplemented with
solid
food…………4
Other……………5
NC5 At what age did
you introduce
solid food to the
child?
Days……………..
Weeks…………..
Months…………
…
Years…………….
.
Days……………..
Weeks………….
Months…………
…
Years…………….
.
Days…………….
Weeks…………..
Months…………
…
Years……………..
NC6 How many
meals do you
give the child per
day?
No of
meals………
Not sure………..
No of
meals………
Not sure………..
No of meals………
Not sure………..
NC7 Do you give
child other food
in between main
meals?
Yes No
1 0
Yes No
1 0
Yes No
1 0
NC8 If yes, how many
per day?
No of
snacks………
Not sure………..
No of
snacks………
Not sure………..
No of
snacks………
Not sure………..
NC9 In the last 24hrs,
was child given :
Plain water
Juice
Baby formula
Fresh Milk
Beans
Porridge
Mahewu
Fruits and
vegetables
Eggs, fish,
poultry
No Yes
0 1
0 1
0 1
0 1
0 1
0 1
0 1
0 1
0 1
No Yes
0 1
0 1
0 1
0 1
0 1
0 1
0 1
0 1
0 1
No Yes
0 1
0 1
0 1
0 1
0 1
0 1
0 1
0 1
0 1

95
Meat
Sadza/Rice/Pasta
Other
solids…………
0 1
0 1
0 1
0 1
0 1
0 1
0 1
0 1
0 1
0 1
0 1
0 1
NC9 Is child’s weight
on immunisation
card:
Within limits in
a straight line
Within limits but
fluctuating
Below lower
limit(underweigh
t
Above upper
limit(overweight
)
(see
immunisation
Card)
If underweight
or fluctuating,
give reasons
No Yes
0 1
0 1
0 1
0 1
Reasons…………
…………………
…………………
…….
No Yes
0 1
0 1
0 1
0 1
Reasons…………
…………………
…………………
…….
No Yes
0 1
0 1
0 1
0 1
Reasons…………
…………………
…………………
…….
NC10 Has your child
suffered any of
the following in
the last two
weeks?
Extreme weight
loss
Swollen
abdomen
Swollen feet
Loss of appetite
Loss of hair
Dry scaly skin
Hair or skin
colour change
Yes No
1 0
1 0
1 0
1 0
1 0
1 0
1 0
Yes No
1 0
1 0
1 0
1 0
1 0
1 0
1 0
Yes No
1 0
1 0
1 0
1 0
1 0
1 0
1 0
NC11 Was child
treated for
malnutrition?
Yes No
1 0
Yes No
1 0
Yes No
1 0
NC12 If yes specify
treatment
Treatment………
…………………
…………………
………
Treatment………
…………………
…………………
……….
Treatment………
…………………
…………………
………..
NC13 Where was child Visited Visited Visited hospital…1

96
treated? hospital…1
Visited
clinic……2
Visited
private…..3 doctor
Visited traditional
healer …………..4
Prayed for………5
Other…………..
..6
No
Action……….7
hospital…1
Visited
clinic……2
Visited
private…..3 doctor
Visited traditional
healer …………..4
Prayed for………5
Other…………..
..6
No
Action……….7
Visited clinic……2
Visited
private…..3 doctor
Visited traditional
healer …………..4
Prayed for………5
Other…………..
..6
No
Action……….7
NC13 How quick was
attention given
to child?
Immediately…….
1
Delayed…………
2
Never…………….
3
Other……………
4
Immediately…….
1
Delayed…………
2
Never…………….
3
Other……………
4
Immediately…….1
Delayed…………2
Never…………….
3
Other……………4
NC14 How did child
respond to
medication
given?
Responded very
well……1
Responded
slightly……2
Did not respond at
all………3
Responded very
well……1
Responded
slightly……2
Did not respond at
all………3
Responded very
well……1
Responded
slightly……2
Did not respond at
all………3
Questions about Diarrhoea
Last birth
Child…………..0
1
Next to last birth
Child………..02
Second from last
birth…………03
DD1 Has your child
had diarrhoea in
the last two
weeks?
No………….0
Yes…………1
No…………….0
Yes……………1
No……………1
Yes……………2
DD2 How long did
diarrhoea last?
No of
days……………
…
No of
days……………
…
No of
days……………
…
DD3 Was there blood
in the stool?
Yes…………1
No…………..0
Yes…………1
No…………0
Yes…………1
No…………..0
DD4 Did child vomit
during illness?
Yes
No
Yes
No
Yes
No
DD5 During illness
did child eat
much less, about
the same or
mare than usual?
None……….1
Much less…..2
Somewhat less….3
About the
same…..4
None……….1
Much less…..2
Somewhat less….3
About the
same…..4
None……….1
Much less…..2
Somewhat less….3
About the
same…..4
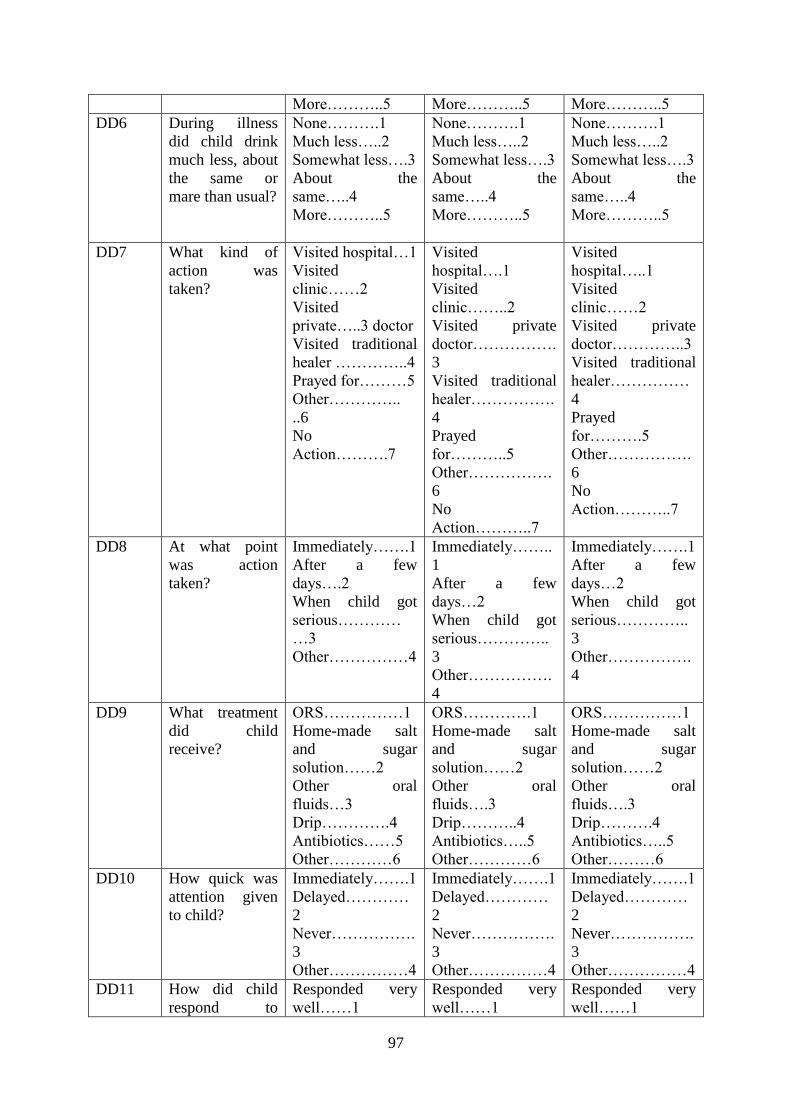
97
More………..5 More………..5 More………..5
DD6 During illness
did child drink
much less, about
the same or
mare than usual?
None……….1
Much less…..2
Somewhat less….3
About the
same…..4
More………..5
None……….1
Much less…..2
Somewhat less….3
About the
same…..4
More………..5
None……….1
Much less…..2
Somewhat less….3
About the
same…..4
More………..5
DD7 What kind of
action was
taken?
Visited hospital…1
Visited
clinic……2
Visited
private…..3 doctor
Visited traditional
healer …………..4
Prayed for………5
Other…………..
..6
No
Action……….7
Visited
hospital….1
Visited
clinic……..2
Visited private
doctor…………….
3
Visited traditional
healer…………….
4
Prayed
for………..5
Other…………….
6
No
Action………..7
Visited
hospital…..1
Visited
clinic……2
Visited private
doctor…………..3
Visited traditional
healer……………
4
Prayed
for……….5
Other…………….
6
No
Action………..7
DD8 At what point
was action
taken?
Immediately…….1
After a few
days….2
When child got
serious…………
…3
Other……………4
Immediately……..
1
After a few
days…2
When child got
serious…………..
3
Other…………….
4
Immediately…….1
After a few
days…2
When child got
serious…………..
3
Other…………….
4
DD9 What treatment
did child
receive?
ORS……………1
Home-made salt
and sugar
solution……2
Other oral
fluids…3
Drip………….4
Antibiotics……5
Other…………6
ORS………….1
Home-made salt
and sugar
solution……2
Other oral
fluids….3
Drip………..4
Antibiotics…..5
Other…………6
ORS……………1
Home-made salt
and sugar
solution……2
Other oral
fluids….3
Drip……….4
Antibiotics…..5
Other………6
DD10 How quick was
attention given
to child?
Immediately…….1
Delayed…………
2
Never…………….
3
Other……………4
Immediately…….1
Delayed…………
2
Never…………….
3
Other……………4
Immediately…….1
Delayed…………
2
Never…………….
3
Other……………4
DD11 How did child
respond to
Responded very
well……1
Responded very
well……1
Responded very
well……1

98
medication
given?
Responded
slightly……2
Did not respond at
all………3
Responded
slightly……2
Did not respond at
all………3
Responded
slightly……2
Did not respond at
all………3
DD12 What do you
suspect might
have caused the
diarrhoea?
Dirty water……..1
Food
poisoning…..2
Teething………3
Flies from
garbage………..4
Raw
sewage………4
Overcrowding……
.5
Eating cold
food…6
Dirty water……..1
Food
poisoning…..2
Teething………3
Flies from
garbage………..4
Raw
sewage………4
Overcrowding……
.5
Eating cold
food…6
Dirty water……..1
Food
poisoning…..2
Teething………3
Flies from
garbage………..4
Raw
sewage………4
Overcrowding……
.5
Eating cold
food…6
Acute Respiratory Infections
Last birth
Child…………..0
1
Next to last birth
Child………..02
Second from last
birth…………03
AR1 Has child had
any illness with
a cough in the
past two weeks?
Yes……1
No……..0
Yes……1
No……..0
Yes……1
No……..0
AR2 During illness,
did child
a) breathe faster
than usual
b) did he/she
have short,
quick breaths
c) Difficulty in
breathing?
Yes No
1 0
1 0
1 0
Yes No
1 0
1 0
1 0
Yes No
1 0
1 0
1 0
AR3 Were the
symptoms due to
a problem in the
chest or blocked
nose?
Problem in
chest….1
Blocked
nose…….2
Both……………3
Other…………4
Problem in
chest….1
Blocked
nose…….2
Both……………3
Other…………4
Problem in
chest….1
Blocked
nose…….2
Both……………3
Other…………4
AR4 Did you seek
advice or
treatment
outside the
home?
Yes…….1
No………0
Yes…….1
No………0
Yes…….1
No………0
AR5 Where was
treatment
sought?
Visited hospital…1
Visited
clinic……2
Visited
Visited hospital…1
Visited
clinic……2
Visited
Visited hospital…1
Visited
clinic……2
Visited

99
private…..3 doctor
Visited traditional
healer …………..4
Prayed for………5
Other…………..
..6
No
Action……….7
private…..3 doctor
Visited traditional
healer …………..4
Prayed for………5
Other…………..
..6
No
Action……….7
private…..3 doctor
Visited traditional
healer …………..4
Prayed for………5
Other…………..
..6
No
Action……….7
AR6 At what point
was action
taken?
Immediately…….1
After a few
days….2
When child got
serious…………
…3
Other……………4
Immediately……..
1
After a few
days…2
When child got
serious…………..
3
Other…………….
4
Immediately…….1
After a few
days…2
When child got
serious…………..
3
Other…………….
4
AR7 How quick was
attention given
to child?
Immediately…….1
Delayed…………
2
Never…………….
3
Other……………4
Immediately…….1
Delayed…………
2
Never…………….
3
Other……………4
Immediately…….1
Delayed…………
2
Never…………….
3
Other……………4
AR8 How did child
respond to
medication
given?
Responded very
well……1
Responded
slightly……2
Did not respond at
all………3
Responded very
well……1
Responded
slightly……2
Did not respond at
all………3
Responded very
well……1
Responded
slightly……2
Did not respond at
all………3
Questions about Malaria
ML1 Do you do
anything to
prevent malaria
in the
household?
Yes No
1 0
Yes No
1 0
Yes No
1 0
ML2 If yes please
specify
Cutting grass……1
Draining open
water
bodies……….2
Use of
repellent…3
Use of mosquito
coils………….4
Taking preventive
medicine……….5
Use mosquito
nets..6
Other……………..
Cutting grass……1
Draining open
water
bodies……….2
Use of
repellent…3
Use of mosquito
coils………….4
Taking preventive
medicine……….5
Use mosquito
nets..6
Other……………..
Cutting grass……1
Draining open
water
bodies……….2
Use of
repellent…3
Use of mosquito
coils………….4
Taking preventive
medicine……….5
Use mosquito
nets..6
Other……………..

100
7 7 7
ML3 Does your child
sleep under an
insecticide
treated mosquito
net?
Yes No
1 0
Yes No
1 0
Yes No
1 0
ML4 How long ago
was the net last
soaked in
insecticide?
Months……….
Years…………
Never……………
…
Months………
Years…………
Never……………
…
Months……….
Years…………
Never……………
ML5 In the past two
weeks, did your
child suffer:
Difficulty
sleeping
Fever alternating
with chills
Sweating
Extremely fast
breathing
Nausea
Headaches
Restlessness
Yes No
1 0
1 0
1 0
1 0
1 0
1 0
1 0
Yes No
1 0
1 0
1 0
1 0
1 0
1 0
1 0
Yes No
1 0
1 0
1 0
1 0
1 0
1 0
1 0
ML6 Was child given
medicine for
fever or malaria
during illness?
Yes No
1 0
Yes No
1 0
Yes No
1 0
ML7 Was child
attended outside
the home?
Yes No
1 0
Yes No
1 0
Yes No
1 0
ML8 Where was
he/she attended?
Visited hospital…1
Visited
clinic……2
Visited
private…..3 doctor
Visited traditional
healer …………..4
Prayed for………5
Other…………..
..6
No
Action……….7
Visited hospital…1
Visited
clinic……2
Visited
private…..3 doctor
Visited traditional
healer …………..4
Prayed for………5
Other…………..
..6
No
Action……….7
Visited hospital…1
Visited
clinic……2
Visited
private…..3 doctor
Visited traditional
healer …………..4
Prayed for………5
Other…………..
..6
No
Action……….7
ML9 At what point
was action
taken?
Immediately…….1
After a few
days….2
Immediately……..
1
After a few
days…2
Immediately…….1
After a few
days…2

101
When child got
serious…………
…3
Other……………4
When child got
serious…………..
3
Other…………….
4
When child got
serious…………..
3
Other…………….
4
ML10 How quick was
attention given
to child?
Immediately…….1
Delayed…………
2
Never…………….
3
Other……………4
Immediately…….1
Delayed…………
2
Never…………….
3
Other……………4
Immediately…….1
Delayed…………
2
Never…………….
3
Other……………4
ML11 How did child
respond to
medication
given?
Responded very
well……1
Responded
slightly……2
Did not respond at
all………3
Responded very
well……1
Responded
slightly……2
Did not respond at
all………3
Responded very
well……1
Responded
slightly……2
Did not respond at
all………3
Questions about Injury
Last birth
Child…………..0
1
Next to last birth
Child………..02
Second from last
birth…………03
IN1 Who is the main
caregiver for
your child?
Self………….1
Father…………2
Maid………….3
Relative/friend….
4
Other………..5
Self………….1
Father…………2
Maid………….3
Relative/friend….
4
Other………..5
Self………….1
Father…………2
Maid………….3
Relative/friend….4
Other………..5
IN2 Where does
child spend most
of his time
during the day?
Home……….1
Pre-school…..2
Friend/relative’s
house ……3
Other………4
Home……….1
Pre-school…..2
Friend/relative’s
house ……3
Other………4
Home……….1
Pre-school…..2
Friend/relative’s
house ……3
Other………4
IN3 Has your child
suffered any
form of injury in
the two weeks?
Yes No
1 0
Yes No
1 0
Yes No
1 0
IN4 Specify type of
injury
Burn……..1
Broken arm……2
Broken leg…….3
Open wound……4
Broken
tooth……5
Head Injury…….6
Poisoning………7
Other……………
Burn……..1
Broken arm……2
Broken leg…….3
Open wound……4
Broken
tooth……5
Head
Injury……..6
Poisoning………
Burn……..1
Broken arm……2
Broken leg…….3
Open wound……4
Broken tooth……5
Head injury……...6
Poisoning……….7
Other……………8
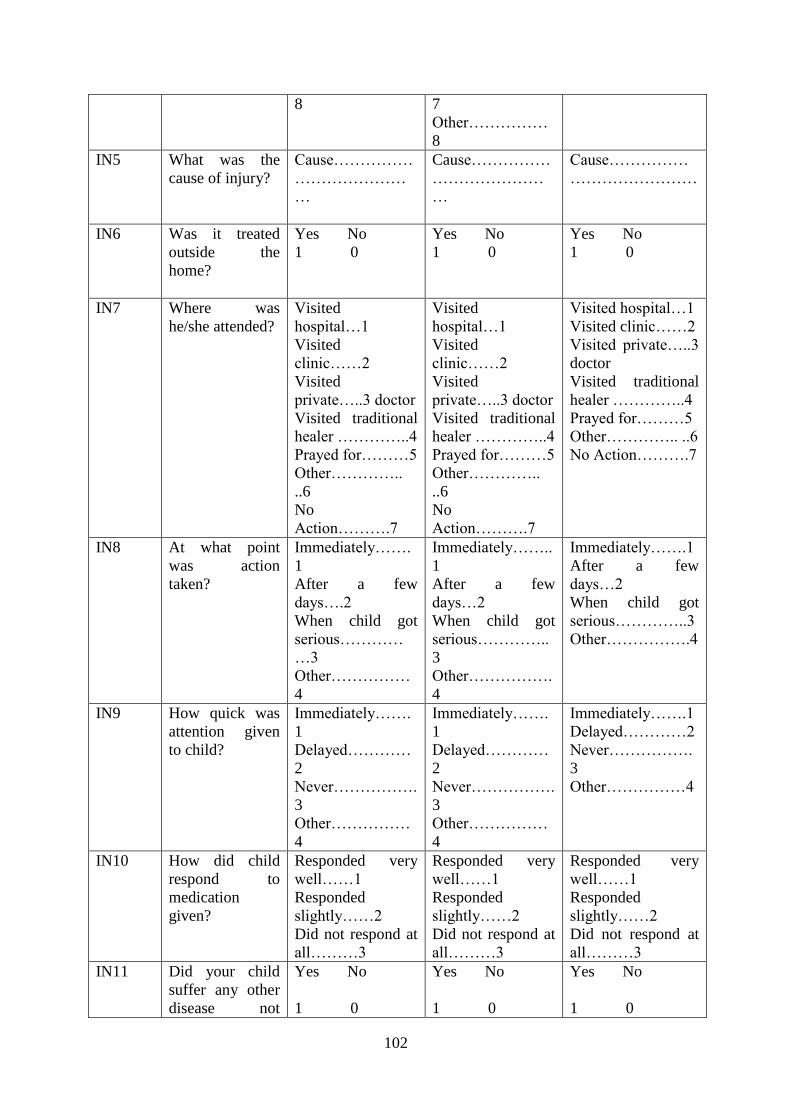
102
8 7
Other……………
8
IN5 What was the
cause of injury?
Cause……………
…………………
…
Cause……………
…………………
…
Cause……………
……………………
IN6 Was it treated
outside the
home?
Yes No
1 0
Yes No
1 0
Yes No
1 0
IN7 Where was
he/she attended?
Visited
hospital…1
Visited
clinic……2
Visited
private…..3 doctor
Visited traditional
healer …………..4
Prayed for………5
Other…………..
..6
No
Action……….7
Visited
hospital…1
Visited
clinic……2
Visited
private…..3 doctor
Visited traditional
healer …………..4
Prayed for………5
Other…………..
..6
No
Action……….7
Visited hospital…1
Visited clinic……2
Visited private…..3
doctor
Visited traditional
healer …………..4
Prayed for………5
Other………….. ..6
No Action……….7
IN8 At what point
was action
taken?
Immediately…….
1
After a few
days….2
When child got
serious…………
…3
Other……………
4
Immediately……..
1
After a few
days…2
When child got
serious…………..
3
Other…………….
4
Immediately…….1
After a few
days…2
When child got
serious…………..3
Other…………….4
IN9 How quick was
attention given
to child?
Immediately…….
1
Delayed…………
2
Never…………….
3
Other……………
4
Immediately…….
1
Delayed…………
2
Never…………….
3
Other……………
4
Immediately…….1
Delayed…………2
Never…………….
3
Other……………4
IN10 How did child
respond to
medication
given?
Responded very
well……1
Responded
slightly……2
Did not respond at
all………3
Responded very
well……1
Responded
slightly……2
Did not respond at
all………3
Responded very
well……1
Responded
slightly……2
Did not respond at
all………3
IN11 Did your child
suffer any other
disease not
Yes No
1 0
Yes No
1 0
Yes No
1 0
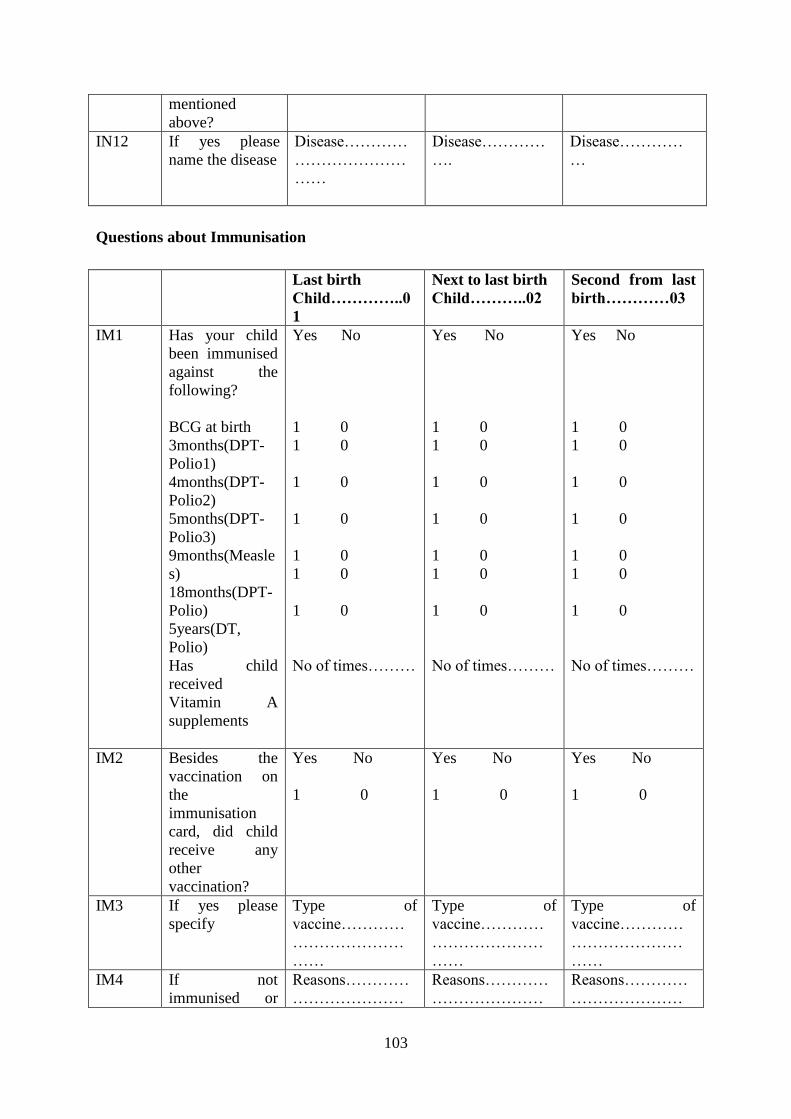
103
mentioned
above?
IN12 If yes please
name the disease
Disease…………
…………………
……
Disease…………
….
Disease…………
…
Questions about Immunisation
Last birth
Child…………..0
1
Next to last birth
Child………..02
Second from last
birth…………03
IM1 Has your child
been immunised
against the
following?
BCG at birth
3months(DPT-
Polio1)
4months(DPT-
Polio2)
5months(DPT-
Polio3)
9months(Measle
s)
18months(DPT-
Polio)
5years(DT,
Polio)
Has child
received
Vitamin A
supplements
Yes No
1 0
1 0
1 0
1 0
1 0
1 0
1 0
No of times………
Yes No
1 0
1 0
1 0
1 0
1 0
1 0
1 0
No of times………
Yes No
1 0
1 0
1 0
1 0
1 0
1 0
1 0
No of times………
IM2 Besides the
vaccination on
the
immunisation
card, did child
receive any
other
vaccination?
Yes No
1 0
Yes No
1 0
Yes No
1 0
IM3 If yes please
specify
Type of
vaccine…………
…………………
……
Type of
vaccine…………
…………………
……
Type of
vaccine…………
…………………
……
IM4 If not
immunised or
Reasons…………
…………………
Reasons…………
…………………
Reasons…………
…………………

104
immunisation
was skipped
give reasons?
…………………
…………………
…….
…………………
…………………
…….
…………………
…………………
…….
IM5 How would you
rate the health
system in this
area
Excellent…….1
Very good……2
Good…………3
Poor………….4
Very poor…….5
Excellent…….1
Very good……2
Good…………3
Poor………….4
Very poor…….5
Excellent…….1
Very good……2
Good…………3
Poor………….4
Very poor…….5
In your opinion, what are the main causes of morbidity and mortality in children under five
in Katanga
township………………………………………………………………………………………
…………………………………………………………………………………………………
…………………………………………………………………………………………………
…………………………………………………………………………………………………
…………………………………………………………………………………………………
……………………………………………………
Thank you very much for participating in this Research

105
APPENDIX 2
KEY INFORMANT INTERVIEW GUIDE – MEDICAL PERSONNEL
My name is Fungayi Muzinda; I am a student at the University of Zimbabwe. I am carrying
out a study entitled “Determinants of Child morbidity in Katanga Township.” I am kindly
asking for your assistance in my research by answering the questions that I am going to ask
you. You are encouraged to answer all questions. Your opinions and all the information
given will be treated with confidentiality. Thank you in advance for your cooperation.
Questions
1. What are the main causes of under-five morbidity in Katanga?
(Probe: Maternal, Socio-economic, Environmental, Nutrient Deficiency and Injury)
2. What are the most common types of diseases that you treat in children under the age
of five? ( Probe about malaria ,malnutrition)
3. What are the most common types of injury that you attend to in under- five children
from Katanga?
4. Are there gender differentials in under-five morbidity?
5. How good is antenatal care attendance by expecting mothers?
6. Are mothers willing to test for HIV during pregnancy?
7. What are the most common complications that mothers are having during pregnancy
and delivery?
8. What is the contribution of HIV to child morbidity?
9. What sort of education are mothers getting about child care in the local health
facilities?
10. At what stage are children generally brought to hospital for treatment when sick?
11. Are mothers adhering to immunisation schedules properly?
12. Are there supplementary feeding programmes being run in the area?
13. What are the common nutritional deficiency diseases that children in this area suffer?

106
14. Are there any other observations that you may have made regarding under- five
morbidity that may be useful to this study?
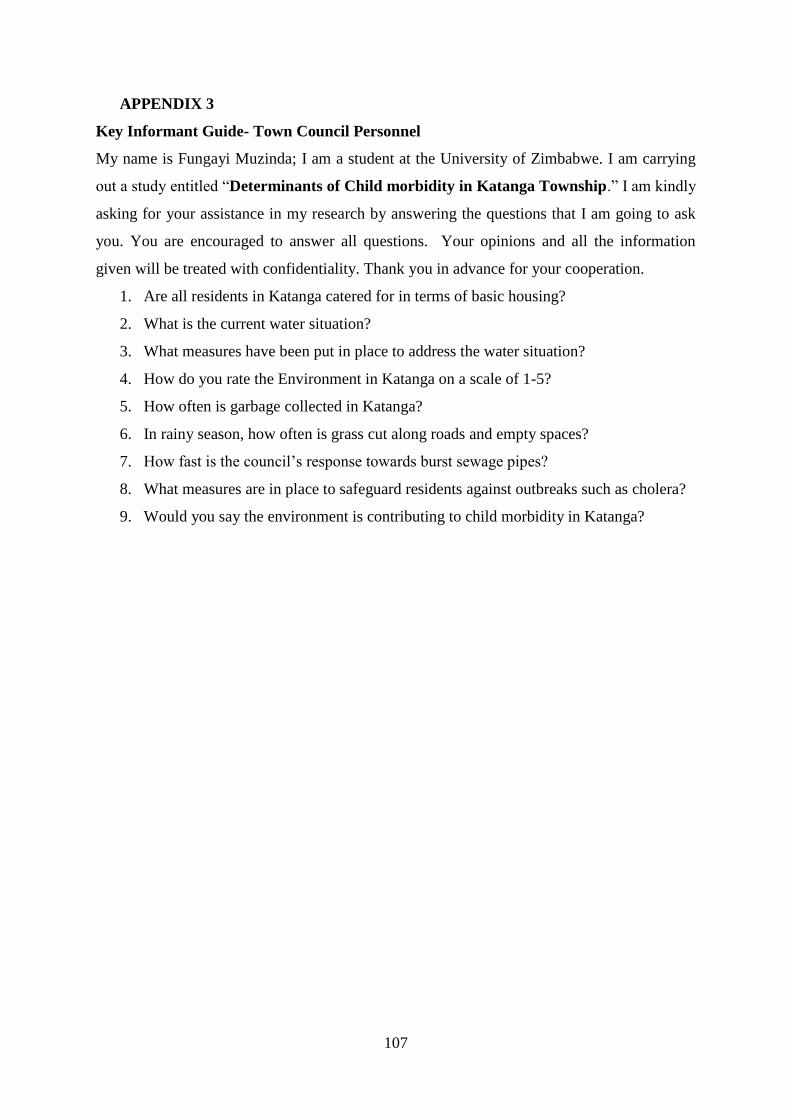
107
APPENDIX 3
Key Informant Guide- Town Council Personnel
My name is Fungayi Muzinda; I am a student at the University of Zimbabwe. I am carrying
out a study entitled “Determinants of Child morbidity in Katanga Township.” I am kindly
asking for your assistance in my research by answering the questions that I am going to ask
you. You are encouraged to answer all questions. Your opinions and all the information
given will be treated with confidentiality. Thank you in advance for your cooperation.
1. Are all residents in Katanga catered for in terms of basic housing?
2. What is the current water situation?
3. What measures have been put in place to address the water situation?
4. How do you rate the Environment in Katanga on a scale of 1-5?
5. How often is garbage collected in Katanga?
6. In rainy season, how often is grass cut along roads and empty spaces?
7. How fast is the council’s response towards burst sewage pipes?
8. What measures are in place to safeguard residents against outbreaks such as cholera?
9. Would you say the environment is contributing to child morbidity in Katanga?

108
APPENDIX 4
Environmental Assessment Guide
The purpose of this guide was to check for the following:
1. Blocked drainages and resultant stagnant water pools.
2. Long grass around residential areas.
3. Sewage streams and pools
4. Garbage dumps
5. Open pits.

109
APPENDIX 5

110
APPENDIX 6

111