determinants of chicago neighborhood homicide trends: …trends within neighborhoods. a second,...
TRANSCRIPT

The author(s) shown below used Federal funds provided by the U.S. Department of Justice and prepared the following final report: Document Title: Determinants of Chicago Neighborhood
Homicide Trends: 1980-2000 Author: Brian J. Stults Document No.: 239202
Date Received: August 2012 Award Number: 2008-IJ-CX-0019 This report has not been published by the U.S. Department of Justice. To provide better customer service, NCJRS has made this Federally-funded grant final report available electronically in addition to traditional paper copies.
Opinions or points of view expressed are those of the author(s) and do not necessarily reflect
the official position or policies of the U.S. Department of Justice.
FINAL TECHNICAL REPORT
DETERMINANTS OF CHICAGO NEIGHBORHOOD HOMICIDE TRENDS: 1980-2000
(2008-IJ-CX-0019)
Brian J. Stults Florida State University
Submitted to: National Institute of Justice
Data Resources Program 2008 Funding for the Analysis of Existing Data
This document is a research report submitted to the U.S. Department of Justice. This report has not been published by the Department. Opinions or points of view expressed are those of the author(s)
and do not necessarily reflect the official position or policies of the U.S. Department of Justice.
i
ABSTRACT
One of the most important social changes in the United States during the 1980s and
1990s was the dramatic increase and subsequent decrease in crime, and particularly violent
crime, in large cities. For example, the homicide rate in Chicago nearly tripled between 1965
and 1992, after which point it declined by more than 50% through 2005. Surely this is a
remarkable pattern of change, but is this trend representative of all areas in the city? The general
purpose of the proposed project is to examine homicide trends in Chicago neighborhoods from
1980-2000 using three data sources available from ICPSR and the National Archive of Criminal
Justice Data (NACJD). Drawing on the social disorganization and concentrated disadvantage
literature, this study will use growth-curve modeling and semi-parametric group-based trajectory
modeling to: 1) assess neighborhood variation in homicide trends; 2) identify the particular types
of homicide trajectory that Chicago neighborhoods follow; 3) assess whether structural
characteristics of neighborhoods influence homicide trends and trajectories; and 4) determine the
extent to which the influence of structural characteristics is mediated by neighborhood levels of
collective efficacy. This project extends prior research by not only describing the homicide
trends and trajectories of Chicago neighborhoods, but also identifying the neighborhood
characteristics that directly and indirectly influence those trends. Results show that considerable
variation exists in homicide trends across Chicago neighborhoods. In the group-based trajectory
analysis, homicide trajectories are consistently associated with initial levels of concentrated
disadvantage as well as change over time. Change in family disruption is also predictive of
trajectory group assignment, but only among neighborhoods with very high initial levels of
This document is a research report submitted to the U.S. Department of Justice. This report has not been published by the Department. Opinions or points of view expressed are those of the author(s)
and do not necessarily reflect the official position or policies of the U.S. Department of Justice.
ii
homicide. In the growth curve analysis, concentrated disadvantage is associated with initial
levels of homicide, but not change over time. In contrast, social disorganization and immigrant
concentration emerge as significant predictors of variability in homicide trends. Additional
models incorporating data from the Project on Human Development in Chicago Neighborhoods
(PHDCN) show that neighborhood ties and perceived social disorder mediate a substantial
portion of the effects of concentrated disadvantage and social disorganization on homicide rates.
This document is a research report submitted to the U.S. Department of Justice. This report has not been published by the Department. Opinions or points of view expressed are those of the author(s)
and do not necessarily reflect the official position or policies of the U.S. Department of Justice.
iii
TABLE OF CONTENTS
ABSTRACT …………………………………………………………………………... i TABLE OF CONTENTS ……………………………………………………………... iii EXECUTIVE SUMMARY …………………………………………………………… 1 INTRODUCTION…………………………………………………………………….. 14
Statement of the Problem ……………………………………………………… 14 Literature Review……………………………………………………………… 17
Social Disorganization and Between-Community Variation in Crime ... 17 Social Disorganization and Within-Community Variation in Crime ….. 20 Community Careers in Crime …………………………………………. 21
RESEARCH DESIGN AND METHODS …………………………………………….. 23 Data Sources And Variables …………………………………………………... 23 Analytic Plan ………………………………………………………………….. 27
RESULTS …………………………………………………………………………....... 30 Neighborhood Variation in Homicide Trends ……………………………….... 30 Group-Based Trajectory Analysis …………………………………………….. 31
Structural Characteristics of Homicide Trajectory Groups …………... 33 Predictors of Trajectory Group Assignment …………………………... 35
Hierarchical Growth-Curve Analysis …………………………………………. 37 Unconditional Model ………………………………………………….. 39 Conditional Model …………………………………………………….. 39 Modeling Intervening Mechanisms ……………………………………. 42
CONCLUSIONS ……………………………………………………………………… 44 Discussion of Findings ………………………………………………………... 44 Implications for Policy and Practice …………………………………………... 47 Directions for Future Research ………………………………………………... 50
REFERENCES ………………………………………………………………………... 54 DISSEMINATION OF RESEARCH FINDINGS ……………………………………. 63 FIGURES ……………………………………………………………………………… 64 TABLES ………………………………………………………………………………. 70
This document is a research report submitted to the U.S. Department of Justice. This report has not been published by the Department. Opinions or points of view expressed are those of the author(s)
and do not necessarily reflect the official position or policies of the U.S. Department of Justice.
1
EXECUTIVE SUMMARY
INTRODUCTION
One of the most important social changes in the United States during the 1980s and
1990s was the dramatic increase and subsequent decrease in crime, and particularly violent
crime. Indeed, the homicide rate in Chicago nearly tripled between 1965 and 1992, after which
it declined by more than 50% through 2005. This is a remarkable pattern of change, but is this
overall trend characteristic of all areas within the city? If not, what other patterns in homicide
can be identified among Chicago neighborhoods, and what might explain the variation in
homicide trends across neighborhoods?
Much of the prior research on neighborhoods and crime has drawn on the social
disorganization perspective which argues that neighborhoods characterized by high levels of
poverty, residential turnover, and heterogeneity find it difficult to realize common values and
solve collective problems, which may in turn lead to higher rates of crime (Shaw and McKay,
1942) . Others have expanded the perspective by specifying the intervening mechanisms through
which structural characteristics of neighborhoods may influence crime rates, such as through
social ties, mutual trust, or a shared willingness to engage in informal control (Bellair, 1997;
Bursik, 1988; Sampson and Groves, 1989; Sampson, Raudenbush, and Earls, 1997). Though
these theoretical approaches are firmly grounded in an ecological approach that emphasizes
temporal concepts such as instability, population turnover, deterioration, and cyclical change,
surprisingly few studies have employed longitudinal designs to explicitly capture such processes
(Bursik, 1986; Fagan and Davies, 2004). Thus, while a great deal of prior criminological
research has examined variation across neighborhoods in levels of crime, much less work has
This document is a research report submitted to the U.S. Department of Justice. This report has not been published by the Department. Opinions or points of view expressed are those of the author(s)
and do not necessarily reflect the official position or policies of the U.S. Department of Justice.
2
been dedicated to describing crime trends within neighborhoods, and even less research has
attempted to the identify characteristics associated with variation across neighborhoods in crime
trends and trajectories.
Another possible reason for the predominance of cross-sectional research in the study of
communities and crime is the strong emphasis by Shaw and McKay (1942) on the stability of
crime-generating processes in neighborhoods (Bursik, 1984, 1986). This led to their influential
conclusion that neighborhood rates of juvenile delinquency remained relatively stable over time
despite sometimes rapid changes in racial and ethnic composition within neighborhoods.
However, a handful of studies in the 1980s and 1990s questioned this stability hypothesis,
instead arguing that change in neighborhoods can occur through multiple processes, and even the
same dynamic processes can lead to different outcomes across neighborhoods depending on their
initial ecological characteristics and their current stage in the developmental process (Bursik and
Grasmick, 1992; Schuerman and Kobrin, 1986; Taylor and Covington, 1988). This approach
suggests that communities progress through developmental pathways that can yield variation
across communities in not just crime rates at a single point in time, but also in their trajectories
of crime over a span of time.
This notion of community careers in crime parallels the concept of 'criminal careers' from
the individual-level developmental and life-course literature where researchers often attempt to
identify classes of individual offenders, such as abstainers, adolescent-limited delinquents, and
life-course persistent offenders (Laub and Sampson, 2003; Moffitt, 1993; Piquero, Farrington,
and Blumstein, 2003). If we were to think of crime patterns in terms of a neighborhood 'life-
course', what types of trajectories might be evident? Do neighborhoods essentially mirror the
This document is a research report submitted to the U.S. Department of Justice. This report has not been published by the Department. Opinions or points of view expressed are those of the author(s)
and do not necessarily reflect the official position or policies of the U.S. Department of Justice.

3
city-level crime trend, with differences only in scale, or does the pattern of change over time
vary across neighborhoods? Recent macro-level research has begun to directly address these
questions, with a general finding that neighborhoods do, indeed, seem to exhibit a variety of
crime trajectories that are sometimes considerably different from the trend of the broader city
(Chavez and Griffiths, 2009; Griffiths and Chavez, 2004; Weisburd, Bushway, Lum, and Yang,
2004).
The purpose of this project is to analyze homicide trends in Chicago neighborhoods from
1980-2000. The first objective is to determine whether trends in homicide varied across Chicago
neighborhoods from 1980-2000. A great deal of research has examined variation across
neighborhoods in levels of crime, but much less work has been dedicated to describing crime
trends within neighborhoods. A second, related objective will be to determine whether these
neighborhood homicide trends can be categorized into a discrete set of trajectory groups, similar
to the offending trajectory groups that have been identified by developmental criminologists.
The third objective expands upon the descriptive analysis by identifying determinants of
neighborhood homicide trends. Prior research has documented various crime trajectories across
neighborhoods, but the next logical question is what gives rise to these various trajectories and,
given similar levels of homicide at the beginning of the time period, what factors are associated
with a neighborhood being categorized into one trajectory grouping over another? Drawing on
the social disorganization and concentrated disadvantage literature, the focus of this objective
will be to assess the degree to which structural characteristics of neighborhoods influence
homicide trends, including factors such as poverty, unemployment, single-headed households,
immigration, divorce, racial composition, density, and population mobility.
This document is a research report submitted to the U.S. Department of Justice. This report has not been published by the Department. Opinions or points of view expressed are those of the author(s)
and do not necessarily reflect the official position or policies of the U.S. Department of Justice.
4
The fourth objective is to introduce community characteristics that are thought to mediate
the influence of the previously mentioned factors on neighborhood homicide trends. Scholars
have elaborated on the classic social disorganization model, arguing that concentrated
disadvantage, population instability, and heterogeneity can reduce a community's ability to
control its residents by reducing levels of social interaction and neighboring, mutual trust, the
recognition of common goals and values, and legal cynicism. This study tests the expectation
that more proximate neighborhood characteristics mediate the influence of the broader structural
variables on homicide trends.
RESEARCH DESIGN AND METHODS
Data for this project was compiled from a variety of sources. To generate the homicide
rate (per 100,000), homicide incident counts were obtained from the Chicago Homicide Data Set
available from the National Criminal Justice Archive at ICPSR (Block, Block, and ICJI, 1998).
This data set includes tract identifiers that allow for merging with other tract characteristics.
Data for neighborhood structural characteristics are drawn from the 1980, 1990, and 2000
Census of Population and Housing. The 1980 data come from Summary Tape File 4A (STF 4A),
the 1990 data come from Summary Tape File 3A (STF 3A), and the 2000 come from Summary
File 3 (SF 3). Variables for this portion of the analysis include population size, median
household income, poverty rate, unemployment rate, divorce rate, percentage of female-headed
households, residential mobility, homeownership rate, racial and Hispanic composition,
immigrant composition, percentage of households speaking English, and population density. In
order to avoid the problems associated with high levels of multicollinearity among the
This document is a research report submitted to the U.S. Department of Justice. This report has not been published by the Department. Opinions or points of view expressed are those of the author(s)
and do not necessarily reflect the official position or policies of the U.S. Department of Justice.
5
regressors, several standardized mean indexes were created to represent key concepts identified
in previous empirical and theoretical work (Land, McCall, and Cohen, 1990). All predictors are
incorporated as both static levels at the beginning of the time period, and as change scores for the
period 1980 to 2000 (Rosenfeld et al. 2007; Kubrin and Herting 2003).
The concentrated disadvantage index is comprised of median household income, the
percentage of persons with a high school diploma, the percentage of persons with a bachelor's
degree, percentage of persons who are African American, and the percentage of persons
unemployed. It is expected that areas with high levels of disadvantage in 1980 will have
trajectories with higher starting points, and that increases in concentrated disadvantage will be
associated with increasing homicide trajectories. Family disruption is an index comprised of the
percentage of persons age 15 and over who are divorced and the percentage of children who live
with a single parent. As with concentrated disadvantage, high levels and increases in family
disruption are expected to yield high and increasing trajectories of homicide. Social
disorganization is measured with an index comprised of the percentage of persons who lived in a
different house five years earlier, the percentage of homes that are renter-occupied, the
percentage of housing units that are vacant, and population density. It is expected that areas with
high levels of social disorganization in 1980 will have high starting points to their homicide
trajectories, and that neighborhoods with increasing disorganization will be more likely to have
increasing homicide trajectories. Immigrant concentration is measured using an index
comprised of the percentage foreign-born and the percentage Hispanic. Though popular opinion
among the American public is often that immigration and crime are strongly, positively related,
much of the empirical research shows that immigrants are less likely to engage in crime than
This document is a research report submitted to the U.S. Department of Justice. This report has not been published by the Department. Opinions or points of view expressed are those of the author(s)
and do not necessarily reflect the official position or policies of the U.S. Department of Justice.
6
native-born Americans after controlling for other characteristics (Hagan and Palloni, 1999;
Mears, 2010). It is expected that neighborhoods with higher concentrations of immigrants may
have higher initial homicide rates at the start of the time period, but controlling for levels of
disorganization and disadvantage, areas with increasing concentrations of immigrants will be
associated with a declining homicide trajectory.
As an initial attempt at determining whether the effect of these structural characteristics
on neighborhood crime trends are mediated by emergent properties of neighborhoods such as
social cohesion, collective efficacy, and disorder, this study also incorporates data from the
1994-1995 Community Survey of the Project on Human Development in Chicago
Neighborhoods, which is also accessible from the National Archive of Criminal Justice Data.
The community survey was conducted in 1994-1995, so the timing is not ideal for incorporation
into a study of homicide trends from 1980-2000. Therefore, this portion of the analysis is
restricted to just the years 1990-2000, and it is viewed as an initial effort to identify theoretically
relevant mediating effects, and will hopefully stimulate future research. Because many of the
community-level measures included in the PHDCN are highly collinear, two variables were
selected as possible intervening mechanisms - neighborhood ties and perceived social and
physical disorder.
ANALYTIC PLAN
Because temporal and spatial analysis of neighborhood crime is a complex and relatively
new endeavor, a comprehensive approach is taken. This involves a variety of analytical methods
including hierarchical growth-curve modeling, semi-parametric group-based trajectory modeling,
This document is a research report submitted to the U.S. Department of Justice. This report has not been published by the Department. Opinions or points of view expressed are those of the author(s)
and do not necessarily reflect the official position or policies of the U.S. Department of Justice.

7
and the analysis of spatial dependence. The first objective of this study is to determine whether
the overall homicide trend in Chicago from 1980-2000 is representative of all neighborhood
trends, with differences only in levels or scale, or if there is significant spatial variation in
homicide trends at the neighborhood level. This question can be addressed using growth-curve
modeling which involves the estimation of parameters that describe the average initial level of
homicide for all tracts as well as coefficients that describe the average pattern of change over
time. By nesting time-periods within neighborhoods, within-unit change in the homicide rate
can be modeled as a linear or nonlinear function of time with a resulting model for each tract that
includes an intercept representing the initial level of homicide at the beginning of the time
period, and regression coefficients representing the effects of time on the homicide rate. A linear
model would produce a single trend coefficient, whereas a nonlinear specification would require
the addition of higher order terms resulting in additional coefficients. Key to this objective,
variance components from these models provide an indication of whether there is significant
variation in the homicide trend parameter estimates across neighborhoods (Kubrin and Herting
2003; Phillips and Greenberg 2008).
If the analysis under the first objective determines that homicide trends vary across
neighborhoods, the second objective is to evaluate the number of different trajectories that can be
used to characterize change over time in homicide rates in Chicago neighborhoods, and to
describe those trajectories. This will be accomplished using semi-parametric group-based
trajectory modeling via the SAS module PROC TRAJ (Nagin 2005; Nagin and Land 1993;
Jones, Nagin, and Roeder 2001). This approach uses mixture models to identify a finite set of
neighborhood crime rate trajectories within which each individual neighborhood can be
This document is a research report submitted to the U.S. Department of Justice. This report has not been published by the Department. Opinions or points of view expressed are those of the author(s)
and do not necessarily reflect the official position or policies of the U.S. Department of Justice.
8
categorized.
The third objective goes beyond descriptive analyses by evaluating whether any observed
variation in homicide trends across neighborhoods is associated with theoretically relevant
variables identified in the existing macro-level literature on communities and crime. Again, a
comprehensive approach will be taken. The first approach takes advantage of a key output of
group-based trajectory modeling. The PROC TRAJ procedure produces a set of posterior
probabilities of group assignment which allow for the categorization of each neighborhood into
one of the estimated trajectories. These trajectory group assignments can them be used as the
dependent variable in a set of logistic regression models that evaluate whether other
neighborhood characteristics are predictive of the trajectory that a particular neighborhood
follows. This extends prior research by not only identifying a set of homicide trajectories within
which neighborhoods can be categorized, but also assessing the extent to which other
neighborhood characteristics can predict homicide trajectory assignments.
Next, the hierarchical growth curve modeling described earlier will be expanded to
evaluate whether the parameters from the growth curve models estimated under the first
objective are significantly related to the census-based structural characteristics of neighborhoods.
That is, assuming there is variability in the trend parameters across neighborhoods, additional
multi-level growth curve models can assess whether that variability is associated with
characteristics of neighborhoods such as concentrated disadvantage, social disorganization,
family disruption, and immigrant concentration.
Finally, the fourth objective is to test whether any observed effects of neighborhood
structural characteristics on homicide levels and trends are mediated by characteristics such as
This document is a research report submitted to the U.S. Department of Justice. This report has not been published by the Department. Opinions or points of view expressed are those of the author(s)
and do not necessarily reflect the official position or policies of the U.S. Department of Justice.
9
neighborhood ties and perceived disorder. This will be assessed by expanding the growth-curve
models from the third objective, adding collective efficacy and social disorder as explanatory
variables. The expectation is that any observed effects of the structural characteristics in the
previous models will be attenuated after introducing neighborhood ties and perceived disorder,
thus suggesting a process through which neighborhood characteristics such as disadvantage and
instability influence homicide trends largely through their effect on these intervening
characteristics.
RESULTS
The following results are obtained with regard to the project objectives:
• The homicide trajectory of the average Chicago neighborhood from 1980-2000
closely mirrors the overall trajectory for the City of Chicago. The homicide rate
gradually declines from 1980 to 1985, followed by an increase into the early 90s,
and a subsequent decline through 2000.
• The variance components from an unconditional hierarchical growth curve model
indicate that there is, indeed, variability in homicide trends as expected.
Moreover, results from the semi-parametric group-based trajectory analysis
revealed eight distinctive trajectories starting at low, moderate, and high levels of
homicide in 1980, with some of them remaining stable over time, some
increasing, and some declining. These results clearly show that homicide trends
vary considerably across Chicago neighborhoods from 1980-2000.
• Descriptive analyses show that homicide trajectories appear to be associated with
This document is a research report submitted to the U.S. Department of Justice. This report has not been published by the Department. Opinions or points of view expressed are those of the author(s)
and do not necessarily reflect the official position or policies of the U.S. Department of Justice.
10
initial levels and changes over time in concentrated disadvantage, social
disorganization, family disruption, and immigrant concentration.
• Overall, the group-based trajectory analysis shows that higher and increasing
levels of concentrated disadvantage are predictive of being in trajectory groups
with higher and increasing homicide rates regardless of whether initial rates of
homicide are low, moderate, or high in 1980. Whereas social disorganization is
not predictive of homicide trajectory group assignment in any of the group
comparisons, family disruption and immigrant concentration provide additional
explanatory strength, but only for neighborhoods with very high initial levels of
homicide.
• Results from the hierarchical growth-curve analysis show that concentrated
disadvantage is predictive of starting points of homicide in 1980, yet it does not
appear as a significant predictor of change over time. This is also true for family
disruption. On the other hand, social disorganization and immigrant
concentration were predictive of both initial levels of homicide and variability in
change over time. These findings again underscore the point that certain
structural characteristics of neighborhoods are predictive of neighborhood
homicide trends.
• The analysis of intervening mechanisms finds that the effects of concentrated
disadvantage and social disorganization on initial levels of homicide are
significantly and substantially reduced after controlling for social ties and
perceived disorder.
This document is a research report submitted to the U.S. Department of Justice. This report has not been published by the Department. Opinions or points of view expressed are those of the author(s)
and do not necessarily reflect the official position or policies of the U.S. Department of Justice.
11
CONCLUSIONS
These results clearly show that homicide trends vary considerably across neighborhoods
over this time period. This is an important finding given that so much attention has been paid to
the crime decline observed in the United States over the past two decades, and the relative
uniformity in crime trends in US cities over this period, with variations mostly in the timing and
amplitude of their trajectories. Far less attention has been directed at variability in crime trends
across subareas within cities. The results from the first and second objectives of this study
indicate that this is an important oversight, and that the variability in homicide trends across
neighborhoods merits further analysis.
Despite the fact that the majority of research on communities and crime has been cross-
sectional, the theoretical and empirical literature clearly emphasizes the importance of change
over time in neighborhood structure and social processes for understanding change over time in
rates of crime. As researchers continue to gather longitudinal data at the neighborhood level, and
as the statistical methods for analyzing change continue to advance, it is important to consider
whether we must revise or reorient our theoretical approach to the study of variation in crime
trends across local areas. A large body of empirical literature has developed regarding the
predictors of homicide across communities, and that research has shown a large degree of
consistency in the relevance of particular structural characteristics across different time periods
and across different levels of aggregation (Land et al., 1990; McCall, Land, and Parker, 2010).
Thus, the expectations are fairly clear regarding between-neighborhood variation in crime rates,
and from these it is easy to extrapolate expectations about within-community change over time.
This document is a research report submitted to the U.S. Department of Justice. This report has not been published by the Department. Opinions or points of view expressed are those of the author(s)
and do not necessarily reflect the official position or policies of the U.S. Department of Justice.
12
The current analysis of between-neighborhood variability in within-unit homicide trends may
appear, at first glance, to be simply a combination of the traditional cross-sectional and
longitudinal approaches seen in prior work. However, the preceding analysis and discussion
suggests that current theoretical frameworks may not be sufficiently developed to offer clear
expectations with regard to the between-unit variability in neighborhood trajectories of homicide.
This line of research could yield important policy recommendations. If we can
consistently identify characteristics associated with certain crime trajectories, and assuming these
characteristics are responsive to social policies and programs, policy makers could apply
interventions that are specifically targeted at neighborhoods at a particular stage of development.
For example, the finding from the trajectory analysis that changes in concentrated disadvantage
are associated with homicide trends for neighborhoods at low, moderate, or high levels of
homicide suggests that neighborhood-based policies aimed at reducing poverty and
unemployment, or improving high school and college graduation rates, will yield reductions in
homicide regardless of the neighborhood's current level of homicide.
Of course, it is difficult for localities to develop policies and programs for reducing
neighborhood characteristics such as poverty and unemployment. However, the analysis of
intervening processes identified two characteristics that appear to mediate some of the effect of
characteristics such as disadvantage and social disorganization on homicide rates. This suggests
that policies aimed at increasing levels of interaction among neighborhood residents, or that
reduce perceived levels of physical and social disorder, may be effective at reducing homicide
levels even where disadvantage and disorganization persist. For example, efforts such as
cleaning and repairing streets, removing graffiti, and eradicating drug sales and prostitution may
This document is a research report submitted to the U.S. Department of Justice. This report has not been published by the Department. Opinions or points of view expressed are those of the author(s)
and do not necessarily reflect the official position or policies of the U.S. Department of Justice.

13
reduce residents' perceptions of physical and social disorder, which may in turn lead to
reductions in homicide. Likewise, crime may be reduced through efforts to increase levels of
social interaction among neighborhood residents such as funding block parties and festivals,
forming a neighborhood watch, or by organizing neighborhood cleanups.
Another important finding from a policy perspective is that certain neighborhood
characteristics are associated with high, persistent levels of homicide, even while other
neighborhoods and the city as a whole are experiencing rapid declines in homicide. Specifically,
social disorganization was found to yield high initial levels of homicide, and areas with high
levels of disorganization tend to have homicide trends that do not fluctuate over time. Again, it
is difficult for localities to design and implement policies that reduce concentrations of renter-
occupied housing or prevent residential mobility. However, the mediation analysis suggests that
policies targeting intervening mechanisms such as neighborhood ties and disorder may reduce
levels of homicide even in areas with persisting social disorganization.
This document is a research report submitted to the U.S. Department of Justice. This report has not been published by the Department. Opinions or points of view expressed are those of the author(s)
and do not necessarily reflect the official position or policies of the U.S. Department of Justice.
14
INTRODUCTION
STATEMENT OF THE PROBLEM
One of the most important social changes in the United States during the 1980s and
1990s was the dramatic increase and subsequent decrease in crime, and particularly violent
crime. Perhaps nowhere was this more controversial and publicized than New York City, but the
changes in Chicago were similarly dramatic. Indeed, the homicide rate in Chicago nearly tripled
between 1965 and 1992, after which it declined by more than 50% through 2005. This is a
remarkable pattern of change, but is this overall trend characteristic of all areas within the city?
If not, what other patterns in homicide can be identified among Chicago neighborhoods, and
what might explain the variation in homicide trends across neighborhoods?
Much of the prior research on neighborhoods and crime has drawn on the social
disorganization perspective which argues that neighborhoods characterized by high levels of
poverty, residential turnover, and heterogeneity find it difficult to realize common values and
solve collective problems, which may in turn lead to higher rates of crime (Shaw and McKay,
1942) . Others have expanded the perspective by specifying the intervening mechanisms through
which structural characteristics of neighborhoods may influence crime rates, such as through
social ties, mutual trust, or a shared willingness to engage in informal control (Bellair, 1997;
Bursik, 1988; Sampson and Groves, 1989; Sampson, Raudenbush, and Earls, 1997). Though
these theoretical approaches are firmly grounded in an ecological approach that emphasizes
temporal concepts such as instability, population turnover, deterioration, and cyclical change,
surprisingly few studies have employed longitudinal designs to explicitly capture such processes
(Bursik, 1986; Fagan and Davies, 2004). This is likely due in part to data limitations, as it can be
This document is a research report submitted to the U.S. Department of Justice. This report has not been published by the Department. Opinions or points of view expressed are those of the author(s)
and do not necessarily reflect the official position or policies of the U.S. Department of Justice.
15
costly and time consuming to collect the necessary measures at multiple points in time.
Moreover, at least in the early stages of the development of this perspective, statistical methods
for effectively modeling change over time were not available. Thus, while a great deal of prior
criminological research has examined variation across neighborhoods in levels of crime, much
less work has been dedicated to describing crime trends within neighborhoods, and even less
research has attempted to the identify characteristics associated with variation across
neighborhoods in crime trends and trajectories.
Another possible reason for the predominance of cross-sectional research in the study of
communities and crime is the strong emphasis by Shaw and McKay (1942) on the stability of
crime-generating processes in neighborhoods (Bursik, 1984, 1986). That is, although rapid
residential change was a large part of the social disorganization framework in the early Chicago
School, there was an assumption that the processes that generated high crime in neighborhoods
were, themselves, fairly stable over time. This led to their influential conclusion that
neighborhood rates of juvenile delinquency remained relatively stable over time despite
sometimes rapid changes in racial and ethnic composition within neighborhoods. However, a
handful of studies in the 1980s and 1990s questioned this stability hypothesis, instead arguing
that change in neighborhoods can occur through multiple processes, and even the same dynamic
processes can lead to different outcomes across neighborhoods depending on their initial
ecological characteristics and their current stage in the developmental process (Bursik and
Grasmick, 1992; Schuerman and Kobrin, 1986; Taylor and Covington, 1988). This approach
suggests that communities progress through developmental pathways that can yield variation
across communities in not just crime rates at a single point in time, but also in their trajectories
This document is a research report submitted to the U.S. Department of Justice. This report has not been published by the Department. Opinions or points of view expressed are those of the author(s)
and do not necessarily reflect the official position or policies of the U.S. Department of Justice.
16
of crime over a span of time.
This notion of community careers in crime parallels the concept of 'criminal careers' from
the individual-level developmental and life-course literature where researchers often attempt to
identify classes of individual offenders, such as abstainers, adolescent-limited delinquents, and
life-course persistent offenders (Laub and Sampson, 2003; Moffitt, 1993; Piquero, Farrington,
and Blumstein, 2003). If we were to think of crime patterns in terms of a neighborhood 'life-
course', what types of trajectories might be evident? Do neighborhoods essentially mirror the
city-level crime trend, with differences only in scale, or does the pattern of change over time
vary across neighborhoods? Recent macro-level research has begun to directly address these
questions, with a general finding that neighborhoods do, indeed, seem to exhibit a variety of
crime trajectories that are sometimes considerably different from the trend of the broader city
(Chavez and Griffiths, 2009; Griffiths and Chavez, 2004; Weisburd, Bushway, Lum, and Yang,
2004).
The purpose of this project is to analyze homicide trends in Chicago neighborhoods from
1980-2000. The first objective is to determine whether trends in homicide varied across Chicago
neighborhoods from 1980-2000. A great deal of research has examined variation across
neighborhoods in levels of crime, but much less work has been dedicated to describing crime
trends within neighborhoods. A second, related objective will be to determine whether these
neighborhood homicide trends can be categorized into a discrete set of trajectory groups, similar
to the offending trajectory groups that have been identified by developmental criminologists.
The third objective expands upon the descriptive analysis by identifying determinants of
neighborhood homicide trends. Prior research has documented various crime trajectories across
This document is a research report submitted to the U.S. Department of Justice. This report has not been published by the Department. Opinions or points of view expressed are those of the author(s)
and do not necessarily reflect the official position or policies of the U.S. Department of Justice.
17
neighborhoods, but the next logical question is what gives rise to these various trajectories and,
given similar levels of homicide at the beginning of the time period, what factors are associated
with a neighborhood being categorized into one trajectory grouping over another? Drawing on
the social disorganization and concentrated disadvantage literature, the focus of this objective
will be to assess the degree to which structural characteristics of neighborhoods influence
homicide trends, including factors such as poverty, unemployment, single-headed households,
immigration, divorce, racial composition, density, and population mobility.
The fourth objective is to introduce community characteristics that are thought to mediate
the influence of the previously mentioned factors on neighborhood homicide trends. Scholars
have elaborated on the classic social disorganization model, arguing that concentrated
disadvantage, population instability, and heterogeneity can reduce a community's ability to
control its residents by reducing levels of social interaction and neighboring, mutual trust, the
recognition of common goals and values, and legal cynicism. This study tests the expectation
that more proximate neighborhood characteristics mediate the influence of the broader structural
variables on homicide trends.
LITERATURE REVIEW
Social Disorganization and Between-Community Variation in Crime
Criminologists have long been interested in the extent to which crime and violence varies
across neighborhoods. A large body of empirical research has identified substantial spatial
variation in crime rates, and several major criminological theories have attempted to explain such
between-unit differences. One of the earliest and most influential approaches to the study of
This document is a research report submitted to the U.S. Department of Justice. This report has not been published by the Department. Opinions or points of view expressed are those of the author(s)
and do not necessarily reflect the official position or policies of the U.S. Department of Justice.
18
communities and crime in the United States was the analysis of community areas in Chicago by
Shaw and McKay (1942). They followed an ecological framework arguing that natural
processes of growth, competition, and decay in the city create areas with consistently high levels
of poverty, ethnic heterogeneity, and population turnover. It was argued that these factors tend
to reduce levels of interpersonal interaction and value consensus among residents which impedes
the community's ability to achieve common goals and control its residents. Using analytic
methods that were sophisticated and ambitious for the time, Shaw and McKay were able to show
that areas near the central business district of Chicago were consistently and considerably higher
in rates of juvenile delinquency than neighborhoods further from the city core.
A large body of empirical work has since studied variation in crime across communities
from the social disorganization perspective. Early studies found effects of socioeconomic
characteristics, racial heterogeneity, home-ownership, and transiency on juvenile delinquency
(Lander 1954; Bordua 1958; Chilton 1964; Gordon 1967), though these studies failed to
recognize the importance that Shaw and McKay placed on the tendency for these community
characteristics to increase social disorganization and reduce informal social control. More recent
research has expanded on Shaw and McKay's original framework by attempting to explicate the
intervening mechanisms through which macro-social structural characteristics influence levels of
informal social control and subsequently crime and delinquency (Sampson and Groves 1989;
Simcha-Fagan and Schwartz 1986; Smith and Jarjoura 1988; Patterson 1991). This research
attempted to further develop social disorganization theory into a systemic model of social control
(Kasarda and Janowitz 1974; Brusik 1988; Bursik and Grasmick 1993). For example, Sampson
and Groves (1989) used data from the British Crime Survey to provide a more direct test of the
This document is a research report submitted to the U.S. Department of Justice. This report has not been published by the Department. Opinions or points of view expressed are those of the author(s)
and do not necessarily reflect the official position or policies of the U.S. Department of Justice.
19
social disorganization perspective by examining the mediating effects of local friendship
networks, organizational participation, and the neighborhood capacity to supervise teens. They
found that these indicators of social disorganization mediated much of the influence of
neighborhood structural characteristics on crime and victimization. Likewise, Bellair (1997)
found that getting together at least once a year with neighbors significantly reduced several
forms of criminal victimization and mediated a large portion of the effects of ecological
characteristics such as socioeconomic status and racial heterogeneity.
More recently, Sampson and colleagues have extended the social disorganization
framework by emphasizing not just neighborhood ties, but also shared trust among neighborhood
residents and a willingness to actively engage in social control (Sampson, et al. 1997; Morenoff,
Sampson, and Raudenbush 2001). Neighborhoods with high levels of collective efficacy are
characterized by mutual trust and shared expectations with regard to informal control, and are
better able to effectively mobilize to control criminal behavior among residents. Several
empirical studies, mostly utilizing data from the Project on Human Development in Chicago
Neighborhoods (PHDCN), have found supportive results for the notion of collective efficacy.
For example, Sampson, at al. (1997), found that commonly-used indicators of social
disorganization – concentrated disadvantage, immigrant concentration, and residential instability
– were inversely related to collective efficacy, and that the latter, in turn, was inversely
associated with violent crime in Chicago neighborhoods. Likewise, Morenoff, et al. (2001)
found that friend and kinship networks only reduce levels of neighborhood violence to the extent
that they increase collective efficacy. Other research has found that collective efficacy
significantly reduced neighborhood levels of homicide and non-lethal violence among intimates
This document is a research report submitted to the U.S. Department of Justice. This report has not been published by the Department. Opinions or points of view expressed are those of the author(s)
and do not necessarily reflect the official position or policies of the U.S. Department of Justice.

20
(Browning 2002), and that communities with lower levels of mutual trust and civic engagement
tend to have higher levels of homicide (Rosenfeld, Messner, and Baumer 2001).
Social Disorganization and Within-Community Variation in Crime
The studies cited above have contributed a great deal to our knowledge and
understanding of variation in community levels of crime, yet they all examine neighborhood
crime cross-sectionally. This is despite the fact that Shaw and McKay themselves utilized
several decades of data to draw their conclusions, and central to their argument was the notion
that urban growth and change are the fundamental precursors to social disorganization and crime.
Though one of Shaw and McKay's most influential findings was that neighborhood crime rates
were actually quite stable over time regardless of the invasion and succession characteristic of
Chicago neighborhoods in the early part of the twentieth century, others warned that city ecology
can change over time (Rosen and Turner 1967; Chilton and Dussich 1974; Schuerman and
Kobrin 1986), and Bursik (1984: p.395) strongly states that “community processes related to
delinquency can only be placed within larger urban dynamics and given a full meaning through
longitudinal data”.
Starting in the 1980's, research on neighborhood crime began to directly examine the
influence of neighborhood characteristics on change over time (Bursik and Webb 1982; Bursik
1984; Bursik 1986; Heitgard and Bursik 1987; Taylor and Covington 1988). Bursik and Webb
(1982) re-analyzed Shaw and McKay's claim that the distribution of delinquency across Chicago
neighborhoods was relatively stable over time. Examining data from 1940-1970, they generally
confirmed the stability hypothesis for the earliest decade, but found that compositional changes
This document is a research report submitted to the U.S. Department of Justice. This report has not been published by the Department. Opinions or points of view expressed are those of the author(s)
and do not necessarily reflect the official position or policies of the U.S. Department of Justice.
21
in the subsequent decades were significantly related to changes in delinquency. Likewise,
examining Baltimore neighborhoods from 1970-1980, Taylor and Covington (1988) found that
increasing neighborhood instability was associated with increased levels of violence regardless
of whether the neighborhood was undergoing decline or gentrification.
Subsequent research has expanded on these longitudinal approaches by simultaneously
examining both within-neighborhood changes in crime and variation in crime trends across
neighborhoods. In the first such study, Bursik and Grasmick (1992) found that neighborhoods
characterized by increasing stability from 1930-1970 tended to experience significant declines in
delinquency. They also showed that inferences about temporal processes gleaned from cross-
sectional approaches could vary considerably from the conclusions drawn from research where
time is directly incorporated. More recently, and using similar methods, Kubrin and Herting
(2003) found significant variation in homicide trends across St. Louis neighborhoods from 1980-
1994. They found that for some types of homicide, neighborhood disadvantage and instability
helped explain both initial levels and changes over time.
Community Careers in Crime
An alternative approach to the study of neighborhood crime trends draws upon research
in the developmental psychological literature that categorizes individuals into a discrete number
of groups based on their pattern of delinquent, criminal, or deviant behavior over some period of
time (Nagin 2005; Nagin and Land 1993). In the context of neighborhood crime, the objective is
to identify a set of crime trajectories that are representative of the patterns found in
neighborhoods across the city. Regression analysis can then be applied to identify the
This document is a research report submitted to the U.S. Department of Justice. This report has not been published by the Department. Opinions or points of view expressed are those of the author(s)
and do not necessarily reflect the official position or policies of the U.S. Department of Justice.
22
characteristics associated with following a certain trajectory. Though the application of this
approach to the macro-analysis of crime is very new, this sort of developmental perspective
certainly follows the lead of urban ecology with its emphasis on the stages that communities pass
through on their developmental trajectories.
Perhaps the first explicit application of the developmental perspective to the study of
communities and crime was the study of crime trends in Los Angeles communities from 1950-
1970 by Schuerman and Kobrin (1986). They introduced the notion of community careers in
crime by categorizing neighborhood crime trends as either emerging, transitional, or enduring.
They followed with an analysis of the determinants and consequences of each stage, finding that
rising crime tended to be preceded by neighborhood deterioration characterized by factors such
as increasing multiple-family dwellings and residential mobility. Subsequently, several studies
have utilized contemporary methods of trajectory analysis to analyze neighborhood crime trends
(Chavez and Griffiths 2009; Griffiths and Chavez 2004; Fagan 2008; Weisburd, et al. 2004). For
example, using 14 years of crime data for Seattle street segments, Weisburd, et al. (2004) were
able to classify 30,000 micro-areas into 18 unique crime trajectories. They found that the city's
overall crime trend was primarily determined by a small proportion of cases in the steeply
declining trajectories. Griffiths and Chavez (2004) identified three unique homicide trajectories
for Chicago neighborhoods from 1980-1995, and found a diffusion effect of gun-related violence
from clusters of neighborhoods with persistently high homicide rates to areas where homicide
was moderate and slowly increasing. While these are important first steps in the application of
the developmental perspective to neighborhood crime, none of these contemporary studies take
the next step of identifying the theoretically relevant neighborhood characteristics that are
This document is a research report submitted to the U.S. Department of Justice. This report has not been published by the Department. Opinions or points of view expressed are those of the author(s)
and do not necessarily reflect the official position or policies of the U.S. Department of Justice.
23
predictive of specific crime trajectories. As mentioned previously, this is a primary objective of
the proposed study.
RESEARCH DESIGN AND METHODS
DATA SOURCES AND VARIABLES
Data for this project was compiled from a variety of sources. To generate the homicide
rate (per 100,000), homicide incident counts were obtained from the Chicago Homicide Data Set
available from the National Criminal Justice Archive at ICPSR (Block, Block, and ICJI, 1998).
This data set includes tract identifiers that allow for merging with other tract characteristics. The
population sizes used in the denominator of the homicide rate were obtained from the decennial
U.S. Census files for each decade from 1980-2000, and cubic spline interpolation was used to
generate intercensal estimates. Census tracts were excluded from the analysis if they had a
population of less than 100 persons in any given year because such small denominators result in
considerable instability in homicide rates. An additional two tracts (1701 and 3204) were
omitted because they have no households. A large portion of the first tract is occupied by the
Chicago-Read Mental Health Center, and the second tract is located in The Loop, and
encompasses the Art Institute of Chicago, Grant Park, and several other green spaces. After
removing these census tracts, the sample size was 827 tracts. The homicide rate is calculated per
100,000 population. Due to a high degree of skewness in the homicide rate, the following
analysis uses the natural log of the homicide rate.1
As mentioned earlier, one objective was to examine the relationships between homicide 1 A small constant (1) was added to the homicide rate before logging in order to avoid undefined values caused by
taking the natural log of zero.
This document is a research report submitted to the U.S. Department of Justice. This report has not been published by the Department. Opinions or points of view expressed are those of the author(s)
and do not necessarily reflect the official position or policies of the U.S. Department of Justice.
24
trends and various characteristics of neighborhood structure identified as relevant by the social
disorganization perspective. These variables are drawn from the 1980, 1990, and 2000 Census
of Population and Housing. The 1980 data come from Summary Tape File 4A (STF 4A), the
1990 data come from Summary Tape File 3A (STF 3A), and the 2000 come from Summary File
3 (SF 3). Variables for this portion of the analysis include population size, median household
income, poverty rate, unemployment rate, divorce rate, percentage of female-headed households,
residential mobility, homeownership rate, racial and Hispanic composition, immigrant
composition, percentage of households speaking English, and population density. In order to
avoid the problems associated with high levels of multicollinearity among the regressors, several
standardized mean indexes were created to represent key concepts identified in previous
empirical and theoretical work (Land, McCall, and Cohen, 1990). All predictors are
incorporated as both static levels at the beginning of the time period, and as change scores for the
period 1980 to 2000 (Rosenfeld et al. 2007; Kubrin and Herting 2003).
The concentrated disadvantage index is comprised of median household income, the
percentage of persons with a high school diploma, the percentage of persons with a bachelor's
degree, percentage of persons who are African American, and the percentage of persons
unemployed. The strong correlations between these component variables indicate that very high
degrees of resource deprivation are differentially experienced by African Americans due to
economic dislocation and high levels of racial residential segregation in Chicago (Land et al.,
1990; Logan, Stults, and Farley, 2004; Massey and Denton, 1993; Morenoff et al., 2001; Wilson,
1987). It is expected that areas with high levels of disadvantage in 1980 will have trajectories
with higher starting points, and that increases in concentrated disadvantage will be associated
This document is a research report submitted to the U.S. Department of Justice. This report has not been published by the Department. Opinions or points of view expressed are those of the author(s)
and do not necessarily reflect the official position or policies of the U.S. Department of Justice.
25
with increasing homicide trajectories. This index had a reliability score of at least 0.88 in all
years.
Family disruption is an index comprised of the percentage of persons age 15 and over
who are divorced and the percentage of children who live with a single parent. Some have
argued that neighborhoods with high rates of family disruption have a diminished capacity for
formal and informal social control which may lead to higher rates of homicide (Cohen and
Felson, 1979; Sampson, 1986, 1987). As with concentrated disadvantage, high levels and
increases in family disruption are expected to yield high and increasing trajectories of homicide.
This index had a reliability coefficient ranging from 0.51 in 1990 to 0.56 in 2000.
Social disorganization is measured with an index comprised of the percentage of persons
who lived in a different house five years earlier, the percentage of homes that are renter-
occupied, the percentage of housing units that are vacant, and population density. High levels of
population turnover and density are likely to inhibit the ability of residents to recognize each
other and develop friendship networks (Kasarda and Janowitz, 1974; Kornhauser, 1978; Wirth,
1938), and residents in such areas may be less willing to exercise informal social control and
guardianship behavior (Morenoff et al., 2001; Sampson et al, 1997). Thus, it is expected that
areas with high levels of social disorganization in 1980 will have high starting points to their
homicide trajectories, and that neighborhoods with increasing disorganization will be more likely
to have increasing homicide trajectories. This index also exhibited a high level of reliability,
with alpha coefficients of 0.60 in all years.
Immigrant concentration is measured using an index comprised of the percentage
foreign-born and the percentage Hispanic. Though popular opinion among the American public
This document is a research report submitted to the U.S. Department of Justice. This report has not been published by the Department. Opinions or points of view expressed are those of the author(s)
and do not necessarily reflect the official position or policies of the U.S. Department of Justice.
26
is often that immigration and crime are strongly, positively related, much of the empirical
research shows that immigrants are less likely to engage in crime than native-born Americans
after controlling for other characteristics (Hagan and Palloni, 1999; Mears, 2010). Moreover,
macro-level research typically finds either a null or negative relationship between immigrant
concentration and crime rates (Chavez and Griffiths, 2009; Lee, Martinez, and Rosenfeld, 2001).
Perhaps part of the reason for the presumed positive relationship between immigration and crime
is the fact that immigrants are more likely to live in disadvantaged neighborhoods than their
native-born counterparts (Alba, Logan, and Bellair, 1994; Alba, Logan, and Stults, 2000). Thus,
it is expected that neighborhoods with higher concentrations of immigrants may have higher
initial homicide rates at the start of the time period, but controlling for levels of disorganization
and disadvantage, areas with increasing concentrations of immigrants will be associated with a
declining homicide trajectory. This index had a reliability coefficient of at least 0.8 in all years.
As an initial attempt at determining whether the effect of these structural characteristics
on neighborhood crime trends are mediated by emergent properties of neighborhoods such as
social cohesion, collective efficacy, and disorder, this study also incorporates data from the
1994-1995 Community Survey of the Project on Human Development in Chicago
Neighborhoods, which is also accessible from the National Archive of Criminal Justice Data.
This survey contains responses from interviews conducted with 8,782 Chicago residents
comprising a representative sample for each of the 343 neighborhood clusters of Chicago. The
resulting data set includes measures such as willingness to engage in informal social control,
social cohesion and trust, and social and physical disorder. The community survey was
conducted in 1994-1995, so the timing is not ideal for incorporation into a study of homicide
This document is a research report submitted to the U.S. Department of Justice. This report has not been published by the Department. Opinions or points of view expressed are those of the author(s)
and do not necessarily reflect the official position or policies of the U.S. Department of Justice.
27
trends from 1980-2000. Therefore, this portion of the analysis is restricted to just the years
1990-2000, and it is viewed as an initial effort to identify theoretically relevant mediating effects,
and will hopefully stimulate future research. Because many of the community-level measures
included in the PHDCN are highly collinear, two variables were selected as possible intervening
mechanisms. The measure of neighborhood ties is an mean index derived from 5 survey items
asking how often people in the neighborhood do favors for one another, how often neighbors
watch over each other's property, how often neighbors as for advice, how often people in the
neighborhood get together, and how often people in the neighborhood visit in each other's
homes. Response categories for the constituent items ranged from a value of 1 for "never" to a
value of 4 for "often". The disorder index is comprised of items measuring perceived levels of
both social and physical disorder, including questions asking how much of a problem is posed by
litter, graffiti, vacant buildings, drinking in public, using or selling drugs in public, and groups of
teenagers or adults hanging out and causing trouble. Additional detail about the survey items
that make up each of these indexes is provided in Appendix A.
ANALYTIC PLAN
Because temporal and spatial analysis of neighborhood crime is a complex and relatively
new endeavor, a comprehensive approach is taken. This involves a variety of analytical methods
including hierarchical growth-curve modeling, semi-parametric group-based trajectory modeling,
and the analysis of spatial dependence. The first objective of this study is to determine whether
the overall homicide trend in Chicago from 1980-2000 is representative of all neighborhood
trends, with differences only in levels or scale, or if there is significant spatial variation in
This document is a research report submitted to the U.S. Department of Justice. This report has not been published by the Department. Opinions or points of view expressed are those of the author(s)
and do not necessarily reflect the official position or policies of the U.S. Department of Justice.
28
homicide trends at the neighborhood level. This question can be addressed using growth-curve
modeling which involves the estimation of parameters that describe the average initial level of
homicide for all tracts as well as coefficients that describe the average pattern of change over
time. By nesting time-periods within neighborhoods, within-unit change in the homicide rate
can be modeled as a linear or nonlinear function of time with a resulting model for each tract that
includes an intercept representing the initial level of homicide at the beginning of the time
period, and regression coefficients representing the effects of time on the homicide rate. A linear
model would produce a single trend coefficient, whereas a nonlinear specification would require
the addition of higher order terms resulting in additional coefficients. Key to this objective,
variance components from these models provide an indication of whether there is significant
variation in the homicide trend parameter estimates across neighborhoods (Kubrin and Herting
2003; Phillips and Greenberg 2008).
If the analysis under the first objective determines that homicide trends vary across
neighborhoods, the second objective is to evaluate the number of different trajectories that can be
used to characterize change over time in homicide rates in Chicago neighborhoods, and to
describe those trajectories. This will be accomplished using semi-parametric group-based
trajectory modeling via the SAS module PROC TRAJ (Nagin 2005; Nagin and Land 1993;
Jones, Nagin, and Roeder 2001). This approach uses mixture models to identify a finite set of
neighborhood crime rate trajectories within which each individual neighborhood can be
categorized. The Bayesian Information Criterion (BIC) statistic is used to determine whether
modeling additional trajectories leads to an increase in model fit, and whether fit is maximized
by modeling each trajectory as linear, quadratic, or cubic. This iterative process will yield a set
This document is a research report submitted to the U.S. Department of Justice. This report has not been published by the Department. Opinions or points of view expressed are those of the author(s)
and do not necessarily reflect the official position or policies of the U.S. Department of Justice.
29
of parameter estimates that describe each trajectory group, and it will provide a graphical display
of the optimal number of homicide rate trajectories.
The third objective goes beyond descriptive analyses by evaluating whether any observed
variation in homicide trends across neighborhoods is associated with theoretically relevant
variables identified in the existing macro-level literature on communities and crime. Again, a
comprehensive approach will be taken. The first approach takes advantage of a key output of
group-based trajectory modeling. The PROC TRAJ procedure produces a set of posterior
probabilities of group assignment which allow for the categorization of each neighborhood into
one of the estimated trajectories. These trajectory group assignments can them be used as the
dependent variable in a set of logistic regression models that evaluate whether other
neighborhood characteristics are predictive of the trajectory that a particular neighborhood
follows. This extends prior research by not only identifying a set of homicide trajectories within
which neighborhoods can be categorized, but also assessing the extent to which other
neighborhood characteristics can predict homicide trajectory assignments.
Next, the hierarchical growth curve modeling described earlier will be expanded to
evaluate whether the parameters from the growth curve models estimated under the first
objective are significantly related to the census-based structural characteristics of neighborhoods.
That is, assuming there is variability in the trend parameters across neighborhoods, additional
multi-level growth curve models can assess whether that variability is associated with
characteristics of neighborhoods such as concentrated disadvantage, social disorganization,
family disruption, and immigrant concentration.
Finally, the fourth objective is to test whether any observed effects of neighborhood
This document is a research report submitted to the U.S. Department of Justice. This report has not been published by the Department. Opinions or points of view expressed are those of the author(s)
and do not necessarily reflect the official position or policies of the U.S. Department of Justice.
30
structural characteristics on homicide levels and trends are mediated by characteristics such as
neighborhood ties and perceived disorder. This will be assessed by expanding the growth-curve
models from the third objective, adding collective efficacy and social disorder as explanatory
variables. The expectation is that any observed effects of the structural characteristics in the
previous models will be attenuated after introducing neighborhood ties and perceived disorder,
thus suggesting a process through which neighborhood characteristics such as disadvantage and
instability influence homicide trends largely through their effect on these intervening
characteristics.
RESULTS
NEIGHBORHOOD VARIATION IN HOMICIDE TRENDS
The first question to be addressed is whether there is significant variation in homicide
trends across Chicago neighborhoods. Figure 1 shows the trend in the homicide rate from 1980-
2000 for the city of Chicago overall, as well as for the average neighborhood within Chicago.
Both trends show a gradual decline from 1980 to 1985, followed by an increase into the early
90's, and a subsequent decline through 2000. Certainly, it can be expected that some
neighborhoods will have levels of homicide that are higher than these average levels, and others
will have lower levels. However, it is possible that the primary source of deviation from the
overall trend will be only in levels of homicide at each time point, such that neighborhoods
predominantly follow the same general trend, just at higher or lower levels. On the other hand, it
is also possible that neighborhoods vary not just in levels of homicide, but also in the trajectory
that homicide rates follow over time.
This document is a research report submitted to the U.S. Department of Justice. This report has not been published by the Department. Opinions or points of view expressed are those of the author(s)
and do not necessarily reflect the official position or policies of the U.S. Department of Justice.
31
Figure 2 again shows the observed trajectory of the average Chicago neighborhood, but it
also includes observed trajectories for six different Chicago census tracts superimposed over it.
These tracts were chosen purposively to illustrate the wide variety of trends exhibited across
neighborhoods. Though not necessarily a representative sample of tracts, this selection clearly
shows a variety of different patterns of homicide over time, with variability in levels of homicide
in 1980, different general levels of homicide over time, and varying directions of change.
Indeed, a visual examination of the trajectories for all Chicago census tracts over this period
reveals a multitude of different trends, with varying trajectories at all levels of homicide.
While these visual inspections suggest considerable variability in homicide trajectories
across neighborhoods, it is still possible that the particular selection of census tracts shown in
Figure 1 overestimate the degree of variability, and that a more systematic analysis of all
neighborhoods could reveal that neighborhoods tend to follow the same general trend, perhaps
with differences only in degree. For additional evidence, we turn to the two statistical methods
for evaluating trends and trajectories – semi-parametric group-based trajectory modeling, and
hierarchical growth curve modeling.
GROUP-BASED TRAJECTORY ANALYSIS
The group-based trajectory modeling (GTM) of homicide trajectories follows a two-stage
process (Nagin, 2005). The initial stage entails first estimating a one group model with a
quadratic functional form, then a two group model, a three group model, and so on, until the
inclusion of an additional group no longer improves model fit according to the BIC statistic.
Though the maximum likelihood always increases with each additional groups, the BIC statistic
This document is a research report submitted to the U.S. Department of Justice. This report has not been published by the Department. Opinions or points of view expressed are those of the author(s)
and do not necessarily reflect the official position or policies of the U.S. Department of Justice.
32
includes a penalty for each additional parameter, thus rewarding parsimony. The BIC statistics
presented in Table 1 show whether allowing for additional groups led to an increase in model fit,
and the log Bayes factors presented in the last column provide a measure of the degree of
evidence favoring each more complex model over the previous simpler model. A log Bayes
factor of greater than 10 is typically considered to be very strong evidence that a given model is
favorable to the previous one (Jones et al., 2001). These results show that each additional group
provides an improvement to model fit up to an eight-group model, with each successive model
producing a log Bayes factor of well over 10. The estimation of a nine-group model resulted in
false convergence, so the eight-group model emerges as the clear choice. Specifying alternative
functional forms (e.g. linear or cubic) either failed to reach convergence or did not yield an
improvement to model fit, so all trajectories were estimated as quadratic. The average posterior
probability of group assignment for all tracts was 0.935, further suggesting that the selected
model fits the data well.
[ Table 1 about here ]
The predicted trajectories based on the eight-group quadratic model are illustrated in
Figure 3. Overall, we see that these eight trajectories are visibly distinct from one other and
represent very different patterns of change in homicide. The first two trajectory groups start at
very low levels of homicide in 1980, but diverge in their trajectories from that point. Group 1,
comprising about 15% of all census tracts, is characterized by persistently low levels of homicide
throughout the full time period. Group 2 gradually increases from initially low levels to among
the highest levels by 2000. Groups 3 and 4 start from similarly moderate levels in 1980, with
group 5 just a little higher, but these three groups exhibit divergent trends over time with one
This document is a research report submitted to the U.S. Department of Justice. This report has not been published by the Department. Opinions or points of view expressed are those of the author(s)
and do not necessarily reflect the official position or policies of the U.S. Department of Justice.

33
increasing, one declining, and one remaining mostly stable. Finally, groups 6, 7, and 8, start at
considerably higher levels in 1980. Group 8 remains consistently high over the two decades,
while group 6 declines markedly, and group 7 also declines but at a slower pace.
[ Figure 4 about here ]
Structural Characteristics of Homicide Trajectory Groups
It is clear from the GTM analysis and the visual illustration in Figure 3 that census tracts
exhibit a variety of different trajectories of homicide over this time period. Tracts within a
particular group are similar in their homicide trajectory, but do they have other common
characteristics, and might these other characteristics be used to differentiate among the various
groups in theoretically meaningful ways? Figures 4 and 5 present structural characteristics of the
average tract in each trajectory grouping. Figure 4 provides mean values in 1980 – the starting
point of the series – while Figure 5 provides average levels of change between 1980 and 2000.
The mean values used to generate each figure are presented in tabular form in Appendices A and
B.
While evaluating the mean initial values shown in Figure 4, it is helpful to recognize that
the trajectory groups are numbered according to their starting points for homicide in 1980, such
that group 1 has the lowest average homicide rate in 1980 and group 8 has the highest average
rate. Considering this ordering, a fairly consistent pattern emerges from Figure 4; census tracts
in trajectory groups with low homicide rates in 1980 also have the lowest average starting levels
of disadvantage, social disorganization, and family disruption, and tracts in trajectory groups
with high starting levels of homicide have the highest average starting points for these
This document is a research report submitted to the U.S. Department of Justice. This report has not been published by the Department. Opinions or points of view expressed are those of the author(s)
and do not necessarily reflect the official position or policies of the U.S. Department of Justice.

34
characteristics. The pattern is less clear for immigrant concentration. For most of the groups,
starting levels of homicide appear to be positively related to starting levels of immigrant
concentration. For example, groups 1 and 2 have the lowest starting levels of homicide in 1980,
and they also have among the lowest starting levels of immigrant concentration. Likewise,
groups 6 and 7 have among the highest starting levels of homicide as well as the highest levels of
immigrant concentration. However, two trajectory groups run contrary to this pattern. Tracts in
group 3 have relatively low starting levels of homicide, but they have the second-highest average
immigrant concentration of all groups, and tracts in group 8 have among the highest average
starting levels of homicide in 1980, but they have the lowest average starting level of immigrant
concentration of all groups. Finally, it is interesting to note that tracts in group 5 had moderate
average starting levels of homicide in 1980, but they have considerably low average levels of
disadvantage. Nearly all of these mean differences across groups are statistically significant (see
Appendix A).
[ Figure 5 about here ]
Figure 5 displays mean levels of change in each variable from 1980-2000 for each
trajectory group. This provides an initial indication of whether census tracts in trajectory groups
experiencing increases in homicide over the period also experienced increases in other
theoretically relevant characteristics. Recall from Figure 3 that trajectory groups 5, 6, and 7 are
characterized by declining homicide rates, though from different starting points. Figure 5 shows
that these three groups were also the only ones that experienced decreases in all of the structural
characteristics. Likewise, groups 2 and 4 exhibited sharp increases in homicide over the period,
and Figure 5 shows that these also experienced increases in all four of these structural
This document is a research report submitted to the U.S. Department of Justice. This report has not been published by the Department. Opinions or points of view expressed are those of the author(s)
and do not necessarily reflect the official position or policies of the U.S. Department of Justice.

35
characteristics.
Figure 5 also shows that the relationship between changes in structural characteristics and
changes in homicide is not always clear across trajectories. For example, tracts in groups 5, 6,
and 7 experienced average declines in both homicide and immigrant concentration, while group
8 also experienced a decline in immigrant concentration, but it had persistently high and slightly
increasing homicide rates. This suggests that declines in immigrant concentration are generally
associated with declines in the homicide rate, except in neighborhoods with persistently high
levels of homicide.
Predictors of Trajectory Group Assignment
The final stage of the group-based trajectory analysis involves the use of logistic
regression to identify characteristics of neighborhoods that are significantly associated with
membership in a given trajectory group over others while controlling for other characteristics.
One approach would be to include all eight trajectory groups in a single multinomial logistic
regression. However, the number and diversity of comparisons that this would produce would
yield a highly complex set of findings that would likely defy interpretation. Instead, the
following analysis will be conducted on subsets of the full set of trajectories, using sets of
trajectory groups that provide particularly interesting and substantive comparisons.
The first homicide trajectory groups to be analyzed are groups 1 and 2, with results of the
logistic regression reported in Table 2. Both of these trajectories start with very low levels of
homicide in 1980, but they change over time in different ways. Group 1, with persistently low
levels of homicide, serves as the reference group in contrast to group 2 which experienced an
This document is a research report submitted to the U.S. Department of Justice. This report has not been published by the Department. Opinions or points of view expressed are those of the author(s)
and do not necessarily reflect the official position or policies of the U.S. Department of Justice.
36
increase over this time period to moderate levels of homicide. Thus, the purpose of this model is
to address the question "among census tracts with low levels of homicide in 1980, what
characteristics are predictive of following an increasing trajectory versus a persistently low
trajectory?".
[ Table 2 about here ]
The results in Table 2 show that the only characteristics that significantly differentiate
between these two trajectory groupings are initial levels and changes in concentrated
disadvantage. Specifically, census tracts with higher initial levels of disadvantage, and
increasing levels over time, are more likely to be assigned to the trajectory group with increasing
levels of homicide. This is particularly interesting given that these two groups have very similar
initial levels of homicide, indicating that this effect is not simply capturing cross-sectional
differences in initial homicide levels. Based on the average levels of change shown in Figure 5,
we might have expected that increases in family disruption and immigrant concentration would
also be predictive of membership in group 2. The effects of these variables were positive in the
logistic regression model, but not quite statistically significant.
[ Table 3 about here ]
Table 3 presents the results from a multinomial logistic regression model that evaluates
the predictors of being assigned to trajectory group 4 or 5 compared with being assigned to group
3. These three groups all start at moderate levels of homicide in 1980, but group 5 declines over
time while group 3 remains at moderate levels and group 5 increases. The reference category for
these models is trajectory group 5, so the model is predicting assignment to a persistent or
increasing trajectory group as opposed to a declining trajectory group. Here again, we see that
This document is a research report submitted to the U.S. Department of Justice. This report has not been published by the Department. Opinions or points of view expressed are those of the author(s)
and do not necessarily reflect the official position or policies of the U.S. Department of Justice.
37
concentrated disadvantage is the only statistically significant predictor, and both initial levels and
change in concentrated disadvantage appear to be predictive of being in groups 3 or 4 compared
with group 5.
[ Table 4 about here ]
Table 4 provides the results from a multinomial logistic regression model comparing
groups 7 and 8 with group 6. All of these groups started with the highest average homicide
levels in 1980. Group 6 declined sharply over the period, while group 7 decline less markedly,
and group 8 remained persistently high. Once again, we see that concentrated disadvantage
significantly predicts group assignment, though the effect of change in disadvantage does not
significantly differentiate between assignment in group 7 versus group 6. Contrary to the
previous regressions, however, additional structural characteristics appear as significant
predictors in these models. The comparison of group 7 with group 6 shows that tracts with high
and increasing levels of family disruption and immigrant concentration are more likely to be
assigned to the group with less of a decline in homicide. Likewise, tracts with increasing levels
of family disruption are more likely to be assigned to the persistently high trajectory group
(group 8) as opposed to the sharply declining group (group 6).
HIERARCHICAL GROWTH-CURVE ANALYSIS
Group-based trajectory analysis has many advantages, and as seen above, it can be used
effectively to illustrate the nature of neighborhood crime trajectories over time, and to identify
potential predictors of particular trajectory groupings. However, as is the case with most
statistical methods, group-based trajectory analysis has its own set of shortcomings and
This document is a research report submitted to the U.S. Department of Justice. This report has not been published by the Department. Opinions or points of view expressed are those of the author(s)
and do not necessarily reflect the official position or policies of the U.S. Department of Justice.
38
detractors. Perhaps the most commonly voiced concern about GTM is that its emphasis on the
identification of discrete trajectory groups tends to reify groups that do not actually exist in a
concrete sense (Raudenbush 2005; Sampson and Laub 2005). Rather, the group trajectories are
statistical generalizations of the trends for the individual units within the group. Even the
original authors of the GTM method have warned of the risk of reification (Nagin and Tremblay
2005), explaining that the groups should be used only as approximations of trajectories, and that
the underlying distribution of individual trajectories may actually be continuous.
Hierarchical growth curve modeling (HGCM) provides an alternative and widely-used
method for modeling this heterogeneity among trajectories. Rather than assigning each unit to a
single trajectory group, HGCM models between-unit variation from the average trajectory by
estimating random coefficients for the intercept and the slope coefficients for the time variables.
Specifically, a multi-level model is estimated where the level-one model consists of the homicide
rate regressed on a cubic function of time, producing coefficients for the intercept, year, year
squared, and year-cubed. The level-two model essentially regresses these coefficients on a
vector of characteristics of tracts that are believed to predict variation in homicide trends across
census tracts. In the models presented below, both the linear and quadratic trend parameters are
allowed to vary randomly across tracts. The year variable is centered on 1980 – the first year in
the series – and all covariates are grand-mean centered. Thus, the model intercept indicates the
predicted homicide rate in 1980 for a census tract with average levels of all the predictor
variables. The independent variables used in these models include the same characteristics that
were used to predict trajectory group membership – concentrated disadvantage, social
disorganization, family disruption, and immigrant concentration. A control for spatial
This document is a research report submitted to the U.S. Department of Justice. This report has not been published by the Department. Opinions or points of view expressed are those of the author(s)
and do not necessarily reflect the official position or policies of the U.S. Department of Justice.

39
autocorrelation is also included in the form of a variable representing the average homicide rate
in surrounding census tracts based on queen contiguity.
Unconditional Model
The top panel of Table 5 provides results from an unconditional hierarchical growth-
curve model predicting the logged neighborhood homicide rate, with only year, year squared,
and year cubed as the predictors. Looking first at the fixed effects, the intercept indicates that
the average census tract had a logged homicide rate in 1980 of 2.567, which corresponds with an
unlogged homicide rate of 12.03 per 100,000. 2 The significant coefficients for all three trend
parameter estimates suggests a cubic functional form for the average homicide trajectory over
time, where the average homicide rate declines initially, then increases, and eventually declines
again. This follows the overall observed trends for the city of Chicago and the average Chicago
neighborhood shown earlier in Figure 1. The variance components for the intercept and the trend
parameters are all statistically significant, indicating that there is significant variation across
census tracts in homicide trajectories.
Conditional Model
The second panel of Table 5 provides the coefficient estimates from a conditional model
where the time-varying covariates are added to the model as predictor variables. Since the
covariates have all been grand-mean centered, the coefficients for the intercept and the year
2 Recall that a small constant (1) was added to each homicide rate in order to avoid undefined values when the
homicide rate is zero. Therefore, the predicted unlogged homicide rate is equal to the exponentiation of the predicted logged homicide rate minus one.
This document is a research report submitted to the U.S. Department of Justice. This report has not been published by the Department. Opinions or points of view expressed are those of the author(s)
and do not necessarily reflect the official position or policies of the U.S. Department of Justice.
40
variables describe the predicted trend for a census tract with average values for all the covariates.
The coefficients for each of the covariates indicate the effect of the given characteristic on
starting levels of homicide, and its effect on each of the trend parameters. For example, the
effect for concentrated disadvantage in the first column of coefficients shows the effect that
disadvantage has on the starting point for the homicide rate growth curve. The positive
coefficient (b=0.794) indicates that tracts with higher levels of disadvantage tend to have higher
starting homicide rates in 1980. The non-significant coefficients for concentrated disadvantage
in the subsequent columns indicate that disadvantage does not have a significant effect on any of
the trend parameter estimates. Family disruption also has a significant, positive effect on initial
levels of homicide (b = 0.354), and similar to concentrated disadvantage it does not affect the
trend in homicide over time.
In contrast, both social disorganization and immigrant concentration significantly
influence all three trend parameter estimates (e.g. year, year-squared, and year-cubed), though
the direction of the effects varies. First, higher levels of social disorganization are associated
with higher levels of homicide in 1980, as indicated by the significant positive effect of
disorganization on the intercept (b=0.354). Moreover, disorganization significantly influences
the trend over time in homicide rates. The declining linear trend that was evident in the main
effect for year (b=-0.055) is less steep and perhaps even positive in areas with increasing
disorganization (b=0.101). Likewise, the subsequent increase in homicide indicated by the main
effect of year-squared (b=0.007) is also weaker where social disorganization is higher (b=-
0.016). Finally, the tendency for homicide rates to decline again toward the end of the period as
evidenced in the effect of year-cubed (b=-0.0003) is less pronounced in more disorganized areas
This document is a research report submitted to the U.S. Department of Justice. This report has not been published by the Department. Opinions or points of view expressed are those of the author(s)
and do not necessarily reflect the official position or policies of the U.S. Department of Justice.
41
(b=0.0005), with the trend actually becoming positive at certain levels of disorganization. Thus,
it appears that areas with high levels of disorganization tend to have homicide rates that are
higher in 1980, and that exhibit less fluctuation over time.
Immigrant concentration also significantly influences all three trend parameter estimates,
but in a manner that differs from the effects just described for social disorganization. The
direction of the effects of immigrant concentration on year, year-squared, and year-cubed are
opposite of the effects for social disorganization, which suggests that areas with higher levels of
immigrant concentration tend to have homicide rates that change with greater volatility. That is,
the linear trend declines at a greater rate, the subsequent increase indicated by the quadratic
coefficient is heightened, and the eventual decline suggested by the cubic coefficient is also
accentuated.
Table 5 provides additional information about any remaining variability in homicide
trends. First, the quadratic and cubic trend estimates remain statistically significant even after
controlling for these four structural characteristics as well as homicide rates in surrounding
census tracts. This indicates that the overall temporal pattern indicated in the unconditional
model has not been fully explained by changes over time in these tract characteristics, though the
estimate for the linear trend is no longer significant. Second, the significance of the variance
components for the intercept and the linear and quadratic temporal trends indicates that
variability in homicide trends across census tracts persists even after controlling for these
characteristics.
Modeling Intervening Mechanisms
This document is a research report submitted to the U.S. Department of Justice. This report has not been published by the Department. Opinions or points of view expressed are those of the author(s)
and do not necessarily reflect the official position or policies of the U.S. Department of Justice.
42
The final stage of analysis involves the estimation of similar growth curve models
predicting homicide trends, but including intervening variables that may mediate the effects of
the structural characteristics of neighborhoods. As described earlier, this analysis will use
measures of neighborhood ties and perceived disorder from the 1994-1995 Community Survey
of the Project on Human Development in Chicago Neighborhoods. Since this source provides
only cross-sectional measures of neighborhood characteristics measured in the period 1994-
1995, this is seen as a preliminary attempt to identify intervening processes with the hope that
longitudinal measures will become available in the future. Since the measures are only available
in the mid 1990s, the following models are estimated for a shorter period of time – 1990 to 2000.
The first panel of Table 6 provides results of a hierarchical growth-curve model that is
similar to the model presented in Table 5, but that differs in several important ways. First, as
noted, this model is for the period 1990-2000. During this time period homicide initially
increases through the early 90s, and then declines steadily through 2000. Therefore, the model
presented in Table 6 includes only a linear and quadratic term for the year variable. Also,
because the PHDCN variables are measured for neighborhood clusters, this is a 3-level model
with years nested within census tracts, nested within neighborhood clusters. The first panel of
Table 6 provides coefficient estimates for a model that does not include the intervening
variables, and the second panel provides estimates from a model that does include these
characteristics.
The coefficients for the year variable in the first panel of Table 6 show a significant trend
in the homicide rate where homicide initially increased, on average, and then declined (b = 0.074
and -0.012). Despite the fact that this model only covers the period 1990-2000, we see effects of
This document is a research report submitted to the U.S. Department of Justice. This report has not been published by the Department. Opinions or points of view expressed are those of the author(s)
and do not necessarily reflect the official position or policies of the U.S. Department of Justice.

43
the structural characteristics that are very similar to the effects seen in Table 5 for the full period.
Specifically, concentrated disadvantage and family disruption only affect starting levels of
homicide, while social disorganization and immigrant concentration also influence the trend over
time. Also similar to the previous model, increasing disorganization is associated with a more
persistently high homicide level, while immigrant concentration tends to accentuate the overall
trend by enhancing the initial increase and subsequent decrease.
The results in the second panel of Table 6 show the effects from a model that includes the
intervening variables – neighborhood ties and perceived disorder. Several notable findings
emerge. First, the significant effects of neighborhood ties and disorder on the intercept indicate
that these two characteristics are associated with initial levels of homicide. Specifically, tracts
with more extensive neighborhood ties in 1994-95 tend to have a homicide trajectory over the
1990-2000 period that started at lower levels in 1990 (b = -0.662). Likewise, tracts with greater
perceived disorder tend to have trajectories that started at higher levels (b = 1.460). However,
neither of these characteristics is associated with the linear or quadratic trend. This is not
surprising given that the trend parameters reflect change over time, while neighborhood ties and
disorder have been measured at only a single point in time.
The primary motivation for including neighborhood ties and perceived disorder was to
evaluate whether these factors mediate the effect of the structural characteristics on homicide
trends. Again, since the intervening variables are measured cross-sectionally, any observed
mediation is most likely to occur for the effects of the structural characteristics on the intercept
rather than on the linear and quadratic trends. Indeed, the results in the second panel of Table 6
show that social disorganization and immigrant concentration continue to exhibit significant
This document is a research report submitted to the U.S. Department of Justice. This report has not been published by the Department. Opinions or points of view expressed are those of the author(s)
and do not necessarily reflect the official position or policies of the U.S. Department of Justice.
44
effects on year and year-squared, and they are largely unchanged from the model that did not
include the intervening variables. However, the effects of all of the structural characteristics on
the intercept change substantially after controlling for neighborhood ties and perceived disorder.
The effect of concentrated disadvantage declines the most (51%) from an effect of 0.991 to
0.489, and the effect of social disorganization declined nearly as much (48%). Both changes are
statistically significant. The effect of family disruption declines by about 18%, and the negative
effect of immigrant concentrations becomes even more negative, but neither of these differences
are statistically significant.
CONCLUSIONS
DISCUSSION OF FINDINGS
The first objective was to determine whether the overall homicide rate trend for Chicago
from 1980-2000 is representative of all neighborhoods, with most differences occurring only in
levels of homicide, or whether there is significant variation in homicide trends across
neighborhoods. The variance components from the unconditional growth curve model indicated
that there was, indeed, variability in homicide trends as expected. Moreover, satisfying the
second objective, results from the semi-parametric group-based trajectory analysis revealed eight
distinctive trajectories starting at low, moderate, and high levels of homicide in 1980, with some
of them remaining stable over time, some increasing, and some declining. These results clearly
show that homicide trends vary considerably across neighborhoods over this time period. This is
an important finding given that so much attention has been paid to the crime decline observed in
the United States over the past two decades, and the relative uniformity in crime trends in US
This document is a research report submitted to the U.S. Department of Justice. This report has not been published by the Department. Opinions or points of view expressed are those of the author(s)
and do not necessarily reflect the official position or policies of the U.S. Department of Justice.
45
cities over this period, with variations mostly in the timing and amplitude of their trajectories.
Far less attention has been directed at variability in crime trends across subareas within cities.
The results from the first and second objectives of this study indicate that this is an important
oversight, and that the variability in homicide trends across neighborhoods merits further
analysis.
The third objective went beyond this descriptive analysis by evaluating whether the
observed variation in homicide trends across neighborhoods is associated with theoretically
relevant variables. The expectation was that initial levels of homicide in 1980, as well as the
nature and rate of change over time, would be influenced by neighborhood levels of concentrated
disadvantage, social disorganization, family disruption, and immigrant concentration. This was
first tested by regressing trajectory group assignments on these neighborhood characteristics
using binary and multinomial logistic regression. The most consistent predictor of trajectory
group assignment was concentrated disadvantage. The initial level of disadvantage in 1980, as
well as increases in disadvantage from 1980-2000, were predictive of being assigned to homicide
trajectory groups with higher starting levels and with trajectories that increased over time. In
fact, concentrated disadvantage was the only distinguishing characteristic between trajectory
groups with low or moderate starting levels of homicide.
When distinguishing among trajectory groups with high starting levels of homicide,
family disruption and immigrant concentration appeared as significant predictors in addition to
concentrated disadvantage. Specifically, neighborhoods with declining family disruption were
more likely to be assigned to the sharply declining trajectory group versus the persistently high
trajectory, and neighborhoods with higher initial levels of immigrant concentration were more
This document is a research report submitted to the U.S. Department of Justice. This report has not been published by the Department. Opinions or points of view expressed are those of the author(s)
and do not necessarily reflect the official position or policies of the U.S. Department of Justice.
46
likely to be assigned to the moderately declining versus the persistently high trajectory group.
Overall, these findings show that higher and increasing levels of concentrated
disadvantage are predictive of being in trajectory groups with higher and increasing homicide
rates regardless of whether initial rates of homicide are low, moderate, or high in 1980. Whereas
social disorganization is not predictive of homicide trajectory group assignment in any of the
group comparisons, family disruption and immigrant concentration provide additional
explanatory strength, but only for neighborhoods with very high initial levels of homicide.
An alternative approach to identifying characteristics associated with neighborhood
homicide trends involved the use of hierarchical growth-curve modeling for the same time
period. Similar to the trajectory analysis, these results showed that concentrated disadvantage
was predictive of starting points of homicide in 1980, yet it did not appear as a significant
predictor of change over time. This was also true for family disruption. On the other hand,
social disorganization and immigrant concentration were predictive of both initial levels of
homicide and variability in change over time. These findings again underscore the point that
certain structural characteristics of neighborhoods are predictive of neighborhood homicide
trends.
The final objective was to test whether the observed effects of characteristics such as
disadvantage and immigrant concentration on homicide trends are mediated by intervening
mechanisms such as neighborhood social ties and disorder. This analysis used a truncated time
series from 1990-2000 and cross-sectional measures of social ties and disorder from the Project
on Human Development in Chicago Neighborhoods. Results showed that the effects of
concentrated disadvantage and social disorganization on initial levels of homicide were
This document is a research report submitted to the U.S. Department of Justice. This report has not been published by the Department. Opinions or points of view expressed are those of the author(s)
and do not necessarily reflect the official position or policies of the U.S. Department of Justice.
47
significantly and substantially reduced after controlling for social ties and disorder.
IMPLICATIONS FOR POLICY AND PRACTICE
Despite the fact that the majority of research on communities and crime has been cross-
sectional, the theoretical and empirical literature clearly emphasizes the importance of change
over time in neighborhood structure and social processes for understanding change over time in
rates of crime. As researchers continue to gather longitudinal data at the neighborhood level, and
as the statistical methods for analyzing change continue to advance, it is important to consider
whether we must revise or reorient our theoretical approach to the study of variation in crime
trends across local areas. A large body of empirical literature has developed regarding the
predictors of homicide across communities, and that research has shown a large degree of
consistency in the relevance of particular structural characteristics across different time periods
and across different levels of aggregation (Land et al., 1990; McCall, Land, and Parker, 2010).
Thus, the expectations are fairly clear regarding between-neighborhood variation in crime rates,
and from these it is easy to extrapolate expectations about within-community change over time.
The current analysis of between-neighborhood variability in within-unit homicide trends may
appear, at first glance, to be simply a combination of the traditional cross-sectional and
longitudinal approaches seen in prior work. However, the preceding analysis and discussion
suggests that current theoretical frameworks may not be sufficiently developed to offer clear
expectations with regard to the between-unit variability in neighborhood trajectories of homicide.
This line of research could yield important policy recommendations. If we can
consistently identify characteristics associated with certain crime trajectories, and assuming these
This document is a research report submitted to the U.S. Department of Justice. This report has not been published by the Department. Opinions or points of view expressed are those of the author(s)
and do not necessarily reflect the official position or policies of the U.S. Department of Justice.
48
characteristics are responsive to social policies and programs, policy makers could apply
interventions that are specifically targeted at neighborhoods at a particular stage of development.
For example, the finding from the trajectory analysis that changes in concentrated disadvantage
are associated with homicide trends for neighborhoods at low, moderate, or high levels of
homicide suggests that neighborhood-based policies aimed at reducing poverty and
unemployment, or improving high school and college graduation rates, will yield reductions in
homicide regardless of the neighborhood's current level of homicide.
These findings are encouraging in light of prior research showing that even
disadvantaged communities can effectively mobilize in response to common needs and goals
((Perkins, et al. 1990; Swaroop and Morenoff 2006). For example, Swaroop and Morenoff
(2006) found that there was little association between neighborhood disadvantage and
community participation, though the results varied somewhat depending on whether the
motivation for participation was expressive or instrumental. While expressive participation is
motivated by a sense of identity and includes actions designed to promote a sense of community
among residents, instrumental participation is motivated by a desire to protect community
interests and solve specific community problems. Their analysis of a survey of individuals in
Chicago neighborhoods found that residents of disadvantage communities are actually more
likely to engage in expressive community participation than those in affluent communities. They
found a similar effect for instrumental participation, but only to a point. After a certain level of
community disadvantage is reached, further increases in disadvantage yield declines in
instrumental participation. This finding underscores one of the conclusions drawn in the current
study – that approaches to crime reduction must be custom-tailored to the developing
This document is a research report submitted to the U.S. Department of Justice. This report has not been published by the Department. Opinions or points of view expressed are those of the author(s)
and do not necessarily reflect the official position or policies of the U.S. Department of Justice.

49
characteristics of the community.
Of course, it is difficult for localities to develop policies and programs for reducing
neighborhood characteristics such as poverty and unemployment. However, the analysis of
intervening processes identified two characteristics that appear to mediate some of the effect of
characteristics such as disadvantage and social disorganization on homicide rates. This suggests
that policies aimed at increasing levels of interaction among neighborhood residents, or that
reduce perceived levels of physical and social disorder, may be effective at reducing homicide
levels even where disadvantage and disorganization persist. For example, efforts such as
cleaning and repairing streets, removing graffiti, and eradicating drug sales and prostitution may
reduce residents' perceptions of physical and social disorder, which may in turn lead to
reductions in homicide. Indeed, prior research has found that improvements to the physical
environment of the community are associated with increased cohesion and neighborhood
participation (Markowitz, et al 2001; Perkins, et al. 1990; Skogan 1990), though the causal
relationship between physical disorder and crime has been debated (Sampson and Raudenbush,
1999; Taylor 1996). Research also suggests that these increased levels of social interaction may
lead to reduced crime through increases in collective efficacy and informal social control (Bellair
1997; Morenoff, Sampson, and Raudenbush 2001; Sampson, Raudenbush and Earls 1997).
These results point to clear policy recommendations such as funding block parties and
festivals, forming a neighborhood watch, or organizing neighborhood cleanups, and results from
existing programs suggest that these efforts can be successful. For example, the Kansas City
Building Blocks program was an effort to generate neighborhood commitment and help develop
and maintain relationships among residents (Ohmer and Beck 2006). Community organizers
This document is a research report submitted to the U.S. Department of Justice. This report has not been published by the Department. Opinions or points of view expressed are those of the author(s)
and do not necessarily reflect the official position or policies of the U.S. Department of Justice.

50
were hired to work with residents to develop a “collaborative plan for their block, and
developing projects to make that vision a reality, including forming crime watch groups, shutting
down crack houses, developing community gardens, and rehabilitating dilapidated housing”
(Ohmer and Beck 2006:195-196). Likewise, several studies have found that community
gardening programs lead to increased social ties and collective efficacy among not just the
program participants, but also among the broader community (Alaimo, Reischl, and Allen 2010;
Teig, et al. 2009).
Another important finding from a policy perspective is that certain neighborhood
characteristics are associated with high, persistent levels of homicide, even while other
neighborhoods and the city as a whole are experiencing rapid declines in homicide. Specifically,
social disorganization was found to yield high initial levels of homicide, and areas with high
levels of disorganization tend to have homicide trends that do not fluctuate over time. Again, it
is difficult for localities to design and implement policies that reduce concentrations of renter-
occupied housing or prevent residential mobility. However, the mediation analysis suggests that
policies targeting intervening mechanisms such as neighborhood ties and disorder may reduce
levels of homicide even in areas with persisting social disorganization.
DIRECTIONS FOR FUTURE RESEARCH
The analysis presented in this article expands on prior research in important ways, but
several limitations and suggestions for future research should be discussed. First, most of the
analysis relied on census data for measuring the theoretically relevant independent variables.
Though the final models incorporated survey-based measures of neighborhood ties and perceived
This document is a research report submitted to the U.S. Department of Justice. This report has not been published by the Department. Opinions or points of view expressed are those of the author(s)
and do not necessarily reflect the official position or policies of the U.S. Department of Justice.

51
disorder, these were measured at only a single point in time. Because of this, it is not surprising
that these characteristics only appeared to mediate the influence of structural characteristics on
initial levels of homicide, and not on trends over time. It is possible that if we were to measure
these social process and perception variables over time, we would find that they also mediate the
effects of disadvantage and disorganization on homicide trends. Thus an important avenue for
future funding and research is to generate longitudinal neighborhood-level measures of
characteristics such as social ties, disorder, and informal social control.
Another shortcoming of the current analysis is the method used to account for spatial
autocorrelation. Though including a control for average levels of homicide in surrounding
neighborhoods provides a better guard against biased results than failing to account for spatial
dependence altogether, it is still not an ideal approach, and the resulting regression coefficients
may still have some bias and inefficiency. Methods for incorporating spatial analysis into
longitudinal models continue to advance, but applying these methods to a multilevel growth-
curve model are not currently fully developed. As these methods continue to mature, researchers
should replicate prior studies in a way that fully accounts for spatial dependence in order to
provide a more robust assessment of previous findings.
Rather than settle on a single method for evaluating homicide trajectories, the current
study took a comprehensive approach that applied both semi-parametric group-based trajectory
modeling and hierarchical growth curve analysis. This two-pronged approach yielded some
consistent findings across methods, but there were also some inconsistencies. For example,
though concentrated disadvantage was a significant predictor of initial levels of homicide under
both analytic methods, it was not predictive of change over time in the growth-curve models.
This document is a research report submitted to the U.S. Department of Justice. This report has not been published by the Department. Opinions or points of view expressed are those of the author(s)
and do not necessarily reflect the official position or policies of the U.S. Department of Justice.
52
One criticism of using growth-curve modeling to evaluate crime trends is that it may not have the
flexibility necessary to account for growth patterns that deviate considerably from the overall
average neighborhood trend (Raudenbush 2001). Therefore, any differences across the modeling
strategies may be due to the different assumptions that they each make about the underlying
distribution of trajectories.
However, another possible explanation of these different findings is that the regression
models uses to explain group membership under the group-based trajectory method were
estimated as logistic regression models contrasting groups that started at a specific level of
homicide, while the hierarchical growth curve models were estimated for all neighborhoods in a
pooled model. A primary reason for the modeling strategy used for predicting trajectory group
membership was that it allowed for an evaluation of whether the predictors of homicide trends
varied depending on the starting point of homicide. This is valuable from a policy perspective
because it has the potential to identify characteristics of neighborhoods that predict diverging
trends among neighborhoods that were originally at the same level. That is, they address the
question "If two neighborhoods had similar levels of homicide in 1980, what characteristics are
predictive of a decline over time versus persistent levels?" One possible avenue for future
research would be to estimate hierarchical growth curve models that attempt to address the same
question. For example, hierarchical models could be estimated that include, for each
neighborhood, a measure of its starting point of homicide, and that model this as a cross-level
interaction with the covariates at level-one. By generating cross-level interactions with a
variable such as concentrated disadvantage, it would be possible to determine whether the effect
of changing levels of disadvantage on homicide was conditional upon starting levels of
This document is a research report submitted to the U.S. Department of Justice. This report has not been published by the Department. Opinions or points of view expressed are those of the author(s)
and do not necessarily reflect the official position or policies of the U.S. Department of Justice.
53
homicide.
Future research should also investigate alternative methods for evaluating change over
time in the predictor variables when utilizing the group-based trajectory method. The trajectory
analysis in the current study took advantage of a data source with more than 20 time points, but
changes in the independent variables in the GTM analysis were measured simply as the change
from 1980 to 2000. It is possible that this crude measure of change fails to capture additional
temporal variability that occurred between those two time points. This may also explain some of
the differences between the GTM and HGCM results. One possible approach is to also use GTM
to identify trajectories in the predictor variables. These trajectories can then be cross-classified
with the homicide trajectories groups, or a dual-trajectory analysis could be conducted (Nagin,
2005). Though these models can be highly complex and often fail to converge, this and other
strategies should be pursued to better understand how neighborhood dynamics influence
homicide trajectories.
This document is a research report submitted to the U.S. Department of Justice. This report has not been published by the Department. Opinions or points of view expressed are those of the author(s)
and do not necessarily reflect the official position or policies of the U.S. Department of Justice.
54
REFERENCES
Alaimo, Katherine, Thomas M. Reischl, and Julie Ober Allen. 2010. "Community Gardening,
Neighborhood Meetings, and Social Capital." Journal of Community Psychology 38:497-
514.
Alba, Richard D., John R. Logan, and Brian J. Stults. 2000. "How Segregated are Middle-Class
African Americans?" Social Problems 47:543–558.
Alba, Richard D., John R. Logan, and Paul E. Bellair. 1994. "Living With Crime: The
Implications of Racial/Ethnic Differences in Suburban Location." Social Forces,
73:395–434.
Bellair, Paul E. 1997. “Social Interaction and Community Crime: Examining the Importance of
Neighborhood Networks.” Criminology 35:677-704.
Block, Carolyn Rebecca, Richard L. Block, and Illinois Criminal Justice Information Authority.
2005. "Homicides in Chicago, 1965-1995." Ann Arbor, MI: Inter-university Consortium
for Political and Social Research.
Bordua, David J. 1958. “Juvenile Delinquency and “anomie”: An Attempt at Replication.”
Social Problems 6:230-238.
Browning, Christopher R. 2002. “The Span of Collective Efficacy: Extending Social
Disorganization Theory to Partner Violence .” Journal of Marriage and Family 64:833-
850.
Bursik, Robert J., Jr. 1984. “Urban Dynamics and Ecological Studies of Delinquency.” Social
This document is a research report submitted to the U.S. Department of Justice. This report has not been published by the Department. Opinions or points of view expressed are those of the author(s)
and do not necessarily reflect the official position or policies of the U.S. Department of Justice.
55
Forces 63:393-413.
_____. 1986. “Ecological Stability and the Dynamics of Delinquency.” In Albert J. Reiss, Jr.,
and Michael Tonry (eds.), Communities and Crime. Chicago: University of Chicago
Press.
_____. 1988. “Social Disorganization and Theories of Crime and Delinquency: Problems and
Prospects.” Criminology 26:519-551.
Bursik, Robert J., Jr., and Harold G. Grasmick. 1992. “Longitudinal Neighborhood Profiles in
Delinquency: The Decomposition of Change.” Journal of Quantitative Criminology
8:247-263.
Bursik, Robert J., Jr., and Harold G. Grasmick. 1993. Neighborhoods and Crime: The
Dimensions of Effective Community Control. New York: Lexington Books.
Bursik, Robert J., Jr., and J. Webb. 1982. “Community Change and Patterns of Delinquency.”
American Journal of Sociology 88:24-43.
Chavez, Jorge M., and Elizabeth Griffiths. 2009. "Neighborhood Dynamics of Urban Violence:
Understanding the Immigration Connection." Homicide Studies 13:261-273.
Chilton, Roland J. 1964. “Continuity in Delinquency Area Research: A Comparison of Studies
for Baltimore, Detroit, and Indianapolis.” American Sociological Review 29:71-83.
Chilton, Roland J., and John P. J. Dussich. 1974. “Methodological Issues in Delinquency
Research: Some Alternative Analyses of Geographically Distributed Data.” Social
Forces 53:73-82.
This document is a research report submitted to the U.S. Department of Justice. This report has not been published by the Department. Opinions or points of view expressed are those of the author(s)
and do not necessarily reflect the official position or policies of the U.S. Department of Justice.
56
Cohen, Lawrence E., and Marcus Felson. 1979. "Social Change and Crime Rate Trends: A
Routine Activity Approach." American Sociological Review 44:588-608.
Fagan, Jeffrey A. 2008. "Crime and Neighborhood Change." In Understanding Crime Trends.
Edited by Arthur S. Goldberger and Richard Rosenfeld, 81-126. Washington, DC:
National Academies Press.
Fagan, Jeffrey A., and Garth Davies. 2004. "The Natural History of Neighborhood Violence."
Journal of Contemporary Criminal Justice 20:127-147.
Gordon, Robert A. 1967. “Issues in the Ecological Study of Delinquency.” American
Sociological Review 32:927-944.
Griffiths, Elizabeth., and Jorge M. Chavez. 2004. "Communities, Street Guns and Homicide
Trajectories in Chicago, 1980-1995: Merging Methods for Examining Homicide Trends
Across Space and Time." Criminology 42:941-978.
Hagan, John., and Alberto Palloni. 1999. "Sociological Criminology and the Mythology of
Hispanic Immigration and Crime." Social Problems 46:617-632.
Heitgard, Janet L., and Robert J. Bursik, Jr. 1987. “Extra-community Dynamics and the
Ecology of Delinquency.” American Journal of Sociology 92:775-787.
Jones, Bobby L., Daniel S. Nagin, and Kathryn Roeder. 2001. "A SAS Procedure Based on
Mixture Models for Estimating Developmental Trajectories." Sociological Methods and
Research, 29: 374-393
Kasarda, John D., and Morris Janowitz. 1974. “Community Attachment in Mass Society.”
This document is a research report submitted to the U.S. Department of Justice. This report has not been published by the Department. Opinions or points of view expressed are those of the author(s)
and do not necessarily reflect the official position or policies of the U.S. Department of Justice.
57
American Sociological Review 39:328-339.
Kornhauser, Ruth R. 1978. Social Sources of Delinquency: An Appraisal of Analytic Models.
Chicago, IL: University of Chicago Press.
Kubrin, Charis E., and Jerald R. Herting. 2003. “Neighborhood Correlates of Homicide Trends:
An Analysis Using Growth-Curve Modeling.” The Sociological Quarterly 44:329-350.
Land, Kenneth C., Patricia L. McCall, Lawrence E. Cohen. 1990. "Structural Covariates of
Homicide Rates: Are There Any Invariances Across Time and Social Space?" The
American Journal of Sociology 95:922-963.
Lander, Bernard. 1954. Towards an Understanding of Juvenile Delinquency. New York:
Columbia University Press.
Laub, John H., and Robert J. Sampson. 2003. Shared Beginnings, Divergent Lives: Delinquent
Boys to Age 70. Cambridge, MA: Harvard University Press.
Lee, Matthew T., Ramiro Martinez, and Richard Rosenfeld. 2001. "Does Immigration Increase
Homicide? Negative Evidence from Three Border Cities." The Sociological Quarterly,
42:559-580.
Logan, John R., Brian J. Stults, and Reynolds Farley. 2004. “Segregation of Minorities in the
Metropolis: Two Decades of Change.” Demography 41:1-22.
Markowitz, Fred. E., Paul E. Bellair, Allen E. Liska, and Jianhong Lui. 2001. "Extending Social
Disorganization Theory: Modeling the Relationships Between Cohesion, Disorder, and
Fear." Criminology 39: 293-320.
This document is a research report submitted to the U.S. Department of Justice. This report has not been published by the Department. Opinions or points of view expressed are those of the author(s)
and do not necessarily reflect the official position or policies of the U.S. Department of Justice.
58
Massey, Douglas, and Nancy Denton. 1998. American Apartheid: Segregation and the Making
of the Underclass. Boston: Harvard University Press.
McCall, Patricia. L, Kenneth C. Land, and Karen F. Parker. 2010. "An empirical assessment of
what we know about structural covariates of homicide rates: a return to a classic 20 years
later." Homicide Studies, 14:219-243.
Mears, Daniel P. 2001. "The Immigration-Crime Nexus: Toward an Analytic Framework for
Assessing and Guiding Theory, Research, and Policy." Sociological Perspectives 44:1-
19.
Moffitt, Terrie E. 1993. "Adolescence-Limited and Life-Course-Persistent Antisocial Behavior:
A Developmental Taxonomy." Psychological Review 100:674-701.
Morenoff, Jeffrey D., Robert J. Sampson, and Stephen W. Raudenbush. 2001. “Neighborhood
Inequality, Collective Efficacy, and the Spatial Dynamics of Urban Violence.”
Criminology 39:517-559.
Nagin, Daniel S. 2005. Group-Based Modeling of Development. Cambridge, Mass.: Harvard
University Press.
Nagin, Daniel S., and Kenneth C. Land. 1993. “Age, Criminal Careers, and Population
Heterogeneity: Specification and Estimation of a Nonparametric, Mixed Poisson Model.”
Criminology 31:327-362.
Nagin, Daniel S. and Richard E. Tremblay. 2005. "Developmental Trajectory Groups: Fact or a
Useful Statistical Fiction?." Criminology 43:873-904
This document is a research report submitted to the U.S. Department of Justice. This report has not been published by the Department. Opinions or points of view expressed are those of the author(s)
and do not necessarily reflect the official position or policies of the U.S. Department of Justice.
59
Ohmer, Mary, and Elizabeth Beck. 2006. "Citizen Participation in Neighborhood Organizations
in Poor Communities and its Relationship to Neighborhood and Organizational
Collective Efficacy." Journal of Sociology and Social Welfare 33:179-202.
Patterson, E. Britt. 1991. “Poverty, Income Inequality, and Community Crime Rates.”
Criminology 29:755-776.
Perkins, Douglas D., Paul Florin, Richard C. Rich, Abraham Wandersman, and David M.
Chavis. 1990. "Participation and the Social and Physical Environment of Residential
Blocks: Crime and Community Context." American Journal of Community Psychology
18: 83-115.
Phillips, Julie A., and David F. Greenberg. 2008. "A Comparison of Methods for Analyzing
Criminological Panel Data." Journal of Quantitative Criminology 24:51-72.
Pierce, Glenn, S. Spaar, and L. R. Briggs . 1986. The Character of Police Work: Strategic and
Tactical Operations. Boston, MA: Center for Applied Social Research, Northeastern
University.
Piquero, Alex R., David P. Farrington, and Alfred Blumstein. 2003. "The Criminal Career
Paradigm." Crime and Justice 30:359-506.
Raudenbush, Stephen W. 2005. "How Do We Study What Happens Next?" Annals of the
American Academy of Political and Social Science 602:131-144.
Rosen, Lawrence, and Stanley H. Turner. 1967. “An Evaluation of the Lander Approach to
Ecology of Delinquency.” Social Problems 15:189-200.
This document is a research report submitted to the U.S. Department of Justice. This report has not been published by the Department. Opinions or points of view expressed are those of the author(s)
and do not necessarily reflect the official position or policies of the U.S. Department of Justice.

60
Rosenfeld, Richard, Robert Fornango, and Andres F. Rengifo. 2007. “The Impact of Order
Maintenance Policing on New York City Homicide and Robbery Rates: 1988-2001.”
Criminology 45:355-384.
Rosenfeld, Richard, Steven F. Messner, and Eric P. Baumer. 2001. “Social Capital and
Homicide.” Social Forces 80:283-309.
Sampson, Robert J. 1986. "Crime in Cities: The Effects of Formal and Informal Social
Control." Crime and Justice 8:271-311.
Sampson, Robert J. 1987. "Urban Black Violence: The Effect of Male Joblessness and Family
Disruption." American Journal of Sociology 93:348-382.
Sampson, Robert J., and W. Byron Groves. 1989. “Community Structure and Crime: Testing
Social Disorganization Theory.” American Journal of Sociology 94:774-802.
Sampson, Robert J., and John H. Laub. 2005. "A Life-Course View of the Development of
Crime." The Annals of the American Academy of Political and Social Science 602:12-45.
Sampson, Robert J. , and Stephen W. Raudenbush. 1999. "Systematic Social Observation of
Public Spaces: A New Look at Disorder in Urban Neighborhoods." American Journal of
Sociology 105:603-651.
Sampson, Robert J., Stephen W. Raudenbush, and Felton Earls. 1997. “Neighborhoods and
Violent Crime: A Multilevel Study of Collective Efficacy.” Science 277:918-924.
Schuerman, Leo, and Solomon Kobrin. 1986. “Community Careers in Crime.” In Albert J.
Reiss, Jr., and Michael Tonry (eds.), Communities and Crime. Chicago: University of
This document is a research report submitted to the U.S. Department of Justice. This report has not been published by the Department. Opinions or points of view expressed are those of the author(s)
and do not necessarily reflect the official position or policies of the U.S. Department of Justice.
61
Chicago Press.
Shaw, Clifford R., and Henry D. McKay. 1942. Juvenile Delinquency and Urban Areas.
Chicago: University of Chicago Press.
Simcha-Fagan, Ora, and Joseph Schwartz. 1986. “Neighborhood and Delinquency: An
Assessment of Contextual Effects.” Criminology 24:667-704.
Skogan, Wesley G. 1990. Disorder and Decline. New York: Free Press.
Smith, Douglas, and Roger Jarjoura. 1988. “Social Structure and Criminal Victimization.”
Journal of Research in Crime and Delinquency 25:27-52.
Taylor, Ralph B. 1996. "Neighborhood responses to disorder and local attachments: The
systemic model of attachment, social disorganization, and neighborhood use value."
Sociological Forum 11:41-74.
Taylor, Ralph B., and Jeanette Covington. 1988. “Neighborhood Changes in Ecology and
Violence.” Criminology 26:553-590.
Teig, Ellen, Joy Amulya, Lisa Bardwell, Michael Buchenau, Julie A. Marshall, Jill S. Litt. 2009.
"Collective efficacy in Denver, Colorado: Strengthening neighborhoods and health
through community gardens." Health & Place 15:1115-1122.
Weisburd, David S., Shawn Bushway, Cynthia Lum, and Sue-Ming Yang. 2004. “Trajectories
of Crime at Places: A Longitudinal Study of Street Segments in the City of Seattle.”
Criminology 42:283-321.
This document is a research report submitted to the U.S. Department of Justice. This report has not been published by the Department. Opinions or points of view expressed are those of the author(s)
and do not necessarily reflect the official position or policies of the U.S. Department of Justice.

62
Wilson, William J. 1990. The Truly Disadvantaged: The Inner City, the Underclass, and Public
Policy. Chicago, IL: University of Chicago Press.
Wirth, Louis. 1938. "Urbanism as a Way of Life." American Journal of Sociology 44:1-24.
This document is a research report submitted to the U.S. Department of Justice. This report has not been published by the Department. Opinions or points of view expressed are those of the author(s)
and do not necessarily reflect the official position or policies of the U.S. Department of Justice.
63
DISSEMINATION OF RESEARCH FINDINGS
CONFERENCE PRESENTATIONS
Stults, Brian J. 2009. Determinants of Chicago Neighborhood Homicide Trends:1965-1995",
10th Crime Mapping Research Conference, New Orleans, LA.
Stults, Brian J. 2009. Hierarchical Growth-Curve Analysis of Chicago Neighborhood Homicide
Trends: 1965-1995", Annual Meeting of the American Society of Criminology,
Philadelphia, PA.
Stults, Brian J. 2008. Determinants of Chicago Neighborhood Homicide Trends:1965-1995",
Annual Meeting of the American Society of Criminology, St. Louis, MO.
PEER-REVIEWED JOURNAL ARTICLES
Stults, Brian J. 2009. "Determinants of Chicago Neighborhood Homicide Trends:1965-1995."
Homicide Studies 14:244-267.
This document is a research report submitted to the U.S. Department of Justice. This report has not been published by the Department. Opinions or points of view expressed are those of the author(s)
and do not necessarily reflect the official position or policies of the U.S. Department of Justice.

64
FIGURES
This document is a research report submitted to the U.S. Department of Justice. This report has not been published by the Department. Opinions or points of view expressed are those of the author(s)
and do not necessarily reflect the official position or policies of the U.S. Department of Justice.
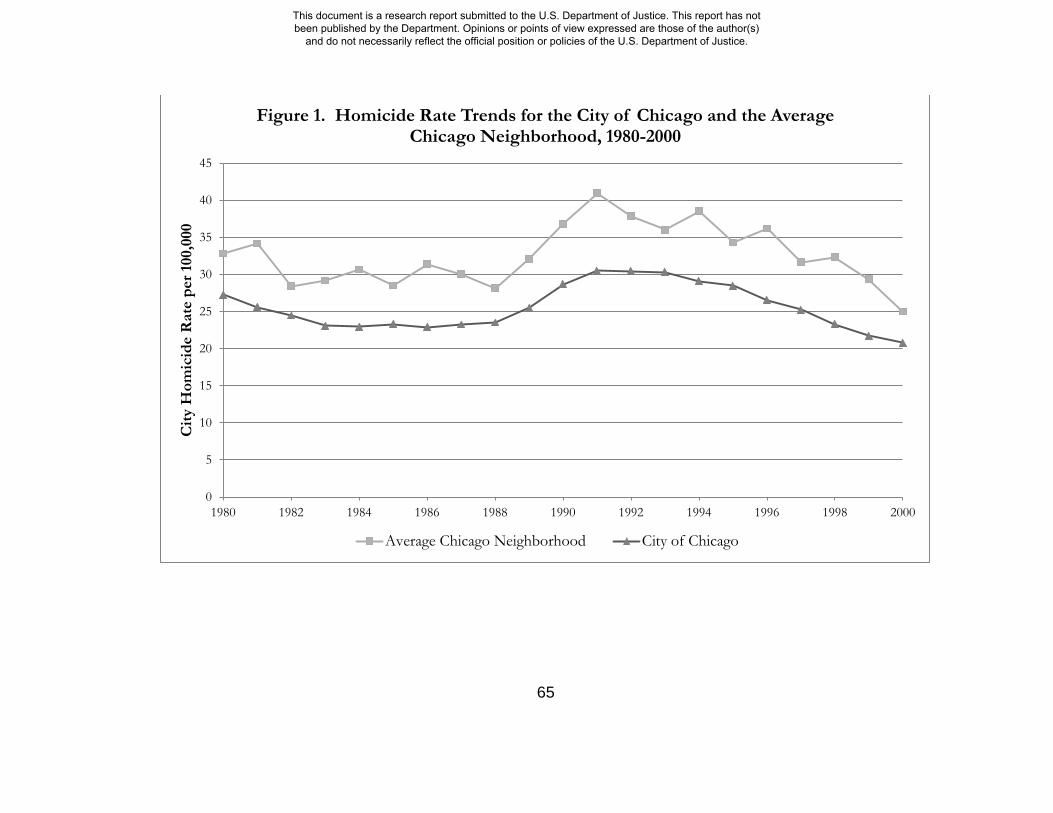
65
0
5
10
15
20
25
30
35
40
45
1980 1982 1984 1986 1988 1990 1992 1994 1996 1998 2000
City
Hom
icid
e R
ate
per 1
00,0
00
Figure 1. Homicide Rate Trends for the City of Chicago and the Average Chicago Neighborhood, 1980-2000
Average Chicago Neighborhood City of Chicago
This document is a research report submitted to the U.S. Department of Justice. This report has not been published by the Department. Opinions or points of view expressed are those of the author(s)
and do not necessarily reflect the official position or policies of the U.S. Department of Justice.
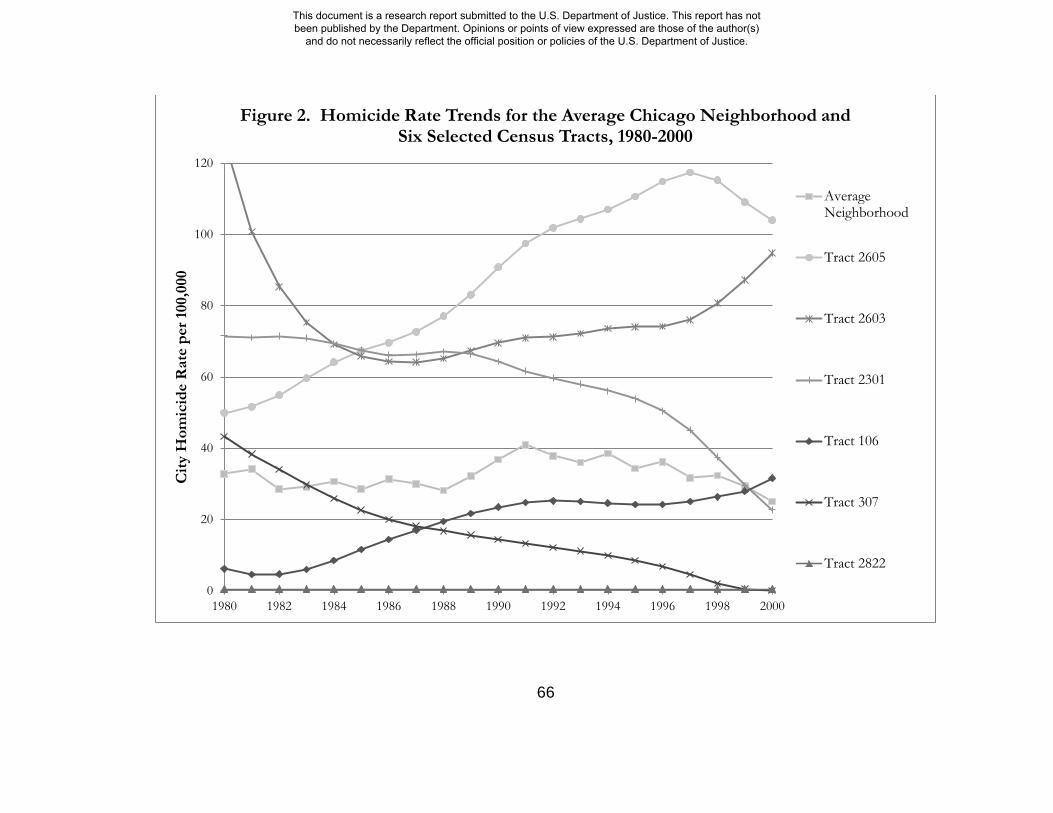
66
0
20
40
60
80
100
120
1980 1982 1984 1986 1988 1990 1992 1994 1996 1998 2000
City
Hom
icid
e R
ate
per 1
00,0
00
Figure 2. Homicide Rate Trends for the Average Chicago Neighborhood and Six Selected Census Tracts, 1980-2000
AverageNeighborhood
Tract 2605
Tract 2603
Tract 2301
Tract 106
Tract 307
Tract 2822
This document is a research report submitted to the U.S. Department of Justice. This report has not been published by the Department. Opinions or points of view expressed are those of the author(s)
and do not necessarily reflect the official position or policies of the U.S. Department of Justice.
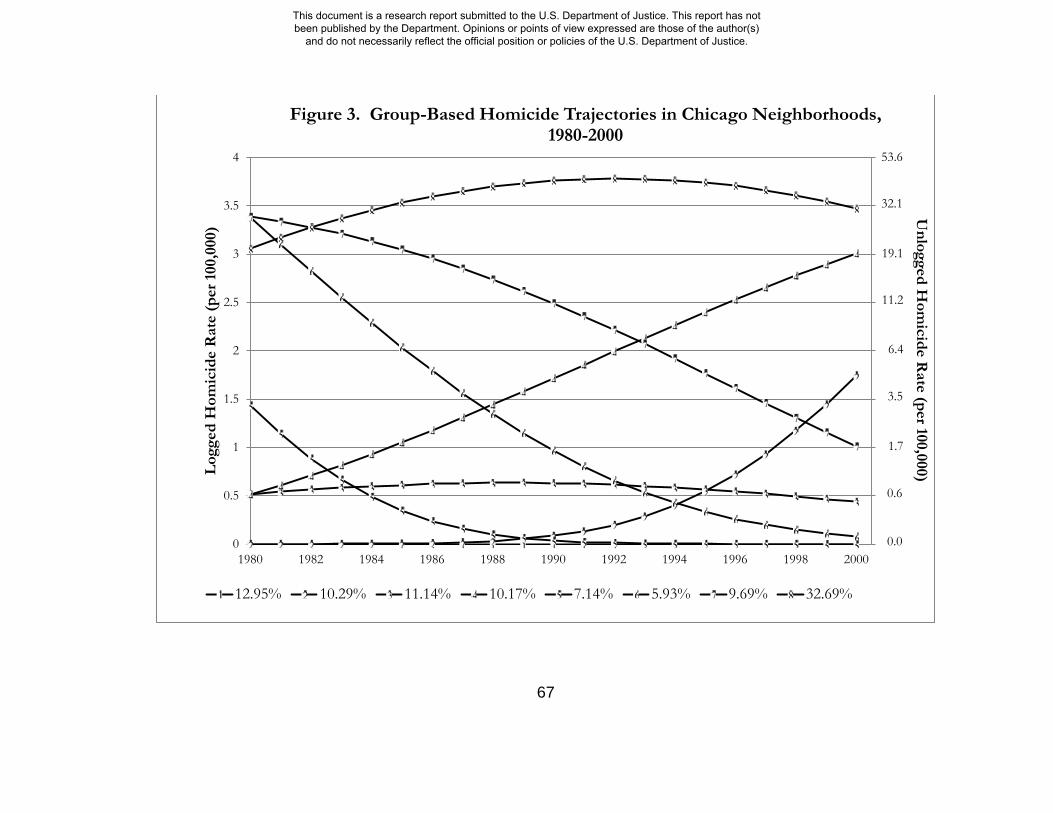
67
0
0.5
1
1.5
2
2.5
3
3.5
4
1980 1982 1984 1986 1988 1990 1992 1994 1996 1998 2000
Unlogged H
omicide R
ate (per 100,000) Log
ged
Hom
icid
e R
ate
(per
100
,000
)
Figure 3. Group-Based Homicide Trajectories in Chicago Neighborhoods, 1980-2000
12.95% 10.29% 11.14% 10.17% 7.14% 5.93% 9.69% 32.69%
53.6
32.1
19.1
11.2
6.4
3.5
1.7
0.6
0.0
This document is a research report submitted to the U.S. Department of Justice. This report has not been published by the Department. Opinions or points of view expressed are those of the author(s)
and do not necessarily reflect the official position or policies of the U.S. Department of Justice.
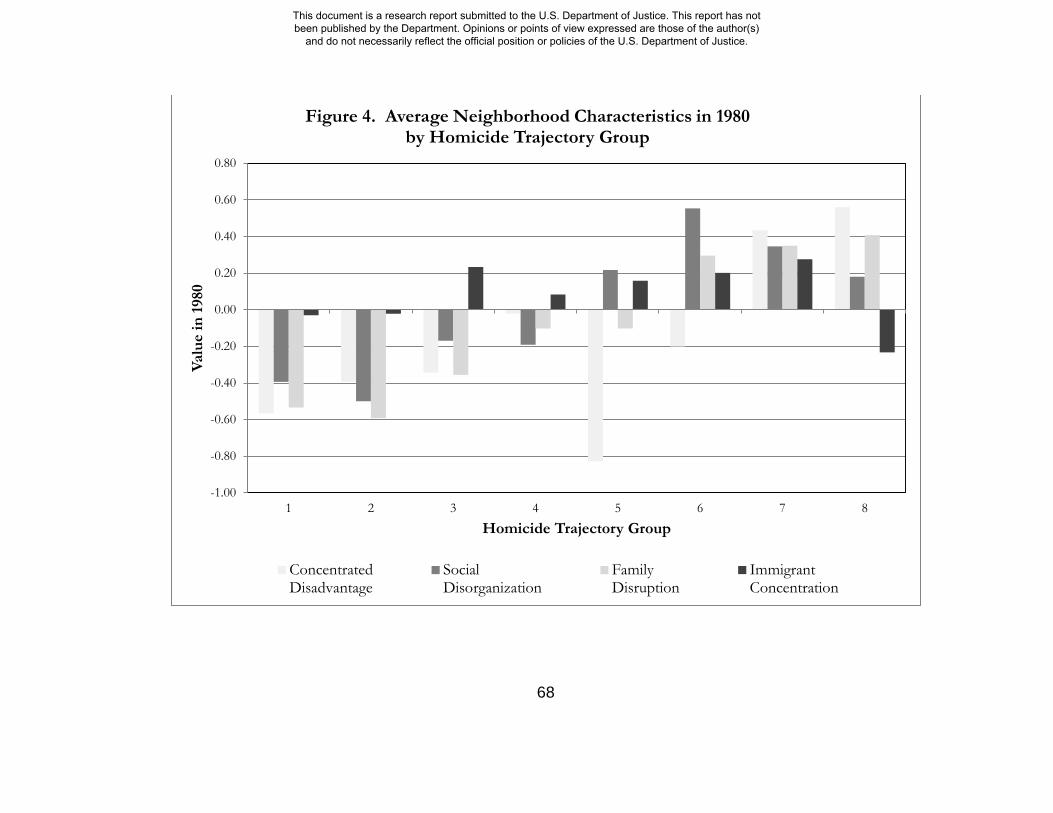
68
-1.00
-0.80
-0.60
-0.40
-0.20
0.00
0.20
0.40
0.60
0.80
1 2 3 4 5 6 7 8
Valu
e in
198
0
Homicide Trajectory Group
Figure 4. Average Neighborhood Characteristics in 1980 by Homicide Trajectory Group
ConcentratedDisadvantage
SocialDisorganization
FamilyDisruption
ImmigrantConcentration
This document is a research report submitted to the U.S. Department of Justice. This report has not been published by the Department. Opinions or points of view expressed are those of the author(s)
and do not necessarily reflect the official position or policies of the U.S. Department of Justice.
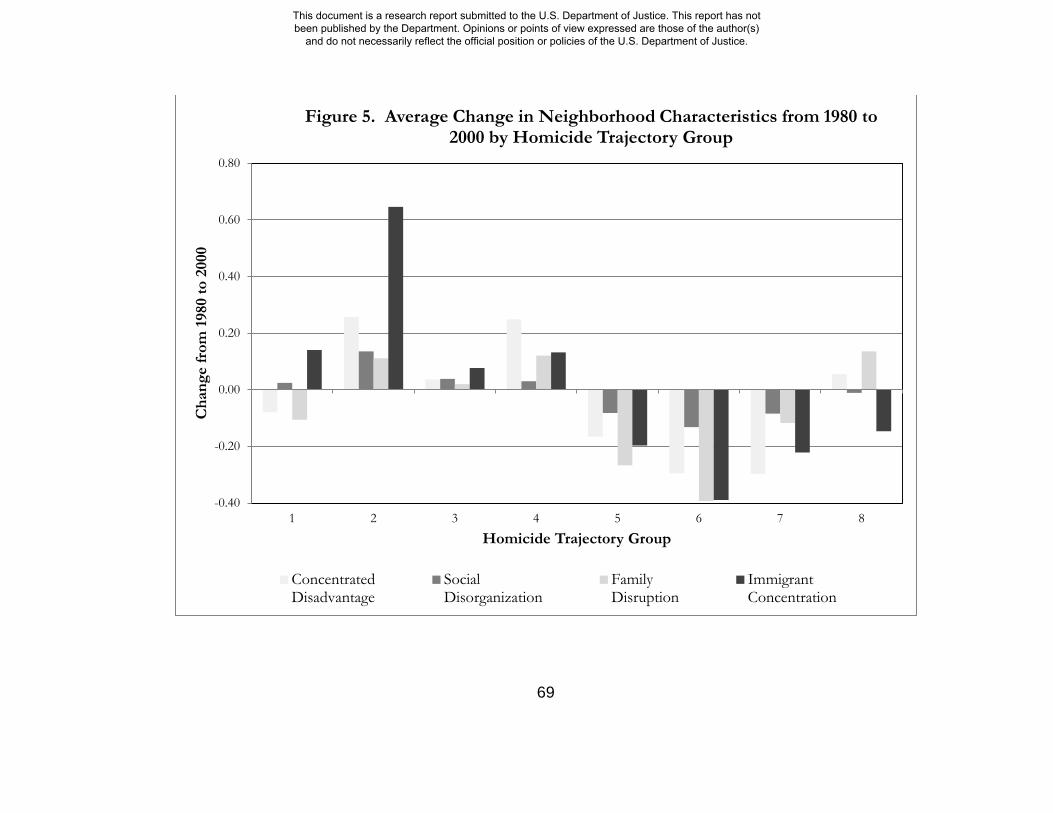
69
-0.40
-0.20
0.00
0.20
0.40
0.60
0.80
1 2 3 4 5 6 7 8
Cha
nge
from
198
0 to
200
0
Homicide Trajectory Group
Figure 5. Average Change in Neighborhood Characteristics from 1980 to 2000 by Homicide Trajectory Group
ConcentratedDisadvantage
SocialDisorganization
FamilyDisruption
ImmigrantConcentration
This document is a research report submitted to the U.S. Department of Justice. This report has not been published by the Department. Opinions or points of view expressed are those of the author(s)
and do not necessarily reflect the official position or policies of the U.S. Department of Justice.
70
TABLES
This document is a research report submitted to the U.S. Department of Justice. This report has not been published by the Department. Opinions or points of view expressed are those of the author(s)
and do not necessarily reflect the official position or policies of the U.S. Department of Justice.

71
Table 1. Bayesian Information Criterion (BIC) and Log Bayes Factors [2loge(B10)] for competing models
Number of groups Null Model BIC 2loge(B10)
1
-33,349
2 1 -25,640 15,419 3 2 -24,969 1,342 4 3 -24,589 759 5 4 -24,450 279 6 5 -24,238 424 7 6 -24,152 172 8 7 -24,070 164 9 8 -24,086 130
This document is a research report submitted to the U.S. Department of Justice. This report has not been published by the Department. Opinions or points of view expressed are those of the author(s)
and do not necessarily reflect the official position or policies of the U.S. Department of Justice.
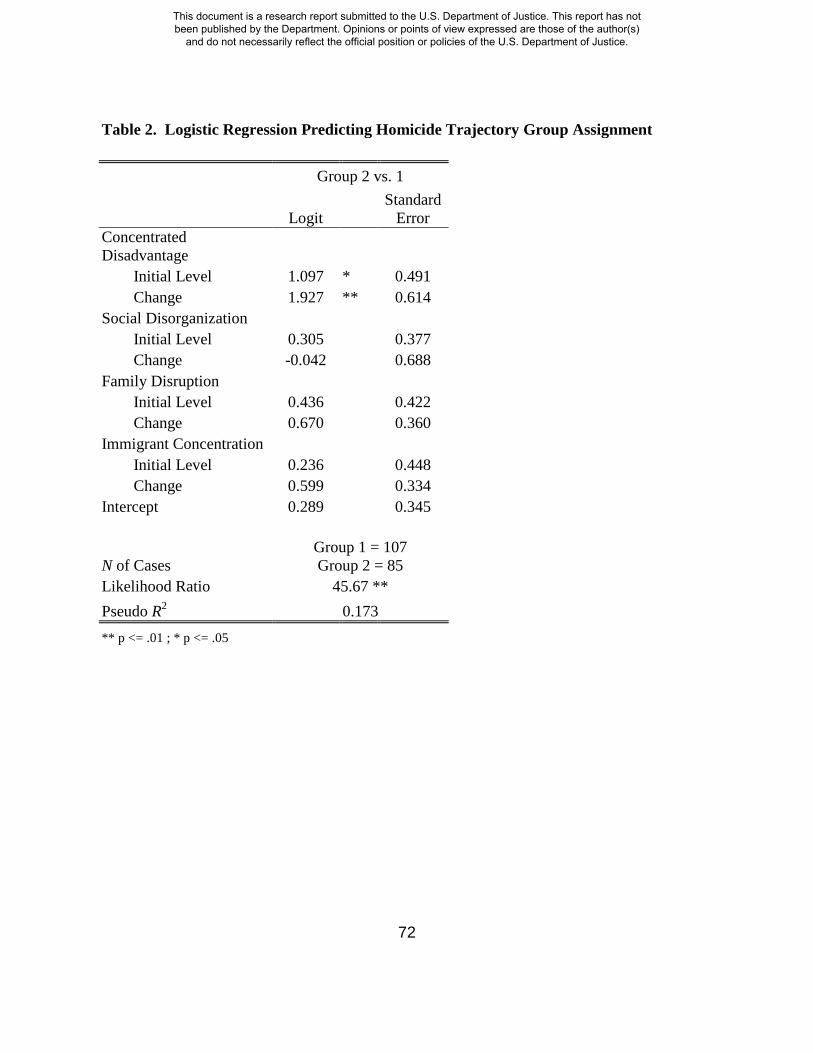
72
Table 2. Logistic Regression Predicting Homicide Trajectory Group Assignment
Group 2 vs. 1
Logit Standard
Error
Concentrated Disadvantage
Initial Level 1.097 * 0.491 Change 1.927 ** 0.614
Social Disorganization
Initial Level 0.305
0.377
Change -0.042
0.688 Family Disruption
Initial Level 0.436
0.422 Change 0.670
0.360
Immigrant Concentration
Initial Level 0.236
0.448
Change 0.599
0.334 Intercept 0.289
0.345
N of Cases Group 1 = 107 Group 2 = 85
Likelihood Ratio 45.67 **
Pseudo R2 0.173
** p <= .01 ; * p <= .05
This document is a research report submitted to the U.S. Department of Justice. This report has not been published by the Department. Opinions or points of view expressed are those of the author(s)
and do not necessarily reflect the official position or policies of the U.S. Department of Justice.

73
Table 3. Logistic Regression Predicting Homicide Trajectory Group Assignment
Group 3 vs. 5 Group 4 vs. 5
Logit Standard
Error Logit Standard
Error Concentrated Disadvantage
Initial Level 1.468 ** 0.471
2.986 ** 0.541 Change 1.145 * 0.555
3.320 ** 0.682
Social Disorganization Initial Level -0.317
0.425
-0.407
0.482
Change 0.625
0.697
0.480
0.776 Family Disruption
Initial Level -0.341
0.453
0.470
0.513 Change -0.384
0.410
0.011
0.461
Immigrant Concentration Initial Level -0.054
0.401
-0.006
0.422
Change -0.176
0.415
-0.079
0.442 Intercept 1.238 ** 0.352
-1.329 ** 0.361
N of Cases Group 3 = 92; Group 4 = 84; Group 5 = 59 Likelihood Ratio 112.74 ** Pseudo R2 0.222 ** p <= .01 ; * p <= .05
This document is a research report submitted to the U.S. Department of Justice. This report has not been published by the Department. Opinions or points of view expressed are those of the author(s)
and do not necessarily reflect the official position or policies of the U.S. Department of Justice.
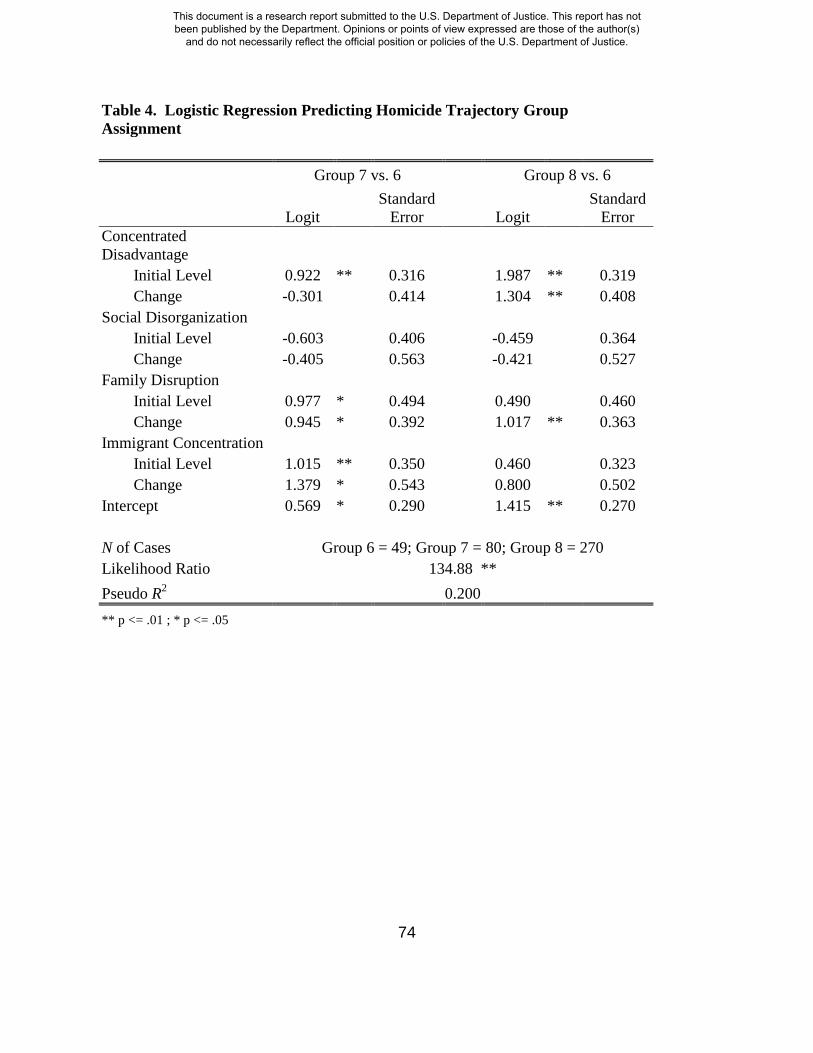
74
Table 4. Logistic Regression Predicting Homicide Trajectory Group Assignment
Group 7 vs. 6 Group 8 vs. 6
Logit Standard
Error Logit Standard
Error Concentrated Disadvantage
Initial Level 0.922 ** 0.316
1.987 ** 0.319 Change -0.301
0.414
1.304 ** 0.408
Social Disorganization Initial Level -0.603
0.406
-0.459
0.364
Change -0.405
0.563
-0.421
0.527 Family Disruption
Initial Level 0.977 * 0.494
0.490
0.460 Change 0.945 * 0.392
1.017 ** 0.363
Immigrant Concentration Initial Level 1.015 ** 0.350
0.460
0.323
Change 1.379 * 0.543
0.800
0.502 Intercept 0.569 * 0.290
1.415 ** 0.270
N of Cases Group 6 = 49; Group 7 = 80; Group 8 = 270 Likelihood Ratio 134.88 ** Pseudo R2 0.200 ** p <= .01 ; * p <= .05
This document is a research report submitted to the U.S. Department of Justice. This report has not been published by the Department. Opinions or points of view expressed are those of the author(s)
and do not necessarily reflect the official position or policies of the U.S. Department of Justice.
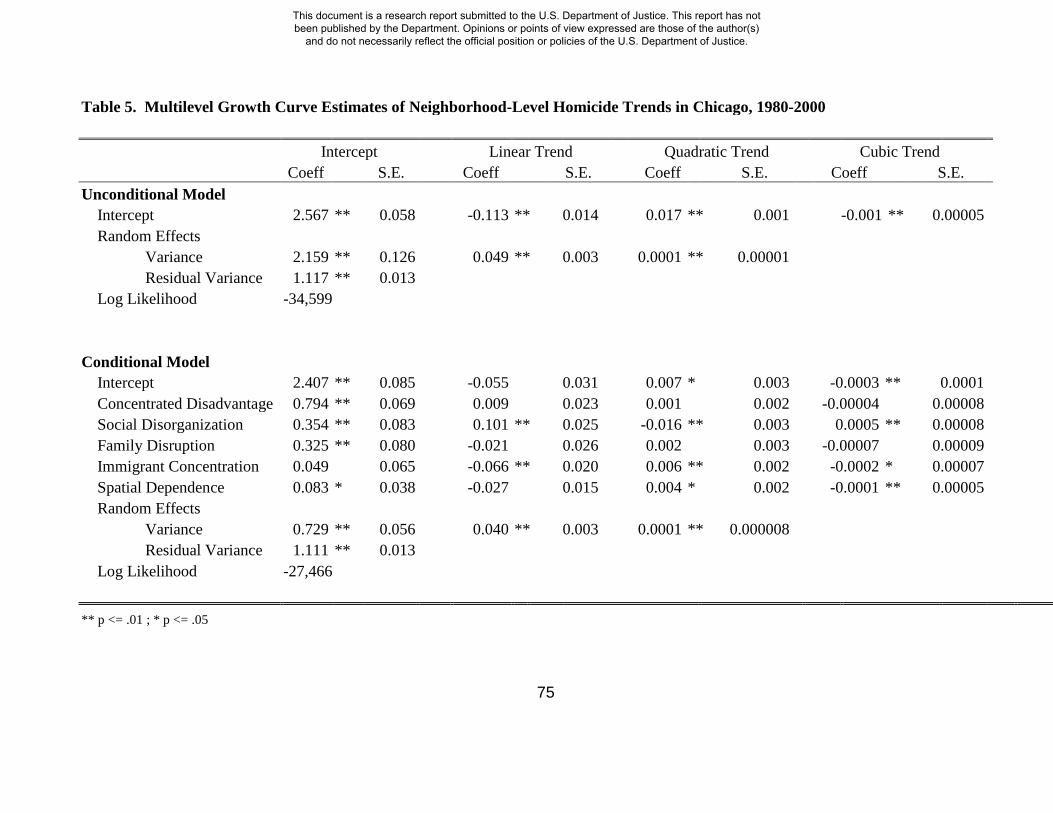
75
Table 5. Multilevel Growth Curve Estimates of Neighborhood-Level Homicide Trends in Chicago, 1980-2000
Intercept
Linear Trend
Quadratic Trend Cubic Trend Coeff S.E. Coeff S.E.
Coeff S.E. Coeff S.E.
Unconditional Model
Intercept 2.567 ** 0.058
-0.113 ** 0.014
0.017 ** 0.001
-0.001 ** 0.00005
Random Effects Variance 2.159 ** 0.126
0.049 ** 0.003
0.0001 ** 0.00001
Residual Variance 1.117 ** 0.013 Log Likelihood -34,599
Conditional Model
Intercept 2.407 ** 0.085
-0.055
0.031
0.007 * 0.003
-0.0003 ** 0.0001 Concentrated Disadvantage 0.794 ** 0.069
0.009
0.023
0.001
0.002
-0.00004
0.00008
Social Disorganization 0.354 ** 0.083
0.101 ** 0.025
-0.016 ** 0.003
0.0005 ** 0.00008 Family Disruption 0.325 ** 0.080
-0.021
0.026
0.002
0.003
-0.00007
0.00009
Immigrant Concentration 0.049
0.065
-0.066 ** 0.020
0.006 ** 0.002
-0.0002 * 0.00007 Spatial Dependence 0.083 * 0.038
-0.027
0.015
0.004 * 0.002
-0.0001 ** 0.00005
Random Effects Variance 0.729 ** 0.056
0.040 ** 0.003
0.0001 ** 0.000008
Residual Variance 1.111 ** 0.013 Log Likelihood -27,466
** p <= .01 ; * p <= .05
This document is a research report submitted to the U.S. Department of Justice. This report has not been published by the Department. Opinions or points of view expressed are those of the author(s)
and do not necessarily reflect the official position or policies of the U.S. Department of Justice.
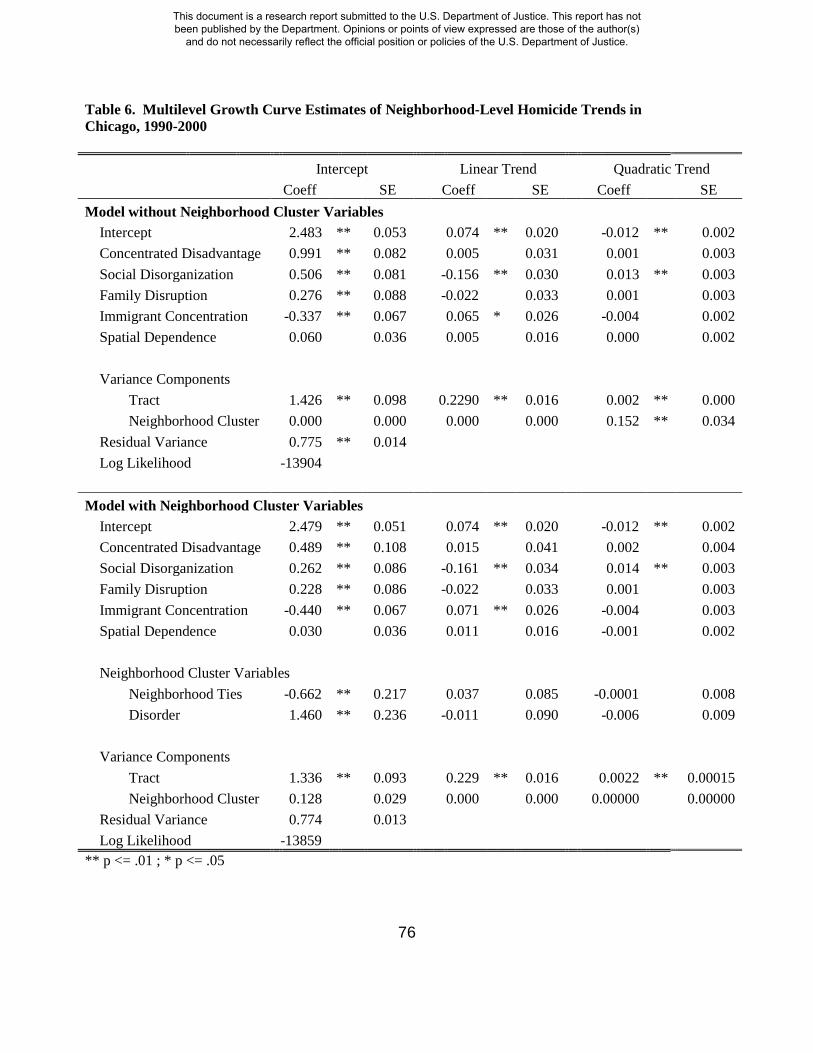
76
Table 6. Multilevel Growth Curve Estimates of Neighborhood-Level Homicide Trends in Chicago, 1990-2000
Intercept
Linear Trend
Quadratic Trend
Coeff SE Coeff SE Coeff SE Model without Neighborhood Cluster Variables
Intercept 2.483 ** 0.053
0.074 ** 0.020
-0.012 ** 0.002 Concentrated Disadvantage 0.991 ** 0.082
0.005
0.031
0.001
0.003
Social Disorganization 0.506 ** 0.081
-0.156 ** 0.030
0.013 ** 0.003 Family Disruption 0.276 ** 0.088
-0.022
0.033
0.001
0.003
Immigrant Concentration -0.337 ** 0.067
0.065 * 0.026
-0.004
0.002 Spatial Dependence 0.060
0.036
0.005
0.016
0.000
0.002
Variance Components Tract 1.426 ** 0.098
0.2290 ** 0.016
0.002 ** 0.000
Neighborhood Cluster 0.000
0.000
0.000
0.000
0.152 ** 0.034 Residual Variance 0.775 ** 0.014
Log Likelihood -13904
Model with Neighborhood Cluster Variables Intercept 2.479 ** 0.051
0.074 ** 0.020
-0.012 ** 0.002 Concentrated Disadvantage 0.489 ** 0.108
0.015
0.041
0.002
0.004
Social Disorganization 0.262 ** 0.086
-0.161 ** 0.034
0.014 ** 0.003 Family Disruption 0.228 ** 0.086
-0.022
0.033
0.001
0.003
Immigrant Concentration -0.440 ** 0.067
0.071 ** 0.026
-0.004
0.003 Spatial Dependence 0.030
0.036
0.011
0.016
-0.001
0.002
Neighborhood Cluster Variables Neighborhood Ties -0.662 ** 0.217
0.037
0.085
-0.0001
0.008
Disorder 1.460 ** 0.236
-0.011
0.090
-0.006
0.009
Variance Components Tract 1.336 ** 0.093
0.229 ** 0.016
0.0022 ** 0.00015
Neighborhood Cluster 0.128
0.029
0.000
0.000
0.00000
0.00000 Residual Variance 0.774
0.013
Log Likelihood -13859 ** p <= .01 ; * p <= .05
This document is a research report submitted to the U.S. Department of Justice. This report has not been published by the Department. Opinions or points of view expressed are those of the author(s)
and do not necessarily reflect the official position or policies of the U.S. Department of Justice.