determinants for using visible reserves in german banks
TRANSCRIPT

Determinants for using visible reservesin German banks – an empirical study
Sven Bornemann(University of Münster)
Susanne Homölle(University of Rostock)
Carsten Hubensack(University of Münster)
Thomas Kick(Deutsche Bundesbank)
Andreas Pfingsten(University of Münster)
Discussion PaperSeries 2: Banking and Financial StudiesNo 11/2009Discussion Papers represent the authors’ personal opinions and do not necessarily reflect the views of theDeutsche Bundesbank or its staff.

Editorial Board: Heinz Herrmann Thilo Liebig Karl-Heinz Tödter
Deutsche Bundesbank, Wilhelm-Epstein-Strasse 14, 60431 Frankfurt am Main, Postfach 10 06 02, 60006 Frankfurt am Main
Tel +49 69 9566-0Telex within Germany 41227, telex from abroad 414431
Please address all orders in writing to: Deutsche Bundesbank, Press and Public Relations Division, at the above address or via fax +49 69 9566-3077
Internet http://www.bundesbank.de
Reproduction permitted only if source is stated.
ISBN 978-3–86558–562–2 (Printversion)ISBN 978-3–86558–563–9 (Internetversion)

Determinants for Using Visible Reserves in German Banks –
An Empirical Study∗
Sven Bornemann†
University of Munster
Susanne Homolle‡
University of Rostock
Carsten Hubensack††
University of Munster
Thomas Kick‡‡
Deutsche Bundesbank
Andreas Pfingsten††
University of Munster
∗ We are deeply indebted to the participants of the Munster Banking Research Workshop 2008, the RostockConference on Service Research 2008, the 15th Annual Meeting of the German Finance Association (DGF)2008, the EIASM Workshop on Accounting and Economics 2008, the 12th Conference of the Swiss Society forFinancial Markets Research 2009, the Bundesbank Seminar on Banking and Finance, and those of the 32ndEAA Annual Congress 2009 for providing valuable comments that have led to a considerable improvementof a previous version of this paper. Not having incorporated all suggestions in the present work is our ownresponsibility, as are remaining errors and omissions. The paper represents the authors’ personal opinions andnot necessarily those of the Deutsche Bundesbank.
† Corresponding author, Finance Center Munster, University of Munster, Universitatsstr. 14-16, 48143 Munster,Germany, phone +492518329948, fax +492518322882, [email protected].
‡ Chair of Banking and Finance, University of Rostock, Ulmenstrasse 69, 18057 Rostock, Germany.
†† Finance Center Munster, University of Munster, Universitatsstr. 14-16, 48143 Munster, Germany.
‡‡ Deutsche Bundesbank, Wilhelm-Epstein-Str. 14, 60431 Frankfurt am Main, Germany.
The German Commercial Code (’HGB’) allows banks to build visible reserves for
general banking risks according to section 340g HGB. These ’GBR reserves’ may, in
addition to their risk provisioning function, be used to enhance capital endowment,
for internal financing, signaling or earnings management purposes. We analyze fi-
nancial statements of German banks for the period from 1995 through 2007 to reveal
specific patterns in the use of GBR reserves. Our empirical investigation is based on
a large, unbalanced panel of German banks including 32,023 bank-year observations.
We see an increase in the use of GBR reserves over time. Furthermore, we can say
that GBR reserves are primarily used by large banks, banks with comparatively low
regulatory capital endowment, as well as those with lower risks. Furthermore, GBR
reserves are used by fairly profitable banks, those reporting according to interna-
tional financial reporting standards in addition to HGB, and banks which are not
thrifts or cooperative banks. Finally, we find that banks which make use of hidden
reserves according to section 340f HGB also tend to hold GBR reserves. We explain
our findings with regulatory factors and existing information asymmetries as well as
banks’ size and ownership structure.
Key Words: Bank regulation, informational asymmetries, risk provisioning, visible
reserves, hidden reserves.
JEL Classification: G21, G32, M41.
Abstract

Non- echnical ummary
Section 340g of the German Commercial Code (’HGB’) allows banks to build visi-
ble reserves for general banking risks (henceforth: GBR reserves). Obviously, these
visible reserves are meant to take account of any kind of general risks banks may
be exposed to. They have to be disclosed as a separate item on the liability side
of the balance sheet and their allocation is clearly visible from the profit and loss
account. They are acknowledged as tier 1 capital and the decision to set them aside
is taken by the bank’s management. In addition to their risk provisioning function,
these visible reserves may also be used to enhance capital endowment, for internal
financing and for signaling purposes.
We analyze the financial statements of German banks for the period from 1995
through 2007 to reveal specific patterns in the use of GBR reserves. We explain our
findings with regulatory aspects and existing information asymmetries as well as the
size and the ownership structure of banks. Our results are as follows:
• Larger banks are more likely to use visible GBR reserves, and they also hold
a higher percentage of these reserves relative to their total assets. The same
holds for banks with low regulatory capital endowment and for banks which
are already using hidden reserves according to section 340f HGB.
• Banks subject to public law make use of GBR reserves less often and to a
smaller extent. The same relationship is found for banks with higher risks in
their loan portfolios, i.e. for banks with relatively high non-performing loan
ratios.
• Banks with a higher return on assets and banks under IFRS tend to build GBR
reserves more often and to a greater extent.
• Both the share of banks making use of GBR reserves and the ratio of these
reserves to total assets increase over time. This almost monotonic trend is con-
firmed even when controlling for all other relevant factors in panel regressions.
t s

Nichttechnische Zusammenfassung
Das deutsche Handelsgesetzbuch (HGB) erlaubt Kreditinstituten die Bildung eines
Fonds fur allgemeine Bankrisiken nach § 340g. Sowohl die Bildung als auch die Hohe
dieser Reserven mussen in der Gewinn- und Verlustrechnung bzw. in der Bilanz eines
Instituts klar ausgewiesen werden. Sie werden als Kernkapital anerkannt und die
Entscheidung uber ihre Bildung wird vom Bankmanagement getroffen. Zusatzlich
zur Risikoabsicherung konnen diese Reserven auch zur Erhohung der Kapitalaus-
stattung, zur internen Finanzierung und zu Signalisierungszwecken genutzt werden.
Wir untersuchen Bilanzdaten deutscher Banken im Zeitraum 1995 bis 2007, wobei
wir spezifische Verhaltensmuster in der Nutzung des Fonds fur allgemeine Bankrisiken
aufzeigen. Wir erklaren unsere Erkenntnisse mit regulatorischen Gegebenheiten,
existierenden Informationsasymmetrien, sowie durch die Große und die Eigentumer-
struktur von Banken. Unsere Ergebnisse sind wie folgt:
• Großere Banken weisen eine hohere Wahrscheinlichkeit zur Bildung von 340g-
Reserven und auch einen hoheren Anteil dieser Reserven an der Bilanzsumme
auf. Gleiches gilt fur Banken mit einer niedrigen regulatorischen Eigenkapital-
ausstattung und Institute, die bereits stille 340f-Reserven nutzen.
• Offentlich-rechtliche Banken nutzen 340g-Reserven weniger haufig und in gerin-
gerem Maße als andere Institute. Gleiches gilt fur Banken mit hohen Risiken
im Kreditportfolio, d. h. fur Banken mit einem relativ hohen Anteil an notlei-
denden Krediten.
• Banken mit einem hoheren ROA (operatives Ergebnis als Anteil an der Bi-
lanzsumme) bilden 340g-Reserven mit einer hoheren Wahrscheinlichkeit und
in einem hoheren Maße. Gleiches gilt fur Institute, die zusatzlich nach IFRS
bilanzieren.
• Es kann gezeigt werden, dass sowohl die Wahrscheinlichkeit zur Bildung von
340g-Reserven als auch deren Anteil an der Bilanzsumme im Zeitablauf ansteigen.
Diese Aussage gilt auch dann, wenn in Regressionsanalysen fur samtliche an-
deren wesentlichen Faktoren kontrolliert wird.


Contents
1 Introduction 1
2 Related Literature 3
3 Legal Framework 5
4 Theoretical Background 7
4.1 Motives for (Not) Using GBR Reserves . . . . . . . . . . . . . . . . . 7
4.2 Hypotheses . . . . . . . . . . . . . . . . . . . . . . . . . . . . . . . . 12
5 Empirical Analysis 15
5.1 Data and Variables . . . . . . . . . . . . . . . . . . . . . . . . . . . . 15
5.2 Results . . . . . . . . . . . . . . . . . . . . . . . . . . . . . . . . . . . 19
5.2.1 Descriptive Statistics . . . . . . . . . . . . . . . . . . . . . . . 19
5.2.2 Regression Models . . . . . . . . . . . . . . . . . . . . . . . . 22
6 Conclusion 29

List of Tables
1 Evaluation of GBR reserves and the alternatives. . . . . . . . . . . . 12
2 Coverage by bank groups for selected years (in %). . . . . . . . . . . 16
3 Number of observations in the panel by bank categories over time. . . 16
4 Number of banks and mean of observations in the panel by category. 18
5 Pairwise correlations. . . . . . . . . . . . . . . . . . . . . . . . . . . . 18
6 Number of activities involving GBR reserves over time. . . . . . . . . 21
7 Results of pooled regression models. . . . . . . . . . . . . . . . . . . . 24
8 Coefficients of random effects models. . . . . . . . . . . . . . . . . . . 27
List of Figures
1 Share of banks using GBR reserves per bank category over time. . . . 20
2 GBRTA by bank category over time. . . . . . . . . . . . . . . . . . . 21

1 Introduction
Banks are considered to be fairly opaque and intransparent institutions compared
to many other industries.1 Insight into and understanding of the banking business is
not widespread among the public. Existing bank-specific accounting rules certainly
do much to add to this image. These special norms and the consequent lack of trans-
parency in banks’ financial reporting are justified by the particular kinds and levels
of risk banks are exposed to. Confidence in and the stability of the banking sector
are deemed to be vital for the well-being of the world’s economies. This becomes
even more evident when looking at the turmoil caused by the recent financial crisis.
To achieve financial stability and to foster confidence, on the one hand, regulatory
bodies impose certain restrictions on the amount of risky assets held by banks in
relation to their capital resources.2 On the other hand, legal bodies generally allow
the building of reserves and loss provisions within banks’ financial statements.
The German Commercial Code (’HGB’) in particular contains two unique but very
different instruments permitting banks to build reserves. Firstly, section 340f HGB
allows specified financial assets to be deliberately undervalued within certain lim-
its. This is often referred to as creating hidden reserves (for simplicity called ’340f
reserves’ hereinafter). Secondly, a bank may increase its visible reserves, so called
’Reserves for General Banking Risks’ in accordance with section 340g HGB (for sim-
plicity called ’GBR reserves’ hereinafter). These two types of reserves differ greatly
with respect to their visibility on the balance sheet. Thus, banks may use them
for very different reasons. Whereas the creation of hidden reserves has a very long
tradition for German banks, GBR reserves, which are the main focus of this paper,
were not introduced into German law until 1993.
340f reserves certainly contribute to the perceived opaqueness of banks, as they un-
dermine the pre- and post-decision information functions of accounting regulations.3
To some extent, this also holds for GBR reserves. They are visible, but to external
observers it is not obvious whether they represent existing risks or whether they
were just built as part of the bank’s earnings management or as a signaling device.
Furthermore, they may also have been built to enhance capital endowment and for
internal financing purposes. However, these aims can also partly be achieved by
other means, for instance (hidden) 340f reserves, retaining earnings, or by raising
new equity.
1 Cf. Morgan (2002), Flannery et al. (2004), or Ianotta (2006), for example.
2 In this context we refer to the rules of BCBS (2006) (henceforth Basel II ) which, for instance, have beentransformed into German law via the German Solvency Regulation since 2007/01/01.
3 For a closer look at the information functions of accounting cf. Beaver/Demski (1979), pp. 43-45.
1

It is especially interesting to examine the use of GBR reserves, since they were not
introduced into German banking legislation voluntarily. Rather, the legislator was
forced to do so during adoption of the EC Bank Accounts Directive in 1986, since
Germany continued to allow the creation of hidden reserves according to section
340f HGB. We are therefore mainly addressing two research questions in this paper.
Firstly, we examine what factors determine the probability of a bank making use of
GBR reserves. For this analysis, the level of GBR reserves is therefore irrelevant as
long as it exceeds zero. In a second step, we identify key factors that account for the
amount of GBR reserves that have been built. To this end, we analyze the evolution
of the precise level of this balance sheet item at bank level over time, controlling for
the influence of variables such as the category a bank belongs to, its size and other
characteristics such as regulatory capital endowment and the level of risk a bank
is exposed to. Regulatory constraints as well as concepts focusing on informational
asymmetries (such as the Pecking Order Theory) help to provide explanations for
our findings and enable us to identify key factors responsible for the use of GBR
reserves.
Our empirical analysis is based on a large, unbalanced panel of 4,916 German banks
derived from the Deutsche Bundesbank’s BAKIS database. It covers the period
from 1995 through 2007, yielding a considerable number of bank-year observations
(32,023). Our findings are clearly consistent with the predictions implied by informa-
tion asymmetry outlined above. We see an increase in the use of GBR reserves over
time. Furthermore, we can say that GBR reserves are primarily used by large banks,
banks with comparatively low regulatory capital endowment, as well as those with
lower risks. Furthermore, GBR reserves are used by fairly profitable banks, those
reporting according to international financial reporting standards in addition to
HGB, and banks which are neither thrifts nor cooperative banks. Finally, we find
that banks that make use of hidden reserves according to section 340f HGB also
tend to hold GBR reserves.
The remainder of this paper is organized as follows: In Section 2 we review related
literature. Section 3 introduces the legal framework, whereas Section 4 presents
motives for (not) using GBR reserves. Moreover, the informational perspective on
the use of those reserves is evaluated and some practical issues surrounding the
decision-making process for building GBR reserves are discussed. Section 5 presents
the data set and the results of our empirical analysis. Finally, Section 6 provides
some concluding remarks.
2

2 Related Literature
To the best of our knowledge, no empirical analysis of GBR reserves has been con-
ducted from the perspective of the economics of information. However, risk provi-
sioning in general as well as bank loan-loss accounting in particular have been widely
discussed in the past.
Despite major differences between GBR reserves and loan-loss accruals (namely the
fact that GBR reserves are, unlike loan-loss accruals, not associated with credit risk),
literature on loan-loss provisioning is still most closely related to our analysis. At
an international level, several papers examine loan-loss provisioning empirically.
Madura/McDaniel (1989) as well as Grammatikos/Saunders (1990) analyze the ef-
fects of the announcement by Citicorp and other U.S. money-center banks that they
would increase loan-loss reserves for third world loans on the stock prices of those
banks. They find heterogeneous evidence among the banks. Docking et al. (1997)
study differences in the contagion effects of bank loan-loss reserve announcements
between money-center and regional banks in the USA for the period from 1985 to
1990. Surprisingly, they find negative announcement effects as well as contagion ef-
fects between regional banks. Ahmed et al. (1999) find strong support for loan-loss
provisions being used for capital management only. Wall/Koch (2000) review theo-
retical and empirical evidence on bank loan-loss accounting. To do so, they take very
different perspectives on bank regulation and capital management. Laeven/Majnoni
(2003) fathom the relationship between loan-loss provisioning and overall economic
slowdowns. Recently, Anandarajan et al. (2007) found that Australian banks use
loan-loss provisions for capital management.
Another important strand of literature mainly focuses on earnings management
and its ties to bank loan-loss provisioning. Scheiner (1981) uses data from 107 U.S.
banks for the period from 1969 through 1976 but does not detect a correlation be-
tween provision allowances and proxies for a bank’s good or bad years. By contrast,
Greenawalt/Sinkey (1988) find significant evidence for earnings management among
U.S. banks. More recently, Bhat (1996), by analyzing a panel of U.S. banks from
1981 through 1991, finds that low-growth banks with a high loans to deposits ratio
and high leverage are more likely to carry out income smoothing. Lobo/Yang (2001)
analyze bank managers’ decisions on discretionary loan-loss provisions to smooth in-
come and to manage capital requirements. Shrieves/Dahl (2003) take a closer look
at the use of loan-loss provisions by Japanese banks during a period of financial
duress and find evidence for earnings and regulatory capital management. Subse-
quently, Kanagaretnam et al. (2004) find bank managers using loan-loss provisions
as a means of communicating private information about the bank’s future prospects.
Furthermore, they find this propensity to be greater if a bank is performing badly
3

and if it is undervalued. Last but not least, Fonseca/Gonzalez (2008) examine loan-
loss provisions as a tool for income smoothing in a cross-country study and find the
extent of income smoothing to be lower in countries with effective supervision.
Since sections 340f and 340g HGB are specific German rules, most of the existing pa-
pers that deal with these sections merely discuss institutional and legal issues related
to the German banking market and the underlying accounting system. Shortly
after their integration into German banking legislation in 1993, Waschbusch (1994)
illustrated the main features of visible reserves. He argues that particularly inter-
nationally operating German banks will increasingly use GBR reserves to improve
their standing. Following up, Emmerich/Reus (1995) are the first to discuss visible
and hidden reserves from a mainly informational perspective, while also showing
accounting implications for banks’ management in Germany.
Looking at the German banking market, so far only Wagener et al. (1995) have
taken an empirical perspective, but that is limited to the year 1993. They study 125
financial statements and 35 group financial statements. However, they do not focus
on the use of risk provisions but rather analyze all positions on the banks’ balance
sheets and profit and loss accounts. With respect to GBR reserves, their focus is on
describing how many banks already held such reserves in the year they were first
implemented (1993). They do not try to explain their findings using informational
aspects as we shall do in the following.
Our paper contributes to the literature in several ways. Firstly, we analyze the
financial statements of a panel of 4,739 German banks, the largest sample examined
so far. The analysis covers the period from 1995 through 2007, yielding a considerable
time series of up to 13 accounting years for each bank. Most importantly, by relating
our empirical results to accounting and regulatory properties as well as informational
aspects of GBR reserves, we are able to test a number of hypotheses which shed light
on some serious agency issues.
4
3 Legal Framework
The item on the liability side of banks’ balance sheets called ’Reserves for General
Banking Risks’ is a direct consequence of the EC Bank Accounts Directive of 1986,
introduced into German law by section 340g HGB in 1993. According to Art. 38
of this directive, members of the EC that continued to allow their banks to build
hidden reserves (e.g. Germany through section 340f HGB) had to enable disclosure
of GBR reserves as well.4 The aim was to create a counterweight to the permission
to create hidden reserves and thus to increase pressure on banks to turn away from
a policy of minimum disclosure.5
The creation of hidden reserves has a long tradition in Germany. Though this type
of reserves is not the main focus of our paper, an awareness of the major differences
as compared to GBR reserves is important for understanding the central arguments
set out in the rest of the paper. 340f reserves are formed by deliberately undervaluing
loans and certain securities designated the so-called ‘liquidity reserve’ according to
HGB. 340f reserves are referred to as hidden because their use is not apparent from
the balance sheet or income statement. The decision to undervalue these assets is
in the hands of the bank’s management alone. However, 340f reserves are limited
to 4% of the overall value of the relevant financial assets before the undervaluation
takes place. They have to be eliminated when filing the tax statement, hence they
do not influence the bank’s tax payments.
Under the leading international financial accounting regimes IAS/IFRS and US-
GAAP6, there is no corresponding rule, i.e. hidden reserves cannot be created in
the same way. However, IAS 30.50 - which was still effective until the end of 2006 –
allowed the disclosure of reserves for general banking risks.
The funding and release of GBR reserves have to be shown in separate items of banks’
income statements. Their variation within one year is visible from the balance sheets
and the amount built during a year is shown in the income statement.7 According to
section 340g HGB, the amount of reserves must be ’reasonable’. It is not restricted to
any particular level as long as it does not yield negative net income after raising GBR
reserves. Similar to 340f reserves, the funding of GBR reserves does not influence
tax payments. In a regulatory context, they are treated as tier 1 capital according
4 For details cf. European Commission (1986).
5 Cf. for example Bauer (1987), p. 864, and Krumnow et al. (2004), pp. 604f.
6 For the sake of simplicity, we will, from now on, talk of ’IFRS accounting’ when referring to IAS/IFRS orUS-GAAP, since if a bank in our sample uses these accounting rules in addition to HGB, the vast majoritydoes so by means of IAS/IFRS accounting.
7 However, if a bank chooses to convert hidden reserves into visible ones, the conversion does not affect the incomestatement. In such a case, the level of GBR reserves increases on the balance sheet, while the correspondingitem on the income statement remains unchanged.
5

to section 10 Section 2a of the German Banking Act (’KWG’), while, by contrast,
340f reserves are merely recognized as tier 2 capital. The higher quality of regulatory
capital assigned to visible reserves can be regarded as another incentive to increase
corporate disclosure.8
The decision on whether or not to fund or release GBR reserves is entirely at the
discretion of the bank’s management. Approval by shareholders is not needed to
build GBR reserves. These reserves must not be dedicated to covering the risks
arising from certain specified assets. GBR reserves display key features of equity
(economically speaking). However, from a purely legal point of view, they have to
be reported separately on a bank’s balance sheet.
8 Cf. Krumnow et al. (2004), p. 607.
6

4 Theoretical Background
4.1 Motives for (Not) Using GBR Reserves
Since the aim of financial accounting is to provide information, we adopt the in-
formation content approach in this paper.9 Clearly, information given via financial
statements can be useful in a pre- and a post-decision manner. On the one hand, dis-
closure of accounting information will help potential investors and depositors when
coming to an investment decision (pre-decision information function). On the other
hand, financial accounting helps mitigate agency problems between bank managers
and existing investors (post-decision information function). Informational aspects
play a leading role in understanding why management may prefer to build GBR re-
serves rather than using other instruments that fulfill similar functions. Since bank
managers are the ones to choose, we will predominantly take their perspective as
the basis for our evaluation.
Most intuitively, GBR reserves are a means of risk provisioning and internal cap-
ital accumulation to cover general banking risks. German banks can also achieve
these aims by creating hidden 340f reserves or by retaining earnings. At least theo-
retically, raising new equity may be a third alternative to cover unforeseen risks.
As they are hidden, 340f reserves may help hide a bad signal from potential in-
vestors.10 As a result of informational asymmetries between investors and the bank’s
management, increasing visible GBR reserves may be regarded as evidence of a risen
risk level at the bank. For short, we will refer to this as the ’bad risk signal’ below. In
other words, building visible reserves may lead to a loss of confidence in the bank’s
economic prosperity. Hence, potential capital suppliers may refrain from investing
in the company. However, this bad signaling effect is likely to vanish over time as
more and more banks use GBR reserves.
In addition, it is important to note that the bad risk signal is of different relevance
for different types of institution. Firstly, money-center banks are not exposed to this
signaling effect to the same extent as smaller ones. This is because the economic
well-being of large banks is assumed to have a huge impact on the stability of the
whole financial system. Bankruptcy or illiquidity of such an institution is likely to
cause severe uncertainty regarding the safety of bank deposits. Therefore, money-
center banks are often held to be ’Too Big To Fail’ (TBTF), since governmental
9 Cf. Christensen/Demski (2003), pp. 3-6.
10 Disregarding all informational considerations for a moment, the existing limit on the amount of 340f reserves(to 4% of the valuation basis) may present a material drawback with respect to all functions. Confidentialstatements from practitioners, however, suggest that this is not really a binding restriction.
7

institutions are supposed to support ailing banks to avoid financial instability.11
Secondly, banks subject to public law (for simplicity also called ’public banks’ here-
inafter), e.g. thrifts as well as federal and state banks, may also not be exposed to
this bad signal to the same extent as privately owned banks. Maintenance obliga-
tion (’Anstaltslast’) and guarantee obligation (’Gewaehrtraegerhaftung’) formerly
in place in Germany basically eliminated all likelihood of such banks becoming
bankrupt or illiquid. Maintenance and guarantee obligations, which had been an
important characteristic of the German banking market for a long time, had to be
abolished in 2005 because they did not comply with European competition regula-
tions. However, the consequences for the risk provisioning signal effects are still in
place, especially because debt issued before 2005 is still protected.
Retaining earnings also serves the risk provisioning function. In terms of the decision-
making process within the bank, managers may, however, prefer to increase GBR
reserves. Shareholders’ or owners’ approval is essential for retaining earnings and also
for releasing them. Managers intending to use earnings to cover general banking risks
cannot be certain that the owners will not choose to distribute them. Consequently,
they may prefer to use their discretionary powers to build visible or hidden reserves
instead. In other words, building these reserves deprives owners of their right to
decide on the appropriation of what would otherwise become the bank’s equity. Since
investors may anticipate this behavior, increasing GBR reserves may represent a bad
signal stemming from informational asymmetries. Building reserves may indicate
that bank managers are uncertain of obtaining shareholders’ approval for retaining
earnings, since there may be more profitable investment alternatives (with a similar
risk level). If so, the owners will try to extract money by claiming a higher dividend.
Due to their informational head start, the insiders’ conceivable skepticism about the
bank’s prospects can be seen as a bad signal to outside investors. In the following, we
will refer to this as a bad ’management signal’ for short. Based on insiders’ behavior,
other capital market participants may be reluctant to invest money in the company.
Nevertheless, this bad signal may also disappear over time with the increasing use of
GBR reserves. Like the bad risk signal outlined above, this bad signal is also much
less relevant for banks subject to public law. Their specific ownership structure,
with municipal and state authorities as owners, makes them virtually independent
of equity markets. There is no need to attract new shareholders and mechanisms of
stock market valuation do not apply to this type of bank. Their owners, too, may
prefer to have more rather than less profits available for redistribution.
11 For more details on first evidence for TBTF policy used by the Federal Deposit Insurance Corporation (FDIC) inthe 1980s, cf. FDIC (1997), pp. 235-257. The more recent failure of Lehman Brothers may have been intendedto demonstrate that TBTF does not hold. The disruptions following the default, however, were such thatgovernments all over the world officially acknowledged TBTF by assuring they would rescue any bank relevantto the financial system.
8

The theory of corporate control comes into play here. It is well proven that com-
panies with only a few (possibly large and influential) owners are monitored more
closely than companies featuring a disperse ownership structure.12 Monitoring helps
to reduce informational asymmetries between a bank’s management and its share-
holders. In Germany, banks subject to public law (mainly thrifts and federal state
banks) are usually owned by a small number of cities or municipalities, whereas
ownership of private and especially incorporated banks is usually widespread. Man-
agers of closely monitored banks may prefer to make use of hidden 340f reserves
rather than the visible alternative to avoid the bad management signal and pre-
vent shareholders from demanding the distribution of profits. Combining this line
of argument with the ones for the risk and the management signal yields conflicting
predictions in terms of the choice between visible and hidden reserves for banks
subject to public law. On the one hand, they may not be exposed to the bad risk
and the bad management signal and therefore make use of GBR reserves. On the
other hand, their managers may be closely monitored, resulting in the primary use
of hidden 340f reserves. The question as to which of these two effects outweighs the
other will be the subject of our empirical analysis in Section 5.
In terms of raising new equity as a means of risk provisioning, the main conclusions
of the Pecking Order Theory developed by Myers (1984) and Myers/Majluf (1984)
have to be taken into account. In short, companies prefer internal finance to debt
and equity issuance. Once more, the basis for this theory are informational asymme-
tries between the management of and potential investors in a company. If managers
believe a company to be undervalued, they will not raise new equity for financing
purposes because investors will need to pay less than the company is worth. Con-
versely, managers who believe that their company is overvalued will likely issue stock
since investors will pay more than the company’s value. Thus, the attempt to sell
stock typically shows that a company is overvalued. Therefore issuing equity sends a
worse signal about the managers’ beliefs to capital markets than raising funds inter-
nally. This may result in managers’ preference for increasing GBR or 340f reserves
or retaining earnings rather than issuing equity.
Besides risk provisioning, increasing GBR reserves can also be used as a way of
internal financing and cash flow management. The level of earnings available
for distribution to owners (dividends, say) is lowered by building reserves. Thus,
free cash flow does not leave the bank but is instead at management’s disposal for
financing new projects.13 Creating 340f reserves may again be a wise alternative to
using GBR reserves from the management’s point of view, since doing so will not
12 Cf. Levine (2004), who comments on special features of corporate governance in banks.
13 Cf. Christensen/Demski (2003), pp. 125-126 for the information content of cash flows and pp. 35-45 for theirimpact on a firm’s value.
9

send a bad risk or management signal to capital markets. This line of argument
also holds for retaining earnings, which likewise avoids conflicts in closely monitored
banks. However, in this case, management cannot decide about the development of
retained earnings and therefore has to convince shareholders to supply funds.
A bank’s management may also decide to deliberately use GBR reserves as a sig-
naling device to reduce any informational asymmetries between themselves and
the bank’s owners or depositors. Building these reserves shows that the bank is in a
economically strong position and that it is generating sufficient profits to build GBR
reserves. We will from now on refer to this as the ’signal of strength’ for short. This
interpretation of course runs counter to the effect, outlined above, whereby GBR
reserves act as a bad risk signal. Which of the two effects outweighs the other is the
subject of our empirical analysis. The signal of strength may even be intensified by
achieving a constant rise in GBR reserves as shown on the balance sheet over time.
Confidential statements from practitioners indeed prove this to be an important
motive for which the profitability of a bank is certainly a key factor.
In terms of use as a signaling device, retaining earnings is the only valuable alterna-
tive to building GBR reserves. It shows that the bank is generating sufficient profits
and is in good shape. Boosting the equity ratio by retaining earnings avoids the bad
risk signal incurred by funding GBR reserves.
Creating hidden 340f reserves is not an alternative in this context, since their level
is not visible to external observers and capital markets. Banks are, of course, free
to disclose the volume of hidden reserves they hold within the notes to the financial
statement. However, hardly any bank does so. Issuing new equity – if deemed to have
any signaling effect at all in this context – is fairly counterproductive. According to
Pecking Order Theory, issuing new equity is a clear sign that management believes
the company to be overvalued. Such an overvaluation may stem from capital markets
overestimating the bank’s future earnings potential. Therefore, the wish to raise new
equity will certainly reveal this error of judgment.
Any kind of reserves may be used as a tool for earnings management. Bank man-
agers often aim at assuring their stockholders a stable or – preferably – a slightly
growing annual dividend. An increase in the regular annual dividend is usually
interpreted by investors as a sign of management’s confidence in future earnings
prospects. Therefore, stock prices and the company’s value are likely to rise follow-
ing an increase in dividends.14 Obviously, this motive is closely connected to the
aforementioned use of GBR reserves as a signaling device.
14 For further details, cf. the basic dividend model developed by Lintner (1956) and further research byHealy/Palepu (1988) as well as Benartzi et al. (1997).
10

In terms of earnings management, the only reasonable alternative to creating GBR
reserves is to use hidden 340f reserves. In years of economic well-being, profits will
suffice to distribute stable or slightly growing dividends. At the same time, bank
management may deliberately undervalue assets within the given limits (accord-
ing to section 340f HGB). These undervaluations can be reversed in economically
bad periods to achieve dividend stability. Again, the bad management signal may
be avoided by using 340f rather than GBR reserves. Using retained earnings influ-
ences declared profits rather than net income and is thus inappropriate for earnings
management purposes. Raising new equity does not have any impact at all in this
context.
Having introduced some aspects that are mainly driven by informational asymme-
tries, some practical issues potentially driving the use of GBR reserves must not
be disregarded. Most closely connected to the aforementioned risk provisioning is a
bank’s need to enhance its regulatory capital endowment. Under Basel II and
the German Solvency Regulation, banks have to hold a certain amount of capital
in relation to their risk-weighted assets. GBR reserves are acknowledged as tier 1
capital and can therefore help eliminate regulatory capital shortages.
With respect to boosting the tier 1 capital endowment, retaining earnings and raising
new equity are equivalent options to an increase in GBR reserves. A bank may also
influence its regulatory capital endowment by reducing its risk-weighted assets, of
course. However, we ignore this because it is related to changes on the asset side
of the balance sheet, which we are not looking at. With respect to tier 1 capital
endowment, 340f reserves are not equivalent because they are recognized as tier 2
capital only.
Achieving an increase in a bank’s tier 1 capital endowment by retaining earnings
avoids both bad signals described above stemming from a rise in GBR reserves.
Another alternative is to raise new equity. However, the line of argument concerning
the Pecking Order Theory (as mentioned before) holds here, too.
Moreover, the obligation to disclose hidden 340f reserves when preparing financial
statements according to IFRS in addition to HGB (we will henceforth simply call
such banks ’IFRS banks’) may be another motive for using GBR reserves. Whereas
building hidden reserves is explicitly allowed under HGB accounting, IFRS prohibit
this. Consequently, if a German bank wishes or has to prepare its (group) financial
statements according to IFRS, it must disclose its former 340f reserves. Doing so
in its HGB unconsolidated financial statements as well may then be beneficial for
two reasons. Hidden reserves are revealed within the IFRS accounts, so they partly
lose their latent characteristics anyway. However, it is unclear whether the extent
of hidden reserves becomes fully evident when transferring HGB accounts to IFRS
11

due to the different categories of financial instruments and the different valuation
rules. Nevertheless, we deem this aspect to be important. Furthermore, getting rid
of hidden reserves is one step towards eliminating costly parallel book keeping.
The bank may also decide to disclose hidden reserves by putting these funds into
retained earnings rather than increasing GBR reserves. Showing these disclosed re-
serves as profits and distributing them to the owners of the bank is another option
for management. Since this distribution serves neither financing nor risk provisioning
purposes, it will not be discussed in any further detail.
Table 1 summarizes the most important results of our theoretical considerations.
GBRreserves
340f reserves retainedearnings
new equity
riskprovisioning
visible invisible visible
financing no capital outflow capital inflow
earningsmanagement
visible invisible n/a
regulatorycapital
tier 1 tier 2 tier 1
use in IFRS possible n/a possible n/a
decision-making
by management by shareholders
signals bad risk andmanagementsignals, good
signal ofstrength
none good signal ofstrength
bad signalaccording toPecking OrderTheory
Table 1: Evaluation of GBR reserves and the alternatives.
4.2 Hypotheses
Starting from theoretical considerations, we arrive at the following hypotheses. To
simplify and enhance understandability, we will phrase the hypotheses in an eco-
nomically rather than a statistically correct manner.
H 1: The size of a bank has a positive impact on the management’s decision to use
GBR reserves.
This hypothesis refers to the fact that the bad risk signal from using GBR reserves
may not be as important for money-center banks as for smaller institutions. When
a large bank experiences financial distress, intervention by government authorities
is very likely according to the TBTF theory.
12
H 2: Being a bank subject to public law has an impact on the use of GBR reserves.
The particular ownership structure of public banks makes them less vulnerable to
either of the two bad signals caused by GBR reserves. However, the fact that banks
subject to public law are usually owned by a small number of cities or municipalities
means these banks are subject to a higher level of monitoring. Consequently, their
management may decide to use hidden 340f rather than GBR reserves as outlined
above. Which of those two effects outweighs the other is the subject of our empirical
analysis.
H 3: The use of GBR reserves increases over time.
The more banks use visible reserves, the more the bad risk signal as well as the
bad management signal will diminish. So we expect to see a continuous rise in the
number of banks using GBR reserves as well as in the aggregate size of GBR reserves
for all banks from 1995 through 2007.
H 4: The risk level of a bank has an impact on the decision to use GBR reserves.
Since GBR reserves are meant to prevent general banking risks, a bank’s risk level
will presumably have an impact on their use. Hence, we expect to see a positive
correlation. By contrast, high-risk banks may be in such financial distress that they
cannot fund reserves. Accordingly, we cannot hypothesize in advance whether a high
risk level has a positive or a negative impact on the management’s decision to fund
GBR reserves.
H 5: The regulatory capital endowment has a negative impact on the use of GBR
reserves.
Under the German Banking Act, GBR reserves are recognized as tier 1 capital.
Therefore, banks that are short of regulatory capital may prefer to build GBR rather
than 340f reserves.
H 6: Being a bank that publishes its statements according to IFRS as well as HGB
(’IFRS banks’) has a positive impact on the use of GBR reserves.
IFRS accounting does not allow for hidden reserves to be built as under section 340f
HGB. Therefore, we would expect IFRS banks to convert hidden reserves into the
visible alternative upfront, and we anticipate a strong correlation between the use
of GBR reserves and preparing financial statements according to IFRS.
H 7: The profitability of a bank has a positive impact on the decision to use GBR
reserves.
This hypothesis is closely connected to the use of GBR reserves as a signal of
strength. To be able to fund GBR reserves, a bank has to be fairly profitable. There-
13

fore, we should see a bank’s profitability having a positive influence on its likelihood
of using GBR reserves and the extent to which it does so. One is tempted to interpret
this hypothesis in a way that assumes that GBR reserves will be used for earnings
management purposes. Since the corresponding coefficient in our regressions would
have the same sign if this were the case, it is not clear which of the two effects is
responsible. However, the analysis of earnings management behavior is the subject
of further research.
14

5 Empirical Analysis
5.1 Data and Variables
For our empirical analysis, we use data from the Bundesbank’s prudential database
BAKIS (BAKred Information System) for the years 1995 through 2007. BAKIS
is the information system on bank-specific data which is jointly operated by the
Deutsche Bundesbank and the German Financial Supervisory Authority (BaFin).
The database contains information on the financial statements and supervisory re-
ports of individual German banks. Therefore, our analysis is based on a micro panel
of annual supervisory bank-level data for 4,916 German banks.15 We merely analyze
unconsolidated accounts prepared according to HGB, since building GBR reserves
is not allowed within financial statements prepared according to any international
accounting regime.
In some parts of our analyses, we divide the German banking market into four dif-
ferent categories according to bank size and legal status: Savings banks (henceforth:
Thrifts), cooperative banks (Coops), small private banks (henceforth: Small Cred-
its), and large banks (Large Banks). The latter category contains the five largest
German private banks as well as the federal state banks and the central institutions
of the cooperative banking sector. We are aware of the fact that this categorization is
somewhat unusual since German banks are commonly grouped merely according to
their legal status into savings banks, cooperative banks and private banks. However,
we assume that much of banking institutions’ behavior is mainly driven by their size
rather than their legal status.
We deliberately excluded other types of financial institutions like home loan banks,
mortgage banks or securities trading banks since they either do not fulfill the defi-
nition of a bank according to section 1 KWG or they do not conduct core banking
businesses such as lending and borrowing. Owing to a lack of data and mergers
during the observed time period, the panel is unbalanced and consists of 32,023
bank-year observations.
It is noteworthy that coverage (meaning the proportion of banks included in our
panel in relation to the overall number of banks in Germany) is always close to
and mostly exceeds 90% for each bank category in each year. For Thrifts and Small
Credits, we do achieve coverage of 100% at least for 2005, as shown in Table 2.
15 Due to our treatment of mergers, this figure is higher than the actual number of existing banks. In case of amerger, we, technically speaking, created a new bank that is independent of the merging ones. This new bankstarts operating in the year of the merger. For the purposes of our analysis, there is no need to distinguishbetween mergers, takeovers or any other kind of acquisition.
15

Year Thrifts Coops Small Credits Large Banks
1995 98.9 97.2 94.9 90.92000 99.5 98.2 89.0 86.42005 100.0 98.4 89.9 89.5
Table 2: Coverage by bank groups for selected years (in %).
Thrifts Coops Small Credits Large Banks Total
Year No. row% No. row% No. row% No. row% No. row%
1995 619 18.5 2,519 75.3 188 5.6 20 0.6 3,346 100.01996 606 18.6 2,448 75.3 178 5.5 21 0.7 3,253 100.01997 594 18.7 2,364 74.6 191 6.0 20 0.6 3,169 100.01998 589 19.7 2,197 73.5 183 6.1 20 0.7 2,989 100.01999 575 20.8 1,992 72.1 177 6.4 20 0.7 2,764 100.02000 559 22.2 1,760 69.9 178 7.1 20 0.8 2,517 100.02001 535 23.0 1,597 68.8 171 7.4 19 0.8 2,322 100.02002 517 23.9 1,462 67.5 167 7.7 20 0.9 2,166 100.02003 488 23.9 1,375 67.4 159 7.8 19 0.9 2,041 100.02004 476 24.2 1,317 67.0 154 7.8 18 0.9 1,965 100.02005 463 24.4 1,273 67.2 142 7.5 17 0.9 1,895 100.02006 454 24.7 1,234 67.0 135 7.3 18 1.0 1,841 100.02007 427 24.3 1,189 67.8 122 7.0 17 1.0 1,755 100.0
Total 6,902 21.6 22,727 71.0 2,145 6.7 249 0.8 32,023 100.0
Table 3: Number of observations in the panel by bank categories over time.
Table 3 gives detailed information on the number of banks observed in our panel and
the split between the bank categories over time. The share of each bank category is
fairly constant over time, whereas the absolute number of banks decreases (almost)
steadily, reflecting mergers that have occurred in the German banking sector in the
last decade. Coops dominate our sample. They have a share of roughly 71%, followed
by Thrifts (22%), Small Credits (7%), and Large Banks with about 1%.
We apply the following variables to measure the use of GBR reserves: GBRi ,t is
the amount of GBR reserves of bank i in year t and GBRTAi ,t is the share of GBR
reserves in relation to total assets of bank i in year t. The binary variable D GBRi ,t
takes the value 1 if bank i shows a positive amount of GBR reserves in year t (thus
GBRi ,t > 0 ) and 0 otherwise.
Regarding H1, we use SIZEi ,t as a proxy for the size of the bank, which is measured
as the natural logarithm of total assets of bank i in year t. To prevent endogeneity,
we exclude the amount of GBR reserves included in a bank’s total assets.
With respect to H2, D PUBLICi is 1 if bank i is subject to public law and 0
otherwise. This variable is constant over time because changes in legal status did
not occur.
16

Referring to H3, we are including time dummy variables τt . Hence, we can control
for changes in GBR reserves during the course of our analysis and find time-fixed
effects.
To account for banks’ individual risk levels (corresponding to H4 ), we use the non-
performing loan ratio of a bank i in year t and name it NPLi ,t . The choice of this
proxy is based on the assumption that banks with a high NPL ratio are also exposed
to generally high risk levels. It is calculated as the ratio of non-performing to total
customer loans. Loans are non-performing if the bank is waiting for payments which
are overdue by at least 90 days.16
To somehow control for banks using GBR reserves as a signal of strength, we finally
include D 340fi ,t , a dummy variable which takes the value 1 if a bank is using any
hidden 340f reserves and 0 otherwise. If a bank is able to fund both types of
reserves, it is likely in a strong economic position, and one way of showing this is by
means of GBR reserves.
To analyze the endowment with regulatory capital (relevant to H5 ), we use the level
of tier 1 capital a bank has in relation to its risk-weighted assets. Once more to
prevent endogeneity when examining the influence of the tier 1 capital endowment,
we exclude the volume of GBR reserves inherent in tier 1 capital. The corresponding
variable is named TIER1i ,t .
The dummy D IFRSi ,t is used for H6, t. It takes the value 1 if bank i in year
t prepares its (group) financial statements according to IFRS in addition to HGB
and 0 otherwise. Note that this dummy is time-variant because many banks changed
their status from ’non-IFRS’ to ’IFRS’ (but not the other way round) during the
period of our analysis.
Finally, we use ROAi ,t , which is the return on assets (ROA) of bank i in year t,
as a proxy for the profitability of a bank. With respect to H7, it is calculated as
the ratio of operating income (income before risk provisioning) to total assets of
bank i in year t. Using operating income rather than net income or declared profits
eliminates any effects stemming from legal accounting policy on the one hand or
manipulation on the other hand.
A relatively moderate outlier treatment is applied to the dataset, in which we trun-
cate explanatory variables (except for dummy variables) at the 0.5% and 99.5%
quantile. To account for the heterogeneity of the capital adequacy ratio (tier 1
16 For technical reasons, the numerator of this ratio, on top of troubled customer loans also comprises non-performing interbank lending, whereas the denominator merely contains the sum of a bank’s customer loans.Thus, the NPL ratios may be overstated to a certain extent. However, since the volume of troubled interbankloans has generally been low, at least before the start of the financial crisis, this should be negligible.
17

No. of TA in D PUBLIC D IFRS D 340f TIER1 NPL ROA
Category banks EUR 1,000 (in %) (in %) (in %) (in %) (in %) (in %)
Thrifts 762 1,745,338 98.7 0.1 98.6 7.8 3.9 0.7Coops 3,633 303,811 0.0 0.0 95.2 8.5 5.2 0.7Small Credits 311 2,863,477 0.0 5.3 42.4 11.2 6.5 0.7Large Banks 33 70,512,546 60.6 28.5 91.2 7.5 2.6 0.22
Total 4,916 1,331,881 21.7 0.6 92.4 8.5 5.0 0.7
Table 4: Number of banks and mean of observations in the panel by category.
capital of a bank in relation to its risk-weighted assets), we use an upper-bound
truncation of this variable at the 97% quantile.
Table 4 shows the number of banks per category as well as averages per category and
across all banks for these variables. Since the table shows the mean of observations
and not the mean of banks, those banks with many observations in the panel have
a higher weight than banks which contribute only a few observations. The quite low
average of total assets for all banks is the result of the dominance of Coops in the
sample. Generally speaking, correlation is low and multicollinearity is therefore not
a serious problem. Table 5 reports the correlation coefficients for the variables in
our analysis.
Variables D GBR GBRTA SIZE D PUBLIC D IFRS D 340f TIER1 NPL
D GBR 1.0000GBRTA 0.6582 1.0000SIZE 0.1893 0.0652 1.0000D PUBLIC 0.0316 -0.0097 0.5303 1.0000D IFRS 0.1319 0.0360 0.2212 -0.0208 1.0000D 340f 0.0403 0.0371 0.0001 0.1234 -0.0839 1.0000TIER1 0.0228 0.0578 -0.1993 -0.1502 0.0129 -0.1499 1.0000NPL -0.0996 -0.0553 -0.1120 -0.1353 -0.0513 -0.3002 0.0199 1.0000ROA 0.0021 0.0292 -0.0802 -0.0289 -0.0386 0.1903 0.1193 -0.2610
Table 5: Pairwise correlations.
18

5.2 Results
5.2.1 Descriptive Statistics
First of all, we compute the share of banks holding a positive volume of GBR reserves
with the help of the mean of D GBR17. For Thrifts, Figure 1 shows that this share
slowly increased until 2000, followed by a steeper rise in recent years (reaching 34%
in 2007). For Coops, a similar, even more pronounced development is characterized
by a rapid increase in 2003, 2006 and 2007. The share of Coops using GBR reserves
has doubled from 2005 to 2007, ultimately reaching 43%. The share of Small Credits
showing GBR reserves increased slightly in the years from 1995 through 2001 and
fluctuated between 10% and 17% until 2007.
The Large Banks take the lead in the use of GBR reserves, starting at a share of
about 30% in 1995, and fluctuating between 70% and 83% until 2007. When looking
at these numbers, it has to be considered that the overall number of banks within
this category is fairly small. Since federal or state banks (being large and public) as
well as large cooperative central and the largest German private banks are included
in this category, our findings are in line with hypothesis H1 (size). This is true for
the initially hesitant use of GBR reserves within Thrifts and Coops and the low
share of usage within Small Credits as well, since these groups primarily consist of
smaller banks. Further confirmation is provided by the correlation coefficients for
D GBR and SIZE in Table 5.
With respect to H2 (public), our findings indicate that the extent of monitoring and
corporate control lowers the use of GBR reserves, since almost all banks subject to
public law are Thrifts and largely did not make use of GBR reserves, at least in the
early years of our analysis. The conflicting (since positive) sign of the correlation
coefficient of D PUBLIC with D GBR (as given in Table 5) calls for a deeper
analysis regarding the dummy for banks subject to public law, as we outline in the
next section.
The share of banks using GBR reserves within the banking sector as a whole rose
steadily from 0.8% in 1995 to 39.2% in 2007. Bearing in mind that Thrifts and
Coops dominate our sample, Figure 1 clearly exhibits this rise. This confirms our
hypothesis regarding time, H3.
To gain deeper insight into the use of GBR reserves, we counted the number of activ-
ities involving these reserves over time (cf. Table 6). The second column First year
17 To improve readability, we will from now on neglect the sub indices i and t.
19

020
4060
800
2040
6080
1995
1996
1997
1998
1999
2000
2001
2002
2003
2004
2005
2006
2007
1995
1996
1997
1998
1999
2000
2001
2002
2003
2004
2005
2006
2007
1995
1996
1997
1998
1999
2000
2001
2002
2003
2004
2005
2006
2007
1995
1996
1997
1998
1999
2000
2001
2002
2003
2004
2005
2006
2007
Small Credits
Thrifts Cooperatives
Large Banks
Sha
re o
f ban
ks u
sing
GB
R−
rese
rves
(in
%)
Figure 1: Share of banks using GBR reserves per bank category over time.
is a fairly technical one listing observations for which we cannot clearly identify the
activity as data for the previous period is lacking. Furthermore, we distinguished be-
tween first-time implementation (Implement), an increase (Raise), a constant level
of zero (Hold at zero), a constant level above zero (Hold above zero), a decrease to
a still positive level (Reduce), and a termination of the whole balance sheet item
(Terminate). Apparently, an existing level is increased much more often than low-
ered. Similarly, we observed substantially more implementations than terminations.
Supporting H3 (time), the number of implementations clearly increases over time,
including a sudden rise in 2003.
In this paragraph, we will exclusively focus on those observations where banks use
GBR reserves and on the question of what level of reserves those banks hold.18
To eliminate size effects, we use the ratio of GBR reserves to total assets GBRTA.
Figure 2 shows how this ratio has evolved over time, broken down by bank category.
It reveals startling results especially for Small Credits. The ratio of GBR reserves
to total assets is remarkably high in 1995 and falls to a lower level afterwards.
Once more, a steep rise is visible during 2001 and 2002 followed by a sharp decline
to a fairly constant level of roughly 0.5% of total assets. When interpreting these
findings, the small number of banks showing these reserves within this group has to
18 Technically speaking, we are neglecting all observations with D GBRi,t = 0 , i.e. we take a bank into accountonly in those years in which its level of GBR reserves is positive.
20

Year First Imple- Raise Hold Hold Reduce Terminate Totalyear ment (= 0) (> 0)
1995 3,346 0 0 0 0 0 0 3,3461996 153 12 13 3,062 12 0 1 3,2531997 125 6 8 2,974 25 1 30 3,1691998 179 20 12 2,727 23 1 27 2,9891999 205 14 17 2,473 26 0 29 2,7642000 228 24 28 2,193 24 2 18 2,5172001 185 31 28 2,013 43 1 21 2,3222002 140 27 51 1,887 43 4 14 2,1662003 134 120 64 1,659 46 3 15 2,0412004 75 70 117 1,571 119 3 10 1,9652005 65 76 170 1,447 120 4 13 1,8952006 45 176 234 1,239 134 7 6 1,8412007 36 154 345 1,028 171 5 16 1,755
Total 4,916 730 1,087 24,273 786 31 200 32,023
Table 6: Number of activities involving GBR reserves over time.
be considered. Thus, the results are driven by very few institutions. For Thrifts, a
steady increase is visible for the years from 1997 onwards. This is generally true for
Large Banks as well as Coops. However, the latter display sudden rises in 2000 and
2006.
01.
50.
51.
00
1.5
0.5
1.0
1995
1996
1997
1998
1999
2000
2001
2002
2003
2004
2005
2006
2007
1995
1996
1997
1998
1999
2000
2001
2002
2003
2004
2005
2006
2007
1995
1996
1997
1998
1999
2000
2001
2002
2003
2004
2005
2006
2007
1995
1996
1997
1998
1999
2000
2001
2002
2003
2004
2005
2006
2007
Small Credits
Thrifts Cooperatives
Large Banks
GB
R /
Tot
al A
sset
s (in
%)
Figure 2: GBRTA by bank category over time.
21

5.2.2 Regression Models
Addressing the first of our research questions, relating to the factors driving the
probability of a bank making use of GBR reserves, it is helpful to estimate probit
models using D GBR as the dependent variable. This is done in Model A.1, where
we examine the influence of the independent variables SIZE (referring to hypothesis
H1 ), D PUBLIC (H2 ), NPL (H4 ), D 340f (indirectly related to H7 ), TIER1 (H5 ),
D IFRS (H6 ) and ROA (H7 ) on the probability that a bank will use GBR reserves.
Moreover, we include the time dummies (τt) to find time-fixed effects (referring to
H3 ). Since we do not control for any unobservable random or bank-fixed effects, it
is simply a pooled time-fixed effects estimation. The formal design of Model A.1 is
given in equation (1):
P (D GBRi,t = 1) = β0 + β1 · SIZEi ,t + β2 · D PUBLICi + β3 · NPLi ,t
+ β4 · TIER1i ,t + β5 · D 340fi ,t + β6 · D IFRSi ,t
+ β7 · ROAi ,t +∑11
t=1[β(10+t) · τ(1995+t)].
(1)
The estimated coefficients as well as the corresponding standard errors (in brackets)
are shown in the second column of Table 7. Additionally, the AUR value as well as
the number of observations with D GBR = 0 are given at the bottom.19
With respect to the second research question, we investigate which factors are re-
sponsible for the precise level of GBR reserves a bank’s management chooses to
hold. To this end, we employ a tobit model (Model A.2 ) with GBRTA as the de-
pendent variable. The tobit methodology20 accounts for the fact that the level of
GBR reserves is naturally truncated at zero. Ignoring this and using OLS regression
models, which allow for negative values of the dependent variable, would systemat-
ically underestimate the slope of the regression line. We are using the same set of
independent variables as in Model A.1 and again pooling the data while controlling
for time-fixed effects. The formal design of Model A.2 is given in equation (2):
19 To assess the fit of the overall Model A.1, we calculate the AUR value, which equals the area under the so-calledReceiver Operating Characteristic Curve. For a more detailed description of ROC curve analysis cf. Flach et al.(2003) and Fawcett (2006). In our case, the AUR value measures the ability of the model to correctly identifythose banks using GBR reserves (thus having D GBRi,t = 1) and those not using them. The larger the AURvalue (equaling the area under the ROC curve), the more accurate the model in question is. The correspondingAUR value of roughly 86% means that our model has excellent accuracy.
20 For further details cf. Tobin (1958).
22
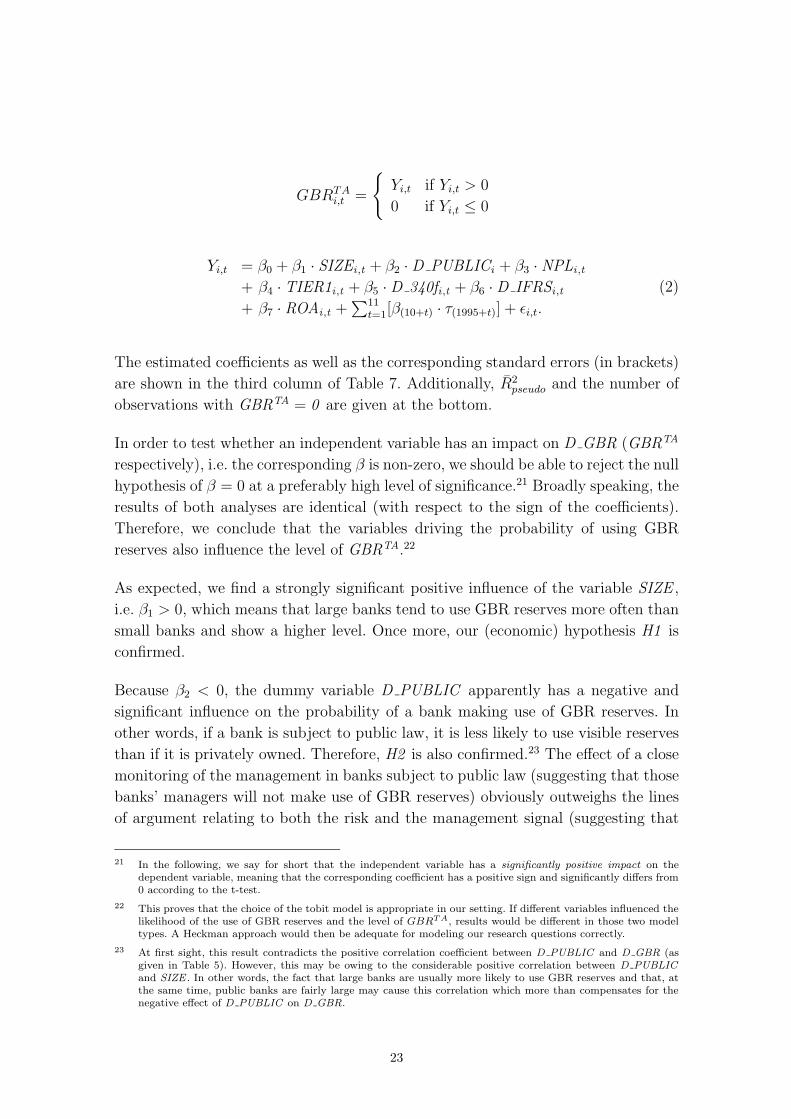
GBRTAi,t =
{Yi,t if Yi,t > 0
0 if Yi,t ≤ 0
Yi,t = β0 + β1 · SIZEi ,t + β2 · D PUBLICi + β3 · NPLi ,t
+ β4 · TIER1i ,t + β5 · D 340fi ,t + β6 · D IFRSi ,t
+ β7 · ROAi ,t +∑11
t=1[β(10+t) · τ(1995+t)] + εi,t.
(2)
The estimated coefficients as well as the corresponding standard errors (in brackets)
are shown in the third column of Table 7. Additionally, R2pseudo and the number of
observations with GBRTA = 0 are given at the bottom.
In order to test whether an independent variable has an impact on D GBR (GBRTA
respectively), i.e. the corresponding β is non-zero, we should be able to reject the null
hypothesis of β = 0 at a preferably high level of significance.21 Broadly speaking, the
results of both analyses are identical (with respect to the sign of the coefficients).
Therefore, we conclude that the variables driving the probability of using GBR
reserves also influence the level of GBRTA.22
As expected, we find a strongly significant positive influence of the variable SIZE ,
i.e. β1 > 0, which means that large banks tend to use GBR reserves more often than
small banks and show a higher level. Once more, our (economic) hypothesis H1 is
confirmed.
Because β2 < 0, the dummy variable D PUBLIC apparently has a negative and
significant influence on the probability of a bank making use of GBR reserves. In
other words, if a bank is subject to public law, it is less likely to use visible reserves
than if it is privately owned. Therefore, H2 is also confirmed.23 The effect of a close
monitoring of the management in banks subject to public law (suggesting that those
banks’ managers will not make use of GBR reserves) obviously outweighs the lines
of argument relating to both the risk and the management signal (suggesting that
21 In the following, we say for short that the independent variable has a significantly positive impact on thedependent variable, meaning that the corresponding coefficient has a positive sign and significantly differs from0 according to the t-test.
22 This proves that the choice of the tobit model is appropriate in our setting. If different variables influenced thelikelihood of the use of GBR reserves and the level of GBRTA, results would be different in those two modeltypes. A Heckman approach would then be adequate for modeling our research questions correctly.
23 At first sight, this result contradicts the positive correlation coefficient between D PUBLIC and D GBR (asgiven in Table 5). However, this may be owing to the considerable positive correlation between D PUBLIC
and SIZE . In other words, the fact that large banks are usually more likely to use GBR reserves and that, atthe same time, public banks are fairly large may cause this correlation which more than compensates for thenegative effect of D PUBLIC on D GBR.
23

Control variables SIZE & D PUBLIC Bank category
Model A.1 A.2 B.1 B.2(Probit) (Tobit) (Probit) (Tobit)
dependent variable D GBR GBRTA D GBR GBRTA
SIZE 0.175*** 0.143***(β1) (0.011) (0.009)D PUBLIC -0.288*** -0.290***(β2) (0.032) (0.031)
NPL -0.022*** -0.022*** -0.026*** -0.026***(β3) (0.004) (0.004) (0.004) (0.004)TIER1 -0.043*** -0.036*** -0.063*** -0.051***(β4) (0.006) (0.005) (0.006) (0.005)D 340f 0.174*** 0.190*** 0.177** 0.163***(β5) (0.066) (0.055) (0.082) (0.062)D IFRS 0.622*** 0.271*** 0.625*** 0.246**(β6) (0.119) (0.094) (0.138) (0.097)ROA 0.133*** 0.184*** 0.158*** 0.205***(β7) (0.024) (0.022) (0.025) (0.023)
SmallCredits -1.687*** -1.214***(β8) (0.123) (0.093)Thrifts -1.946*** -1.440***(β9) (0.104) (0.086)Coops -1.863*** -1.311***(β10) (0.102) (0.083)
1996 0.144 0.149 0.169* 0.168*(β11) (0.095) (0.098) (0.099) (0.099)1997 0.202** 0.213** 0.242** 0.242**(β12) (0.094) (0.096) (0.097) (0.098)1998 0.323*** 0.342*** 0.386*** 0.393***(β13) (0.090) (0.093) (0.093) (0.093)1999 0.375*** 0.399*** 0.465*** 0.469***(β14) (0.089) (0.092) (0.092) (0.092)2000 0.533*** 0.572*** 0.648*** 0.662***(β15) (0.088) (0.090) (0.091) (0.091)2001 0.682*** 0.742*** 0.822*** 0.851***(β16) (0.087) (0.089) (0.090) (0.089)2002 0.823*** 0.883*** 0.982*** 1.007***(β17) (0.087) (0.088) (0.089) (0.088)2003 1.213*** 1.284*** 1.384*** 1.417***(β18) (0.082) (0.084) (0.085) (0.085)2004 1.373*** 1.436*** 1.555*** 1.578***(β19) (0.081) (0.084) (0.084) (0.085)2005 1.519*** 1.585*** 1.710*** 1.735***(β20) (0.081) (0.083) (0.083) (0.085)2006 1.861*** 1.991*** 2.064*** 2.148***(β21) (0.081) (0.084) (0.083) (0.085)2007 2.103*** 2.288*** 2.319*** 2.456***(β22) (0.081) (0.085) (0.084) (0.086)
Observations 32,023 32,023 32,023 32,023Observations = 0 29,218 29,218 29,218 29,218AUR value 0.859 0.855R2
pseudo0.2362 0.2381
Standard errors in brackets. *** p<0.01, ** p<0.05, * p<0.1
Table 7: Results of pooled regression models.
24

banks subject to public law are likely to make greater use of GBR reserves than
others).
The coefficient on NPL, β3, is strongly significant and negative. This indicates that
banks with a low volume of non-performing loans in relation to their customer loans
are more likely to use GBR reserves and they are doing so to a greater extent.
Since the NPL ratio measures the risk level of a bank, the probability that low risk
banks will use GBR reserves, and with a higher intensity, is obviously higher. H4 is
backed.24
Looking at TIER1 , the corresponding coefficient β4 is significantly negative, meaning
that banks which are short of regulatory capital build higher levels of GBR reserves
and do so more often. Thus, H5 is backed, too.
An interesting result is indicated by the positive coefficient β5 (relating to the vari-
able D 340f ). This positive coefficient shows that banks that already hold 340f
reserves are more likely to use visible GBR reserves, too, and to use them with
higher intensity.25 This supports the hypothesis that reserves serve as a signaling
device (inherent in H7 ) for the following reason. Banks which are able to build 340f
reserves are assumed to be economically healthy. Thus, they may use GBR reserves
(as a clearly visible balance sheet item) to signal their strength to outsiders. More-
over, it might also be the case that some banks first build up 340f reserves to the
4% limit of the overall value of the relevant financial assets, and later on they make
use of GBR reserves.
Since β6 > 0, the variable D IFRS has a positive and significant influence on the
probability and intensity of the use of GBR reserves. Banks that prepare accounts
according to IFRS are more likely to hold GBR reserves than other banks. Further-
more, they build higher levels of these reserves. Hence, H6 is supported as was the
case with respect to the correlation coefficients in Table 5.
In line with the function of GBR reserves as a signal of strength, β7 is significant and
positive, meaning that banks with a high ROA are more likely to use GBR reserves
and are doing so to a greater extent than banks with a lower return in relation to
their total assets. H7 is confirmed by the regression outcomes as well as the positive
correlation coefficients in Table 5.
Finally, all coefficients on the time dummies, β11 to β22, are significant at a high
level except for the year 1996. Moreover, the coefficients are steadily increasing.
This is statistically strong evidence for hypothesis H3 predicting increasing use of
24 The corresponding correlation coefficient in Table 5 confirms this result.
25 This also holds when looking at the corresponding correlation coefficient in Table 5.
25

GBR reserves over time. Furthermore, it reinforces the results shown in the merely
descriptive part of our analysis.
In the following step, we substitute the independent variables SIZE and D PUBLIC
with control variables for each but one of the four bank categories.26 Along the
lines of Model A.1 and A.2, we first use the probit Model B.1 addressing the first
research question, followed by the tobit model B.2 with respect to the second one.
The key findings of these models are shown in the last two columns of Table 7. When
controlling for the bank categories, Large Banks are the basis, which is why their
coefficient is not stated.
Since all coefficients of the other categories are significantly negative, it is striking
that Large Banks are most likely to use GBR reserves, followed by Small Credits,
Coops, and Thrifts. The same order of precedence holds for the level of the reserves
in relation to total assets. These results coincide with the previous finding of size
(and being a bank subject to public law, respectively) having a positive (negative)
impact on the likelihood and intensity of a bank showing visible reserves. Thus, it
confirms H1 (H2 ). Regarding all other independent variables, the signs and (in the
vast majority of cases) even the levels of significance are identical to the previous
models. Thus, Models B.1 and B.2 may be considered as robustness checks for the
models in block A.
To account for the possibility that the variables examined so far do not capture all
potential determinants for using GBR reserves, which is indeed a pivotal assumption
for using pooled regression models, we conduct further robustness checks. To this
end, we successively investigate a set of variables identical to the ones used in the
last four models. We now control for unobservable effects that are constant over
time and differ between banks by using a random effects panel methodology in the
regressions.27 The outcomes of these models (which are given similar names to their
pooled forerunners by adding an asterisk (*) (as for instance Model A.1* )), are
shown in Table 8, which exhibits an identical structure to Table 7.
The results of these models mimic those of the previous ones to a large extent.
However, β6 concerning D IFRS and β7 concerning ROA change to a negative and
significant sign, respectively.28 Obviously, the bank-specific effect causes the emerg-
26 Owing to the way we distinguish between the different bank categories, it is necessary to do this rather thanincluding all variables in one single regression equation. Otherwise, the effects of the size and the public characterof a bank would not be isolated correctly. By definition, the Large Banks contain the largest banks within thesample and the category Thrifts consists (almost) entirely of public banks and contains most of these banks.
27 Due to the very low variance of D GBR on a bank-individual level, a bank-fixed effects estimator would notyield reasonable results. Furthermore, it is not possible to isolate the effect of time-invariant variables (e.g.D PUBLIC) from the unobservable fixed effect using this regression technique.
28 Moreover, β5 lost its significance within the tobit models, but did not change its sign.
26

Control variables SIZE & D PUBLIC Bank category
Model A.1* A.2* B.1* B.2*(Probit) (Tobit) (Probit) (Tobit)
dependent variable D GBR GBRTA D GBR GBRTA
SIZE 0.588*** 0.137***(β1) (0.072) (0.018)D PUBLIC -1.058*** -0.277***(β2) (0.188) (0.066)
NPL -0.057*** -0.022*** -0.062*** -0.023***(β3) (0.013) (0.004) (0.012) (0.004)TIER1 -0.093*** -0.019*** -0.132*** -0.026***(β4) (0.021) (0.007) (0.021) (0.007)D 340f 0.316* 0.026 0.287* -0.009(β5) (0.162) (0.056) (0.0168) (0.057)D IFRS -0.999*** -0.699*** -0.696** -0.681***(β6) (0.334) (0.078) (0.302) (0.076)ROA -0.170*** -0.065*** -0.153** -0.063***(β7) (0.065) (0.020) (0.062) (0.020)
SmallCredits -5.786*** -1.881***(β8) (0.653) (0.225)Thrifts -6.347*** -1.965***(β9) (0.630) (0.210)Coops -5.923*** -1.777***(β10) (0.630) (0.205)
1996 0.685*** 0.148* 0.734*** 0.156**(β11) (0.224) (0.076) (0.227) (0.075)1997 0.887*** 0.189** 0.979*** 0.209***(β12) (0.226) (0.076) (0.230) (0.076)1998 1.257*** 0.308*** 1.400*** 0.340***(β13) (0.222) (0.073) (0.227) (0.073)1999 1.504*** 0.385*** 1.692*** 0.432***(β14) (0.225) (0.073) (0.234) (0.072)2000 1.847*** 0.490*** 2.035*** 0.544***(β15) (0.233) (0.071) (0.242) (0.071)2001 2.106*** 0.597*** 2.316*** 0.658***(β16) (0.242) (0.071) (0.249) (0.071)2002 2.426*** 0.708*** 2.651*** 0.775***(β17) (0.250) (0.071) (0.253) (0.071)2003 3.700*** 1.179*** 3.896*** 1.248***(β18) (0.282) (0.068) (0.269) (0.069)2004 4.231*** 1.361*** 4.430*** 1.435***(β19) (0.300) (0.069) (0.278) (0.069)2005 4.696*** 1.527*** 4.902*** 1.604***(β20) (0.318) (0.069) (0.287) (0.069)2006 5.747*** 1.961*** 5.938*** 2.043***(β21) (0.364) (0.070) (0.311) (0.070)2007 6.595*** 2.317*** 6.785*** 2.405***(β22) (0.403) (0.072) (0.332) (0.072)
Observations (Total) 32,023 32,023 32,023 32,023Observations = 0 29,218 29,218AUR value 0.860 0.853
Standard errors in brackets. *** p<0.01, ** p<0.05, * p<0.1
Table 8: Coefficients of random effects models.
27

ing changes.29 The positive signs concerning ROA produced by the pooled models
show that banks with high ROA tend to be the ones that build high levels of GBR
reserves and vice versa. However, the opposite signs produced by the panel regres-
sions indicate that within banks an increase in ROA over time is accompanied by
a decrease in GBR reserves. Further investigation of this issue delivered the insight
that the variance of ROA is much larger between than within banks. This finding
may explain why it is reasonable to observe the coefficient of ROA turning from
positive to negative.
A similar line of argument holds for D IFRS . Among banks, we observe that IFRS
banks tend to build a higher level of GBR reserves. However, the panel regression
indicates that within those banks GBR reserves are primarily used in years pre-
IFRS. Moreover, since the vast majority of German banks still exclusively adheres
to HGB accounting and since institutions that adopted IFRS at one point in time
did not reverse this decision later on, there are only very few changes to the variable
D IFRS . In other words, D IFRS can be considered to be (nearly) constant over
time. This characteristic may make the variable somewhat vulnerable in the context
of a random effects panel regression.
29 Based on economic considerations, we feel comfortable making the crucial (but untestable) assumption thatthe unobservable effect is orthogonal to all regressors. Note that it is not possible to test for the absence ofcorrelation with the unobservable effect and thus to control for the appropriateness of applying a random effectsmethodology.
28

6 Conclusion
Banks with a profitable business have several instruments at their disposal to set
aside money to cover their general risks and also to keep money in the bank for
funding further investments. Apart from earnings retention or raising new equity,
German banks may deliberately undervalue certain assets to create hidden reserves
according to section 340f HGB or declare visible reserves, i.e. reserves for general
banking risks according to section 340g HGB. From an information and agency
perspective, management should take into account the following aspects in making
a decision:
• Hidden reserves are the method of choice because managers gain some discretion
in earnings management. However, such reserves are not allowed under IFRS
accounting. Moreover, unlike the three other options, 340f reserves merely con-
stitute tier 2, not tier 1 regulatory capital. Therefore, weakly capitalized banks
should be more likely to use GBR reserves than IFRS banks.
• Nevertheless, GBR reserves may also be used as a signal of strength. In that
sense, fairly well capitalized and profitable banks should be more likely to use
GBR reserves instead of or in addition to hidden reserves.
• Using GBR reserves may be interpreted as a bad signal stemming from in-
creased visible risk provisioning. In addition, the use of these reserves may be
a consequence of the management’s fear that owners will not supply capital for
future investments: without management’s decision to increase GBR reserves,
it would be at the owners’ discretion whether to leave earnings in the bank
for future investments or to distribute them, as dividends say. The negative
signal is less relevant for banks which have some other way of demonstrating
their good standing, particularly a very small probability of default. Therefore,
banks subject to public law should be more likely to make use of GBR reserves
due to their public guarantees. The same holds for large institutions if the ’Too
Big To Fail’ presumption holds true. Furthermore, both negative signals be-
come less relevant the more frequently they are sent by banks. Therefore we
would expect the number of institutions using GBR reserves to rise over time.
• The theory of corporate governance and control predicts that banks with a
small number of shareholders are monitored more closely than those with a large
number of shareholders. Since banks subject to public law are generally owned
by just a few cities or municipalities, they are likely to be closely controlled.
This may induce their managers to use hidden reserves instead of visible ones
and thus offset the effect described above.
29

Our empirical analysis of the German banking market, including 32,023 bank-year
observations for the period 1995 through 2007, applies probit and tobit models in
terms of pooled as well as random effects panel estimation techniques. We arrived
at the following statistically significant results:
• Larger banks are more likely to use GBR reserves and tend to hold higher
levels than smaller ones. The same is true of banks with low regulatory capital
endowment and banks already using hidden 340f reserves.
• Banks that are subject to public law make use of GBR reserves less often and
also to a smaller extent. The same holds for high-risk banks, meaning those
with relatively high non-performing loan ratios.
• The pooled regression analysis indicates that banks with higher levels of return
on assets tend to build GBR reserves more often and to a greater extent. How-
ever, our random effects models show that an increase in profitability within
banks over time is accompanied by a decrease in the probability and extent of
building GBR reserves.
• Among banks we observe that IFRS banks are more likely to use GBR reserves
and tend to hold higher levels. However, the panel regressions indicate that
within those banks GBR reserves are primarily used in years pre-IFRS.
• Even when controlling for all other factors, the general use of GBR reserves as
well as their ratio to total assets increases, almost strictly monotonically, over
time.
Agency issues are still sometimes seen as a fairly theoretical concept. However, the
present study is another contribution demonstrating that they may yield highly
relevant predictions. Their robustness deserves further attention. Moreover, looking
at reserves building in banks as a joint decision-making process with respect to
visible GBR and hidden 340f reserves may yield interesting results. Further research
is therefore needed to explicitly take this into account too.
30
References
Ahmed, A. S./ Takeda, C./ Thomas, S. (1999): Bank Loan Loss Provisions:
A Reexamination of Capital Management, Earnings Management and Signaling
Effects, Journal of Accounting and Economics, Vol. 28, pp. 1-25.
Anandarajan, A./ Hasan, I./ McCarthy, C. (2007): The Use of Loan Loss
Provisions for Capital Management, Earnings Management and Signalling by Aus-
tralian Banks, Journal of Accounting & Finance, Vol. 47, pp. 357-379.
Basel Committee on Banking Supervision (BCBS) (2006): Basel II: Inter-
national Convergence of Capital Measurement and Capital Standards: A Revised
Framework - Comprehensive Version, Basel.
Bauer, W. D. (1987): Die EG-Bankbilanzrichtlinie und ihre Auswirkungen
auf die Bilanzierungsvorschriften der deutschen Kreditinstitute, Zeitschrift fur
Wirtschafts- und Bankrecht, pp. 861-868.
Beaver, W. H./ Demski, J. S. (1979): The Nature of Income Measurement,
The Accounting Review, Vol. 54, pp. 38-46.
Benartzi, S./ Michaely, R./ Thaler, R. (1997): Do Changes in Dividends
Signal the Future or the Past?, Journal of Finance, Vol. 52, pp. 1007-1034.
Bhat, V. N. (1996): Banks and Income Smoothing, Applied Financial Economics,
Vol. 6, pp. 505-510.
Christensen, J. A./ Demski, J. S. (2003): Accounting Theory: An Information
Content Perspective, New York et al.
Docking, D. S./ Hirschey, M./ Jones, E. (1997): Information and Contagion
Effects of Bank Loan-Loss Reserve Announcements, Journal of Financial Eco-
nomics, Vol. 43, pp. 219-239.
Emmerich, G./ Reus, P. (1995): Zur Vorsorge fur ’allgemeine Bankrisiken’:
Handelsrechtliche Gestaltungswahlrechte und okonomische Implikationen, IFBG-
Studien, Gottingen.
European Commission (1986): Council Directive 86/635/EEC
of 8 December 1986 on the annual accounts and consolidated
accounts of banks and other financial institutions, http://eur-
lex.europa.eu/LexUriServ/LexUriServ.do?uri=CELEX:31986L0635:EN:HTML,
(2008/01/31).
Fawcett, T. (2006): An Introduction to ROC Analysis, Pattern Recognition Let-
ters, Vol. 27, pp. 861-874.
31

FDIC (1997): An Examination of the Banking Crises of the 1980s and Early 1990s,
Washington D.C.
Flach, P./ Blockeel, H./ Ferri, C./ Hernandez-Orallo, J./ Struyf, J.
(2003): Decision Support for Data Mining: An Introduction to ROC Analysis
and its Applications, in: Mladenic, D./ Lavrac, N./ Bohanec, M./ Moyle, S.: Data
Mining and Decision Support: Integration and Collaboration, Kluwer, pp. 81-90.
Flannery, Mark J./ Kwan, S. H./ Nimalendran, M. (2004): Market Evidence
on the Opaqueness of Banking Firms’ Assets, Journal of Financial Economics, Vol.
71, pp. 419-460.
Fonseca, A. R./ Gonzalez, F. (2008): Cross-country determinants of bank in-
come smoothing by managing loan loss provisions, Journal of Banking & Finance,
Vol. 32, pp. 217-228.
Grammatikos, T./ Saunders, A. (1990): Additions to Bank Loan-Loss Re-
serves: Good News or Bad News?, Journal of Monetary Economics, Vol. 25,
pp. 289-304.
Greenawalt M./ Sinkey, J. (1988): Bank Loan-Loss Provisions and the Income-
Smoothing Hypothesis: An Empirical Analysis, Journal of Financial Services Re-
search, Vol. 1, pp. 301-318.
Healy, P. M./ Palepu, K. O. (1988): Earnings Information Conveyed by Divi-
dend Initiations and Omissions, Journal of Financial Economics, Vol. 21, pp. 149-
175.
Ianotta, G. (2006): Testing for Opaqueness in the European Banking Industry:
Evidence from Bond Credit Ratings, Journal of Financial Services Research, Vol.
30, pp. 287-309.
Kanagaretnam, K./ Lobo, G. J./ Yang, D. H. (2004): Joint Tests of Signal-
ing and Income Smoothing through Bank Loan-Loss Provisions, Contemporary
Accounting Research, Vol. 21, pp. 843-884.
Krumnow, J./ Sprißler, W./ Bellavite-Hovermann, Y./ Kemmer, M./
Alves, S./ Brutting, C./ Lauinger, R. H./ Low, E./ Naumann, T. K./
Paul, S./ Pfitzer, N./ Scharpf, P. (2004): § 340g HGB: Sonderposten fur all-
gemeine Bankrisiken, in: Rechnungslegung der Kreditinstitute – Kommentar zum
deutschen Bilanzrecht unter Berucksichtigung von IAS/IFRS, 2nd ed., Stuttgart,
pp. 604-609.
Levine, R. (2004): The Corporate Governance of Banks: A Concise Discussion of
Concepts and Evidence, The Certified Accountant, pp. 843-884.
32

Laeven, L./ Majnoni, G. (2003): Loan Loss Provisioning and Economic Slow-
downs: Too Much, Too Late?, Journal of Financial Intermediation, Vol. 12,
pp. 178-197.
Lintner, J. (1956): Distribution of Incomes of Corporations among Dividends,
Retained Earnings, and Taxes, The American Economic Review, Vol. 46, pp. 97-
113.
Lobo, G. J./ Yang, D.-H. (2001): Bank Managers´ Heterogeneous Decisions
on Discretionary Loan Loss Provisions, Review of Quantitative Finance and Ac-
counting, Vol. 3, pp. 223-250.
Madura, J./ McDaniel, W. R. (1989): Market Reaction to Increased Loan Loss
Reserves at Money-Center Banks, Journal of Financial Services Research, Vol. 3,
pp. 359-369.
Morgan, D. P. (2002): Rating Banks: Risk and Uncertainty in an Opaque Indus-
try, American Economic Review, Vol. 92, pp. 874-888.
Myers, S. C. (1984): The Capital Structure Puzzle, Journal of Finance, Vol. 39,
pp. 147-175.
Myers, S. C./ Majluf, N. S. (1984): Corporate Financing and Investment De-
cisions when Firms Have Information the Investors Do not Have, Journal of Fi-
nancial Economics, Vol. 13, pp. 187-221.
Scheiner, J. H. (1981): Income Smoothing: An Analysis in the Banking Industry,
Journal of Bank Research, Vol. 12, pp. 119-123.
Shrieves, R. E./ Dahl, D. (2003): Discretionary accounting and the behavior
of Japanese banks under financial duress, Journal of Banking & Finance, Vol. 27,
pp. 1219-1243.
Tobin, J. (1958): Estimation of Relationships for Limited Dependent Variables,
Econometrica, Vol. 26, pp. 24-36.
Wagener, H./ Bocking, H.-J./ Freiling, A./ Ernsting, I./ Fitzner, V.
(1995): Banken und Bankkonzerne in Deutschland: Jahresabschlusse 1993,
Dusseldorf.
Wall, L. D./ Koch, T. W. (2000): Bank Loan-Loss Accounting: A Review of
Theoretical and Empirical Evidence, Federal Reserve Bank of Atlanta Economic
Review, Second Quarter 2000, Atlanta.
Waschbusch, G. (1994): Die bankspezifische offene Risikovorsorge des § 340g
HGB, Die Bank, pp. 166-168.
33

34
The following Discussion Papers have been published since 2008:
Series 1: Economic Studies
01 2008 Can capacity constraints explain asymmetries of the business cycle? Malte Knüppel
02 2008 Communication, decision-making and the optimal degree of transparency of monetary policy committees Anke Weber
03 2008 The impact of thin-capitalization rules on Buettner, Overesch multinationals’ financing and investment decisions Schreiber, Wamser
04 2008 Comparing the DSGE model with the factor model: an out-of-sample forecasting experiment Mu-Chun Wang
05 2008 Financial markets and the current account – Sabine Herrmann emerging Europe versus emerging Asia Adalbert Winkler
06 2008 The German sub-national government bond Alexander Schulz market: evolution, yields and liquidity Guntram B. Wolff
07 2008 Integration of financial markets and national Mathias Hoffmann price levels: the role of exchange rate volatility Peter Tillmann
08 2008 Business cycle evidence on firm entry Vivien Lewis
09 2008 Panel estimation of state dependent adjustment when the target is unobserved Ulf von Kalckreuth
10 2008 Nonlinear oil price dynamics – Stefan Reitz a tale of heterogeneous speculators? Ulf Slopek
11 2008 Financing constraints, firm level adjustment of capital and aggregate implications Ulf von Kalckreuth

35
12 2008 Sovereign bond market integration: Alexander Schulz the euro, trading platforms and globalization Guntram B. Wolff
13 2008 Great moderation at the firm level? Claudia M. Buch Unconditional versus conditional output Jörg Döpke volatility Kerstin Stahn
14 2008 How informative are macroeconomic risk forecasts? An examination of the Malte Knüppel Bank of England’s inflation forecasts Guido Schultefrankenfeld
15 2008 Foreign (in)direct investment and corporate taxation Georg Wamser
16 2008 The global dimension of inflation – evidence Sandra Eickmeier from factor-augmented Phillips curves Katharina Moll
17 2008 Global business cycles: M. Ayhan Kose convergence or decoupling? Christopher Otrok, Ewar Prasad
18 2008 Restrictive immigration policy Gabriel Felbermayr in Germany: pains and gains Wido Geis foregone? Wilhelm Kohler
19 2008 International portfolios, capital Nicolas Coeurdacier accumulation and foreign assets Robert Kollmann dynamics Philippe Martin
20 2008 Financial globalization and Michael B. Devereux monetary policy Alan Sutherland
21 2008 Banking globalization, monetary Nicola Cetorelli transmission and the lending channel Linda S. Goldberg
22 2008 Financial exchange rates and international Philip R. Lane currency exposures Jay C. Shambaugh

36
23 2008 Financial integration, specialization F. Fecht, H. P. Grüner and systemic risk P. Hartmann
24 2008 Sectoral differences in wage freezes and Daniel Radowski wage cuts: evidence from a new firm survey Holger Bonin
25 2008 Liquidity and the dynamic pattern of Ansgar Belke price adjustment: a global view Walter Orth, Ralph Setzer
26 2008 Employment protection and Florian Baumann temporary work agencies Mario Mechtel, Nikolai Stähler
27 2008 International financial markets’ influence on the welfare performance of alternative exchange rate regimes Mathias Hoffmann
28 2008 Does regional redistribution spur growth? M. Koetter, M. Wedow
29 2008 International financial competitiveness and incentives to foreign direct investment Axel Jochem
30 2008 The price of liquidity: bank characteristics Falko Fecht and market conditions Kjell G. Nyborg, Jörg Rocholl
01 2009 Spillover effects of minimum wages Christoph Moser in a two-sector search model Nikolai Stähler
02 2009 Who is afraid of political risk? Multinational Iris Kesternich firms and their choice of capital structure Monika Schnitzer
03 2009 Pooling versus model selection for Vladimir Kuzin nowcasting with many predictors: Massimiliano Marcellino an application to German GDP Christian Schumacher

37
04 2009 Fiscal sustainability and Balassone, Cunha, Langenus policy implications for the euro area Manzke, Pavot, Prammer Tommasino
05 2009 Testing for structural breaks Jörg Breitung in dynamic factor models Sandra Eickmeier
06 2009 Price convergence in the EMU? Evidence from micro data Christoph Fischer
07 2009 MIDAS versus mixed-frequency VAR: V. Kuzin, M. Marcellino nowcasting GDP in the euro area C. Schumacher
08 2009 Time-dependent pricing and New Keynesian Phillips curve Fang Yao
09 2009 Knowledge sourcing: Tobias Schmidt legitimacy deficits for MNC subsidiaries? Wolfgang Sofka
10 2009 Factor forecasting using international targeted predictors: the case of German GDP Christian Schumacher
11 2009 Forecasting national activity using lots of international predictors: an application to Sandra Eickmeier New Zealand Tim Ng
12 2009 Opting out of the great inflation: Andreas Beyer, Vitor Gaspar German monetary policy after the Christina Gerberding breakdown of Bretton Woods Otmar Issing
13 2009 Financial intermediation and the role Stefan Reitz of price discrimination in a two-tier market Markus A. Schmidt, Mark P. Taylor
14 2009 Changes in import pricing behaviour: the case of Germany Kerstin Stahn

38
15 2009 Firm-specific productivity risk over the Ruediger Bachmann business cycle: facts and aggregate implications Christian Bayer
16 2009 The effects of knowledge management Uwe Cantner on innovative success – an empirical Kristin Joel analysis of German firms Tobias Schmidt
17 2009 The cross-section of firms over the business Ruediger Bachmann cycle: new facts and a DSGE exploration Christian Bayer
18 2009 Money and monetary policy transmission in the euro area: evidence from FAVAR- and VAR approaches Barno Blaes
19 2009 Does lowering dividend tax rates increase dividends repatriated? Evidence of intra-firm Christian Bellak cross-border dividend repatriation policies Markus Leibrecht by German multinational enterprises Michael Wild
20 2009 Export-supporting FDI Sebastian Krautheim
21 2009 Transmission of nominal exchange rate changes to export prices and trade flows Mathias Hoffmann and implications for exchange rate policy Oliver Holtemöller
22 2009 Do we really know that flexible exchange rates facilitate current account adjustment? Some new empirical evidence for CEE countries Sabine Herrmann
23 2009 More or less aggressive? Robust monetary Rafael Gerke policy in a New Keynesian model with Felix Hammermann financial distress Vivien Lewis
24 2009 The debt brake: business cycle and welfare con- Eric Mayer sequences of Germany’s new fiscal policy rule Nikolai Stähler

39
25 2009 Price discovery on traded inflation expectations: Alexander Schulz Does the financial crisis matter? Jelena Stapf
26 2009 Supply-side effects of strong energy price Thomas A. Knetsch hikes in German industry and transportation Alexander Molzahn
27 2009 Coin migration within the euro area Franz Seitz, Dietrich Stoyan Karl-Heinz Tödter
40
Series 2: Banking and Financial Studies
01 2008 Analyzing the interest rate risk of banks using time series of accounting-based data: O. Entrop, C. Memmel evidence from Germany M. Wilkens, A. Zeisler
02 2008 Bank mergers and the dynamics of Ben R. Craig deposit interest rates Valeriya Dinger
03 2008 Monetary policy and bank distress: F. de Graeve an integrated micro-macro approach T. Kick, M. Koetter
04 2008 Estimating asset correlations from stock prices K. Düllmann or default rates – which method is superior? J. Küll, M. Kunisch
05 2008 Rollover risk in commercial paper markets and firms’ debt maturity choice Felix Thierfelder
06 2008 The success of bank mergers revisited – Andreas Behr an assessment based on a matching strategy Frank Heid
07 2008 Which interest rate scenario is the worst one for a bank? Evidence from a tracking bank approach for German savings and cooperative banks Christoph Memmel
08 2008 Market conditions, default risk and Dragon Yongjun Tang credit spreads Hong Yan
09 2008 The pricing of correlated default risk: Nikola Tarashev evidence from the credit derivatives market Haibin Zhu
10 2008 Determinants of European banks’ Christina E. Bannier engagement in loan securitization Dennis N. Hänsel
11 2008 Interaction of market and credit risk: an analysis Klaus Böcker of inter-risk correlation and risk aggregation Martin Hillebrand

41
12 2008 A value at risk analysis of credit default swaps B. Raunig, M. Scheicher
13 2008 Systemic bank risk in Brazil: an assessment of correlated market, credit, sovereign and inter- bank risk in an environment with stochastic Theodore M. Barnhill, Jr. volatilities and correlations Marcos Rietti Souto
14 2008 Regulatory capital for market and credit risk inter- T. Breuer, M. Janda ka action: is current regulation always conservative? K. Rheinberger, M. Summer
15 2008 The implications of latent technology regimes Michael Koetter for competition and efficiency in banking Tigran Poghosyan
16 2008 The impact of downward rating momentum André Güttler on credit portfolio risk Peter Raupach
17 2008 Stress testing of real credit portfolios F. Mager, C. Schmieder
18 2008 Real estate markets and bank distress M. Koetter, T. Poghosyan
19 2008 Stochastic frontier analysis by means of maxi- Andreas Behr mum likelihood and the method of moments Sebastian Tente
20 2008 Sturm und Drang in money market funds: Stehpan Jank when money market funds cease to be narrow Michael Wedow
01 2009 Dominating estimators for the global Gabriel Frahm minimum variance portfolio Christoph Memmel
02 2009 Stress testing German banks in a Klaus Düllmann downturn in the automobile industry Martin Erdelmeier
03 2009 The effects of privatization and consolidation E. Fiorentino on bank productivity: comparative evidence A. De Vincenzo, F. Heid from Italy and Germany A. Karmann, M. Koetter

42
04 2009 Shocks at large banks and banking sector Sven Blank, Claudia M. Buch distress: the Banking Granular Residual Katja Neugebauer
05 2009 Why do savings banks transform sight deposits into illiquid assets less intensively Dorothee Holl than the regulation allows? Andrea Schertler
06 2009 Does banks’ size distort market prices? Manja Völz Evidence for too-big-to-fail in the CDS market Michael Wedow
07 2009 Time dynamic and hierarchical dependence Sandra Gaisser modelling of an aggregated portfolio of Christoph Memmel trading books – a multivariate nonparametric Rafael Schmidt approach Carsten Wehn
08 2009 Financial markets’ appetite for risk – and the challenge of assessing its evolution by risk appetite indicators Birgit Uhlenbrock
09 2009 Income diversification in the Ramona Busch German banking industry Thomas Kick
10 2009 The dark and the bright side of liquidity risks: evidence from open-end real estate funds in Falko Fecht Germany Michael Wedow
11 2009 Determinants for using visible reserves Bornemann, Homölle in German banks – an empirical study Hubensack, Kick, Pfingsten

43
Visiting researcher at the Deutsche Bundesbank
The Deutsche Bundesbank in Frankfurt is looking for a visiting researcher. Among others under certain conditions visiting researchers have access to a wide range of data in the Bundesbank. They include micro data on firms and banks not available in the public. Visitors should prepare a research project during their stay at the Bundesbank. Candidates must hold a PhD and be engaged in the field of either macroeconomics and monetary economics, financial markets or international economics. Proposed research projects should be from these fields. The visiting term will be from 3 to 6 months. Salary is commensurate with experience.
Applicants are requested to send a CV, copies of recent papers, letters of reference and a proposal for a research project to:
Deutsche Bundesbank PersonalabteilungWilhelm-Epstein-Str. 14
60431 Frankfurt GERMANY
