determinants and price discovery of china … determinants and price discovery of china sovereign...
TRANSCRIPT
1
Determinants and Price Discovery of China Sovereign Credit Default Swaps
Thomas Eyssell College of Business Administration
University of Missouri-St. Louis One University Blvd St. Louis, MO 63121
Tel: 314-516-5625; Fax: (314) 516-6420 Email: [email protected]
Hung-Gay Fung College of Business Administration &
Center of International Studies University of Missouri-St. Louis
One University Blvd St. Louis, MO 63121
Tel: (314) 516-6374; Fax: (314) 516-6420 Email: [email protected]
Gaiyan Zhang
College of Business Administration University of Missouri-St. Louis
One University Blvd St. Louis, MO 63121
Tel: (314) 516-6269; Fax: (314) 516-6420 Email: [email protected]
2
Determinants and Price Discovery of China Sovereign
Credit Default Swaps
Abstract
We study the determinants of levels and changes of sovereign credit default swap (CDS) spreads in China from January 2001 to December 2010. Both country-specific factors (such as the China stock market index and the real interest rate) and global factors (the U.S. S&P 500 stock option volatilities and default spreads, and the non-North America global stock market factor) have significant explanatory power on CDS spreads in terms of both level and in changes. China’s domestic economic factors were more relevant in explaining the CDS spread levels and changes in the earlier years, while the impact of global factors has become increasingly important in recent years, particularly during the global crisis. Within a vector autoregressive (VAR) model controlling for exogenous variables, we find that China sovereign CDS spread changes lead stock returns. Keywords: China sovereign credit default swaps, determinants of levels and changes, and lead-lag relationship. JEL: C12, F36, G15
3
Determinants and Price Discovery of China Sovereign
Credit Default Swaps
1. Introduction
For the past three decades, the Chinese national economy has demonstrated
impressive economic growth, and has now surpassed Japan to become the second largest
economy in the world. The substantial economic growth of China has been attributed in large
part to the results of market-oriented economic reforms from a socialist regime started in late
1978. As China has opened up to the world, it is likely that its economy has become more
closely linked to global economic forces, and the market prices of its securities better
indicators of their underlying values. We seek to determine whether, as a result, the country
default risk can now be priced better and measured more accurately than before.
One approach to measuring the default risk of a country is by analyzing the pricing of
its sovereign credit default swap (CDS). The sovereign CDS market has become important
in more recent years globally, especially for emerging countries where sovereign risk is an
important indicator to foreign investors in assessing risks of their foreign direct investment
and portfolio investments.
In this paper, we have two objectives. First, we investigate the determinants of China
sovereign credit default swap spreads. Second, we investigate the price discovery role of
China’s sovereign CDS on its stock market movements. The results enable us to better
understand factors underlying observed CDS behaviors in China and the extent to which the
Chinese economy is integrated with the world economy. In particular, we conduct both level
analysis and changes of default swap premiums on key variables suggested by economic
theory.
4
The credit default swap is the simplest type of credit derivatives that offer protection
against the credit or default risk of bonds or other types of loan arrangements. The CDS
buyer makes periodic payments to the protection seller over the life of the swap contract in
exchange for compensation if default or some other credit event specified in the contract
occurs. In a well-functioning financial market, the price of the CDS (i.e., the CDS spread)
reflects the riskiness of the underlying event. As noted by Mengle (2007): “After inception,
the value of the CDS will depend mostly on changes in credit quality as reflected in current
credit spreads.” (p. 14) And, with respect to the protection offered, several authors have
noted the insurance-like aspect of credit default swaps (Gibson 2007; Nelken 1999; and Tett
2006). This characteristic of credit default swaps is apparent in view of the relative spreads
observed on instruments associated with the so-called ‘BRIC’ (Brazil, Russia, India and
China) countries:
“ Japan’s five-year credit default swaps-insurance that bond traders buy against the risk of default-are trading at just over 100 basis points, meaning it costs $10,160 a year to insure $1 million of Japanese government debt for five years . . . Insuring the same amount of Ireland’s debt costs $61,600 a year.” Bloomberg BusinessWeek March 28-April 3, 2011, p. 15
This new class of assets is designed to trade credit risk on a variety of corporate and
sovereign names with a wide range of maturities.
The CDS was an important financial innovation in the late 1990s and the credit
derivatives market has experienced phenomenal growth since then. At the end of 1996 the
CDS market size was only around $40 billion in nominal value. By the end of 2007, the
nominal value of all outstanding CDS contracts had reached $62.2 trillion. After the financial
5
crisis in 2008, the outstanding CDS notional amount shrank to $31.22 trillion as of mid-2009
due to market consolidation.
The credit derivatives market is primarily comprised of two sectors: the corporate
sector, accounting for 80% of the market, and the sovereign sector, accounting for 20% of the
market and mostly composed of credit derivatives on emerging sovereign bonds.1 The most
active participants in the credit derivatives market include banks, insurance companies,
pension funds, hedge funds and other asset managers.
The increased attention to hedging emerging market sovereign risk has fueled the
evolution of the sovereign credit derivative markets. Similarly, other derivatives on hedging
the Chinese currency are also available. For example, RMB futures contracts are based on the
relationship between the U.S. dollar and the Chinese renminbi and are traded at the Chicago
Mercantile Exchange (CME) Group in the U.S., while the non-delivery forward contracts are
actively traded in the U.S., Hong Kong, and Singapore (Fung, Leung and Zhu 2004). The
emerging credit derivatives market took off during the second half of 1997. In particular,
there is an active broker market for China’s sovereign CDS. While the debate around the
transparency issue and counterparty risk associated with CDS has yet to settle, the number of
studies regarding the valuation and information content of CDSs continue to grow.
The Merton-type structural model links the prices of credit instruments directly to the
main determinants of the likelihood and severity of default, including financial leverage,
volatility, and the risk-free interest rate term structure (Merton 1974). Collin-Dufresne,
Goldstein, and Martin (2001) find these variables useful in regressions for changes in
1 The National Association of Financial Market Institutional Investors backed by the People’s Bank of China started a trial of a new credit-mitigation derivative product like a credit default swap to help domestic investors buy and sell insurance against potential credit risks in China in October 2010 (Wall Street Journal, October 29, 2010).
6
corporate credit spreads. Ericsson, et al. (2009) find that leverage, volatility, and the riskless
rate are important determinants of corporate CDS premiums. The explanatory power of the
theoretical variables for levels of default swap premiums is approximately 60%. The
explanatory power for the differences in the premium is approximately 23%. Chan-Lau and
Kim (2004) explain how Merton’s theory of firm can be extended to sovereign countries. In
an analogous way, a country’s default risk should be inversely related to stock prices. If the
relationship between CDS spreads and stock prices does not hold, capital structure arbitrage
should eliminate mispricing.
Our benchmark results focus on determinants of China’s sovereign CDS spread for
the period extending from January, 2001 to December, 2010. We examine how domestic
factors such as China’s stock market returns and volatility, the real interest rate, the ratio of
debts to GDP and global factors such as VIX, term structure slope, default spread and a
financial shock dummy variable affect the behavior of CDS spreads. We run regressions on
levels in CDS spread as well as for the changes of the spread. We find that both country-
specific factors and global factors are important determinants of China’s sovereign CDS. In
particular, the China stock market index, the real interest rate, the U.S. S&P 500 stock option
volatilities, default spreads, non-North America global stock market, and the financial crisis
dummy have substantial explanatory power in explaining both levels and changes of CDS
spreads. We further split the sample to two sub-periods. Country factors appear to be more
important than global factors to explain the CDS spread levels and changes in the earlier
years, while global factors have become increasingly important in recent years, particularly
during the global crisis.
7
Our second objective is to examine the extent of price discovery of China sovereign
CDS spreads on the stock market price and the other way around. Most studies on credit
default swaps focus on corporate CDS and they reveal that CDS prices lead stock prices
during credit deterioration episodes at the firm and portfolio levels (Zhang, 2009; Fung, et
al., 2008). These CDS are either firm specific CDS or are indices that are compiled from
firms. By nature, the sovereign CDS spread is a measure on a country’s aggregate financial
health and is supposed to compensate investors in this financial instrument for bearing
sovereign default risk of a country. This should be driven by a country’s economic
fundamentals. A country’s stock market has long been viewed as its economic barometer. A
bearish or highly volatile stock market conveys a negative message to investors on the
country’s economic fundamentals. Therefore, we expect that China’s CDS market leads the
stock market. On the other hand, the stock market has “home” advantage and should
incorporate more quickly information on macroeconomic conditions and micro-level firm
fundamentals. The efficient market hypothesis implies that the stock market leads the CDS
market.
Our paper is closely related to Chan-Lau and Kim (2004), who examine the dynamic
relationship between emerging market CDS spreads, bond spreads, and stock prices for eight
emerging markets. Norden and Weber (2009) and Zhu (2006) examine the relationship
between corporate CDS spreads, bond spreads and stock prices, but their focus is on
corporate CDS. Fung, et al. (2008) examine the lead-lag relationship between the U.S. CDS
and stock markets at the portfolio level, and find mutual feedback between the high-yield
CDS and stock markets. Chan, Fung, and Zhang (2009) analyze the relationship of sovereign
CDS and stock market returns for Asian countries. Hilscher and Nosbusch (2010) examine

8
the determinants of J.P. Morgan’s Emerging Market Bond Index (EMBI) for a set of 31
emerging market countries from 1994 to 2007 at the annual frequency. They find that the
volatility of terms of trade in particular has a statistically and economically significant effect
on spreads. Our study is in the same spirit of Hilscher and Nosbusch (2010) and extends the
analysis by Chan, Fung, and Zhang (2009), and Chan-Lau and Kim (2004), who use
sovereign CDS in their analyses.
We examine the feedbacks between CDS spreads and the stock market so their
relationship can be better understood. To this end, we use a vector autoregressive (VAR)
system controlling for exogenous variables. We find that the CDS spread changes leads stock
returns, but not the other way around. The leading role of the CDS market is likely due to
fewer restrictions, broader investor base, and greater information advantage in the CDS
market, while the domestic stock market is relatively inefficient in processing information
because of market impediments.
Our study contributes to the literature in several ways. First, we use sovereign China
CDS to examine the determinants of CDS in both level and changes with a structural break.
Our study is the first one that provides this kind of analysis for Chinese research. The results
show that the differential effects of the underlying variables on the CDS behavior across
periods, implying the importance of structural breaks. Second, we find the growing
importance of global factors on China’s sovereign CDS. In recent periods, the global factors
on China’s CDS appear to dominate the country factors, implying that China’s CDS market
is well integrated with the global force. Finally, we show that CDS has predictive power on
China’s stock market return using the Granger-causality test. Additional analysis using a
vector autoregressive (VAR) model indicates the CDS has over 2% predictability on China’s
9
stock market return using variance decomposition analysis beyond one day. The impulse
response analysis shows that China’s stock market responds to CDS shocks in a day.
The remainder of the paper is organized as follows. Section 2 describes the research
issue and Section 3 discusses the data. Section 4 presents the empirical results on the
fundamental factors that are expected to explain CDS spreads and changes of spreads in
regression analysis. We also examine price discovery of the CDS spreads and stock market
prices within a VAR framework. The final section is the conclusion.
2. The Research Issue
2.1 Determinants of China’s Sovereign CDS Spread
The corporate CDS allows the transfer and management of credit risks. The purchase
of a CDS is equivalent to shorting credit risk on the credit market (bond/loan market). Selling
a CDS is equivalent to having a long exposure on the credit market. The market price of the
CDS (i.e., CDS premium/spread) reflects the risk of the underlying credit.
Sovereign CDS provides an ideal platform to gauge market views on a country’s
default risk. According to Merton-type theory, which takes a balance sheet approach to
examining the relationship between equity and debt, a firm’s liabilities constitute a barrier
point for the value of its assets. If the value of a firm’s assets falls below the face value of its
debt, the firm would default. Bond and equity prices are positively correlated, and the
correlation is stronger when default risk is a major concern. Thus the price relationship
between CDS spreads and equity prices should be negative. The premia on corporate bond
(or CDS) spread should be determined by leverage of the underlying firm, the volatility of the
underlying assets and the riskless spot interest rate.
10
In an analogous manner, the spread of a sovereign CDS should be determined by the
leverage of the country, the volatility of country’s assets (as proxied by stock market
volatility), and the interest rate. 2 The Merton model predicts that liabilities as a barrier point
for the value of its assets should be negatively related to the bond value. Thus, a country’s
debt-to-GDP ratio is expected to be positively related to the sovereign CDS price. The
volatilities of underlying assets should be negatively related to the bond value. Thus, we
expect a positive relationship between the volatility of a country’s total assets and the
sovereign CDS spread.
In addition to these two major factors developed in the Merton’s original model, other
country risk factors could also affect the default probabilities of a country’s external debt. In
particular, stock returns and real interest rate net of inflation reflect the real economic growth
or economic strength. It can be argued that a bullish stock market and higher real interest rate
signal stronger competitiveness of China and thus its default risk will be lowered.3 As CDS
pricing reflects default risk and a weaker economy, the real interest rate is expected to be
negatively related to CDS spreads.
Due to globalization and interdependence of economies, the integration of the China’s
economy and other countries has become increasingly stronger. The important economic
factors in the U.S. and other countries may also affect China’s sovereign risk. Prior studies
(e.g. Hilscher and Nosbusch (2010)) find global factors are important determinants of
emerging economies’ sovereign risk. Pan and Singleton (2008) find that the VIX is
statistically significant in explaining CDS spreads of Mexico, Turkey, and Korea. Therefore,
2 Chan-Lau and Kim (2004) justified extending the theory from a corporate to a sovereign issuer. 3 Kaplin, et al. (2009) report a negative relationship between the nominal interest rate and the default rate. In our analysis, we use the real interest rate, which is a better measure of returns to consumers in measuring the relationship between interest rate and default.
11
we expect that a more volatile financial markets, greater default risk premium, and lower
stock returns are positively related to the China’s CDS spread.
Empirically, we use the ratio of China’s external debt to GDP to proxy for the
country’s ability to repay foreign debts. We use the volatility of the Shanghai stock market
index returns as a measure of the volatility of the country’s asset value. In addition, we
measure country risk/competitiveness using the level of Shanghai stock market index returns
and the real interest rate calculated by applying China's 1-year deposit interest rate and
inflation rate consistent with the Fisher Effect.
To measure the global factors, we include U.S. stock implied volatility, the U.S.
default risk premium, the slope of U.S. term structure, and the non-North America financial
market index as additional explanatory variables for CDS movements.
Generally, it is harder to explain differences in CDS spreads than levels. Thus, a
regression in differences should provide a more stringent test of CDS spread determinants.
Following the spirit of Collins-Duffresne, et al. (2001), Ericsson, et al. (2009), and Hilscher
and Nosbbusch (2010), we try to estimate the effects of different determinants for China’s
CDS spreads. We also use both country and global factors as explanatory variables in our
regression analysis.
2.2 Equilibrium Relationships and Price Discovery of the China’s Sovereign CDS and
Stock Markets
The changes in sovereign default risk not only affect CDS spreads on the country, but
they may also affect the country’s equity prices. The relationship between the sovereign CDS
and equity markets, to a certain extent, resembles that between equity and bond prices in the
12
Merton (1974) framework. Typical firms fitting this bond-equity price pattern are those with
high debt-to-equity ratios and below investment-grade credit ratings. In other words, equity
prices convey useful information on sovereign risk when this risk is high (an out-of-the-
money situation faced by countries). Equity prices are less useful to gauge sovereign risk
when the risk is low (an in-the-money situation faced by countries), as equity prices are
affected more by factors other than default risk.
In practice, the link between the sovereign CDS market and the stock market could be
to the result of the capital structure arbitrage, which is one of the most recent hedge fund
strategies based on Merton’s theory. The strategy exploits the pricing inefficiency that exists
in the capital structure of the firm. In essence, the capital structure arbitrageur uses a Merton-
type structural model to compare the market CDS spread and the theoretical spread inferred
from the model. If the CDS spread is substantially larger than the predicted spread based on
stock prices, an arbitrageur can sell credit protection if he/she believes that the equity market
is right, or sell equity if he/she believes the CDS spread is right. In practice, the arbitrageur is
probably unsure whether the equity market or the CDS spread is right. Hence, the arbitrageur
does both strategies of selling credit protection and shorting equity. The theoretical relation
between the CDS spread and the equity price would prevail in the end, and the equity
position can cushion the loss of the CDS position, and vice versa (Yu 2006).
Similarly, the capital structure arbitrage strategy can also be applied to the sovereign
CDS market and the stock market. For example, when a country has a higher default risk, its
stock market performance will be adversely affected by deteriorating economic fundamentals
because a greater risk premium will be demanded by investors at home and abroad, or both.
Thus, the price of the country’s stock market would fall. When a country is in this situation,
13
buying insurance against its default becomes more expensive. Therefore, the CDS spread
would rise. Also, the demand for protection against the country’s potential default increases
as credit risk increases. This, in turn, causes further downward pressure on equity prices as
sellers of credit derivatives protection hedge their exposure by either shorting bonds, or
equity. Therefore, the stock market is expected to be negatively related to the sovereign CDS
spread.
The sovereign CDS market offers an ideal laboratory to explore the price discovery
embedded in default swap prices versus other economic indicators. Market practitioners
claim that the CDS market reacts first and faster to new information on credit risks as
compared to other financial instruments. Recent empirical studies appear to validate this
claim for corporate issuers in Europe and the United States. For instance, Blanco, Brennan,
and Marsh (2003) analyze a large panel of the U.S. and European corporate issuers and find
that CDS spreads lead bond spreads during credit-deterioration episodes. Longstaff, Mithal,
and Neis (2005) study a large sample of corporate issuers in the United States and found that
the CDS and equity markets contain distinct information. Using the CDX index, Fung, et al.
(2008) find that there exist two-way interactions between the U.S. stock index and the high-
yield CDX indices. However, the research on the price discovery function of the sovereign
CDS market is limited. Zhang (2003) finds that Argentina’s CDS predicts credit events in the
country well before the rating agencies, which had assigned over-generous ratings to the
Argentine debt, and the rating agencies lagged the credit market in downgrading the debt.
Chan-Lau (2004) find that there is mixed evidence for emerging market sovereign CDS.
3. Data

14
The China’s sovereign CDS market has become more liquid over years, as shown by
the number of market dealers. The greater demand for trading China CDS may reflect that
investors look to hedge their exposure to the sovereign and non-sovereign debts, and cross-
hedge their exposure to other Asian emerging countries’ sovereign and non-sovereign debts
as well.
We retrieve China’s sovereign CDS spreads from a comprehensive dataset provided
by the Markit Group Limited.4 The Markit Group collects corporate and sovereign CDS
quotes contributed by more than 30 large banks on a daily basis. A daily CDS spread is a
composite quote only if it has more than three contributors. Once a credit default swap is
priced by Markit, the pricing data is generally on a continuous basis. The data spans the
period January, 2001 to December, 2010. A daily CDS spread is a composite quote only if it
has more than three contributors. Depth is the number of dealer banks that contribute the quotes
of CDS spread to the Markit Group. As the CDS market is a largely unregulated over-the-counter
market, no information on trading counterparties or trading volume is provided in the dataset. The
CDS spreads include one-year, two-year, three-year, five-year, and ten-year CDS spreads.
We use only the five-year CDS spreads because these swap contracts are the most liquid. To
maintain uniformity in contracts, we only use sovereign CDS quotes for China denominated
in U.S. dollars. We use only the five-year CDS spreads because these swap contracts are the
most liquid. To maintain uniformity in contracts, we only use CDS quotes denominated in
U.S. dollars.
The China stock market index is obtained from the Shanghai Stock Exchange
Composite Index. The real interest is calculated from the 1-year deposit interest rate and the
4 This dataset has been widely used for the research on credit default swaps. For example, it was used by Jorion and Zhang (2007, 2009), Remolona, et al. (2007), Yu (2006), and Zhu (2006).
15
inflation rate using the Fisher Effect formula. The government external debt is from the
World Bank Global Development Finance data set. GDP data are from the International
Monetary Fund World Economic Outlook. Reserves refer to the Total Reserves Including
Gold series from the World Development Indicators.
In terms of global variables, VIX is the implied volatility of the US stock market
return, which is retrieved from the Chicago Board Options Exchange. SLOPE is the
difference between the 10-year U.S. Treasury yield and the 3-month U.S. Treasury bill rate.
DEF is the difference between the yields on Aaa and Baa U.S. corporate bonds. The 10-year
U.S. Treasury yield, the 3-month Treasury bill rate, yields on Aaa and Baa U.S. corporate
bonds are from the Federal Reserve Bank of St. Louis. While the US is a major economic
unit in the world, Europe and other emerging markets are playing increasingly important
parts. Thus, we also include the non-North America global index returns calculated from the
Morgan Stanley Capital International (MSCI) non-North America global index to proxy for the
impacts of countries other than the U.S. As our data spans the period of global financial
crisis, we also include a dummy variable, SHOCK, which is equal to 1 if the period is after
September 2008, and 0 otherwise. In addition, we control for the liquidity of the CDS market
using DEPTH, the number of dealers providing the quotes of CDS spread reported in the
Markit database.
Table 1 provides summary statistics on the CDS spread and other country and global
variables. China market monthly stock returns range from -24.6% to 30.3%. The stock
market daily volatility is relatively low due to the market restriction of a 10% range for the
daily percentage change in either way. In terms of the ex post real interest rate, which is
determined by both the 1-year nominal interest rate and inflation rate, it ranges from a
16
maximum of 4.13% in July, 2009 to -4.23% in February, 2008. The average ratio of foreign
debt to GDP (DEBT_GDP) is 11.74, which is closest to the minimum ratio among 32
emerging economies reported in Hilscher and Nosbusch (2010). The ratio has a low standard
deviation of 1.5, ranging from 8.58 to 13.95, suggesting that China had a very conservative
foreign debt policy. The ratio of reserves to GDP has an average of 30.34 over the sample
period. As the correlation between Debt/GDP and reserves/GDP is -80.3%, we only use
Debt_GDP in our regression analysis to avoid multicollinearity problem. The mean value is
21.9% for VIX, 2.05% for Slope, 1.16% for DEF and 0.24% for the global market index. The
measure of CDS market liquidity, DEPTH, ranges from 2 to 21 banks, indicating an
improvement of market liquidity over time.
[Insert Table 1 here]
4. Empirical Analyses and Results
In this section, we test the determinants of CDS levels and changes as well as its price
discovery function in China’s financial market.
4.1 Regression on CDS Level
To investigate the determinants of CDS spread, we first conduct a regression of CDS
spread level and then changes on a set of country factors, global factors, and other control
variables. The regression for the level analysis is as follows:
tttttt
ttttt
DEPTHSHOCKNONNARETDEFSLOPEVIX
GDPDEBTINTREALVOLSTKRETSTKCDS
1098765
4321 ____ (1)
Below we discuss predictions of signs on the variables. STK_RET (the Chinese market stock
return) is expected to have a negative effect on CDS (Fung, et al. 2008). STL_VOL is the
stock return volatility calculated from daily stock returns for the preceding 21-day window.

17
According to the prediction of a Merton-type model, this volatility variable would have a
positive effect on CDS. REAL_INT is expected to affect the CDS positively because greater
economic growth implies smaller default risk. DEBT_GDP (the ratio of the government
foreign debts to GDP) is predicted to have a positive effect on CDS because a higher foreign
debt level should contribute to greater country risk.
In terms of global variables, we use several proxy variables to represent global forces.
VIX is expected to have a positive effect on CDS according to Merton-type model and Pan
and Singleton (2008). The interest rate that is directly modeled by a Merton-type model is the
instantaneous spot rate, which has been shown to be explained empirically by a term
structure variable such as SLOPE that, in turn, is expected to have a negative effect on credit
spreads (Eichengreen and Mody, 2000 and Ericsson, et. al., 2009). Higher DEF (the
difference between the yields of U.S. BBB and AAA bonds) suggests that investors require
greater compensation for bearing risk, and therefore a higher CDS premium. We also use the
stock return from a global stock index for non-North American countries obtained from
MSCI to proxy for the global forces from countries other than the US. A financial index is
preferred to a real sector model because it reflects information better and quicker. A negative
sign is expected between this variable and the CDS spread. We expect the observed CDS
spread to be positively related to SHOCK because the global financial crisis should be
associated with higher country risks. A higher value of DEPTH indicates greater liquidity,
which is expected to be negatively associated with CDS spreads.
Table 2, Panel A, reports results from the regressions of end-of-month and daily
levels of China’s sovereign CDS spreads on explanatory variables. We group the explanatory
variables into three categories: main country-specific variables, global variables, and control

18
variables. For the monthly results, China stock market returns have the expected negative
sign and are significant, indicating that, for periods of high stock returns, the CDS spread
narrows. This finding is consistent with the findings in Ericsson, et al. (2009) and Collins-
Dufresne, et al. (2001) for corporate CDS spreads and corporate bonds, respectively.
Consistent with the predicted signs, REAL_INT and DEBT_GDP are significant explanatory
variables.5
Next we turn to global factors. VIX is positive (0.88), which is significant at the 5%
level. In addition, DEF is positive and significant while the Non-North America global
market return is negative and significant. The results from these three variables supported our
expectations and are consistent with Hilscher and Nosbusch (2010) who show that global
factors are important. The slope between 10-year T-bond yield and 3-month T-bill rate is
negatively but not significantly related to CDS spread. The sign is consistent with the finding
of a significant negative effect reported by Eichengreen and Mody (2000), and Ericsson, et
al. (2009). Our measure of high-yield corporate spread, DEF, is significantly positively
related to CDS spread, suggesting that China’s CDS spreads are higher when the global risk
premium is greater. We find that SHOCK is positively and significantly related to the
observed CDS spread, as expected. The adjusted R-squared for our regression is 84.59%,
which is quite high.
[Insert Table 2 here]
5 We use real interest to proxy for economic growth here and it is also prescribed by Merton’s Model. He and Wang (2011) cast doubt on the use of real interest rate for economic growth. Thus, it can be argued the industrial production (IP) may be a better proxy. The correlation between our real interest rate with IP growth during our study period is about 0.8, which is highly significant. In fact, we also experiment with IP variable instead of the real interest rate variable in our regression analysis. The result shows that the R-squared with the real interest rate is slightly better than that using IP and IP is negative and significant at the daily frequency in the level analysis but not significant in the change analysis. So, we decided to use the real interest rate in our study and it is also a theoretical variable to be used in the determinants of CDS.
19
For the daily analysis of CDS determinants, we find all variables (domestic and
global variables) are significant at the 1% level and have the correct signs. Overall, the
regression of spreads delivers an adjusted R-squared of 85.93%, a similar result as the
monthly results. In summary, CDS spread is positively related with the stock market
volatility, debts to GDP, VIX, DEF, and SHOCK, but negatively related with the non-North
America global stock market return, real interest rate, slope of the term structure, and market
depth of the CDS.
Panel B of Table 2 uses the same variables as in Panel A but expands the analysis by
including the interaction terms of the shock variable with stock market variables. The results
are largest consistent with the results of Panel A. Of the four interaction terms, three
variables (i.e., SHOCK with Chinese stock return, real interest rate and non-North America
global stock returns) turn out to be significant. These results imply that the shock variable
affects the CDS behavior significantly and the CDS may be behaving differently in the later
period than the earlier period.
4.2 Regression on CDS Changes
Following Ericsson, et al. (2009), we next consider the determinants of CDS spread
changes. The regression using the difference in CDS spreads is as follows:
ttttttt
ttttt
DEPTHSHOCKNONNARETDEFSLOPEVIX
GAPDEBTINTREALVOLSTKRETSTKCHGCDS
1098765
4321 _____ (2)
where CDS_CHG measures the changes in CDS Other variables have been defined earlier.
Table 3, Panel A, reports the empirical regression results. For the monthly analysis,
we find that the only stock returns and real interest rate are significant. That is, one standard
increase in the stock return will have a reduction of 3.50% (i.e., -0.39 × 8.98%) in CDS
20
spread. Second, the coefficient on REAL_INT is negative and significant at the 5% level,
implying that one standard increase in real interest rate will have a reduction of 4% (-1.98 ×
2.02%) in CDS spread. Among the global variables, NONNARET is significant. It is
negatively related to CDS spread changes. In addition, DEPTH is negatively related to CDS
spread changes. The adjusted R-squared is 42.79%, which is reasonable for the change
analysis, but lower than that of the CDS level analysis.
For the daily analysis, STK_RET and all four global factors are significant
determinants of CDS spread changes. The adjusted R-squared at the daily frequency is only
3.06%, much lower relative to that at the monthly frequency.
Overall, both country and global variables are important factors to explain both level
and changes of CDS spread, but they are more important in explaining CDS spread levels
than changes.
[Insert Table 3 here]
Panel B of Table 3 reports results using the same variables as in Panel A and includes
interaction terms of the shock variable with some financial variables. The interaction term
changes some of the significance of variables in Panel A. For example, the real interest is
significant in Panel A, but no longer significant in Panel B. This analysis suggests that the
behavior of the CDS in the shock period differs from the earlier period and thus motivates
us to investigate the subperiod analysis.
4.3 Relative Importance of Country Factors and Global Factors Over Time
Next, we investigate the relative importance of country variables and global variables
in explaining the levels and changes of China’s sovereign CDS spreads in two sub-period
21
analysis. First, we look for a structural break of CDS to divide our sample. In Feb. 2007,
Freddie Mac announced that it would no longer buy the most risky subprime mortgages and
mortgage-related securities and in March 2007, New Century, the largest U.S. independent
provider of home loans to people with poor credit histories was in default of its loans.6 So,
we test structural breaks using Chow test around this period for potential information
leakage using CDS spread levels and changes. We find that there is a structural break found
in February, 2007 (the F value is 14.72 and the p value lower than 0.0001 for the CDS levels
and the F value is 3.63 and the p value is 0.0299 for the CDS changes). So, we conduct
regressions at monthly and daily frequencies for the full sample period, the first period
before February 2007, and the second period after February 2007. Then we conduct the
standard F-test from the regression analysis for the slope differences between the first and
second periods (Myers and Well, 1995).
For the level analysis of the whole period as shown in Panel A of Table 4, the
adjusted R-squared is 83.3% for the first period and 84.91% for the second period at the
monthly frequency. The real interest rate is negative and insignificant in the first period
while it is positive and significant in the second period, indicating that there is a structural
change in the relationship. In addition, the debt/GDP was positive in the first period and
negative in the second. This is likely due to the massive efforts of the Chinese government
to boost the GDP growth during the crisis period.7 The F-tests indicate the effects of these
two variables on CDS are different across two periods.
6 See “New Century files for Chapter 11 bankruptcy,” http://money.cnn.com/2007/04/02/news/companies/new_century_bankruptcy/http://money.cnn.com/2007/04/02/news/companies/new_century_bankruptcy/. 7 In fact, the debt/GDP ratio was reduced to 9.98% in the second period from 12.91% from the first period.
22
The daily analysis reveals both domestic factors and global factors are highly
significant. The R-squared is 83.12% in the first period and 88.34% in the second period.
Again, the F-tests indicate changes in the coefficients of the many variables between the two
periods are statistically different.
[Insert Table 4 here]
Next, we examine whether the similar patterns and dynamics hold for the CDS
change analysis. As shown in Panel B of Table 4, the adjusted R-squared in the change
analysis is 22.36%) in the first period and 54.03% in the second period. Again, the
explanation power is much lower than the level analysis at the monthly frequency. For the
daily analysis, most of the variables in the second period have a different effect on the CDS
change from the first period, confirming again the structural change between the two
periods.
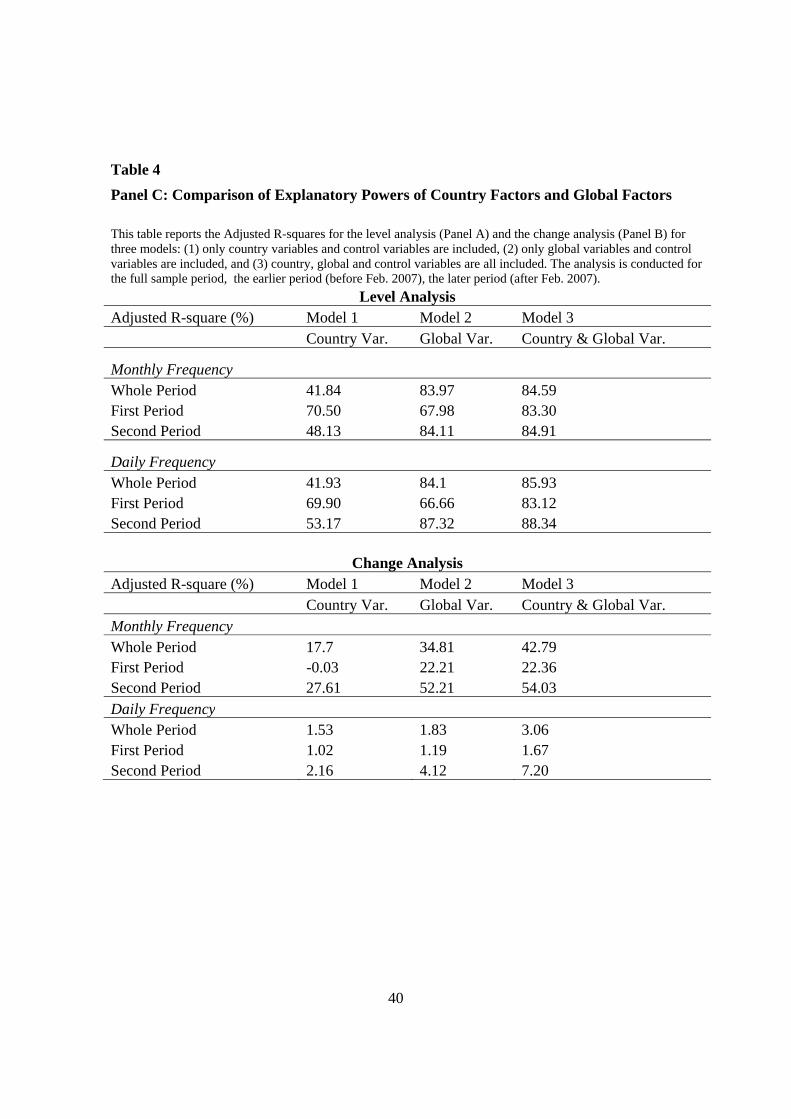
We next compare the relative importance of global factors with the country factors
more explicitly. To this end, we conduct regressions for three models in the two subperiods:
(1) only the country variables and the control variables are included, (2) only the global
variables and the control variables are included, and (3) the country, global and control
variables are all included. The results are reported in Table 4, Panel C.
For the whole period, the R-squared is 41.84% in Model 1 and 83.97% in Model 2 at
the monthly frequency in the level analysis, indicating the global factors have a greater effect
on CDS than the country factor. The results are similar in the second period and with the
daily frequency, confirming that global factor become more important over time. For the
change analysis, the R-squared is 17.7% in Model 1 and 34.81% in Model for the whole
23
period. This indicates the global factors are stronger than the country factor. This pattern is
similarly obtained for the second period and at the daily frequency.
The overall results in Panel C of Table 4 show that the global variables are important
in explaining the level and changes of China’s sovereign CDS spreads. Taken together,
China’s domestic economic factors were more relevant in explaining the CDS spread levels
and changes in the earlier years, while the impact of global factors has become increasingly
important in more recent years, particularly during the global crisis. This could be driven by
the growing integration of China’s economy into the world economy. It is also consistent
with the observation that the correlation of financial markets across countries increases as the
market volatility is greater during the crisis.
4.4 Price Discovery Analysis and Results
One of the most important functions of the financial markets is price discovery,
defined by Lehmann (2002) to be the efficient and timely incorporation of the information
implicit in investor trading into market prices. When closely related assets trade in different
markets, it is important to investigate which of the markets contributes most to the discovery
process.
Figure 1 demonstrates the relationship between China’s sovereign CDS spread level
and the China stock index. The CDS spread on China declined from over 70 basis points in
2001 to about 9 basis points in January, 2007, reflecting a perception of lowered sovereign
risk and increasing investor confidence in China. However, in July, 2007 the volatility of
CDS spreads started to increase, reaching a level of 77 basis points in March, 2008. They
proceeded to drift downward for several months, but then rose dramatically by October,
24
2008, reaching their highest level (180 basis points) during the entire study period. The jump
of the CDS spread at the end of 2008 is consistent with the spread of U.S. financial crisis to a
global financial crisis.
The Shanghai Stock Exchange Index fell from over 2,100 points in 2001 to 1,000
points in 2005, a loss of more than 50%, and only started to reverse itself in 2006. During the
same period, the real GDP of China grew, on average, by over 9.3 percent a year. The poor
performance of the China stock market index, in contrast with the rapid growth of the
Chinese economy, suggests that China’s stock market during the early period was an
underdeveloped and highly regulated market. The stock market experienced dramatic
volatility during the 2006 and 2008 period. The stock index rose from a level of 1,319 in
January, 2006 to a record high of 6,251 in October 2007, then plummeted to 1,911 in
December, 2008. The correlation between CDS spread changes and the stock market returns
is - 42% over the whole period, significant at the 1% level. The graph shows that the CDS
prices and stock index levels exhibit an inverse relationship in the later period.
[Insert Figure 1 here]
If the CDS market and the stock market price sovereign risk similarly over the long
run, their prices should be cointegrated. The ordinary least squares (OLS) estimation method
would falsely suggest that the variables are closely connected by a linear equation even
though they are completely independent of each other. We test for the existence of an
equilibrium price relationship or cointegration using a two-step approach. First, we examine
whether the price series are characterized by a unit root using the augmented Dickey-Fuller
and Phillips-Perron unit root tests. The null hypothesis in both tests is that the series are

25
characterized by unit roots. Test statistics show that we cannot reject a unit root for both
series. However, the hypothesis of a unit root in the first differences is rejected for all series.
Johansen’s cointegration rank tests evaluate the null hypothesis of no-cointegration.
This null hypothesis states that the coefficient matrix has a full rank (equal to 2 for the two
series). If this null hypothesis is rejected, then the two price series are cointegrated and we
can affirm that there exists an equilibrium price relationship between them. We find that the
Johansen’s trace statistic is 5.72, which is less than the 10% critical values. So we cannot
reject the null hypothesis of no-cointegration at the 10% level for the sample period. The
absence of cointegration can be attributed to the low debt-to-asset values or the stock market
volatility, especially during the crisis period. Specifically, when a country has low debt-to-
asset values, it is difficult to estimate an equilibrium price relationship because the
correlation between CDS spread and equity prices is also low (- 11.9%). When a country’s
stock market volatility is high, CDS spreads and equity prices may be characterized by a
nonlinear relationship that the cointegration analysis cannot capture.
There may be other explanations for our results. First, it may be that arbitrage
opportunities across the CDS and equity markets cannot be exploited because of market
frictions or technical factors inherent in the Chinese stock market. Second, sovereign CDS
prices not only reflect sovereign risks based on economic conditions, which should be
incorporated in stock prices, but also reflect a risk premium for taking on sovereign default
risk, which is different from the equity risk premium. Remolona, et al. (2007) find that the
remarkable narrowing of emerging markets CDS spreads between 2002 and 2006 occurred
largely due to a narrowing of the risk premium gaps for speculative-grade issuers because
global investors have become hungrier for speculative grade debt. In contrast, the falling
26
spreads for the investment-grade group is largely due to an actual decline in sovereign risk
because economic conditions have improved (risk premiums have remained fairly stable).
Given that there are different market participants in the CDS and stock markets, if the risk
premium in the CDS market differs from that in the stock market, it is natural that there is no
long-run equilibrium relationship between these two markets.
Since the hypothesis of a unit root in the first difference is rejected for CDS spreads
and stock prices, we use the CDS spread changes and stock returns as variables in the vector
autoregressive (VAR) system in order to investigate the simultaneous interactions between
market stock returns and CDS index spreads. We conduct the Granger causality test to
determine the causal relationship between CDS spreads and stock returns using daily data,
which is appropriate for price discovery analysis in light of rapid information changes.
VAR is an appealing approach to conducting cross-market analyses between the CDS
market and other markets (Chan et al., 2009, Fung, et al., 2008, Blanco et al., 2005, and
Longstaff, et al., 2005). To analyze the interrelationships between CDS spreads and stock
returns, we express the VAR model in the following equations:
t
L
k
L
kktkktkt eRETSTKCHGCDScCHGCDS 1
1 12110 ___
(3)
t
L
k
L
kktkktkt eRETSTKCHGCDScRETSTK 2
1 12120 ___
(4)
We expand the equations so that we can test whether the coefficients on STK_RET
are jointly equal to 0. If not, we can reject the null hypothesis that STK_RET Granger causes
CDS_CHG. Other Granger causality for other equations are similarly defined.
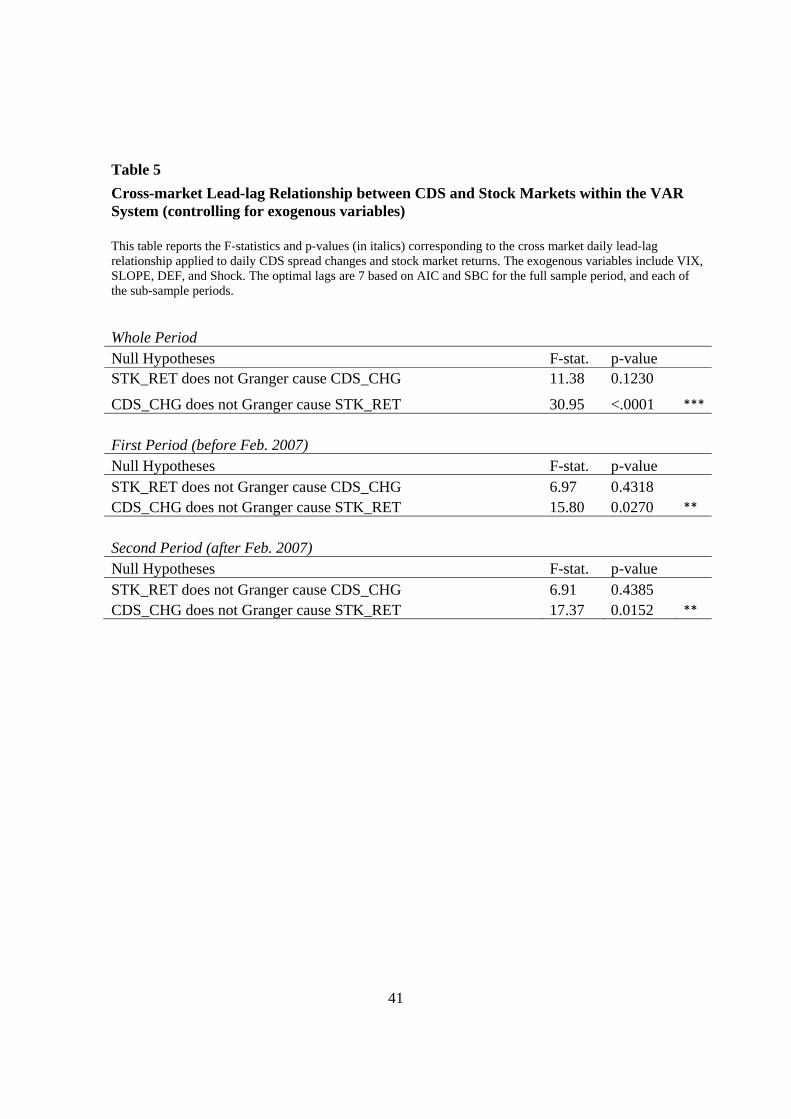
Table 5 summarizes the cross-market lead-lag relationship between the CDS and
stock markets at the daily frequency within the VAR model controlling for exogenous

27
variables for the whole period and sub-periods. The optimal lag length is seven, determined
by the Akaike Information Criterion (AIC) and Schwarz Information Criterion (SC). When
the dependent variable is the CDS spread changes, the results for control variables are
generally consistent with those in Table 4, Panel B.8 Significant variables have the predicted
signs. Specifically, VIX and DEPTH are positively related to CDS spread changes. However,
we find that the lagged stock return does not have explanatory power for the CDS spread
changes.
The results for the whole period and sub-periods show that CDS spread changes
Granger-cause stock returns at the conventional level of significance, supporting the
leadership role of CDS spreads on the stock returns. However, there is no evidence that stock
returns Granger-cause CDS spread changes in any sub-periods.
[Insert Table 5 here]
The leadership role of the CDS spreads in the price discovery may be explained in
two ways. First, the sovereign CDS market is the new and more innovative instrument for
trading sovereign risk. Investors buying sovereign CDS are able to hedge country risk arising
from holdings of sovereign bonds, foreign stock or mutual funds. Investors may also sell
CDS to collect insurance premiums from buyers. On the other hand, speculators actively
trade in the CDS market to bet on movements of country risk. The concentration of liquidity
from different pools may help make the CDS market lead the stock market. Second,
participants in the CDS market, which are large intuitional investors, may have information
advantage that will be subsequently incorporated into the stock market, showing the
leadership role of the CDS spreads on the stock return.
8 The regression results are long because the optimal lag is seven. So it is not reported to save space.
28
On the other hand, the inability of the stock market return to forecast CDS changes is
likely due to the speculative nature of the market, which is also subject to heavy government
regulations. It has also been long recognized that the Chinese stock market does not reflect
fundamental factors of the growing Chinese economy. The insignificant results of stock
market return on CDS confirm the expectations that the Chinese stock market may not be
efficient in processing information.
To further examine how well the CDS spread change forecast the stock returns, we
conduct the forecast error variance decomposition of daily CDS spread change and stock
returns within the VAR framework. Table 6 reports percentage of forecast error variance at
n-step-ahead, which is attributable to earlier shocks (innovations) from the CDS spread
changes and stock returns (including itself). We list steps of 1, 5, 10, 15, and 20 days for
forecasting purposes. The shock to CDS spread changes explains about 1.78% of the stock
return variation at the 1-day horizon, 2.95% at the 10-day horizon, and 3.02% at the 20-day
horizon. The rest is explained by its own innovations. On the other hand, the shock to stock
returns only explains about 0.35% of the stock return variation at the 1-day horizon, and up
to 0.50% within the 20-day horizon. This result is consistent with the causality analysis in
Table 5 that CDS spread changes can predict stock returns.
[Insert Table 6 here]
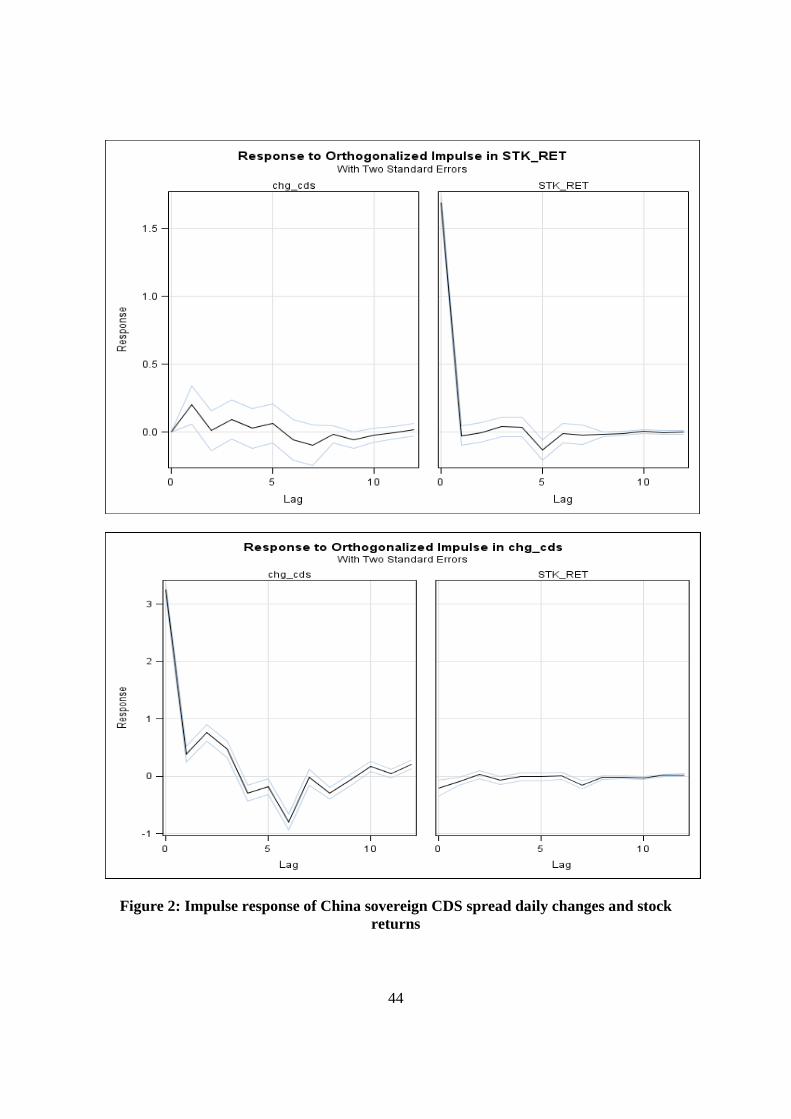
Figure 2 presents the impulse response function of the VAR model. In the stock
return impulse function, we find that the CDS shock affects stock returns largely only at the
first day (the left diagram on the top panel), after that its effect becomes stabilized, indicating
that the stock market adjusts to information of the CDS market quickly. At the same time, the
29
stock return adjusts its own shock within a day or so. However, CDS adjusts to its own
shocks somewhat slowly. That is, it takes about 3 days (the left diagram on the lower panel).
[Insert Figure 2 here]
5. Conclusions
This paper first examines determinants of China’s sovereign CDS market using both
country-specific variables and global variables, and second addresses the dynamic
relationship between the credit default swap spread changes and stock returns. Our paper
contributes to the relatively limited empirical literature on emerging market credit
derivatives, which are growing importance in recent years.
Overall, we find that both country and global variables are important to explain levels
and changes of China’s sovereign CDS premium. In assessing the country-specific factor for
sovereign risk, the domestic stock index level serves as a good indicator of country risk. In
addition, non-North America global stock market returns, VIX and SLOPE serve as
important external factors.
Furthermore, the sub-period analysis suggests that country variables are more
important in explaining the CDS spread levels and changes in the earlier years, while global
factors are more important than domestic factors in determining CDS spread levels and
changes in more recent years, especially during the recent global crisis. This could be driven
by the increasing integration of China’s economy into the world economy. In addition, the
correlation of financial markets across countries generally increases when the market
volatility is higher.
30
When we examine the price discovery issue within a VAR framework between CDS
and the stock returns, we find that the price discovery takes place primarily in the CDS
market after controlling for the exogenous factors. We conjecture that the price discovery
occurs in the CDS market because of fewer restrictions, broader investor base, and greater
information advantage in the CDS market. In contrast, the stock market in China is relatively
shallow and less developed and has regulatory restrictions on the daily price movements. The
Chinese stock market has long been viewed as speculative in nature and thus is not
efficiently reflecting fundamental value of Chinese economy. However, our impulse response
analysis indicates the Chinese stock return adjusts to CDS information rather quickly in a day
or so.
Overall, these results support the sovereign CDS as a leading economic indicator,
which provides a basis for cross-market trading and hedging. It is also useful for economic
policy analysis. As China’s sovereign CDS market keeps growing, the determinants of CDS
and the dynamic relationship between the credit derivatives market and the stock market will
evolve gradually. We expect that the domestic and external economic indicators become
more closely linked with fewer market restrictions, a greater participant base, and a more
standardized derivatives market.
31
References
Blanco, R., S. Brennan, and I. Marsh, 2005, An empirical analysis of the dynamic
relationship between investment-grade bonds and credit default swaps, Journal of
Finance 60, 2255-2281.
Chan, K.C., H.G. Fung, and G. Zhang, 2009, On the relationship between Asian credit
default swap and equity markets, Journal of Asian Business Studies, 4(1), 2-11.
Chan-Lau, J.A. and Y.S. Kim, 2004, Equity Prices, credit default swaps, and bond spreads in
emerging markets, Working paper, International Monetary Fund, Washington, DC.
Collin-Dufresne, P., R. Goldstein, and S. Martin, 2001, The determinants of credit spread
changes, Journal of Finance, 56, 2177—2207.
Eichengreen, B. and A. Mody, 2000, What explains changing spreads on emerging-market
debt: fundamentals or market sentiment? in: S. Edwards ( ed.), Capital Flows and the
Emerging Economies: Theory, Evidence and Controversies, University of Chicago Press.
Engle, R. F. and C.W.J. Granger, 1987, Cointegration and error-correction representation,
estimation and testing, Econometrica 55, 251-76.
Ericsson, J., K. Jacobs and R. Oviedo, 2009, The determinants of credit default swap premia,
Journal of Financial and Quantitative Analysis 44, 109-132.
Fitch Ratings Special Report, 2006, Global Credit Derivatives Survey: Indices Dominate
Growth as Banks’ Risk Position Shifts (September).
Fung, H.G., W.K. Leung, and J. Zhu, 2004, Nondelivery forward market for Chinese RMB:
A first look, China Economic Review 15, 348-352.
32
Fung, H.G., G. E. Sierra, J. Yau, and G. Zhang, 2008, Are the stock market and credit default
swap market related? Evidence from the CDX indices, Journal of Alternative Investments
11(1), 43-61.
Gibson, M.S., 2007, Credit derivatives and risk management. Economic Review of the
Federal Reserve Bank of Atlanta, 25-69.
Granger, C., 1969, Investigating causal relations by econometric models and cross-spectral
methods, Econometrica 37, 424-438.
He, Dong and Honglin Wang, 2011, Dual-track interest rate and the conduct of monetary
policy, Bank of Finland, BOFIT working paper, No. 21 (www.bof.fi/bofit).
Hilscher, J. and Y. Nosbusch, 2010, Determinants of Sovereign Risk: Macroeconomic
Fundamentals and the Pricing of Sovereign Debt, Review of Finance 14, 235–262.
Jorion, P. and G. Zhang, 2007, Good and bad credit contagion, evidence from credit default
swaps, Journal of Financial Economics 84(3):860-883.
Jorion, P. and G. Zhang, 2009, Credit contagion from counterparty risk, Journal of Finance
64(5), 2053-2087.
Kaplin, A., A. Levy, S. Qu, D. Wang, Y. Wang, and J. Zhang, 2009, The relationship
between default risk and interest rates: An empirical study. Moody’s Analytics, Moody’s
KMV Company, October.
Lehmann, B. N., 2002, Some desiderata for the measurement of price discovery across
markets. Journal of Financial Markets, 5:259-76.
Longstaff, Francis A., Sanjay Mithal and Eric Neis, 2005, Corporate yield spreads: default
risk or liquidity? New evidence from the credit default swap market, Journal of Finance
60 (5), 2213-2253.
33
Mengle, D., 2007, Credit derivatives: an overview. Economic Review of the Federal Reserve
Bank of Atlanta, 1-23.
Merton, R.C., 1974, On the pricing of corporate debt: the risk structure of interest rates,
Journal of Finance 29, 449-70.
Myers, J. L. and A.D. Well, A. D., 1995, Research design and statistical analysis. Hillsdale,
NJ: Lawrence Erlbaum Associates.
Nelken, I.,1999, Implementing credit derivatives: strategies and techniques for using credit
derivatives in risk management. New York: McGraw-Hill.
Norden, L. and M. Weber, 2009, The co-movement of credit default swap, bond and stock
markets: An empirical analysis, European Financial Management 15(3), 529-562.
Remolona, E. M. Scatigna and E. Wu, 2007, The pricing of sovereign risk in emerging
markets: fundamentals and risk aversion, Working paper, University of New South
Wales.
Tett, G., 2006, The dream machine: invention of credit derivatives. Financial Times March
24.
Yu, F., 2006, How profitable is capital structure arbitrage? Financial Analysts Journal 62(5),
47-62.
Zhang, X. F., 2003, What did the credit market expect of Argentina default? Evidence from
default swap data, Working paper.
Zhang. G., 2009, Informational efficiency of credit default swap and stock markets: The
impact of adverse credit events, International Review of Accounting, Banking and
Finance 1(1), 1-15.
34
Zhu, H., 2006, An empirical comparison of credit spreads between the bond market and the
credit default swap market. Journal of Financial Services Research 29(3),211-235.
35
Table 1 Descriptive Statistics
Variable Mean Median Maximum Minimum Std. Dev. CDS_LEVEL 49.86 37.61 244.50 9.28 39.91 CDS_CHG -0.07 -0.16 72.35 -85.00 14.88 STK_LEVEL 2200.03 1740.38 5954.77 1051.95 1057.62 STK_RET (%) 0.68 1.28 30.25 -24.63 8.98 STK_VOL (%) 1.54 1.35 3.63 0.50 0.69 REAL_INT (%) 0.48 0.79 4.13 -4.23 2.02 DEBT_GDP 11.74 12.56 13.95 8.58 1.73 RESV_GDP 30.34 32.15 50.10 13.20 10.71 VIX (%) 21.90 20.72 59.89 10.42 9.31 SLOPE (%) 2.05 2.39 3.75 -0.45 1.25 DEF (%) 1.16 0.99 3.43 0.60 0.55 NONNARET(%) 0.24 0.88 12.54 -20.59 5.26 SHOCK 0.22 0.00 1.00 0.00 0.42 DEPTH 9.58 11.00 21.00 2.00 4.96 Variable Definition: CDS is the monthly-end China sovereign CDS spread level from Markit from January 2001 to December 2010; CDS_CHG is the monthly change of China CDS spread; STK_LEVEL is the monthly-end Shanghai Stock Exchange Index level; STK_RET is the monthly stock market returns calculated from the Shanghai Stock Exchange Index; STK_VOL is the China stock market daily return volatility based on daily returns in the preceding month; REAL_INT is the China real interest rate calculated by applying China monthly 1-year nominal deposit interest rate and inflation rate in the Fisher's Effect; DEBT_GDP is the ratio of China external debts to GDP; RESV_GDP is the ratio of China reserves to GDP; VIX is the implied volatility for the S&P 500 index option; SLOPE is the difference between the 10-year U.S. Treasury yield and the 3-month U.S. Treasury bill rate; DEF is the difference between the yields on Aaa and Baa U.S. corporate bonds; NONNARET is the monthly returns for Non-North America stock markets from MSCI; SHOCK is a dummy variable that is equal to 1 if the period is after September 2008, and 0 otherwise; and DEPTH is the number of dealers providing the quotes of CDS spread.
36
Table 2 Regression of China Sovereign CDS Spreads (Level Analysis)
This table reports results from regressions of end-of-month levels and daily levels of China sovereign CDS spreads on a set of explanatory variables: country variables, global variables, and other control variables. Variable definitions are provided in Table 1. * , **, and *** denote significance at the 10%, 5%, and 1% level, respectively.
Model 1 Monthly Frequency Daily Frequency
Variable Exp. Sign Coeff. t Value Coeff. t Value
Intercept -54.79 -2.06 *** -107.31 -16.85 ***
Country variables STK_RET - -0.12 -0.61 -0.48 -2.48 **
STK_VOL + 0.28 0.09 3.47 5.2 ***
REAL_INT - -2.16 -1.99 ** -3.07 -12.67 ***
DEBT_GDP + 3.18 1.77 * 6.54 15.01 ***
Global variables VIX + 0.88 2.44 ** 0.98 15.41 ***
SLOPE - 0.45 0.3 -1.18 -3.87 ***
DEF + 35.99 6.1 *** 42.82 31.95 ***
NONNARET - -0.99 -2.51 ** -0.43 -5.57 ***
Control variables DEPTH - -0.25 -0.6 -0.22 -2.34 **
SHOCK + 48.80 5.19 *** 54.07 27.01 ***
Adjusted R-square 84.59 85.93
p-value for F-test <.0001 <.0001
Model 2 Monthly Frequency Daily Frequency
Variable Exp. Sign Coeff. t Value Coeff. t Value
Intercept -6.29 -3.54 *** -104.06 -17.16 ***
Country variables STK_RET - -0.25 -1.3 -0.51 -2.41 **
STK_VOL + 0.30 0.1 1.78 2.78 ***
REAL_INT - -0.86 -0.87 -4.50 -17.44 ***
DEBT_GDP + 3.44 1.99 ** 6.43 15.67 ***
Global variables VIX + 1.11 3.25 *** 1.11 17.86 ***
SLOPE - -0.75 -0.5 -1.33 -4.5 ***
DEF + 42.11 7.18 *** 43.53 33.49 ***
NONNARET - -0.80 -1.86 * -0.67 -7.28 ***
Control variables DEPTH - -0.56 -1.35 -0.45 -4.89 *** Interaction variables STK_RET*SHOCK 0.84 1.78 * 0.36 0.81
STK_VOL*SHOCK 6.54 0.89 11.38 12.2 ***
REAL_INT*SHOCK 17.92 5.7 *** 13.07 19.17 ***
NONNARET*SHOCK -1.75 -2.4 ** -0.14 -0.87 Adjusted R-squared p-value for F-test
85.9 86.92
<.0001 <.0001
37
Table 3 Regression of China Sovereign CDS Spreads (Change Analysis)
This table reports results from regressions of monthly (daily) changes of China sovereign CDS spreads on a set of explanatory variables: country variables, global variables, and other control variables. Variable definitions are provided in Table 1. * , **, and *** denote significance at the 10%, 5%, and 1% level, respectively.
Model 1 Monthly Frequency Daily Frequency
Variable Exp. Sign Coeff. t Value Coeff. t Value
Intercept 7.19 0.38 1.49 1.03
Country variables STK_RET - -0.39 -2.78 *** -0.22 -5.16 ***
STK_VOL + 0.49 0.22 -0.03 -0.23
REAL_INT - -1.98 -2.54 ** -0.07 -1.22
DEBT_GDP + 0.42 0.33 -0.09 -0.9
Global variables VIX + -0.29 -1.11 0.06 3.83 ***
SLOPE - -0.92 -0.85 -0.13 -1.91 *
DEF + 0.31 0.07 -0.91 -3.01 ***
NNARET - -1.72 -6.04 *** -0.04 -2.41 **
Control variables DEPTH - -0.62 -2.07 ** -0.03 -1.43
SHOCK + 16.78 2.5 ** 0.29 0.65
Adjusted R-squared 42.79 3.06
p-value for F-test <.0001 <.0001
Model 2 Monthly Frequency Daily Frequency
Variable Exp. Sign Coeff. t Value Coeff. t Value
Intercept 34.70 1.96 ** 2.63 1.87 *
Country variables STK_RET - -0.20 -1.41 -0.05 -1.08
STK_VOL + -2.31 -1.16 -0.10 -0.67
REAL_INT - -0.37 -0.46 -0.01 -0.24
DEBT_GDP + -2.01 -1.66 * -0.18 -1.86 *
Global variables VIX + -0.14 -0.6 0.05 3.55 ***
SLOPE - -0.31 -0.31 -0.09 -1.31
DEF + -0.02 -0.01 -0.92 -3.06 ***
NONNARET - -0.81 -2.58 ** -0.01 -0.34
Control variables DEPTH - -0.38 -1.39 -0.03 -1.34 Interaction variables STK_RET_SHOCK -0.97 -3.17 *** -0.75 -7.3 ***
STK_VOL_SHOCK -0.15 -0.05 -0.02 -0.08
REAL_INT_SHOCK 0.65 0.3 0.03 0.16
NONNARET_SHOCK -1.68 -3.48 *** -0.09 -2.59 **
Adjusted R-squared 55.6 5.77
p-value for F-test <.0001 <.0001
38
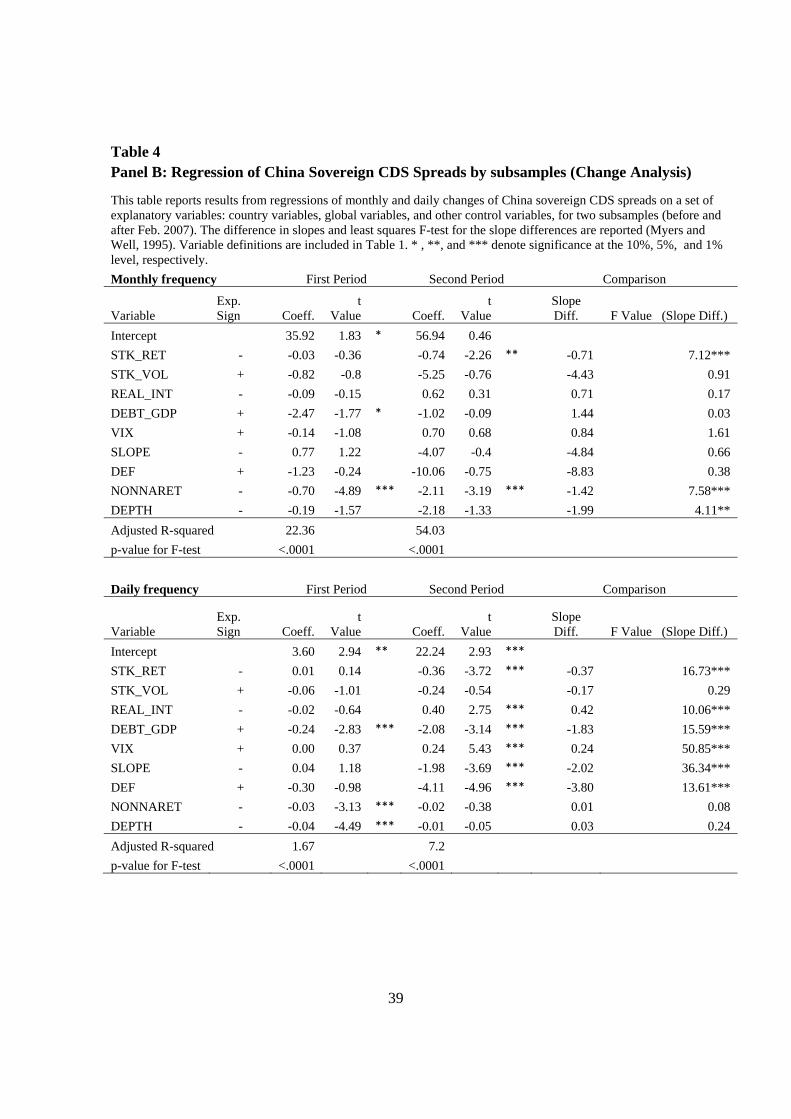
Table 4 Panel A: Regression of China Sovereign CDS Spreads by subsamples (Level Analysis)
This table reports results from regressions of end-of-month levels and daily levels of China sovereign CDS spreads on a set of explanatory variables: country variables, global variables, and other control variables, for two subsamples (before and after Feb. 2007). The difference in slopes and least squares F-test for the slope differences are reported (Myers and Well, 1995). Variable definitions are included in Table 1. * , **, and *** denote significance at the 10%, 5%, and 1% level, respectively.
Monthly frequency First Period Second Period Comparison
Variable Exp. Sign Coeff.
t Value Coeff.
t Value
Slope Diff. F Value (Slope Diff.)
Intercept -
182.72 -6.62 *** 206.74 1.24
STK_RET - -0.10 -0.95 -0.01 -0.01 0.10 0.08
STK_VOL + 1.78 1.23 -9.40 -1.02 -11.18 3.17*
REAL_INT - -1.10 -1.27 5.28 1.99 ** 6.38 6.15**
DEBT_GDP + 14.87 7.59 *** -23.37 -1.55 -38.24 14.88***
VIX + 0.85 4.71 *** 2.02 1.47 1.18 1.75
SLOPE - -1.26 -1.43 -15.64 -1.15 -14.37 2.77*
DEF + 12.90 1.79 * 29.56 1.65 * 16.66 0.76
NONNARET - -0.34 -1.71 * -1.07 -1.2 -0.72 1.05
DEPTH - -0.12 -0.69 2.33 1.06 2.45 3.21*
Adjusted R-squared 83.3 84.91
p-value for F-test <.0001 <.0001
Daily frequency First Period Second Period Comparison
Variable Exp. Sign Coeff.
t Value Coeff.
t Value
Slope Diff. F Value (Slope Diff.)
Intercept -
190.33 -
31.85 76.26 2.69 ***
STK_RET - -0.06 -0.53 -0.13 -0.38 -0.07 0.05
STK_VOL + 2.35 7.52 *** 0.60 0.38 -1.74 2.54
REAL_INT - -0.80 -4.55 *** 4.20 7.84 *** 5.01 94.07***
DEBT_GDP + 15.53 36.97 *** -11.85 -4.94 *** -27.38 246.05***
VIX + 0.82 23.64 *** 1.65 10.29 *** 0.83 44.15***
SLOPE - -1.10 -6.02 *** -5.42 -2.74 *** -4.32 9.12***
DEF + 11.26 7.39 *** 37.52 12.45 *** 26.26 47.16***
NONNARET - -0.22 -5.3 *** -0.13 -0.81 0.09 0.43
DEPTH - -0.12 -3.08 *** 0.82 2.25 ** 0.94 15.46***
Adjusted R-squared 83.12 88.34
p-value for F-test <.0001 <.0001
39
Table 4 Panel B: Regression of China Sovereign CDS Spreads by subsamples (Change Analysis)
This table reports results from regressions of monthly and daily changes of China sovereign CDS spreads on a set of explanatory variables: country variables, global variables, and other control variables, for two subsamples (before and after Feb. 2007). The difference in slopes and least squares F-test for the slope differences are reported (Myers and Well, 1995). Variable definitions are included in Table 1. * , **, and *** denote significance at the 10%, 5%, and 1% level, respectively.
Monthly frequency First Period Second Period Comparison
Variable Exp. Sign Coeff.
t Value Coeff.
t Value
Slope Diff. F Value (Slope Diff.)
Intercept 35.92 1.83 * 56.94 0.46
STK_RET - -0.03 -0.36 -0.74 -2.26 ** -0.71 7.12***
STK_VOL + -0.82 -0.8 -5.25 -0.76 -4.43 0.91
REAL_INT - -0.09 -0.15 0.62 0.31 0.71 0.17
DEBT_GDP + -2.47 -1.77 * -1.02 -0.09 1.44 0.03
VIX + -0.14 -1.08 0.70 0.68 0.84 1.61
SLOPE - 0.77 1.22 -4.07 -0.4 -4.84 0.66
DEF + -1.23 -0.24 -10.06 -0.75 -8.83 0.38
NONNARET - -0.70 -4.89 *** -2.11 -3.19 *** -1.42 7.58***
DEPTH - -0.19 -1.57 -2.18 -1.33 -1.99 4.11**
Adjusted R-squared 22.36 54.03
p-value for F-test <.0001 <.0001
Daily frequency First Period Second Period Comparison
Variable Exp. Sign Coeff.
t Value Coeff.
t Value
Slope Diff. F Value (Slope Diff.)
Intercept 3.60 2.94 ** 22.24 2.93 ***
STK_RET - 0.01 0.14 -0.36 -3.72 *** -0.37 16.73***
STK_VOL + -0.06 -1.01 -0.24 -0.54 -0.17 0.29
REAL_INT - -0.02 -0.64 0.40 2.75 *** 0.42 10.06***
DEBT_GDP + -0.24 -2.83 *** -2.08 -3.14 *** -1.83 15.59***
VIX + 0.00 0.37 0.24 5.43 *** 0.24 50.85***
SLOPE - 0.04 1.18 -1.98 -3.69 *** -2.02 36.34***
DEF + -0.30 -0.98 -4.11 -4.96 *** -3.80 13.61***
NONNARET - -0.03 -3.13 *** -0.02 -0.38 0.01 0.08
DEPTH - -0.04 -4.49 *** -0.01 -0.05 0.03 0.24
Adjusted R-squared 1.67 7.2
p-value for F-test <.0001 <.0001
40
Table 4
Panel C: Comparison of Explanatory Powers of Country Factors and Global Factors
This table reports the Adjusted R-squares for the level analysis (Panel A) and the change analysis (Panel B) for three models: (1) only country variables and control variables are included, (2) only global variables and control variables are included, and (3) country, global and control variables are all included. The analysis is conducted for the full sample period, the earlier period (before Feb. 2007), the later period (after Feb. 2007).
Level Analysis Adjusted R-square (%) Model 1 Model 2 Model 3 Country Var. Global Var. Country & Global Var.
Monthly Frequency
Whole Period 41.84 83.97 84.59 First Period 70.50 67.98 83.30 Second Period 48.13 84.11 84.91
Daily Frequency
Whole Period 41.93 84.1 85.93 First Period 69.90 66.66 83.12 Second Period 53.17 87.32 88.34
Change Analysis Adjusted R-square (%) Model 1 Model 2 Model 3 Country Var. Global Var. Country & Global Var. Monthly Frequency
Whole Period 17.7 34.81 42.79 First Period -0.03 22.21 22.36 Second Period 27.61 52.21 54.03 Daily Frequency Whole Period 1.53 1.83 3.06 First Period 1.02 1.19 1.67 Second Period 2.16 4.12 7.20
41
Table 5
Cross-market Lead-lag Relationship between CDS and Stock Markets within the VAR System (controlling for exogenous variables)
This table reports the F-statistics and p-values (in italics) corresponding to the cross market daily lead-lag relationship applied to daily CDS spread changes and stock market returns. The exogenous variables include VIX, SLOPE, DEF, and Shock. The optimal lags are 7 based on AIC and SBC for the full sample period, and each of the sub-sample periods.
Whole Period
Null Hypotheses F-stat. p-value
STK_RET does not Granger cause CDS_CHG 11.38 0.1230
CDS_CHG does not Granger cause STK_RET 30.95 <.0001 ***
First Period (before Feb. 2007)
Null Hypotheses F-stat. p-value
STK_RET does not Granger cause CDS_CHG 6.97 0.4318 CDS_CHG does not Granger cause STK_RET 15.80 0.0270 **
Second Period (after Feb. 2007)
Null Hypotheses F-stat. p-value
STK_RET does not Granger cause CDS_CHG 6.91 0.4385 CDS_CHG does not Granger cause STK_RET 17.37 0.0152 **

42
Table 6.
Forecast Error Variance Decomposition of Daily CDS Spread Change and Stock Returns from VAR This table reports the forecast error variance decomposition results (percentage) from VAR model with forecast horizon of 1, 5, 10, 15, and 20 days. The explained variable in the upper and lower panel is CDS_CHG and STK_RET, respectively.
Horizon CDS_CHG STK_RET
Variance of CDS_CHG explained by shocks to CDS_CHG and STK_RET
1 99.65% 0.35%
5 99.58% 0.42%
10 99.50% 0.50%
15 99.49% 0.50%
20 99.49% 0.50%
Variance of STK_RET explained by shocks to CDS_CHG and STK_RET
1 1.78% 98.22%
5 2.02% 97.97%
10 2.95% 97.05%
15 3.01% 96.98%
20 3.02% 96.98%
43
Figure 1: China sovereign CDS spread and stock market index (January 2001 – December 2010)
44
Figure 2: Impulse response of China sovereign CDS spread daily changes and stock returns