determinants and effects of employer matching ... · determinants and effects of employer matching...
TRANSCRIPT
Determinants and Effects of Employer Matching Contributions in 401(k) Plans *
May 2004
William E. Even David A. MacphersonDepartment of Economics Department of EconomicsMiami University Florida State UniversityOxford, OH 45056 Tallahassee, FL 32306email: [email protected] email: [email protected] 850-644-3586
Abstract
This paper uses data from the April 1993 Pension Supplements to the Current Population Survey toinvestigate the impact of employer matching and employee tenure on participation levels in 401(k) plans. While earlier studies examine similar issues, this study makes several advances. First, consistent withthe theory that employers may use matching contributions to satisfy nondiscrimination rules, the studyshows that correcting for the endogeneity of employer matching substantially increases the estimatedeffect of matching on participation levels. Second, the study provides evidence that the large positiveassociation between employee tenure and 401(k) participation is because "stayers" tend to be "savers".
___________________*We thank Eric Engen, Phyllis Fernandez, Richard Hinz, David McCarthy, Leslie Papke, John KarlScholz and the referees for helpful comments on earlier versions of this paper.
1. Introduction.
Since its creation in the Revenue Act of 1978, the 401(k) plan has become the most popular
type of pension plan. By 1998, contributions to 401(k) plans accounted for 72 percent of all pension
contributions in the United States.1 Between 1988 and 1998, the percent of civilian non-agricultural
workers over age 16 employed by a firm offering a 401(k) rose from 26.9 to 50.3 percent.2
Because the 401(k) plan has become so popular, there is a growing literature on the economics
of 401(k) plan design and the determinants of employee contributions. This study adds to that literature
by focusing on a common feature in 401(k) plans -- matching contributions by employers. We
address several questions. First, why do most firms with 401(k) plans offer to match employee
contributions? We discuss competing theories and the implications for the potential endogeneity of
employer matching in employee contribution behavior. Second, how much does employer matching
increase the probability of participation among employees? We show that correcting for the
endogeneity of employer matching dramatically amplifies the estimated effect of matching on employee
participation in 401(k) plans. Finally, pursuing the implications of one theory of employer matching, we
test whether the large estimated effects of employee tenure on participation are an artifact of a greater
propensity to quit among low savers. The results suggest that employees who choose not to participate
in their 401(k) plan are more likely to quit in their early years with the firm. In fact, most of the
estimated effect of tenure on participation is because 401(k) participants stay longer.
2
2 Copeland (2002).
1 See Pension Welfare and Benefits Administration (2002).

2. Section 401(k) Plans.
Pensions may be divided into three broad categories: defined benefit (DB), "traditional" [i.e.
non-401(k)] defined contribution (DC), and 401(k) plans. In DB plans, workers are guaranteed a
retirement benefit that is typically tied to years of service and the worker's final average salary. In
traditional DC plans, contributions to the pension are typically specified as some percentage of the
employee's pay. At retirement, the employee is entitled to the balance that has accumulated. Recently,
some firms have adopted cash balance plans that some describe as a blend of DB and DC plans. The
cash balance plan is treated as DB plans in terms of funding requirements and regulation, but it is like a
DC plan in the sense that benefits are defined in terms of an account balance. Between 1991 and
2000, the percentage of DB plans that were cash balance plans rose from 3 to 23 percent [Green
2003].
The 401(k) plan is similar to a traditional DC plan, but it differs in an important way. The
similarity is that, in both plans, the funds available at retirement are directly related to the contributions
made and the rate of return earned. A unique feature of the 401(k) plan is that, unlike other DC plans,
employees may make pre-tax contributions. In non-401(k) plans, employees may make only after-tax
contributions.
Since employees can make pre-tax contributions to a 401(k) plan, the full tax-advantage can be
realized with a plan supported entirely by employee contributions and employees can decide how much
to contribute to the plan, subject to limits imposed by the tax code. This "voluntary" feature of 401(k)
plans has the potential to cause a large change in the distribution of pension saving as workers are given
3
3. Matching Contributions in 401(K) Plans.
The majority of employees with 401(k) plans have employers that match their contributions to
the plan. For example, in the April 1993 Current Population Survey, 81 percent of employees eligible
for a 401(k) plan are offered employer matching.5
Several studies estimate the impact of matching on 401(k) participation and generally find small
effects. For example, using nationally representative cross sections of employees offered 401(k) plans,
the availability of employee matching is estimated to increase employee participation by 3 to 5
greater control over the pension saving rate. In fact, some policy makers have raised concerns that the
401(k) will lead to decreased pension saving among low income workers.3
Given concerns about how the growth of the 401(k) plan will affect pension saving, several
studies explore the determinants of employee participation and contribution behavior in 401(k) plans.4
Among these studies, there are several points upon which there is general agreement. First, higher
income and older employees are more likely to participate in the plan. These results are expected
because the tax advantage of 401(k) saving is greater for those facing higher marginal tax rates and
saving rates generally rise with age. Second, matching increases employee participation and, up to a
certain point, increases employee contributions. Finally, participation rates are higher among workers
who have been with the firm longer.
4
5 This calculation excludes workers who indicate they are offered a 401(k) plan but do not know whether matching isavailable.
4 Studies examining the determinants of 401(k) saving include Andrews (1992); Basset, Fleming and Rodrigues (1998);Clark and Schieber (1993); Even and Macpherson (1994); Kusko, Poterba and Wilcox (1998); Papke (1995); and Papkeand Poterba (1995).
3 Indeed, Even and Macpherson (1994) find that a major source of the decline in male pension coverage that occurredduring the 1980s is that employee participation in pension plans fell with the growing use of 401(k) plans.
percentage points in Even and Macpherson (1994), and by 10 percentage points in Basset, Fleming,
and Rodriguez (1998).6 Papke and Poterba (1995) use a sample of 43 pension plans and find that an
increase of the match rate from zero to 100 percent would increase participation by 26 percentage
points. Using form 5500 data, Papke (1995) estimates that switching a plan from no matching to a 100
percent match rate would increase participation by 17.4 percentage points.7
A potential concern with the majority of the existing work on the effect of matching is the lack of
attention to the fact that employer matching may be endogenous to employee saving behavior. To
illustrate the potential for an endogeneity problem, we describe two explanations for matching found in
the existing literature. The first explanation is based on employer efforts to satisfy non-discrimination
rules enforced by the Internal Revenue Service. The second is based on a theory where firms use
matching contributions to attract and retain workers with low discount rates.
Non-discrimination rules in the U.S. require that the contributions of low income employees (as
a percentage of pay) be relatively close to that of the highly compensated employees. If a pension does
not pass the non-discrimination rules, tax penalties are imposed.8
5
8 To satisfy non-discrimination rules, a 401(k) plan must pass an average deferral percentage (ADP) and an averagecontribution percentage (ACP) test. The ADP test is that the contributions of the highly compensated as apercentage of compensation cannot exceed (i) 125% of the ADP of all other eligible employees or (ii) the lesser oftwice the ADP for all other employees or the ADP for all other employees plus two percentage points. The ACP testapplies a similar rule to the combined employee after-tax and employer contributions to the plan. If an employer failsto satisfy the non-discrimination tests, a 10 percent excise tax may be imposed on the portion of contributions thatexceed the limits. See McGill et al. (1996) for further detail.
7A difficulty with the 5500 data is that the match rate is measured imprecisely because there is no distinction madebetween matching and non-matching contributions by the employer. Consequently, if the measure of the match rateis based on the ratio of employer to employee contributions, the match rate will be overstated when employers makenon-elective contributions. Moreover, VanDerhei et al. (2000) point out that a “substantial” fraction (approximatelyone-third based on personal communication) of employers make non-matching contributions to 401(k) plans.Consequently, the match rate in the form 5500 data will be overestimated for some plans, potentially leading to anunderestimate of the true effect of matching.
6Even and Macpherson (1994) use the May 1988 Current Population Survey, whereas Basset, Fleming and Rodrigues(1998) use the April 1993 Current Population Survey.
Non-discrimination rules are binding for many firms and appear to affect plan design. Ingham (1991)
suggests several ways that firms might satisfy non-discrimination rules. Examples include matching
contributions by the employer; financial education programs that demonstrate the power of tax-exempt
saving;9 limiting contributions by highly compensated employees; recharacterizing excess contributions
as after-tax contributions; providing booster contributions to non-highly compensated employees; using
a safe harbor plan design; or creating separate lines of business to allow a separate test for each line of
business.10 As for the importance of employer matching in satisfying non-discrimination rules, McGill
et al. (1996, p. 288) notes that “Most plans that include employer-matching contributions have been
able to attract a high percentage of participation among lower-paid employees, thus satisfying the
(non-discrimination) tests.”11
As an alternative explanation for matching, Ippolito (1997) suggests that firms match employee
contributions to attract and retain workers with a desirable, but unobservable, attribute -- a low
discount rate. He provides empirical evidence that workers with lower discount rates are less likely to
quit or call in sick, and generally receive higher performance ratings. Since matching provides a higher
level of compensation to savers (i.e. those with low discount rates who choose to take advantage of the
matching contribution), a 401(k) with matching will help attract and retain them.12
6
12 Alternative explanations for matching are that payroll taxes do not apply to employer contributions, whereas theydo apply to employee contributions. Also, whereas employee contributions must vest immediately, under cliffvesting, employer contributions need not vest for up to 5 years. Thus, employer contributions can be used as a wayto defer pay. It is important to note, however, that these characteristics would apply to employer contributionsregardless of whether they are made in the form of matching contributions.
11 Other examples of this case for matching can be found in Jason (1997, p.22), Miller and Phillips (1996, p.31), andNicholson (1995, p.23).
10 Evidence of firms using one or more of these approaches can be found in Phillip (1993), Hewitt and Associates(1993), Papke, Petersen, and Poterba (1996), and Garrett (1995).
9 Bernheim and Garrett (1996) find that financial education has a strong positive effect on 401(k) participation andcontribution levels.
An important implication of Ippolito’s theory is that, among workers offered a 401(k) plan, high
discounters should be more likely to quit. Indeed, there are at least two studies that find support for this
hypothesis. Using data on federal workers, Ippolito (1997) finds that workers who do not contribute to
the federal savings plan [similar in structure to a 401(k)] are more likely to quit. Using data from a
single firm, Kusko, Poterba and Wilcox (1998) find evidence that new hires who do not contribute to
their 401(k) plan are more likely to quit and conclude that “individuals may make decisions about
401(k) participation based in part on their expected longevity with the firm.” If nonparticipants (high
discounters) are more likely to quit, tenure will be positively correlated with unobserved preferences for
saving and a strong positive effect of tenure may emerge due to heterogeneity bias.
An alternative explanation for a higher quit rate among 401(k) non-participants is that workers
who expect an employment separation may be less likely to participate in the 401(k) plan for either of
two reasons. First, anticipating an employment separation may create a greater need for precautionary
saving and thus make the worker less willing to save through their 401(k) plan where it is difficult to
access without tax penalty. Second, since employer contributions may not vest immediately, the rate
of return on contributions to a 401(k) plan would be lower for a worker who expects to leave prior to
vesting. As with the Ippolito sorting story, a failure to account for either type of behavior would induce
an upward bias on the estimated effect of tenure.
Several previous studies find a large positive effect of tenure on participation. For example,
univariate analysis in Andrews (1992) implies that participation rates rise from 25 to 70 percent in the
first 5 years of employee tenure. Multivariate analysis in Even and Macpherson (1995) and Bassett,
Fleming and Rodrigues (1998) imply that, ceteris paribus, the probability of participation rises by
approximately 15 percentage points in the first 5 years of tenure.
7
While there is good theoretical reason to believe that both matching and employee tenure are
correlated with unobserved preferences for 401(k) saving, the majority of studies ignore this issue.
There are a few exceptions. Papke (1995) addresses the potential problem of endogenous matching by
estimating a fixed effects model of plan level participation and contribution rates to control for firm
specific heterogeneity in saving preferences. After controlling for firm specific fixed effects, match
rates are found to have no significant effects on either participation or contributions. One possible
explanation provided for the insignificant results from the fixed effects model is the lack of variation in
plan specific match rates, thus making it difficult for a fixed effects model to precisely estimate the effects
of the match.
Using panel data on a single firm, Kusko, Poterba and Wilcox (1998) control for the potential
simultaneity between match rates and saving preferences by examining how changes in the firm's match
rate over time affected employee contributions. Despite wide swings in the firm’s match rate over a 3
year period, the overall participation rates changed by only 6 percent.13 However, when the match rate
increased from 65 percent to 150 percent, 63 percent of the former noncontributors joined the plan.
Consequently, changes in the match rate can have large effects on a subgroup of the population.
Our study takes an alternative approach to correcting for the endogeneity of matching and
tenure. We use nationally representative cross sectional data on employee participation behavior and
instrument for employer matching to correct for the potential endogeneity problem. The instruments for
matching behavior are estimates of employer work force characteristics. The assumption is that some
work force characteristics influence the likelihood that the firm provides matching, but are not correlated
with the unobserved saving preferences of an individual employee. This assumption would be
8
13 The match rate started at 65 percent, increased to 150 percent, and then was eliminated over the three year period.
4. Data.
The April 1993 Current Population Survey provides the data for our analysis.15 In the pension
supplement to the survey, workers are asked whether they are offered a 401(k) plan. Workers
indicating that they are offered a 401(k) plan are also asked whether they participate in the plan, how
much they contribute to the plan, whether the employer provides any matching contributions, and
inappropriate if there is worker sorting across industries such that unobservable tastes for saving are
correlated with the identifying work force characteristics. To improve the chance that the identifying
assumptions are appropriate, we include controls in the participation equation to control for individual
saving preferences. We also test the over-identifying restrictions implicit in our empirical specification.
Our study also tests an important empirical implication of the hypothesis that 401(k) nonparticipants are
more likely to separate with the firm. Namely, if nonparticipants are more likely to separate, tenure will
be correlated with unobserved determinants of saving preferences and the effect of tenure on
participation would be biased upward.
Before turning to the empirical work, it is worth emphasizing that our study does not estimate
the relationship between employee contributions and employer matching. Such an endeavor requires
more complete information on the level of the employer match than is available in the data we use. 14
9
15 In an earlier version of this paper, we also used data from the May 1988 Employee Benefits Supplement to theCurrent Population Survey. While the May 1988 survey asks whether the employer contributes to the plan, it isimpossible to determine whether the contributions are matching contributions. Given the evidence in VanDerhei et al.(2000) that many employers make qualified non-matching contributions to 401(k) plans, we no longer make use of the1988 data.
14 The April 1993 CPS asks respondents what the match rate is but there is missing data for a large share of those whohave matching and there is no information on whether the match rate varies or is capped. Engelhardt and Kumar(2003) provide evidence that there is considerable variation across plans in terms of the matching formulae.

whether the 401(k) plan is the only plan they participate in. Information is also available on worker
characteristics (e.g., age, education, marital status, race), and firm characteristics (e.g., firm and
establishment size, unionism, and industry). We restrict the sample to private sector workers between
the ages of 21 and 55.
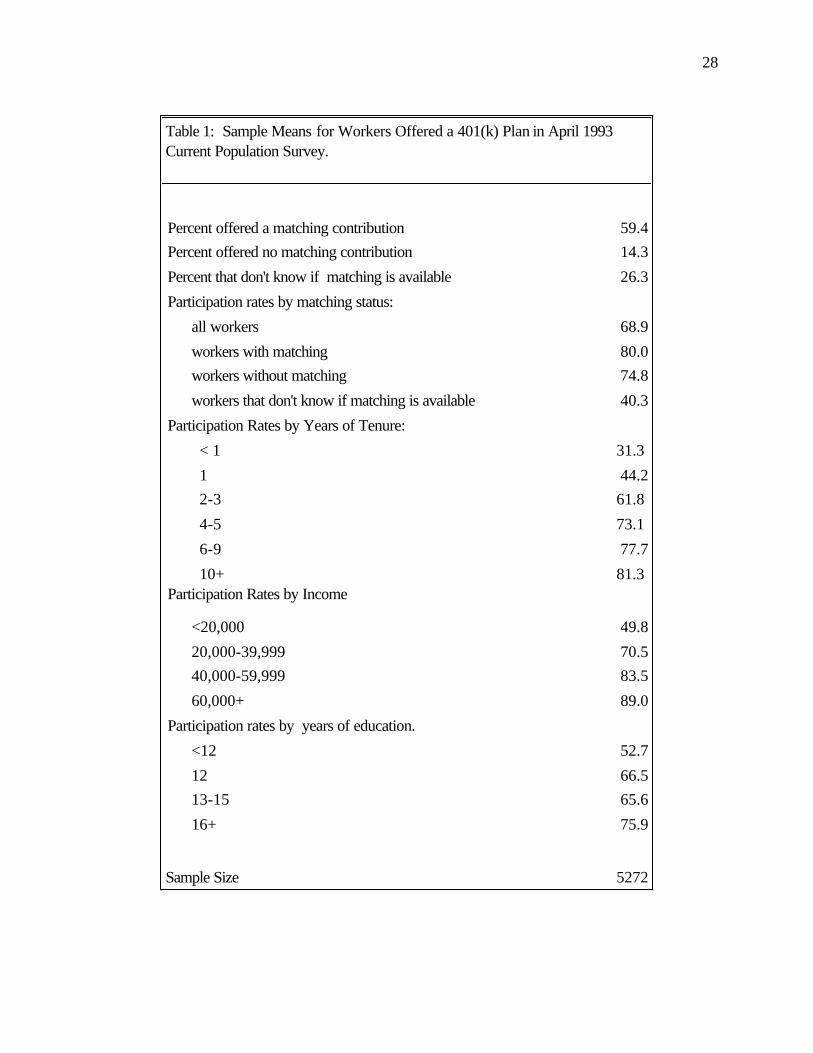
In table 1, sample statistics are presented for the workers who are offered a 401(k) plan. Of
the 5,272 workers offered a 401(k) plan, 59.4 percent reported that their employer provided matching
contributions, 14.3 percent reported no matching contributions, and the remaining 26.3 percent did not
know whether there were matching contributions.
Comparing participation rates according to matching status reveals participation rates of 80.0
percent among those with matching, 74.8 percent among those without matching, and 40.3 percent
among those that did not indicate whether matching was available. Comparing participation rates for
workers with and without matching suggests that matching is associated with only a 5.2 percentage point
higher employee participation rate. The fact that workers who do not know whether matching is
available have such low participation rates may indicate that they are so uninterested in saving that they
have not taken the time to figure out the details of the plan. This suggests that correcting for missing
data could have a potentially important effect on the estimated effect of matching.
The data display a strong positive correlation between tenure and 401(k) participation. As
employee tenure increases from less than one year to ten years, the participation rate rises from 31.3 to
81.3 percent. The strong positive association between tenure and 401(k) participation is strongest in
the first five years with the firm. The rising participation might result from workers learning more about
the plan as they stay with the firm through financial education or peer effects. Alternatively, it could be
10
the result of the type of sorting described by Ippolito (1997) where nonparticipants are more likely to
quit.
5. Determinants of Employee Participation.
This section examines the potential importance of the endogeneity of employer matching in
estimating its effect on employee participation. As a benchmark for comparison with earlier studies that
assume matching is exogenous to participation decisions, we first estimate a probit model of 401(k)
participation with controls for employee tenure, income, educational attainment, age, race, gender, and
union and part-time work status. For married people, we also include controls for spousal income,
employment, and pension plan coverage. Since the availability of other pension plans or benefits could
influence a worker's desire to save through the 401(k), we also include dummy variables indicating
whether the worker (and spouse, if married) is included in any other pension plans, whether the worker
is offered employer-provided health insurance, and whether the worker declines health insurance
coverage when it is available. As an attempt to control for the availability of other fringe benefits that
might influence the desire to save in the 401(k), we also include measures of firm and establishment size.
The model also includes dummy variables to control for the state of residence since differences in state
income tax rates could influence the desire to shelter income through a 401(k) plan.
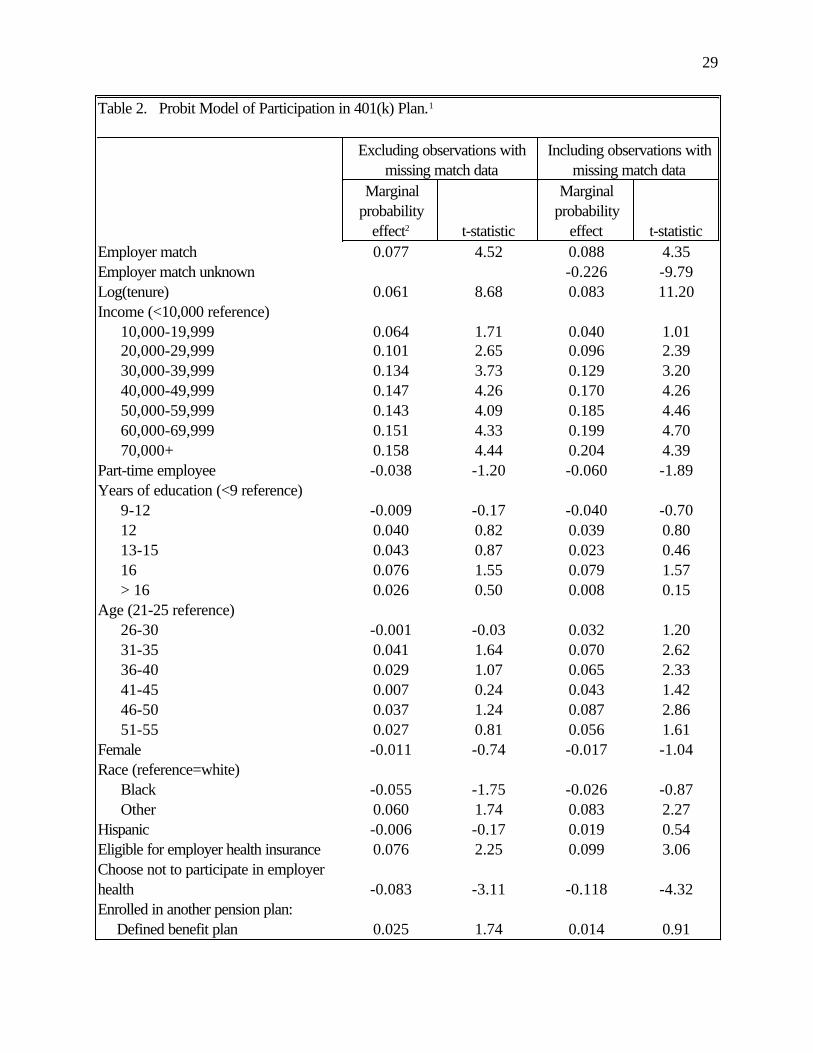
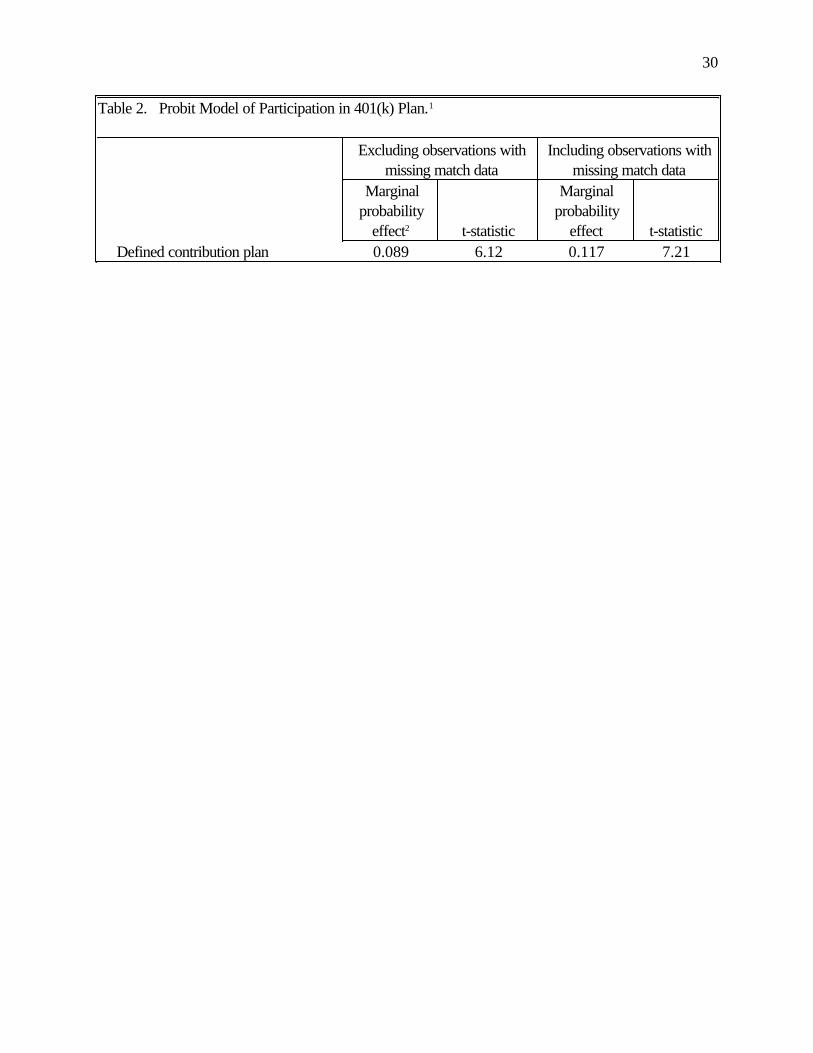
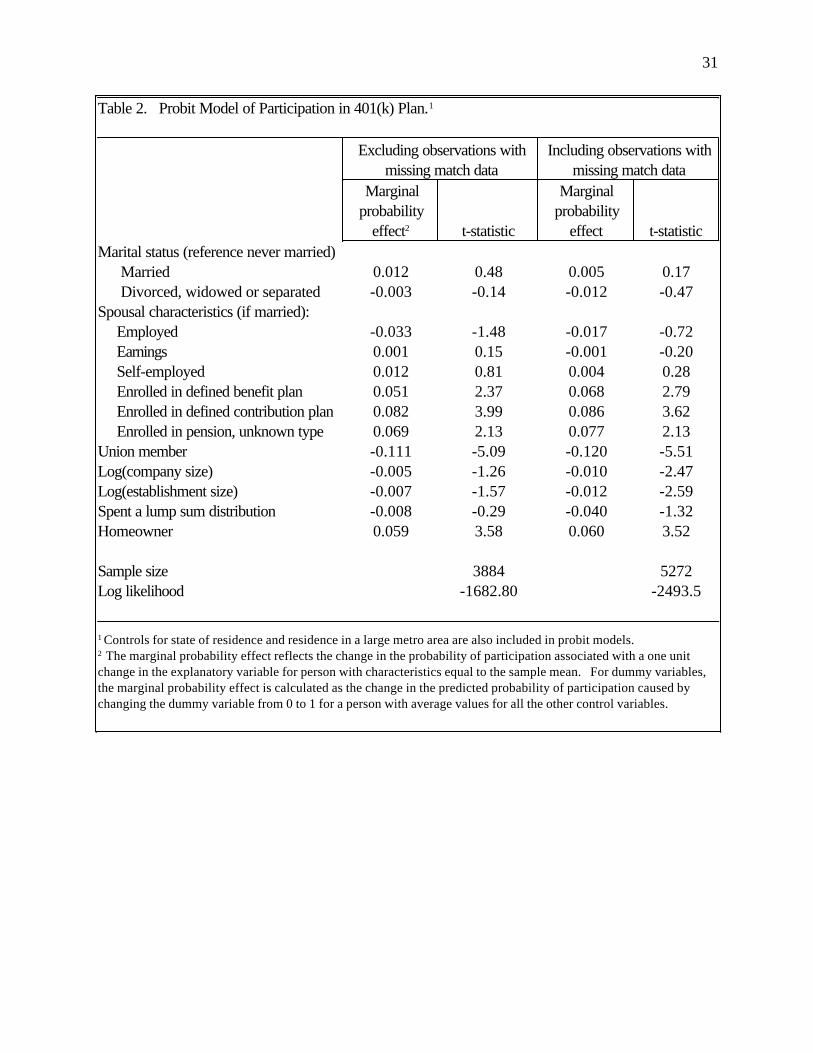
The results of the probit model are presented in table 2. In the first specification, workers with
missing match data are eliminated from the sample. In the second specification, workers with missing
match data are included with a dummy indicating missing match data. The reported marginal
probability effects represent the estimated effect of a one unit change in the explanatory variable on the
11

probability of participation for a person with characteristics equal to the sample mean.16 The estimated
effects of the control variables are consistent with prior studies. For example, participation rises with
employee tenure and income. We also find that workers who are members of a union or employed at
a large firm are less likely to participate. Perhaps the value of participation in the 401(k) is lower at
unionized or large employers since they tend to have more generous pensions.17 Workers who are
included in employer provided health insurance or another pension plan are more likely to participate in
the 401(k). This is rather surprising since these workers already have some tax-deferred saving.
Perhaps participation in another pension plan proxies for a strong taste for saving. Among married
workers, spousal income has no significant effect on the probability of participation. However, if the
employee's spouse is enrolled in a pension, the worker is more likely to participate in the 401(k) plan.
This could reflect a common preference toward saving between husbands and wives.
The estimated effect of matching is only slightly affected by the exclusion of workers with
missing match data. In the specification that includes all workers and a dummy indicating whether
match data is missing, employer matching increase the probability of participation by 8.8 percentage
points. Compared to workers without matching, workers with missing data on matching are estimated
to be 22.6 percentage points less likely to participate.
To determine whether the omission of workers with missing match data biases the estimated
effect of matching, a probit model of participation correcting for sample selection on missing match data
12
17Allen and Clark (1986) and Freeman (1985) both find evidence that unionized workers have more generous pensions.Even and Macpherson (1996) find weak evidence that, among firms with pensions, pension generosity rises withemployer size.
16 To be precise, defining X as the vector of sample means and b as the vector of probit coefficients, the marginalprobability effect for the jth continuous explanatory variable is estimated as v(Xb)*bj where v(.) is the standardnormal probability density function and bj is the probit coefficient corresponding to the j th explanatory variable. Forthe effect of any dummy variable, we estimate the change in the predicted probability of participation with therelevant dummy alternately set to zero and one.
is estimated.18 There are a few results worth reporting. First, there was significantly negative sample
selection. The correlation between the error terms in the participation and sample selection equation
was -.76 and was statistically significant at the .01 level. Correcting for sample selection has little effect
on the estimated effect of matching. With this in mind, the remainder of analysis will simply drop
observations with missing match data in order to simplify the process of correcting for the potential
endogeneity of matching.
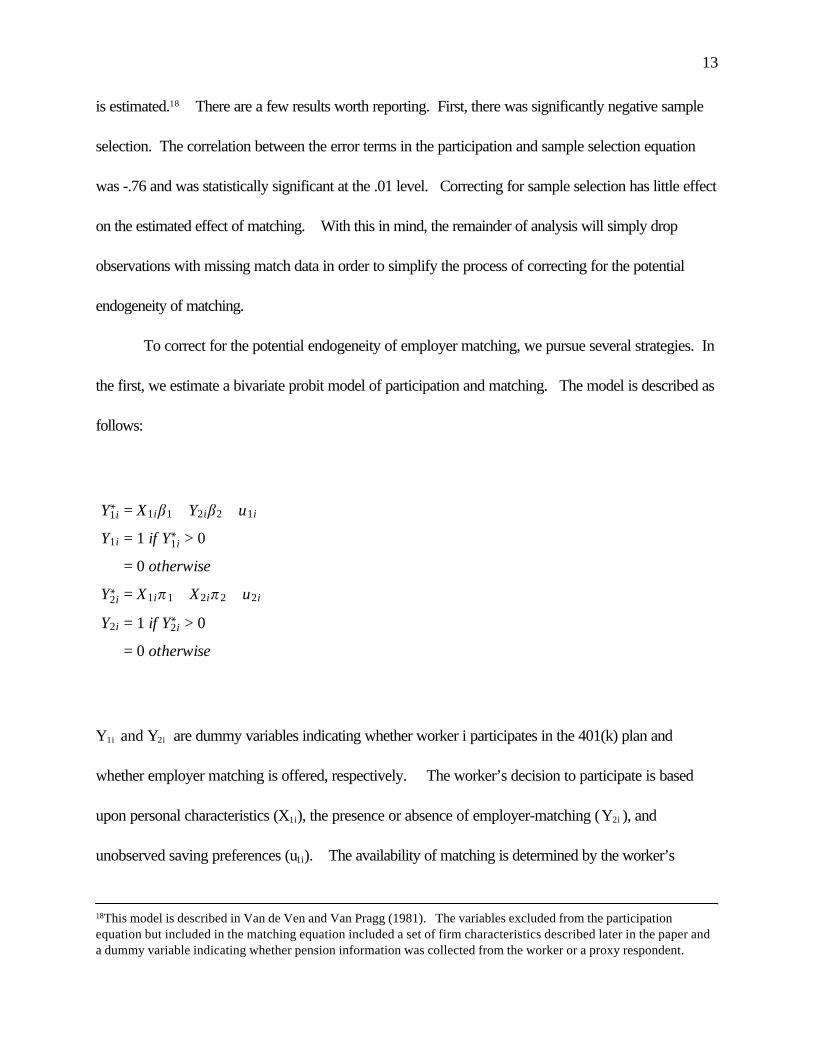
To correct for the potential endogeneity of employer matching, we pursue several strategies. In
the first, we estimate a bivariate probit model of participation and matching. The model is described as
follows:
Y1i& = X1ib1 + Y2ib2 + u1i
Y1i = 1 if Y1i& > 0
= 0 otherwise
Y2i& = X1io1 + X2io2 + u2i
Y2i = 1 if Y2i& > 0
= 0 otherwise
Y1i and Y2i are dummy variables indicating whether worker i participates in the 401(k) plan and
whether employer matching is offered, respectively. The worker’s decision to participate is based
upon personal characteristics (X1i), the presence or absence of employer-matching ( Y2i ), and
unobserved saving preferences (u1i). The availability of matching is determined by the worker’s
13
18This model is described in Van de Ven and Van Pragg (1981). The variables excluded from the participationequation but included in the matching equation included a set of firm characteristics described later in the paper anda dummy variable indicating whether pension information was collected from the worker or a proxy respondent.
characteristics (X1i ), characteristics of the firm’s work force (X2i ), and unobservables (u2i). The error
terms are assumed to have a joint normal distribution with variance normalized to unity. If matching is
endogenous, there will be non-zero correlation between the error terms in the participation and match
equations. The model is estimated using maximum likelihood.
Proper identification of the model’s parameters requires characteristics that belong in the
matching equation but not the participation equation. We rely on the employer’s work force
characteristics as the identifying variables. One justification for this assumption is that a firm’s ability to
satisfy non-discrimination rules will depend largely on the participation and contribution behavior of its
employees. If a firm has a group of non-highly compensated employees with low participation rates, it
may introduce a program of matching contributions to improve participation and comply with the
nondiscrimination laws. At the same time, however, we assume that a worker’s participation decision
is not influenced by the characteristics of coworkers, except through the impact that it has on the
availability of matching.
Ippolito's theory that matching is used to attract and retain workers with low discount rates
does not generate clear cut predictions about the relationship between work force characteristics and
matching. Ippolito argues that the benefits would be higher in work environments where monitoring
costs are high and where lower discount rates have larger positive effects on productivity. Benefits
would also be higher in environments where the extent of discount rate heterogeneity in the hiring pool is
larger since sorting out workers with high discount rates would be more important. If work force
characteristics are useful predictors of such differences across firms, they serve as useful instruments for
the decision to match.
14
The assumption that coworker characteristics do not influence a person's participation behavior
through channels other than the decision to offer a match rate is debatable. For example, Duflo and
Saez (2002, 2003) find evidence of peer effects that could lead to a causal effect of coworker
characteristics on participation. Their evidence suggests, however, that only coworkers with similar
traits (e.g. age and gender) that work in the same department have peer effects.19 There is no evidence
of cross-group effects. Since our identifying variables encompass a much larger group of workers,
their ability to capture peer effects will be muted. Given the potential problems that peer effects present,
however, we are careful to examine the robustness to alternative identifying assumptions and test the
assumptions when possible.
Since we do not have firm level data that would allow us to estimate for each person the
characteristics of coworkers, we gather information on 245,669 private sector wage and salary
workers whose employers offer pension coverage from the March Current Population Surveys from
1989 through 1997 and generate a representative work force representing different combinations of firm
size (4 categories) and 3 digit industries (204 categories) found in the April 1993 Current Population
Survey.20 The average sample size for each firm size / industry cell was 482 workers. The work
force income, hours, age, and education distributions are then merged to each potential 401(k)
participant.
For the participation equation, we include the same worker characteristics as in the earlier
model where matching is assumed exogenous. In the matching equation, the control variables include all
15
20 The four firm size categories are 1-24, 25-99, 100-999, and 1000 or more employees. Whenever a given combinationof 3 digit industry and firm size had less than 50 observations in the March data, cells were merged with the nextlargest firm size category (83 cases) or, if that was insufficient to correct the problem, with a similar industry ( 8cases). After collapsing cells and dropping cell industry/size combinations that were not found among 401(k)eligible workers, there were 510 different firm size / industry combinations.
19 For example, there is evidence that a person's participation decision is affected by coworkers with the same age andgender and working within the same department, but not affected by other coworkers within the department.

the worker characteristics in the participation equation in addition to controls for the work force
education and income distribution, and the percent of workers that are part-time and the percent under
age 21. The education and income distributions are designed to control for the participation rates of the
work force which will affect the ability to pass the nondiscrimination test and/or the benefits to attracting
and retaining low discount workers. Since part-time employees and those under age 21 are exempt
from non-discrimination testing, they could also influence the employer’s decision to provide matching
contributions.
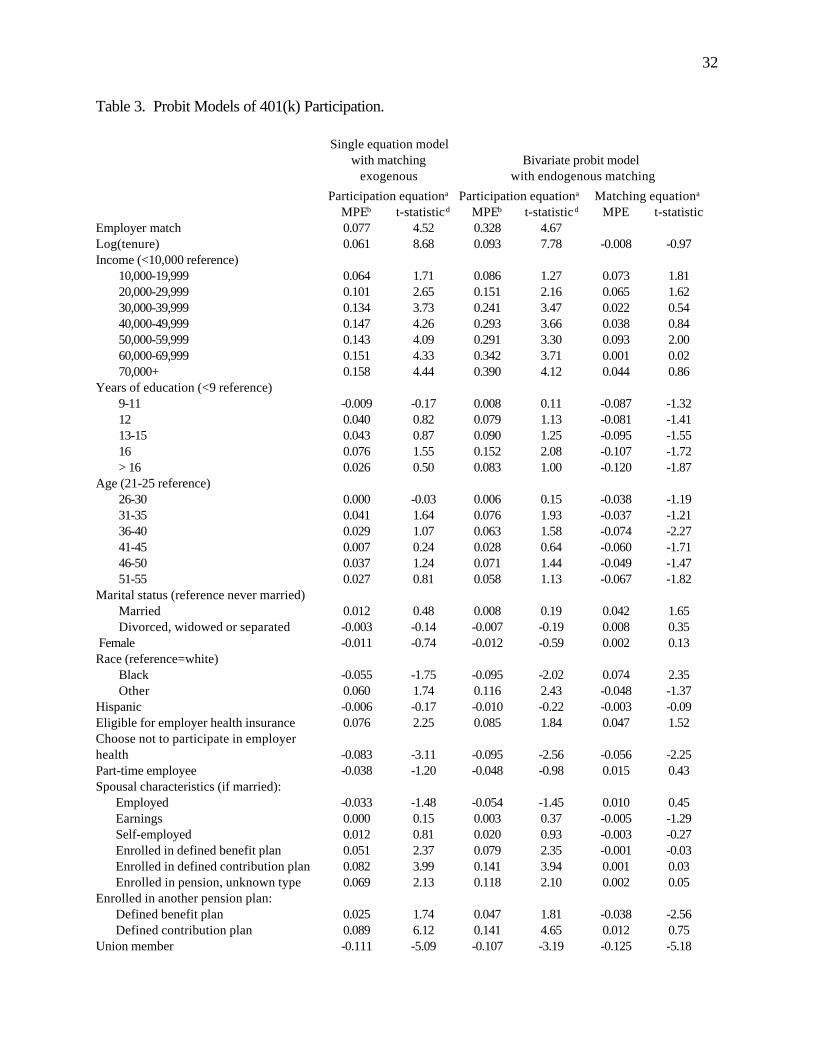
The estimates of the bivariate probit model of participation and matching are in table 3. The
parameter estimates reflect the marginal effect of a one unit change in the explanatory variables on the
probability of an affirmative outcome for the participation and matching decisions for a person with the
average characteristics for the sample.
The probability that a worker is offered matching contributions is lower for workers who are
unionized, at a small firm, or included in a defined benefit plan. The negative effect of unionism on
matching might emerge because a firm's union and nonunion plans are separated for discrimination
testing, perhaps making it easier to satisfy the test. Alternatively, Ippolito (1997) argues that unions
would oppose matching contributions because it differentially rewards workers.
Scale economies in the administration of matching programs may contribute to a higher chance
of matching for employees at large firms. Alternatively, Ippolito argues that the sorting effects of
matching will be greater at large firms where monitoring costs are high. Finally, inclusion in a defined
benefit plan might reduce employees’ willingness to sacrifice additional wages for additional pension
benefits in the form of employer matching contributions.
16

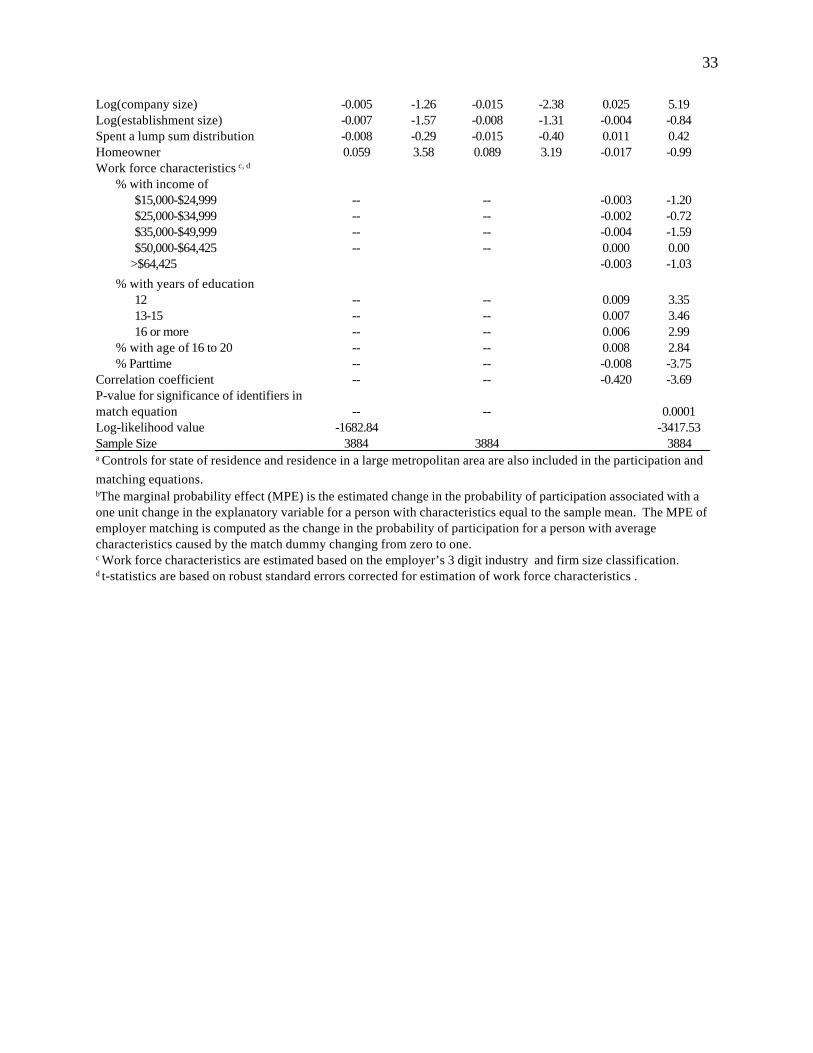
Several of the work force characteristics included in the matching equation also have significant
explanatory power. For example, the percentage of the work force working part time reduces the
chance of matching, whereas a larger percentage of workers under age 21 increases the chance of
matching. The educational distribution of the work force affects the probability of matching in a
non-monotonic fashion. Firms with a larger fraction of workers without high school degrees are less
likely to provide matching. The income distribution also affects the probability of matching in a
non-monotonic manner, and the effect is marginally significant.21
Considered as a whole, the evidence on the relationship between work force characteristics and
matching makes it difficult to draw any conclusions regarding the relative importance of the two theories
of matching. Nevertheless, the model provides strong evidence that matching is endogenous to worker
participation decisions. The correlation coefficient between the error terms in the matching and
participation equations is -.42 and statistically significant at the .01 level. The negative correlation
coefficient suggests that workers with unobservables that positively influence participation are less likely
to have matching, ceteris paribus. This negative correlation is consistent with nondiscrimination rules
causing matching to be more likely when participation rates are low. It is difficult to judge whether
such correlation is consistent with Ippolito's selection and retention theory of matching. On the one
hand, if matching attracts and retains low discounters, there should be positive correlation between
unobserved saving preferences and matching. On the other hand, the benefits of using a match to
attract and retain low discounters could be greater when there is a large number of high discounters in
the work force. The theory is not sufficiently well developed to make a prediction on the net effect.
17
21 The p-value for the hypothesis that all the work force income distribution coefficients are jointly equal to zero is.10.

Relaxing the exogeneity assumption dramatically alters the estimated effect of matching on
participation. In the model with exogenous matching (table 2), matching was estimated to increase the
probability of participation by .072. Allowing for endogenous matching increases the estimated effect
to .328. The increase in the estimated effect is expected given that the bivariate probit model revealed
negative correlation between the unobservables affecting matching and those affecting participation.
Consequently, workers with matching tend to be those with low participation rates, ceteris parabus.
The failure to account for this in the model with exogenous matching leads to an underestimate of the
effect of matching.
While it is difficult to provide simple intuition for changes in coefficients other than that on the
match variable, it is worth noting that correcting for endogeneity substantially increases the estimated
effect of income, education, age, and employee tenure on participation rates. In several cases, the
estimated marginal probability effect of the variable more than doubles.
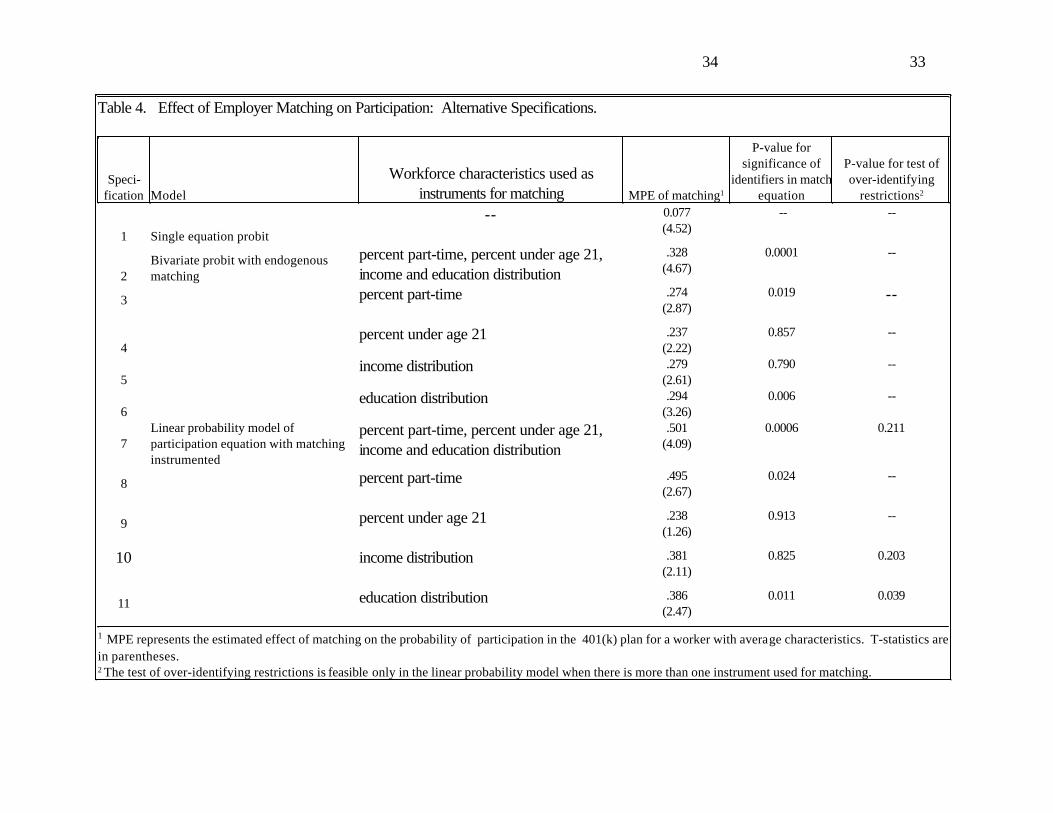
An important concern with the bivariate probit model is the validity of the identifying
assumptions. There is no perfect means to test these assumptions. However, several diagnostics can
be used to examine their validity. Table 4 summarizes our efforts to test for robustness. The first
approach we pursue is to use different combinations of work force characteristics as the identifying
variable. Specifications 2-6 list the estimated effect of matching on participation using the bivariate
probit model and alternative sets of work force characteristics as instruments. The estimated effect
ranges from .237 to .328 across the five specifications suggesting that the estimated effect of matching is
fairly robust to the choice of identifying variables.
A second approach we employ is to test overidentifying assumptions inherent in our
specification. Unfortunately, we are unaware of any approach for testing these assumptions in a
18
nonlinear model such as the bivariate probit model employed here. As an alternative, we estimate a
linear probability model (LPM) of participation. We instrument for the endogenous match variable
using the same work force characteristics as in the bivariate probit model. The process is as follows:
First, estimate a probit model of matching as a function of all the exogenous variables used in the
participation equation (X1) and the work force characteristics used as identifying instruments (X2).
Second, obtain the fitted probabilities of matching and use two-step IV methods to estimate theM̂
linear probability model of participation using , X1, and a constant as instruments.22 This approachM̂
has two advantages relative to the bivariate probit model. First, the distributional assumptions required
are not as restrictive. Second, using a LPM for the participation equation generates residuals which
allow a test of over-identifying assumptions.23
For all five specifications considered, the estimated effect of matching on participation is higher
in the linear probability than in the bivariate probit model. The estimated effects range from .24 to .53.
Three of the five specifications have over-identifying restrictions that are testable in the LPM. The
restrictions are not rejected at the .20 level in the specifications with the education distribution or all
work force characteristics as the identifying instruments (specifications 7 and 10). The restrictions are
rejected, however, at the .05 level when variables capturing only the education distribution are used as
the instruments (specification 11).
The major conclusion we draw from the above analysis is that there is substantial, but not
conclusive, evidence that employer decisions to provide matching contributions are correlated with their
employee’s saving preferences. Assuming exogenous matching, employer matching is estimated to
increase the probability of participation by only 5 to 10 percentage points. Allowing for endogenous
19
23 The test for over-identifying assumptions is described in Wooldridge (2002), p.123.
22 This method of instrumenting for an endogenous dummy variable is described in Wooldridge (2002), p. 623.
matching, the estimated effect of matching increases to somewhere between 24 and 53 percentage
points. Our key concern with the results is the validity of the identifying assumptions. If panel data on
matching and participation behavior were available, we could provide a more accurate test of the
hypothesis. Unfortunately, such data are not publicly available.
7. Endogenous Tenure.
As noted earlier, participation rates in 401(k) plans rise dramatically with employee tenure.
One explanation for this might be that as workers become better informed about the 401(k) plan they
eventually decide to participate. Alternatively, the tenure effect may reflect the type of sorting
described by Ippolito (1997) where savers are more likely to stay with the firm. Low tenure workers
would consist of a mix of savers and nonsavers but nonsavers are more likely to leave. This type of
sorting would generate a participation rate that rises with tenure, even if a given worker rarely changes
participation status during her tenure with the firm.24 If sorting is part of the explanation for participation
rates rising with tenure, tenure will be positively correlated with the unobservables in the participation
equation, thus creating an upward bias on the estimated effect of tenure.
One test of the sorting hypothesis is whether 401(k) participation is a useful predictor of
whether a worker quits, ceteris paribus. To test this, we matched workers eligible for a 401(k) plan in
the April 1993 CPS with follow-up data in the April 1994 CPS.25 We define a worker as a job
20
25 Given how the CPS rotates people in and out of the sample, only one-half of the people asked the pensionquestions in April 1993 are eligible for a follow-up interview in April 1994. There is also some attrition in the CPS, soless than one-half of the April 1993 sample of 401(k) eligible workers are matched in the April 1994 data.
24 Using data on a single plan, Kusko, Poterba and Wilcox (1998) find a high degree of persistence in employeeparticipation behavior. Over a two year period, 98 percent of workers contributing in the first year also contributed inthe second; and only 8 percent of workers who did not contribute in the first year began contributing in the secondyear.
changer if she changes 3 digit occupation and industry between surveys, or is no longer employed in
April 1994. This measure of job change is not perfect, but we have no reason to believe that the
measurement error is correlated with a worker’s decision to participate in the 401(k).26
A probit model of the job change outcome is estimated with the panel data. The results are
presented in table 5. The job change regressions include controls for tenure, a quadratic in age,
education, race and gender. While the decision to participate has only weak predictive power for job
changes in the population as a whole, it has strong and significant explanatory power for workers in their
first few years with the firm. Among workers with less than 3 years of tenure, the estimates suggest that
the probability of a job change is 14 percentage points higher among workers who choose not to
participate in the 401(k). This is a substantial difference given that the average probability of job
change observed for workers with less than 3 years of tenure is 27 percent.27
The fact that 401(k) nonparticipants are more likely to quit creates the potential for a positive
correlation between unobservables that influence participation and tenure. To examine whether this
creates a bias on the estimated effect of tenure on participation, we reestimated the participation
equation by replacing the log of tenure with its predicted value in the probit model of participation with
endogenous matching.28 The control variables for the tenure equation include all of the personal and
21
28 The participation model is identical to specification (6) of table 4 except that log-tenure is replaced by its predicted
27 We also estimated a specification with all workers that included interactions between 401(k) participation andtenure for all workers. The results reveal that 401(k) participation has significant predictive power in only the first 2years of tenure.
26 Workers who leave employment or switch employers are counted as job changes. We are confident in measuringthe number who leave employment accurately. However, four-fifths of the measured job changes are due to areported change in 3-digit occupation and industry. To check the accuracy of occupation and industry changes as inindicator of a change in employers, we use several CPS surveys (January 1983, May 1983, January 1987, May 1988,January 1991, April 1993, February 1996, February 1998, and February 2000) that include job tenure to create a moreaccurate measure of job change and compare it to the one employed in this study. The CPS surveys with tenure dataare matched with CPS data from one year earlier to create 9 different 2-year panels. If a worker who is employed inboth years of a panel reports tenure of less than one year in the second year of that panel, she is assumed to be a jobchanger. The correlation between the tenure based and 3-digit occupation/industry based measure of changingemployers is .35 and is statistically significant at the .001 level.
firm characteristics used in the match or participation equation. The identifying variables for the tenure
equation are the same as those used for the match equation. The results reveal that correcting for the
potential endogeneity of tenure causes the estimated effect of tenure to drop towards zero and become
statistically insignificant.29 A Hausman test of the null hypothesis that tenure is exogenous to the
participation decision is rejected at the .01 level.30 Using the linear probability model of participation,
the over-identifying assumptions necessary for the endogenous tenure model are not rejected at the .10
level. Overall, the results suggest that a failure to correct for the endogeneity of tenure in the match
equation leads to an overestimate of its effect on 401(k) participation.
The fact that 401(k) non-participants are less likely to quit and that tenure is not exogenous to
401(k) participation decisions is consistent with the sorting hypothesis proposed by Ippolito where
401(k) nonparticipants are more likely to quit. As noted earlier, however, alternative explanations are
that workers who anticipate quitting are less likely to join the 401(k) plan because the rate of return on
contributions might be lower if employer contributions do not vest prior to their expected departure, or
because they need access to their funds in anticipation of an employment separation.
6. Summary and Conclusions.
This study provides new evidence on the economics of 401(k) plans. It examines some of the
empirical implications of explanations proposed for why employers match employee contributions to
22
30 To perform the Hausman test of exogeneity, we include the residual from the log(tenure) equation in theparticipation equation along with predicted tenure and perform a t-test of the null hypothesis that the coefficient onthe tenure residual equals zero.
29 The marginal effect of tenure on the estimated probability of participation dropped to .02 with a t-statistic of 0.14.value.
401(k) plans. While the work does not empirically distinguish between alternative theories of matching,
we find evidence that a failure to account for the possible influence of employee saving preferences on
employer matching may lead to a dramatic understatement of the impact of matching on employee
participation.
This study also provides support for the hypothesis that the decision to participate in a 401(k)
plan is a signal of whether the worker is likely to quit, particularly in the early years of employment.
This result is consistent with the Ippolito (1997) model of 401(k) sorting where high discounters who
place little value on the 401(k) plan are more likely to leave the firm. An alternative explanation,
however, is that workers who anticipate quitting are less likely to participate in the 401(k) because they
wish to maintain access to their savings or the failure to vest in the plan prior to departure could reduce
their return on contributions.
Our approach for testing for endogenous matching relies on an important identifying assumption
-- namely, work force characteristics influence whether the employer provides matching contributions
and are uncorrelated with unobserved worker saving preferences. There is mixed evidence for these
over-identifying assumptions which raises some question about the validity of our results on matching. If
panel data with the necessary information on matching and employee tenure becomes available in the
future, more conclusive evidence could be obtained without relying the identifying assumptions we
employ. Nevertheless, a compelling case has been made for two points: First, the literature may be
underestimating employee response elasticities to matching by ignoring the endogeneity issue. Second,
because employee saving behavior is influenced by mobility intentions, the effect of employee tenure on
saving behavior may be overestimated. If panel data on 401(k) saving behavior becomes available in
the future, the extent of these problems could be more accurately measured.
23
Since our analysis relies upon data from 1993, any changes over the past decade in the
incentives for employers to provide matching contributions or for employees to participate in 401(k)
plans could affect the applicability of our findings to today's environment. Some changes that may have
had an impact over the past decade include the fact that nondiscrimination rules were changed [Clark,
Mulvey and Schieber (2004)], 401(k) participation rates increased [Munnell and Sunden 2004], and
the tax system was modified. These changes could affect both employer willingness to provide
matching contributions and employee willingness to participate. Nevertheless, we believe that these
changes are insufficient to alter the qualitative conclusions about the relationship between matching,
employee participation, and employee turnover.
24
References.
Allen, Steven G. and Clark, Robert L. "Unions, Pension Wealth, and Age-Compensation Profiles," Industrial and Labor Relations Review 39 (July 1986): 502-517.
Andrews, Emily. "The Growth and Distribution of 401(k) Plans. "In Trends in Pensions 1992, editedby John Turner and Daniel Beller, Washington, DC: U.S. Government Printing Office, 1992, pp.149-176.
Basset, William F.; Fleming, Michael J.; and Rodrigues, Anthony P. “How Workers Use 401(k) Plans:The Participation, Contribution, and Withdrawal Decisions.” National Tax Journal (June 1998):263-289.
Bernheim, B. Douglas and Garrett , Daniel M. "The Determinants and Consequences of FinancialEducation in the Workplace: Evidence from a Survey of Households." National Bureau ofEconomic Research Working Paper No. 5667, July 1996.
Clark, Robert L. and Schieber, Sylvester J. “Factors Affecting Participation and Contribution Levels in401(k) Plans,” in Living with Defined Contribution Pensions: Remaking Responsibility forRetirement, edited by Olivia S. Mitchell and Sylvester J. Schieber. Philadelphia: University ofPennsylvania Press, 1998, pp. 69-97.
Clark, Robert; Jane Mulvey, and Sylvester Schieber. "Effects of Nondiscrimination Rules on PensionParticipation." in Private Pensions and Public Policies, edited by William Gale, John Shoven,and Mark Warshawsky. Washington D.C.: Brookings Institution Press (2004): 259-289.
Copeland, Craig. "An Analysis of the Retirement and Pension Plan Coverage Topical Module of SIPP,"EBRI Issue Brief Number 245, May 2002
Duflo, Esther and Saez, Emmanuel. "Participation and Investment Decisions in a Retirement Plan: TheInfluence of Colleagues' Choices." Journal of Public Economics 85 (July 2002): 121-148.
_________. The Role of Information and Social Interactions in Retirement Plan Decisions: Evidencefrom a Randomized Experiment. Quarterly Journal of Economics 118 (August 2003): 815-842.
Engelhardt, Gary and Anil Kumar. “Understanding the Impact of Employer Matching on 401(k)Saving.” TIAA-CREF Research Dialogue 76, June 2003.
Even, William E. and Macpherson, David A. "Why Did Male Pension Coverage Decline in the1980s?" Industrial and Labor Relations Review 47 (April 1994): 439-453.
25
_________. "Educational Attainment and Trends in Pension Coverage." Report to U.S Department ofLabor Pension and Welfare Benefits Administration, 1995.
_________. "Employer Size and Labor Turnover: The Role of Pensions," Industrial and LaborRelations Review 49 (July 1996): 707-728.
Freeman, Richard B. "Unions, Pensions, and Pension Funds," in Pensions, Labor, and IndividualChoice, edited by David A. Wise. Chicago: University of Chicago Press, 1985.
Garrett, Daniel. “The Effects of Nondiscrimination Rules on 401(k) Contributions,” unpublished paper,December 1995.
Green, L. Bernard "Questions and Answers About Cash Balance Plans," September 22, 2003,available at http://www.bls.gov/opub/cwc/cm20030917ar01p1.htm.
Hewitt & Associates. 401(k) Plan Hot Topics. 1993.
Ingham, Kenneth. "401(k) Plans: Can You Pass the Test?" HR Focus 68 (November 1991): 15-16.
Ippolito, Richard A. Pension Plans and Employee Performance, Chicago: University of ChicagoPress, 1997.
Jason, Julie. The 401(K) Plan Handbook. Upper Saddle River, NJ: Prentice Hall, 1997.
Kusko, Andrea; Poterba, James; and Wilcox, David. "Employee Decisions with Respect to 401(k)Plans: Evidence from Individual Level Data." in Living with Defined Contribution Pensions:Remaking Responsibility for Retirement, edited by Olivia Mitchell and Sylvester Schieber. Philadelphia PA: University of Pennsylvania Press, 1998.
McGill, Dan M.; Brown, Kyle N.; Haley, John J.; and Schieber, Sylvester J. Fundamentals ofPrivate Pensions. Philadelphia: University of Pennsylvania Press, 1996.
Miller, Jeffrey M. and Phillips, Maureen M. The 401(K) Management Handbook: A Guide forSponsors and Their Advisors. Chicago: Irwin Publishing, 1996.
Munnell, Alicia and Annika Sunden. Coming Up Short: The Challenge of 401(k) Plans.Washington D.C.: Brookings Institution Press (2004).
Nicholson, Laurel A. 401(K) Plans. Washington, D.C.: Bureau of National Affairs, 1995.
Papke, Leslie. "Participation in and Contributions to 401(k) Pension Plans." Journal of HumanResources 30 (Spring 1995): 311-325.
26
_________ , Petersen, Mitchell; and Poterba, James. "Do 401(k) Plans Replace Other EmployerProvided Pensions?" In Advances in the Economics of Aging, edited by David A.Wise. Chicago:University of Chicago Press, 1996.
_________ , and Poterba, James. "Survey Evidence on Employer Match Rates and Employee SavingBehavior in 401(k) Plans." Economics Letters 49 (September 1995): 313-317.
Pension and Welfare Benefits Administration, "Abstract of 1998 Form 5500 Annual Reports," PrivatePension Plan Bulletin 11, Winter 2001/2002.
Phillip, Christine. "More Flunking Out at Test Time." Pension and Investment Age 21 (November1993): 19-21.
Van de Ven, W.P.M.M. and B.M.S. Van Pragg. “The Demand for Deductibles in Private HealthInsurance: A Probit Model with Sample Selection.” Journal of Econometrics 17 (1981):229-252.
VanDerhei, Jack; Copeland, Craig; and Quick, Carol. “A Behavioral Model for Predicting EmployeeContributions to 401(k) Plans: Preliminary Results.” Employee Benefits Research Institute,unpublished manuscript, February 2000.
Wooldridge, Jeffrey M. Econometric Analysis of Cross Section and Panel Data. Cambridge, MA:MIT Press, 2002.
27
5272Sample Size
75.916+
65.613-1566.512
52.7<12
Participation rates by years of education.
89.060,000+
83.540,000-59,99970.520,000-39,999
49.8<20,000
Participation Rates by Income 81.3 10+
77.7 6-9
73.1 4-5
61.8 2-3 44.2 1
31.3 < 1
Participation Rates by Years of Tenure:
40.3workers that don't know if matching is available
74.8workers without matching80.0workers with matching
68.9all workers
Participation rates by matching status:
26.3Percent that don't know if matching is available
14.3Percent offered no matching contribution59.4Percent offered a matching contribution
Table 1: Sample Means for Workers Offered a 401(k) Plan in April 1993Current Population Survey.
28
0.910.0141.740.025Defined benefit planEnrolled in another pension plan:
-4.32-0.118-3.11-0.083Choose not to participate in employerhealth
3.060.0992.250.076Eligible for employer health insurance0.540.019-0.17-0.006Hispanic2.270.0831.740.060 Other-0.87-0.026-1.75-0.055 Black
Race (reference=white)-1.04-0.017-0.74-0.011Female1.610.0560.810.027 51-552.860.0871.240.037 46-501.420.0430.240.007 41-452.330.0651.070.029 36-402.620.0701.640.041 31-351.200.032-0.03-0.001 26-30
Age (21-25 reference)0.150.0080.500.026 > 161.570.0791.550.076 160.460.0230.870.043 13-150.800.0390.820.040 12-0.70-0.040-0.17-0.009 9-12
Years of education (<9 reference)-1.89-0.060-1.20-0.038Part-time employee4.390.2044.440.158 70,000+4.700.1994.330.151 60,000-69,9994.460.1854.090.143 50,000-59,9994.260.1704.260.147 40,000-49,9993.200.1293.730.134 30,000-39,9992.390.0962.650.101 20,000-29,9991.010.0401.710.064 10,000-19,999
Income (<10,000 reference)11.200.0838.680.061Log(tenure)-9.79-0.226Employer match unknown4.350.0884.520.077Employer match
t-statistic
Marginalprobability
effectt-statistic
Marginalprobability
effect2
Including observations withmissing match data
Excluding observations withmissing match data
Table 2. Probit Model of Participation in 401(k) Plan.1
29
7.210.1176.120.089Defined contribution plant-statistic
Marginalprobability
effectt-statistic
Marginalprobability
effect2
Including observations withmissing match data
Excluding observations withmissing match data
Table 2. Probit Model of Participation in 401(k) Plan.1
30
1 Controls for state of residence and residence in a large metro area are also included in probit models. 2 The marginal probability effect reflects the change in the probability of participation associated with a one unitchange in the explanatory variable for person with characteristics equal to the sample mean. For dummy variables,the marginal probability effect is calculated as the change in the predicted probability of participation caused bychanging the dummy variable from 0 to 1 for a person with average values for all the other control variables.
-2493.5-1682.80Log likelihood 52723884Sample size
3.520.0603.580.059Homeowner-1.32-0.040-0.29-0.008Spent a lump sum distribution-2.59-0.012-1.57-0.007Log(establishment size)-2.47-0.010-1.26-0.005Log(company size)-5.51-0.120-5.09-0.111Union member2.130.0772.130.069Enrolled in pension, unknown type3.620.0863.990.082Enrolled in defined contribution plan2.790.0682.370.051Enrolled in defined benefit plan0.280.0040.810.012Self-employed-0.20-0.0010.150.001Earnings-0.72-0.017-1.48-0.033Employed
Spousal characteristics (if married):-0.47-0.012-0.14-0.003 Divorced, widowed or separated0.170.0050.480.012 Married
Marital status (reference never married)t-statistic
Marginalprobability
effectt-statistic
Marginalprobability
effect2
Including observations withmissing match data
Excluding observations withmissing match data
Table 2. Probit Model of Participation in 401(k) Plan.1
31
-5.18-0.125-3.19-0.107-5.09-0.111Union member0.750.0124.650.1416.120.089Defined contribution plan-2.56-0.0381.810.0471.740.025Defined benefit plan
Enrolled in another pension plan:0.050.0022.100.1182.130.069Enrolled in pension, unknown type0.030.0013.940.1413.990.082Enrolled in defined contribution plan-0.03-0.0012.350.0792.370.051Enrolled in defined benefit plan-0.27-0.0030.930.0200.810.012Self-employed-1.29-0.0050.370.0030.150.000Earnings0.450.010-1.45-0.054-1.48-0.033Employed
Spousal characteristics (if married):0.430.015-0.98-0.048-1.20-0.038Part-time employee-2.25-0.056-2.56-0.095-3.11-0.083
Choose not to participate in employerhealth
1.520.0471.840.0852.250.076Eligible for employer health insurance-0.09-0.003-0.22-0.010-0.17-0.006Hispanic-1.37-0.0482.430.1161.740.060 Other2.350.074-2.02-0.095-1.75-0.055 Black
Race (reference=white)0.130.002-0.59-0.012-0.74-0.011 Female0.350.008-0.19-0.007-0.14-0.003 Divorced, widowed or separated1.650.0420.190.0080.480.012 Married
Marital status (reference never married)-1.82-0.0671.130.0580.810.027 51-55-1.47-0.0491.440.0711.240.037 46-50-1.71-0.0600.640.0280.240.007 41-45-2.27-0.0741.580.0631.070.029 36-40-1.21-0.0371.930.0761.640.041 31-35-1.19-0.0380.150.006-0.030.000 26-30
Age (21-25 reference)-1.87-0.1201.000.0830.500.026 > 16-1.72-0.1072.080.1521.550.076 16-1.55-0.0951.250.0900.870.043 13-15-1.41-0.0811.130.0790.820.040 12-1.32-0.0870.110.008-0.17-0.009 9-11
Years of education (<9 reference)0.860.0444.120.3904.440.158 70,000+0.020.0013.710.3424.330.151 60,000-69,9992.000.0933.300.2914.090.143 50,000-59,9990.840.0383.660.2934.260.147 40,000-49,9990.540.0223.470.2413.730.134 30,000-39,9991.620.0652.160.1512.650.101 20,000-29,9991.810.0731.270.0861.710.064 10,000-19,999
Income (<10,000 reference)-0.97-0.0087.780.0938.680.061Log(tenure)
4.670.3284.520.077Employer match t-statisticMPEt-statisticdMPEbt-statisticdMPEb
Matching equationaParticipation equationaParticipation equationa
Bivariate probit model with endogenous matching
Single equation modelwith matching
exogenous
Table 3. Probit Models of 401(k) Participation.
32
a Controls for state of residence and residence in a large metropolitan area are also included in the participation andmatching equations. bThe marginal probability effect (MPE) is the estimated change in the probability of participation associated with aone unit change in the explanatory variable for a person with characteristics equal to the sample mean. The MPE ofemployer matching is computed as the change in the probability of participation for a person with averagecharacteristics caused by the match dummy changing from zero to one. c Work force characteristics are estimated based on the employer’s 3 digit industry and firm size classification. d t-statistics are based on robust standard errors corrected for estimation of work force characteristics .
388438843884Sample Size-3417.53-1682.84Log-likelihood value0.0001----
P-value for significance of identifiers inmatch equation
-3.69-0.420----Correlation coefficient -3.75-0.008----% Parttime2.840.008----% with age of 16 to 202.990.006----16 or more3.460.007----13-15 3.350.009----12
% with years of education
-1.03-0.003 >$64,4250.000.000----$50,000-$64,425-1.59-0.004----$35,000-$49,999-0.72-0.002----$25,000-$34,999-1.20-0.003----$15,000-$24,999
% with income ofWork force characteristics c, d
-0.99-0.0173.190.0893.580.059Homeowner0.420.011-0.40-0.015-0.29-0.008Spent a lump sum distribution-0.84-0.004-1.31-0.008-1.57-0.007Log(establishment size)5.190.025-2.38-0.015-1.26-0.005Log(company size)
33
1 MPE represents the estimated effect of matching on the probability of participation in the 401(k) plan for a worker with average characteristics. T-statistics arein parentheses.2 The test of over-identifying restrictions is feasible only in the linear probability model when there is more than one instrument used for matching.
0.0390.011.386(2.47)
education distribution11
0.2030.825.381(2.11)
income distribution10
--0.913.238(1.26)
percent under age 219
--0.024.495(2.67)
percent part-time8
0.2110.0006.501(4.09)
percent part-time, percent under age 21, income and education distribution
Linear probability model ofparticipation equation with matchinginstrumented
7
--0.006.294(3.26)
education distribution6
--0.790.279(2.61)
income distribution5
--0.857.237(2.22)
percent under age 214
--0.019.274(2.87)
percent part-time3
--0.0001.328(4.67)
percent part-time, percent under age 21, income and education distribution
Bivariate probit with endogenousmatching2
-- --0.077(4.52)
--Single equation probit 1
P-value for test ofover-identifying
restrictions2
P-value forsignificance of
identifiers in matchequationMPE of matching1
Workforce characteristics used asinstruments for matchingModel
Speci-fication
Table 4. Effect of Employer Matching on Participation: Alternative Specifications.
34 33
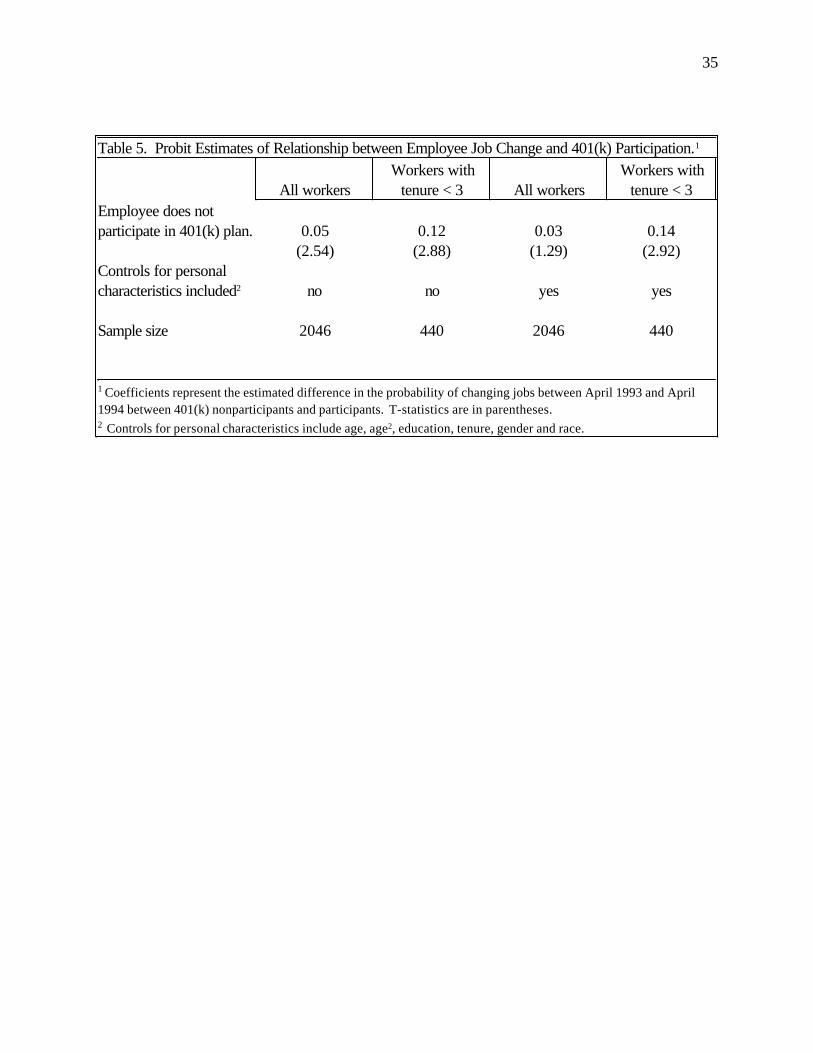
1 Coefficients represent the estimated difference in the probability of changing jobs between April 1993 and April1994 between 401(k) nonparticipants and participants. T-statistics are in parentheses.2 Controls for personal characteristics include age, age2, education, tenure, gender and race.
44020464402046Sample size
yesyesnonoControls for personalcharacteristics included2
(2.92)(1.29)(2.88)(2.54)0.140.030.120.05
Employee does notparticipate in 401(k) plan.
Workers withtenure < 3All workers
Workers withtenure < 3All workers
Table 5. Probit Estimates of Relationship between Employee Job Change and 401(k) Participation.1
35