determinant factors in receiving going concern audit opinions
TRANSCRIPT
eCo-Fin Vol.1, No.3, November 2019
Available online at: https://jurnal.kdi.or.id/index.php/ef
ISSN 2656-095X (online) 2656-0941 (print) © The Authors. Published by Komunitas Dosen Indonesia. doi: https://doi.org/10.32877/ef.v1i1.52
Determinant Factors in Receiving Going Concern Audit
Opinions
Rina Aprilyanti1, Surachmat Wijaya3 1)2)3) Universitas Buddhi Dharma 1)2)3)Jl. Imam Bonjol No. 41 Karawaci Ilir-Tangerang 1115 1)[email protected] Article history:
Received 15 September 2019; Revised 25 September 2019;
Accepted 5 October 2019;
Available online 3 November 2019
Keywords:
Sustainability Report, Opinion Going Concern,
Reporting,
IDX, opinion,
company size
Abstract
The aims of this study is to determine whether or not there is (1)Impact of the
Sustainability Report (SR) and company’s size towards acceptance of opinions
going concern, (2) The Sustainability Report (SR) is categorized into three different
dimensional disclosures based on guidelines made by the Global Reporting
Initiative (GRI) that is The G4 Guidelines, with the Division of Economic
Dimension (X1), environmental Dimension (X2) and social Dimension (X3) and (4)
size of the company in the company's total assets (X4). The Sustainability report
(Sustainability Report) is becoming a highlight and the need for progressive
companies to inform about their economic, social and environmental performance as
well as to all stakeholders of the company. In this study, data analysis used
descriptive statistical analysis and hypothesis testing using a logistic regression
analysis method, sample determination in this study is using a purposive sampling
method as much as 10 companies with a total of 30 samples from the year 2014 –
2016 used as research data. Results showed that a partial disclosure of economic
dimensions, environmental dimensions and social dimensions in the Sustainability
Report and the size of the company had no significant influence on the company's
financial performance, so the results were rejected. In-depth discussions and data
analysis using linear logistical regression, the conclusion that the disclosure of
economic dimension variables, environmental dimensions, and social dimension and
company size have no significant effect on Acceptance opinion going concern.
I. INTRODUCTION
The Sustainability report (Sustainability Report) is becoming a highlight and the need for progressive companies
to inform about their economic, social and environmental performance as well as to all stakeholders of the company.
It can be see from the number of participants who participated in the Indonesian Sustainability Report Awards
(ISRA) which has increased the number of participants from year to year, namely in the year 2005 there is only 1
(one) Company participant Disclose Sustainability Report and there are 50 (fifty) participants at the end of the year
2016 and won by PT. Company Gas Negara (Persero) Tbk. As the general champion of the most category wins total
(Reporting, National Center for Sustainability, 2016). This event also expects to be one of the attractions for other
companies to be able to create the Sustainability Report as one of the reports that and become a company's
obligation in reporting its business activities during a period.
Sustainability Report is expected to disclose financial disclosure or non-financial information of companies that is
cover the three different aspects of social, environmental and economic. Some companies begin to conduct
Sustainability Report disclosure practices in the disclosure of their financial statements and stand-alone as separate
reports, starting from 2012 Sustainability Report Disclosure is not voluntary (voluntary disclosure) this makes it
impossible for business people to ignore the disclosure Sustainability Report, then need a study or research whether
the disclosure of Sustainability Report and the size of the company influence the acceptance of the Going concern
opinions on the company that has done the activity. Therefore, researchers are interested in research by following
the latest year range when the research is conducted, namely the company that reveals the Sustainability Report
between 2014 – 2016.
II. RELATED WORKS/LITERATURE REVIEW (OPTIONAL)
Company size
Judging by the total assets or wealth owned by the company so that it can show the Big or Small Company. Based
on UU/No.20/2008 about “Usaha Mikro, Kecil, dan Menengah” pasal 6 ayat 1, 2, dan 3. (OJK, 2017) clarify the
company size based on total assets or wealth owned or total annual sales into the following categories:
brought to you by COREView metadata, citation and similar papers at core.ac.uk
provided by eJournal Komunitas Dosen Indonesia
Rina Aprilyanti, Surachmat Wijaya
eCo-Fin, 2020, 2 (1) 132
1. Micro enterprises are a productive business belonging to an individual and or individual business entity that
have the criteria of a micro-enterprise as regulated in this UU. Micro-enterprises have the criterion, which is to
have a net worth (total assets) at most Rp 50.000.000 excluding land and building or annual sales results at most
Rp 300.000.000.
2. Small business, is a stand-alone productive economic endeavor that is done by an individual or business entity
that is not a subsidiary or non-branch of a company owned, mastered, or becomes part either directly or not
from a business or a large undertaking that has the criteria of small businesses as referred to in this UU. The
criteria are to have a net worth more than Rp 50.000.000 to at most Rp 500.000.000 excluding land and
buildings where the business or annual sales results are at most Rp 300.000.000 to the most Rp 2.500.000.000.
3. Medium Enterprises, which is a stand-alone productive economic business done by an individual or business
entity that is not a subsidiary or non-branch of a company owned, controlled, or part of either direct or Direct
with small business or large businesses with the amount of net worth as stipulated in the UU. The criteria are to
have a net worth (total assets) of more than Rp 500.000.000 to at most Rp 10.000.000.000 excluding land and
building or annual business or sales results of more than Rp 2.500.000.000 to the most RP 50.000.000.000.
4. Large enterprises are a productive economic effort conducted by a business entity with a net worth amount or
annual sales proceeds greater than the medium enterprises, which include state-owned or private national
enterprises, joint ventures (groups), and business Foreign economic activity in Indonesia.
Going Concern Opinions
According to professional public Accountant Standard (2011) in the study (Aditya, 2017) stated that: Opinion
going concern is a modification opinion that in consideration of the auditor there is a significant inability or
uncertainty over the company's survival in carrying out its operations”.
Sustainability Report
Sustainability Report can also be defined as a global framework with consistent language and can be measured to
be clearer and easier to understand so that the company can achieve sustainable development (Suryono & Prastiwi,
2011)
III. METHODS
Research is an empirical study, in this research the authors use the information in the form of financial statements
and Sustainability Report issued by companies registered in the National Center for Sustainability Reporting and the
Stock Exchange Indonesia in the period 2014 – 2016. The data in this research is secondary data done to companies
listed on the Indonesia Stock Exchange and registered as NCSR participants between the years 2014 and 2016
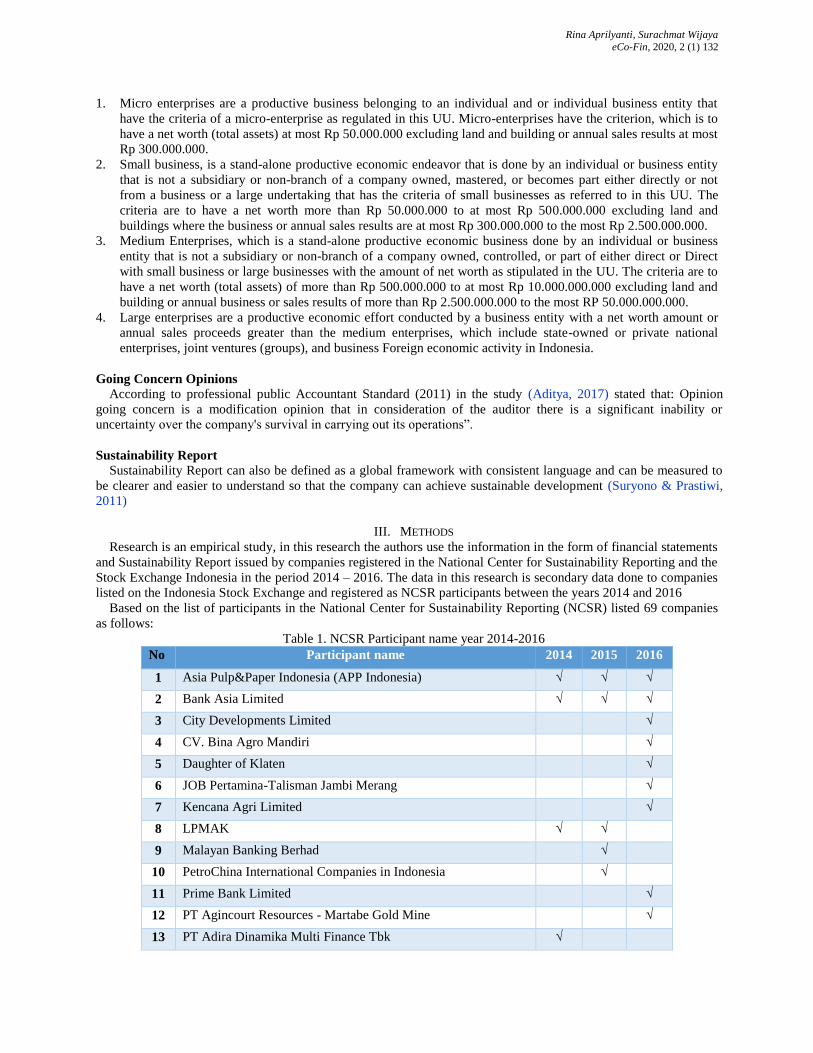
Based on the list of participants in the National Center for Sustainability Reporting (NCSR) listed 69 companies
as follows:
Table 1. NCSR Participant name year 2014-2016
No Participant name 2014 2015 2016
1 Asia Pulp&Paper Indonesia (APP Indonesia) √ √ √
2 Bank Asia Limited √ √ √
3 City Developments Limited √
4 CV. Bina Agro Mandiri √
5 Daughter of Klaten √
6 JOB Pertamina-Talisman Jambi Merang √
7 Kencana Agri Limited √
8 LPMAK √ √
9 Malayan Banking Berhad √
10 PetroChina International Companies in Indonesia √
11 Prime Bank Limited √
12 PT Agincourt Resources - Martabe Gold Mine √
13 PT Adira Dinamika Multi Finance Tbk √

Rina Aprilyanti, Surachmat Wijaya
eCo-Fin, 2020, 2 (1) 133
14 PT Antam ( Persero ) Tbk √ √ √
15 PT Bakrie Sumatera Plantation Tbk √
16 PT Bank BNI Syariah √
17 PT Bank CIMB Niaga Tbk √ √
18 PT Bank Danamon Indonesia Tbk √ √ √
19 PT Bank Jateng √
20 PT Bank Maybank Indonesia Tbk √ √ √
21 PT Bank Negara Indonesia ( Persero ) Tbk √ √ √
22 PT Bank Permata Tbk √
23 PT Bank Rakyat Indonesia ( Persero ) Tbk √ √
24 PT Bio Farma ( Persero ) √ √ √
25 PT Branita Sandhini (Monsanto) √
26 PT Bukit Asam Tbk √ √
27 PT Elegant Textile Industry √
28 PT GMF AeroAsia √
29 PT Indo Liberty Textile √
30 PT Indo Tambangraya Megah Tbk √ √ √
31 PT Indocement Tunggal Prakarsa Tbk √ √ √
32 PT Indonesia Power √ √ √
33 PT Kaltim Prima Coal √ √ √
34 PT Kideco Jaya Agung √
35 PT Len Industri ( Persero ) √ √
36 PT Medco Energy International Tbk √
37 PT Nestle Indonesia √
38 PT Patra Jasa √ √ √
39 PT Pembangkitan Jawa Bali √
40 PT Pertamina ( Persero ) √ √ √
41 PT Pertamina EP √ √ √
42 PT Pertamina EP Cepu √
43 PT Pertamina Geothermal Energy √
44 PT Pertamina Hulu Energi Offshore North West Java √
45 PT Pertamina Lubricants √
46 PT Perusahaan Gas Negara ( Persero ) Tbk √ √ √
47 PT Petrokimia Gresik √
48 PT Pupuk Indonesia √ √
49 PT Pupuk Kalimantan Timur √ √ √
50 PT Pupuk Kujang √
51 PT Sarihusada Generasi Mahardika √
52 PT Semen Indonesia ( Persero ) Tbk √ √
Rina Aprilyanti, Surachmat Wijaya
eCo-Fin, 2020, 2 (1) 134
53 PT Semen Padang √
54 PT Semen Tonasa √
55 PT Sunrise Bumi Textile √
56 PT Tani Sandorikum √
57 PT Telekomunikasi Indonesia Tbk √ √ √
58 PT Timah ( Persero ) Tbk √ √ √
59 PT Toyota Motor Manufacturing Indonesia √
60 PT Unilever Indonesia Tbk √
61 PT United Tractors Tbk √ √ √
62 PT Vale Indonesia Tbk √ √ √
63 PT Wijaya Karya ( Persero ) Tbk √ √ √
64 San Roque Power Corporation √
65 SKK Migas √ √
66 Star Energy ( Kakap ) Ltd √ √
67 Star Energy Geothermal ( Wayang Windu ) Ltd √ √
68 Telkom Malaysia Berhad √ √
69 Yayasan Danamon Peduli √
Total participants each year 35 37 50
Based on the list of participants, there were 69 companies listed in the NCSR and IDX which became
the population.
Samples are some of the members or selected parts of the population. If the population is known for
large research and researchers are unlikely to learn all that is in the population, then it can use samples
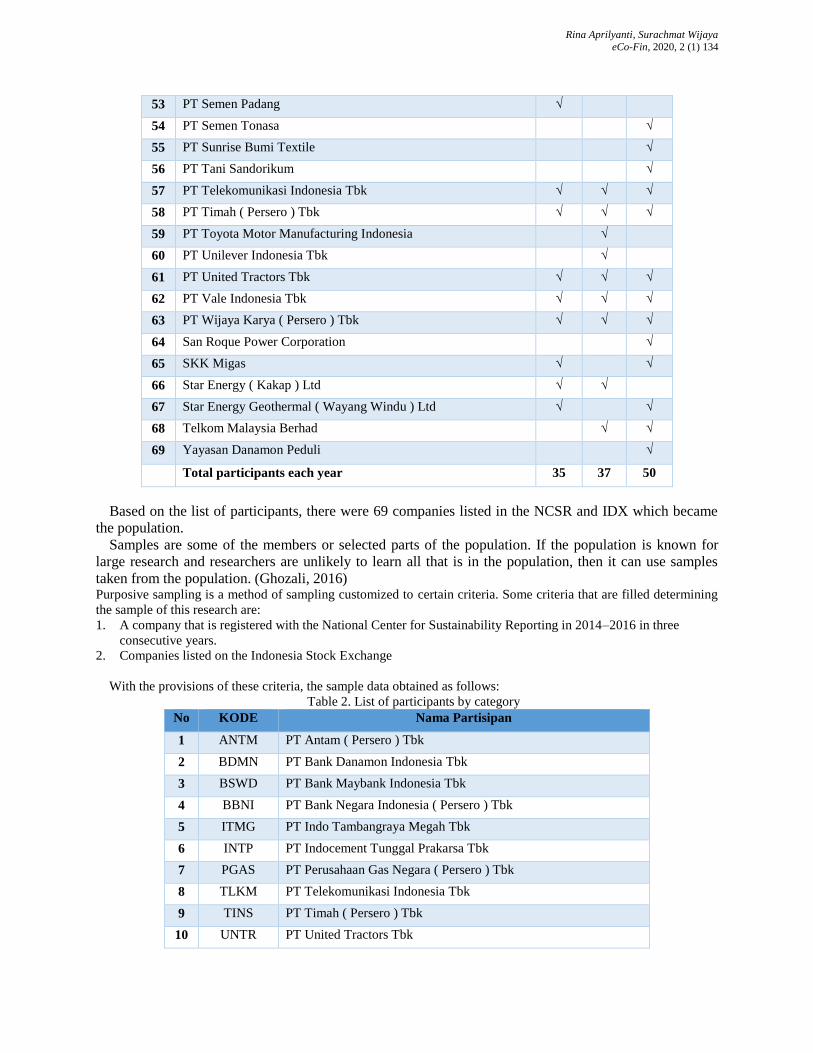
taken from the population. (Ghozali, 2016) Purposive sampling is a method of sampling customized to certain criteria. Some criteria that are filled determining
the sample of this research are:
1. A company that is registered with the National Center for Sustainability Reporting in 2014–2016 in three
consecutive years.
2. Companies listed on the Indonesia Stock Exchange
With the provisions of these criteria, the sample data obtained as follows:
Table 2. List of participants by category
No KODE Nama Partisipan
1 ANTM PT Antam ( Persero ) Tbk
2 BDMN PT Bank Danamon Indonesia Tbk
3 BSWD PT Bank Maybank Indonesia Tbk
4 BBNI PT Bank Negara Indonesia ( Persero ) Tbk
5 ITMG PT Indo Tambangraya Megah Tbk
6 INTP PT Indocement Tunggal Prakarsa Tbk
7 PGAS PT Perusahaan Gas Negara ( Persero ) Tbk
8 TLKM PT Telekomunikasi Indonesia Tbk
9 TINS PT Timah ( Persero ) Tbk
10 UNTR PT United Tractors Tbk

Rina Aprilyanti, Surachmat Wijaya
eCo-Fin, 2020, 2 (1) 135
11 INCO PT Vale Indonesia Tbk
12 WIKA PT Wijaya Karya ( Persero ) Tbk
Since the company PT Timah (Persero) Tbk did not publicize the Sustainability Report held in 2014 until
2016 and PT Bank Danamon Indonesia TBK did not publish the Sustainability Report which was held in
the year 2016, then The author eliminated PT Timah (Persero) Tbk and PT Bank Danamon Indonesia Tbk
as one of the sampling companies, and obtained a total of 10 participants in the company, from a list of
companies that have fulfilled the time comparison category, then Obtained a total of 30 samples studied
based on a total of 12 companies for three years, namely from 2014 to 2016.
1. Dependent Variable The value is 1 if the auditee status is Going Concern and 0 for Non-Going Concern.
2. Independent Variable In this study, the independet variable used is the Sustainability Report, which is divided into three
parts, namely: economic Dimension (X1), environmental Dimension (X2), social Dimension (X3), and
conduct valuation of the company's size in the total Company assets (X4). The economic,
environmental and social dimension variables are measures through a GRI-G4 Sustainability Report
Disclosure Index (SRDI) which as referring to 91 indicators of the total Sustainability Report
disclosure. The disclosure uses SRDI calculations by giving a score of 1 if an item is disclosed, and 0
if it is not. After a score is done on all items, the score then aggregates to obtain the total score for each
company based on each dimension.
The formula for SRDI calculation is (Wijayanti, 2016):
1. Economic Dimension
SRDIeconomic =Number of items disclosed by the company (n)
9
2. Environmental Dimension
SRDIenvironmental =Number of items disclosed by the company (n)
34
3. Social Dimension
SRDIsocial =Number of items disclosed by the company (n)
48
IV. RESULTS
The sample in this study consists of 30 samples consisting of 10 companies listed on the Indonesia Stock
Exchange and the National Center for Sustainability Reporting (NCSR) for three years from 2014 to 2016. Research
samples were selected using the Purposive sampling method with certain criteria. Based on the criteria mentioned in
Chapter 3, the following research samples are:
Table 3. Sample Selection Total companies by a member of participants from 2014 – 2016 69
The company who did not conduct the SR disclosure for three consecutive
years in 2014 – 2016
(48
)
Companies not listed on the Indonesia Stock Exchange (9)
Companies with no Sustainability Report (2)
Source: secondary data is processed
Based on the selection, there are 10 companies:
Table 4. Sample List No KODE Nama Partisipan
1 ANTM PT Antam ( Persero ) Tbk
2 BSWD PT Bank Maybank Indonesia Tbk
3 BBNI PT Bank Negara Indonesia ( Persero ) Tbk
4 ITMG PT Indo Tambangraya Megah Tbk

Rina Aprilyanti, Surachmat Wijaya
eCo-Fin, 2020, 2 (1) 136
5 INTP PT Indocement Tunggal Prakarsa Tbk
6 PGAS PT Perusahaan Gas Negara ( Persero ) Tbk
7 TLKM PT Telekomunikasi Indonesia Tbk
8 UNTR PT United Tractors Tbk
9 INCO PT Vale Indonesia Tbk
10 WIKA PT Wijaya Karya ( Persero ) Tbk
Source: secondary data is processed
1. Descriptive statistical analysis
Table 5. Descriptive Statistics
N Minimum Maximum Mean
Std.
Deviation
Economic 30 .1111 .7778 .507410 .1884124
Environmental 30 .0000 .8529 .292153 .2257151
Social 30 .0625 .8750 .307630 .1579712
Size 30 20.8874 34.0330 28.526500 4.7221636
GC 30 0 1 .57 .504
Valid N (listwise) 30
Source: SPSS 22 version Data processing result
According to table 5, there are 10 companies used as the sample for 3 years, from five variables three of
which are the economic, environmental and social dimensions reported in Sustainability Report, the company
size that is proxy with the total assets of the company by the natural logarithmic and acceptance of going
concern opinion. Going concern opinion is a dependent variable with a minimum value of 0 and a maximum
value of 1. The standard deviation of 0.504. The average value (mean) of 0.57 whose is more than 0.50, this
indicates that the company with code 1 is more data in research from 30 samples studied.
The economic dimension variable with total SRDI 9 indicator has a minimum value of 0.1111 is the ratio of
economic variables of PT Vale Indonesia Tbk in 2016 and the maximum value of 0.7778 is the ratio of variable
PT Indo Tambangraya Megah Tbk, PT Indocement Tunggal Prakarsa Tbk in 2014 and 2015, PT Wijaya Karya
(Persero) Tbk in 2015, showed that the average of the company has an economic variable indicator level in the
different Sustainability Report. The average value (mean) of 0.507410 shows the average sustainability of the
company's economic dimension at 50.74%. While the standard deviation is 0, 1884124, where the standard
deviation is smaller than the average (mean) indicates there is no considerable gap in the sustainability of the
lowest and highest economic dimensions.
The environment dimension variables with total SRDI 34 indicators have a minimum value of 0.0000 is PT.
Wijaya Karya (Persero), Tbk in 2016 and the maximum value of 0.8529 is the environmental dimension of PT.
Aneka Tambang, Tbk in 2015. The standard deviation value of 0.2257151. The average value (mean) of
0.292153 shows the average sustainability environmental dimension of 29.21%. Standard deviations smaller
than average (mean) indicate that there is no substantial gap of the lowest and highest environmental
dimensions.
The social dimension variable with a total SRDI 48 indicator has a minimum value of 0.0625 which is PT
Vale Indonesia TBK Year 2016 and the maximum value of 0.8750 is PT Aneka Tambang in 2015. The
standard deviation value of 0.1579712. The average value (mean) of 0.307630 shows the average sustainability
of the social dimension by 30.76%. Standard deviation smaller than average (mean) indicates that there is no
substantial gap of the lowest and highest social dimensions.
The company size variable in Proxi with total assets and calculated with natural Logararitma has a minimum
value of 20.8874 which is PT Indo Tambang Raya Megah Tbk in 2015 and the maximum value of 34.0330 is
PT Bank Danamon Indonesia Tbk in 2016. The standard deviation value of 4.7221636. The average value
(mean) of 28.526500 shows an average company size of 28.526500. Standard deviations smaller than average
(mean) indicate that there is no substantial gap in the lowest and highest company size.
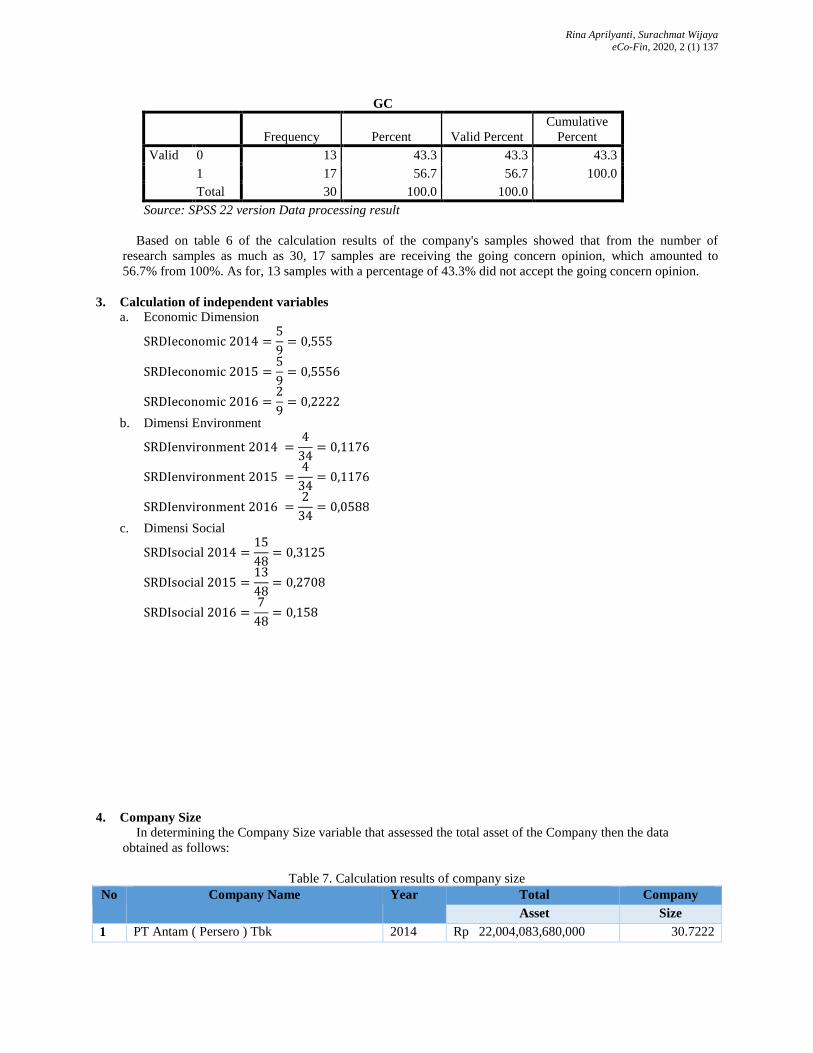
2. Hypothesis Testing
Table 6. Company Sample Calculation result
Rina Aprilyanti, Surachmat Wijaya
eCo-Fin, 2020, 2 (1) 137
GC
Frequency Percent Valid Percent
Cumulative
Percent
Valid 0 13 43.3 43.3 43.3
1 17 56.7 56.7 100.0
Total 30 100.0 100.0
Source: SPSS 22 version Data processing result
Based on table 6 of the calculation results of the company's samples showed that from the number of
research samples as much as 30, 17 samples are receiving the going concern opinion, which amounted to
56.7% from 100%. As for, 13 samples with a percentage of 43.3% did not accept the going concern opinion.
3. Calculation of independent variables
a. Economic Dimension
SRDIeconomic 2014 =5
9= 0,555
SRDIeconomic 2015 =5
9= 0,5556
SRDIeconomic 2016 =2
9= 0,2222
b. Dimensi Environment
SRDIenvironment 2014 =4
34= 0,1176
SRDIenvironment 2015 =4
34= 0,1176
SRDIenvironment 2016 =2
34= 0,0588
c. Dimensi Social
SRDIsocial 2014 =15
48= 0,3125
SRDIsocial 2015 =13
48= 0,2708
SRDIsocial 2016 =7
48= 0,158
4. Company Size
In determining the Company Size variable that assessed the total asset of the Company then the data
obtained as follows:
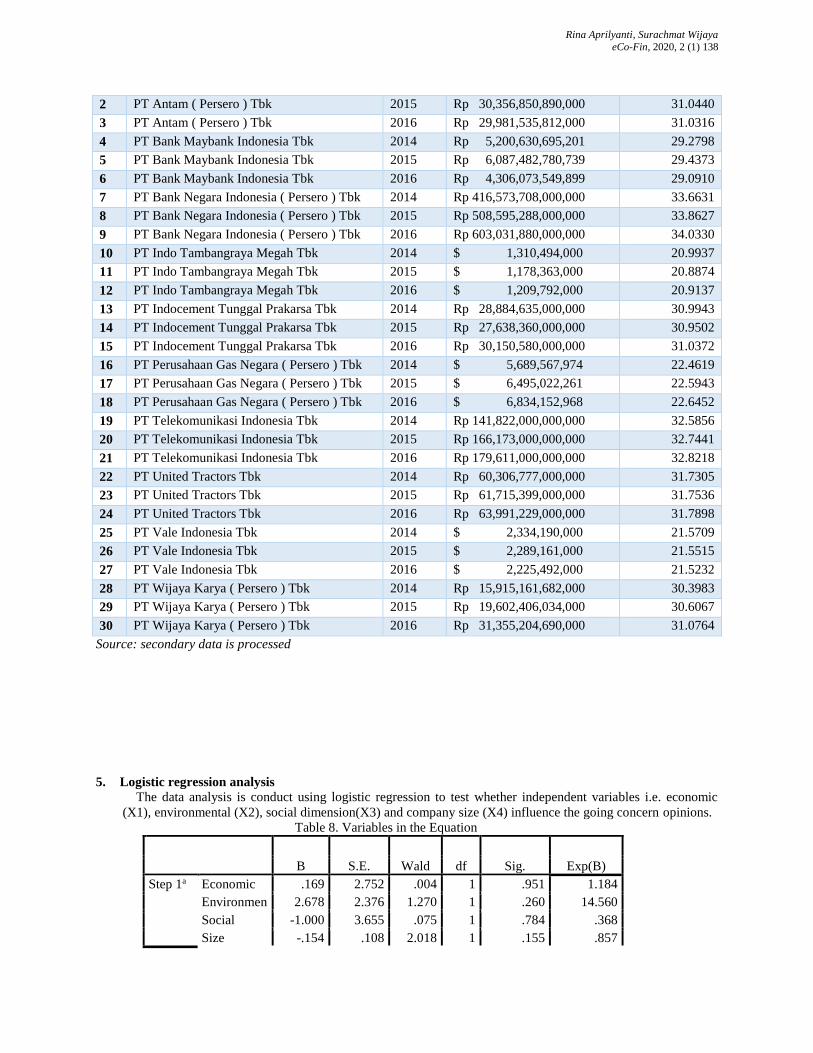
Table 7. Calculation results of company size
No Company Name Year Total Company
Asset Size
1 PT Antam ( Persero ) Tbk 2014 Rp 22,004,083,680,000 30.7222
Rina Aprilyanti, Surachmat Wijaya
eCo-Fin, 2020, 2 (1) 138
2 PT Antam ( Persero ) Tbk 2015 Rp 30,356,850,890,000 31.0440
3 PT Antam ( Persero ) Tbk 2016 Rp 29,981,535,812,000 31.0316
4 PT Bank Maybank Indonesia Tbk 2014 Rp 5,200,630,695,201 29.2798
5 PT Bank Maybank Indonesia Tbk 2015 Rp 6,087,482,780,739 29.4373
6 PT Bank Maybank Indonesia Tbk 2016 Rp 4,306,073,549,899 29.0910
7 PT Bank Negara Indonesia ( Persero ) Tbk 2014 Rp 416,573,708,000,000 33.6631
8 PT Bank Negara Indonesia ( Persero ) Tbk 2015 Rp 508,595,288,000,000 33.8627
9 PT Bank Negara Indonesia ( Persero ) Tbk 2016 Rp 603,031,880,000,000 34.0330
10 PT Indo Tambangraya Megah Tbk 2014 $ 1,310,494,000 20.9937
11 PT Indo Tambangraya Megah Tbk 2015 $ 1,178,363,000 20.8874
12 PT Indo Tambangraya Megah Tbk 2016 $ 1,209,792,000 20.9137
13 PT Indocement Tunggal Prakarsa Tbk 2014 Rp 28,884,635,000,000 30.9943
14 PT Indocement Tunggal Prakarsa Tbk 2015 Rp 27,638,360,000,000 30.9502
15 PT Indocement Tunggal Prakarsa Tbk 2016 Rp 30,150,580,000,000 31.0372
16 PT Perusahaan Gas Negara ( Persero ) Tbk 2014 $ 5,689,567,974 22.4619
17 PT Perusahaan Gas Negara ( Persero ) Tbk 2015 $ 6,495,022,261 22.5943
18 PT Perusahaan Gas Negara ( Persero ) Tbk 2016 $ 6,834,152,968 22.6452
19 PT Telekomunikasi Indonesia Tbk 2014 Rp 141,822,000,000,000 32.5856
20 PT Telekomunikasi Indonesia Tbk 2015 Rp 166,173,000,000,000 32.7441
21 PT Telekomunikasi Indonesia Tbk 2016 Rp 179,611,000,000,000 32.8218
22 PT United Tractors Tbk 2014 Rp 60,306,777,000,000 31.7305
23 PT United Tractors Tbk 2015 Rp 61,715,399,000,000 31.7536
24 PT United Tractors Tbk 2016 Rp 63,991,229,000,000 31.7898
25 PT Vale Indonesia Tbk 2014 $ 2,334,190,000 21.5709
26 PT Vale Indonesia Tbk 2015 $ 2,289,161,000 21.5515
27 PT Vale Indonesia Tbk 2016 $ 2,225,492,000 21.5232
28 PT Wijaya Karya ( Persero ) Tbk 2014 Rp 15,915,161,682,000 30.3983
29 PT Wijaya Karya ( Persero ) Tbk 2015 Rp 19,602,406,034,000 30.6067
30 PT Wijaya Karya ( Persero ) Tbk 2016 Rp 31,355,204,690,000 31.0764
Source: secondary data is processed
5. Logistic regression analysis
The data analysis is conduct using logistic regression to test whether independent variables i.e. economic
(X1), environmental (X2), social dimension(X3) and company size (X4) influence the going concern opinions.
Table 8. Variables in the Equation
B S.E. Wald df Sig. Exp(B)
Step 1a Economic .169 2.752 .004 1 .951 1.184
Environmen 2.678 2.376 1.270 1 .260 14.560
Social -1.000 3.655 .075 1 .784 .368
Size -.154 .108 2.018 1 .155 .857
Rina Aprilyanti, Surachmat Wijaya
eCo-Fin, 2020, 2 (1) 139
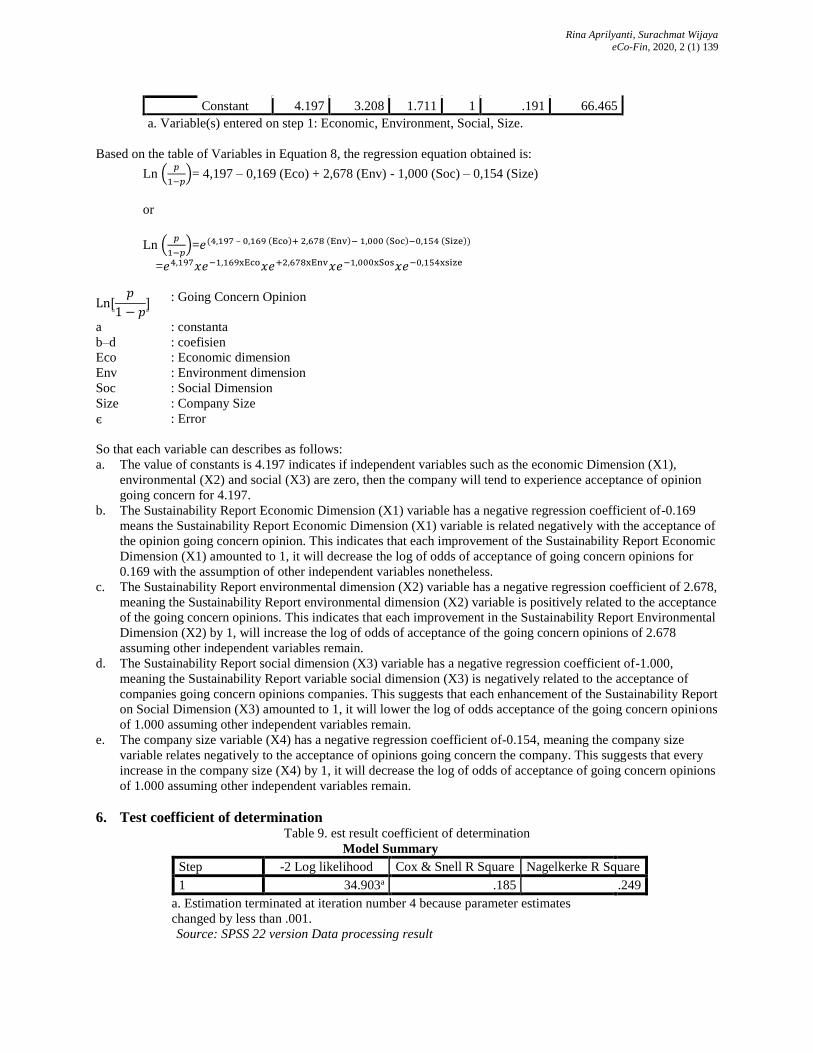
Constant 4.197 3.208 1.711 1 .191 66.465
a. Variable(s) entered on step 1: Economic, Environment, Social, Size.
Based on the table of Variables in Equation 8, the regression equation obtained is:
Ln (𝑝
1−𝑝)= 4,197 – 0,169 (Eco) + 2,678 (Env) - 1,000 (Soc) – 0,154 (Size)
or
Ln (𝑝
1−𝑝)=𝑒(4,197 – 0,169 (Eco)+ 2,678 (Env)− 1,000 (Soc)−0,154 (Size))
=𝑒4,197𝑥𝑒−1,169xEco𝑥𝑒+2,678xEnv𝑥𝑒−1,000xSos𝑥𝑒−0,154xsize
Ln⦋𝑝
1 − 𝑝⦌ : Going Concern Opinion
a : constanta
b–d : coefisien
Eco : Economic dimension
Env : Environment dimension
Soc : Social Dimension
Size : Company Size
є : Error
So that each variable can describes as follows:
a. The value of constants is 4.197 indicates if independent variables such as the economic Dimension (X1),
environmental (X2) and social (X3) are zero, then the company will tend to experience acceptance of opinion
going concern for 4.197.
b. The Sustainability Report Economic Dimension (X1) variable has a negative regression coefficient of-0.169
means the Sustainability Report Economic Dimension (X1) variable is related negatively with the acceptance of
the opinion going concern opinion. This indicates that each improvement of the Sustainability Report Economic
Dimension (X1) amounted to 1, it will decrease the log of odds of acceptance of going concern opinions for
0.169 with the assumption of other independent variables nonetheless.
c. The Sustainability Report environmental dimension (X2) variable has a negative regression coefficient of 2.678,
meaning the Sustainability Report environmental dimension (X2) variable is positively related to the acceptance
of the going concern opinions. This indicates that each improvement in the Sustainability Report Environmental
Dimension (X2) by 1, will increase the log of odds of acceptance of the going concern opinions of 2.678
assuming other independent variables remain.
d. The Sustainability Report social dimension (X3) variable has a negative regression coefficient of-1.000,
meaning the Sustainability Report variable social dimension (X3) is negatively related to the acceptance of
companies going concern opinions companies. This suggests that each enhancement of the Sustainability Report
on Social Dimension (X3) amounted to 1, it will lower the log of odds acceptance of the going concern opinions
of 1.000 assuming other independent variables remain.
e. The company size variable (X4) has a negative regression coefficient of-0.154, meaning the company size
variable relates negatively to the acceptance of opinions going concern the company. This suggests that every
increase in the company size (X4) by 1, it will decrease the log of odds of acceptance of going concern opinions
of 1.000 assuming other independent variables remain.
6. Test coefficient of determination Table 9. est result coefficient of determination
Model Summary
Step -2 Log likelihood Cox & Snell R Square Nagelkerke R Square
1 34.903a .185 .249
a. Estimation terminated at iteration number 4 because parameter estimates
changed by less than .001.
Source: SPSS 22 version Data processing result
Rina Aprilyanti, Surachmat Wijaya
eCo-Fin, 2020, 2 (1) 140
Nagelkerke R Square value of 0.249 indicates that the independent variables of the Sustainability Report
Economic Dimension (X1), environment Dimension (X2), social Dimension (X3) and the company size that is
proxy through total assets (X4) can explain the variation of the dependent variable ie the acceptance of the
going Concern opinions of 24.9% while the remaining 75.1% is explained by other variables that are not
included in this model. This shows the capability of the variable Sustainability Report economic dimension
(X1), environmental Dimension (X2) and social Dimension (X3), as well as the company size that is proxy
through total assets (X4) to the acceptance of the going concern opinions, is limited.
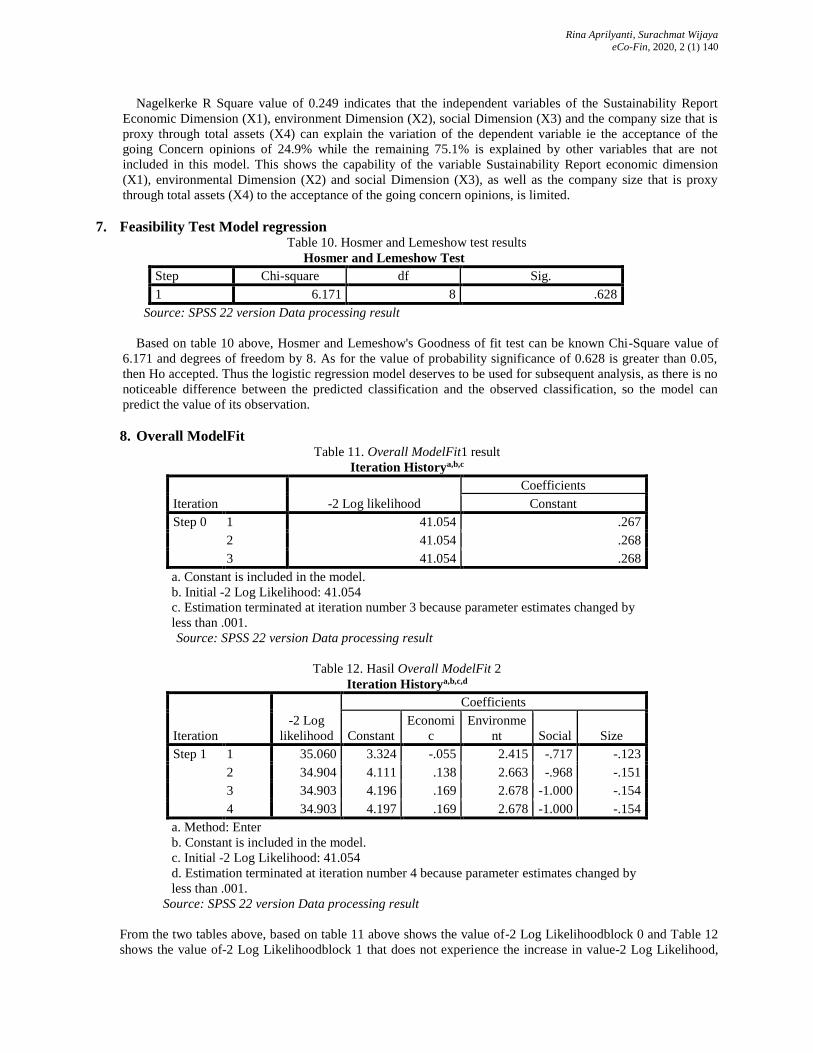
7. Feasibility Test Model regression Table 10. Hosmer and Lemeshow test results
Hosmer and Lemeshow Test
Step Chi-square df Sig.
1 6.171 8 .628
Source: SPSS 22 version Data processing result
Based on table 10 above, Hosmer and Lemeshow's Goodness of fit test can be known Chi-Square value of
6.171 and degrees of freedom by 8. As for the value of probability significance of 0.628 is greater than 0.05,
then Ho accepted. Thus the logistic regression model deserves to be used for subsequent analysis, as there is no
noticeable difference between the predicted classification and the observed classification, so the model can
predict the value of its observation.
8. Overall ModelFit Table 11. Overall ModelFit1 result
Iteration Historya,b,c
Iteration -2 Log likelihood
Coefficients
Constant
Step 0 1 41.054 .267
2 41.054 .268
3 41.054 .268
a. Constant is included in the model.
b. Initial -2 Log Likelihood: 41.054
c. Estimation terminated at iteration number 3 because parameter estimates changed by
less than .001.
Source: SPSS 22 version Data processing result
Table 12. Hasil Overall ModelFit 2
Iteration Historya,b,c,d
Iteration
-2 Log
likelihood
Coefficients
Constant
Economi
c
Environme
nt Social Size
Step 1 1 35.060 3.324 -.055 2.415 -.717 -.123
2 34.904 4.111 .138 2.663 -.968 -.151
3 34.903 4.196 .169 2.678 -1.000 -.154
4 34.903 4.197 .169 2.678 -1.000 -.154
a. Method: Enter
b. Constant is included in the model.
c. Initial -2 Log Likelihood: 41.054
d. Estimation terminated at iteration number 4 because parameter estimates changed by
less than .001.
Source: SPSS 22 version Data processing result
From the two tables above, based on table 11 above shows the value of-2 Log Likelihoodblock 0 and Table 12
shows the value of-2 Log Likelihoodblock 1 that does not experience the increase in value-2 Log Likelihood,
Rina Aprilyanti, Surachmat Wijaya
eCo-Fin, 2020, 2 (1) 141
where it shows the model The regression that is used as a whole is good and can be used to analyze data. The
decline that occurs can be interpreted by the addition of the independent variables of the Sustainability Report
Economic Dimension (X1), environmental Dimension (X2) and social Dimension (X3) as well as the company
size (X4) in the model is to improve the model so The regression model following the data.
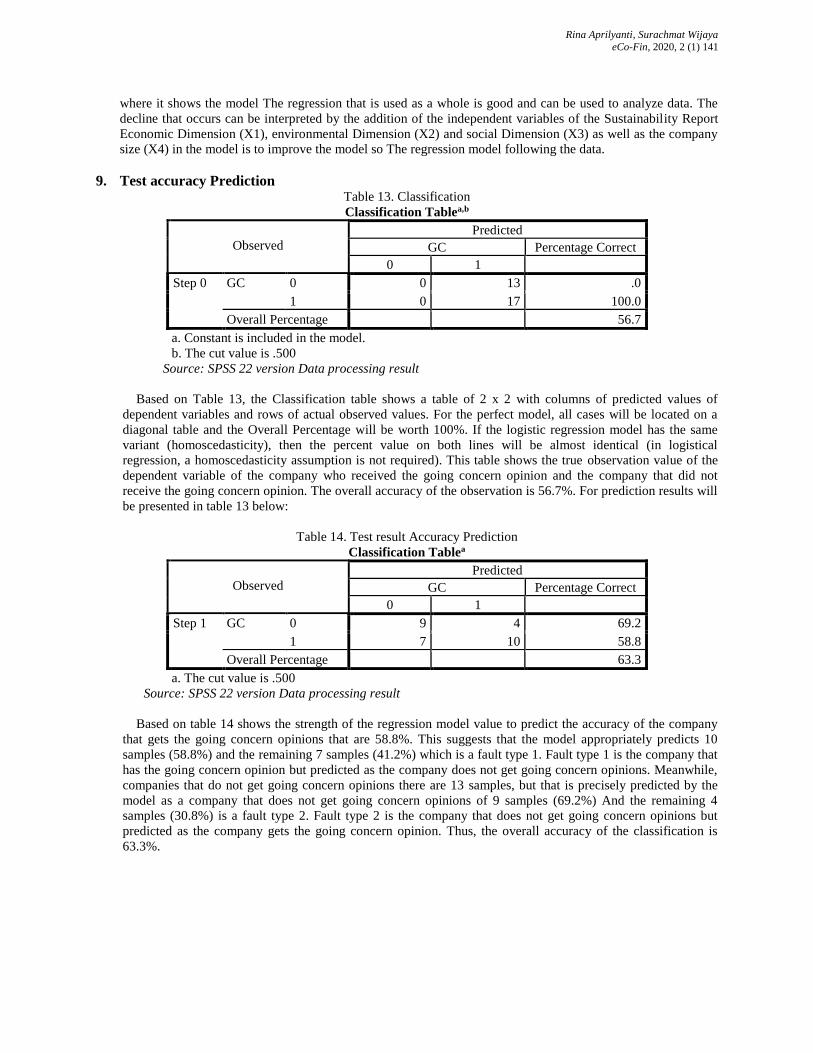
9. Test accuracy Prediction Table 13. Classification
Classification Tablea,b
Observed
Predicted
GC Percentage Correct
0 1
Step 0 GC 0 0 13 .0
1 0 17 100.0
Overall Percentage 56.7
a. Constant is included in the model.
b. The cut value is .500
Source: SPSS 22 version Data processing result
Based on Table 13, the Classification table shows a table of 2 x 2 with columns of predicted values of
dependent variables and rows of actual observed values. For the perfect model, all cases will be located on a
diagonal table and the Overall Percentage will be worth 100%. If the logistic regression model has the same
variant (homoscedasticity), then the percent value on both lines will be almost identical (in logistical
regression, a homoscedasticity assumption is not required). This table shows the true observation value of the
dependent variable of the company who received the going concern opinion and the company that did not
receive the going concern opinion. The overall accuracy of the observation is 56.7%. For prediction results will
be presented in table 13 below:
Table 14. Test result Accuracy Prediction
Classification Tablea
Observed
Predicted
GC Percentage Correct
0 1
Step 1 GC 0 9 4 69.2
1 7 10 58.8
Overall Percentage 63.3
a. The cut value is .500
Source: SPSS 22 version Data processing result
Based on table 14 shows the strength of the regression model value to predict the accuracy of the company
that gets the going concern opinions that are 58.8%. This suggests that the model appropriately predicts 10
samples (58.8%) and the remaining 7 samples (41.2%) which is a fault type 1. Fault type 1 is the company that
has the going concern opinion but predicted as the company does not get going concern opinions. Meanwhile,
companies that do not get going concern opinions there are 13 samples, but that is precisely predicted by the
model as a company that does not get going concern opinions of 9 samples (69.2%) And the remaining 4
samples (30.8%) is a fault type 2. Fault type 2 is the company that does not get going concern opinions but
predicted as the company gets the going concern opinion. Thus, the overall accuracy of the classification is
63.3%.
Rina Aprilyanti, Surachmat Wijaya
eCo-Fin, 2020, 2 (1) 142
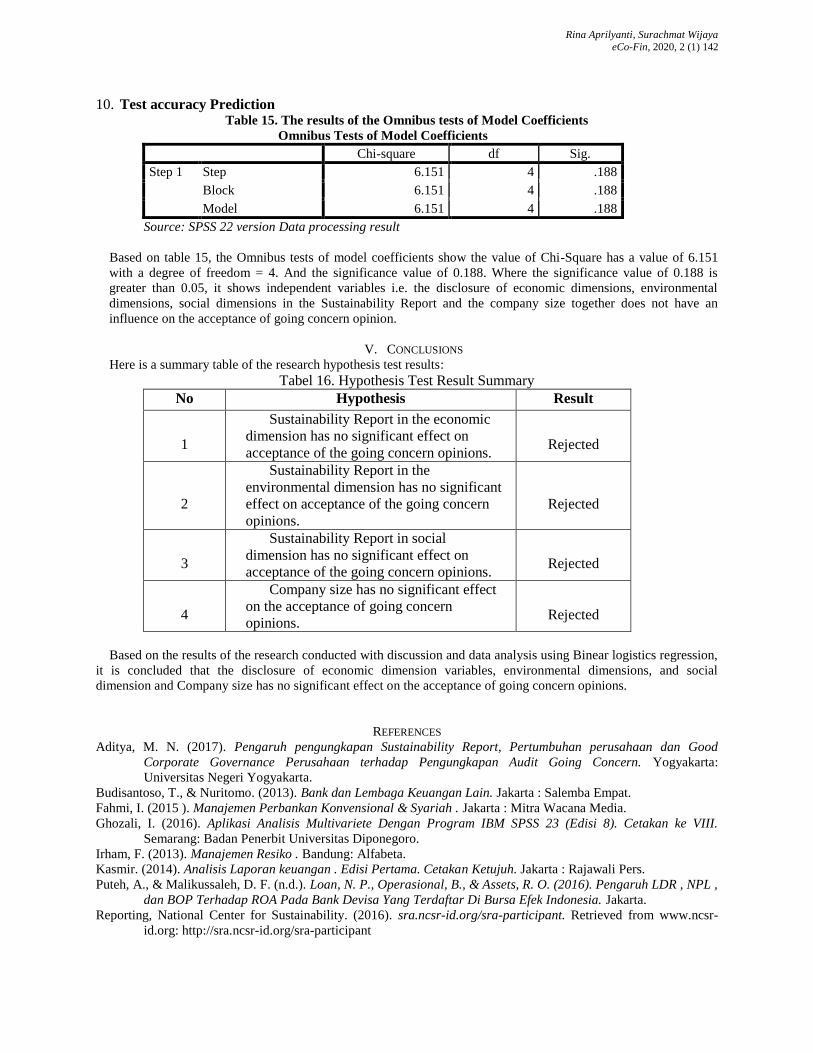
10. Test accuracy Prediction Table 15. The results of the Omnibus tests of Model Coefficients
Omnibus Tests of Model Coefficients
Chi-square df Sig.
Step 1 Step 6.151 4 .188
Block 6.151 4 .188
Model 6.151 4 .188
Source: SPSS 22 version Data processing result
Based on table 15, the Omnibus tests of model coefficients show the value of Chi-Square has a value of 6.151
with a degree of freedom = 4. And the significance value of 0.188. Where the significance value of 0.188 is
greater than 0.05, it shows independent variables i.e. the disclosure of economic dimensions, environmental
dimensions, social dimensions in the Sustainability Report and the company size together does not have an
influence on the acceptance of going concern opinion.
V. CONCLUSIONS
Here is a summary table of the research hypothesis test results:
Tabel 16. Hypothesis Test Result Summary
No Hypothesis Result
1
Sustainability Report in the economic
dimension has no significant effect on
acceptance of the going concern opinions.
Rejected
2
Sustainability Report in the
environmental dimension has no significant
effect on acceptance of the going concern
opinions.
Rejected
3
Sustainability Report in social
dimension has no significant effect on
acceptance of the going concern opinions.
Rejected
4
Company size has no significant effect
on the acceptance of going concern
opinions.
Rejected
Based on the results of the research conducted with discussion and data analysis using Binear logistics regression,
it is concluded that the disclosure of economic dimension variables, environmental dimensions, and social
dimension and Company size has no significant effect on the acceptance of going concern opinions.
REFERENCES
Aditya, M. N. (2017). Pengaruh pengungkapan Sustainability Report, Pertumbuhan perusahaan dan Good
Corporate Governance Perusahaan terhadap Pengungkapan Audit Going Concern. Yogyakarta:
Universitas Negeri Yogyakarta. Budisantoso, T., & Nuritomo. (2013). Bank dan Lembaga Keuangan Lain. Jakarta : Salemba Empat.
Fahmi, I. (2015 ). Manajemen Perbankan Konvensional & Syariah . Jakarta : Mitra Wacana Media.
Ghozali, I. (2016). Aplikasi Analisis Multivariete Dengan Program IBM SPSS 23 (Edisi 8). Cetakan ke VIII.
Semarang: Badan Penerbit Universitas Diponegoro.
Irham, F. (2013). Manajemen Resiko . Bandung: Alfabeta.
Kasmir. (2014). Analisis Laporan keuangan . Edisi Pertama. Cetakan Ketujuh. Jakarta : Rajawali Pers.
Puteh, A., & Malikussaleh, D. F. (n.d.). Loan, N. P., Operasional, B., & Assets, R. O. (2016). Pengaruh LDR , NPL ,
dan BOP Terhadap ROA Pada Bank Devisa Yang Terdaftar Di Bursa Efek Indonesia. Jakarta.
Reporting, National Center for Sustainability. (2016). sra.ncsr-id.org/sra-participant. Retrieved from www.ncsr-
id.org: http://sra.ncsr-id.org/sra-participant

Rina Aprilyanti, Surachmat Wijaya
eCo-Fin, 2020, 2 (1) 143
Suryono, H., & Prastiwi, A. (2011). Pengaruh Karakteristik Perusahaan dan Corporate Governance terhadap Praktik
Pengungkapan Sustainability Report. Proceeding Simposium Nasional Akuntansi XIV. Aceh: Universitas
Syiah Kuala.
Wijayanti, R. (2016). Pengaruh Pengungkapan Sustainability Report Terhadap Kinerja Keuangan Perusahaan.
Publikasi Ilmiah Universitas Muhammadiyah Surakarta, 39-51.