deteriorating food security in india change assessment... · decelerating food production trends in...
TRANSCRIPT
Climate Change Assessment and Decelerating Food Production
Trends in India
Presentation made at NRCCC, IIT Delhi
5 March, 2010
K. Krishna Kumar Indian Institute of Tropical Meteorology, Pune
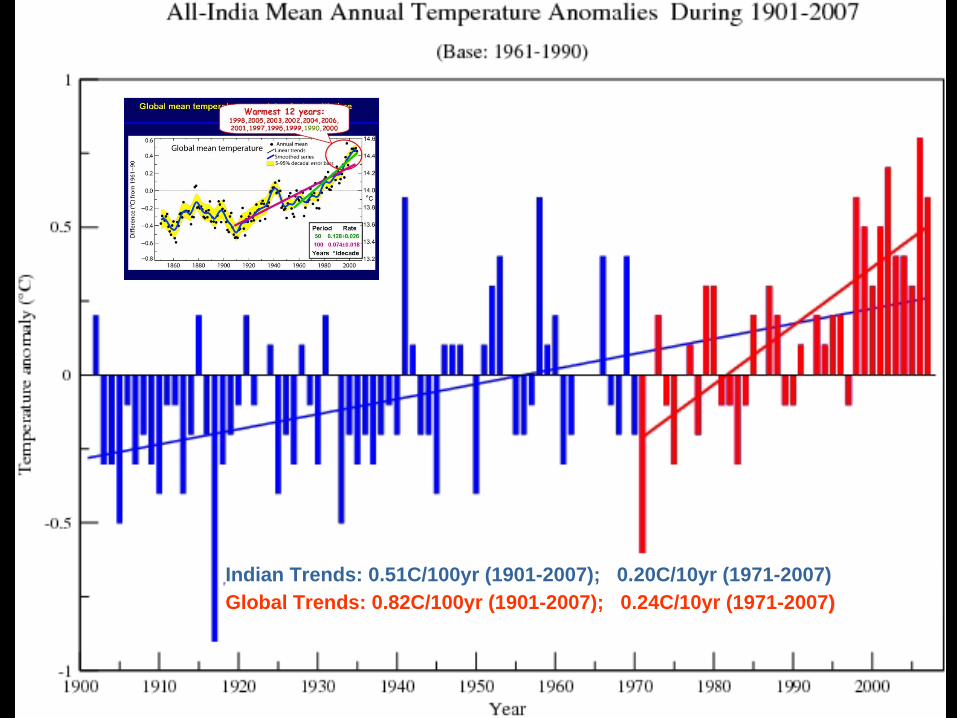
Indian Trends: 0.51C/100yr (1901-2007); 0.20C/10yr (1971-2007) Global Trends: 0.82C/100yr (1901-2007); 0.24C/10yr (1971-2007))
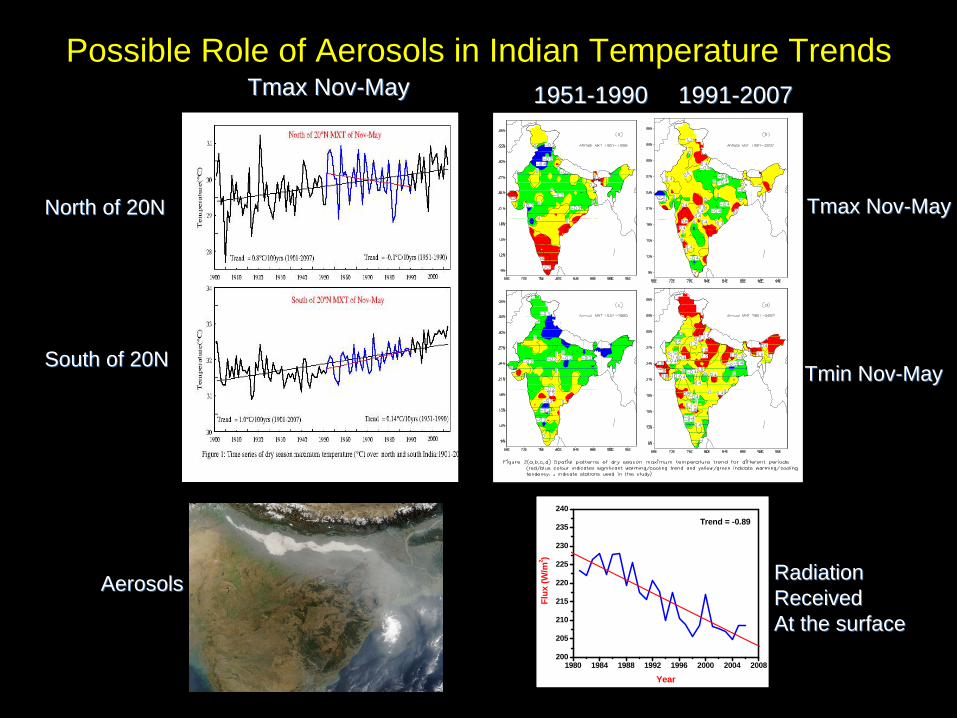
Possible Role of Aerosols in Indian Temperature Trends
1980 1984 1988 1992 1996 2000 2004 2008200
205
210
215
220
225
230
235
240Trend = -0.89
Flux
(W/m
2 )
Year
North of 20NNorth of 20N
South of 20NSouth of 20N
Tmax NovTmax Nov--MayMay
Tmax NovTmax Nov--MayMay
Tmin NovTmin Nov--MayMay
19511951--19901990 19911991--20072007
Radiation Radiation ReceivedReceivedAt the surfaceAt the surface
AerosolsAerosols
Expected Future Changes Under Increased GHG Conditions
IPCC-AR4
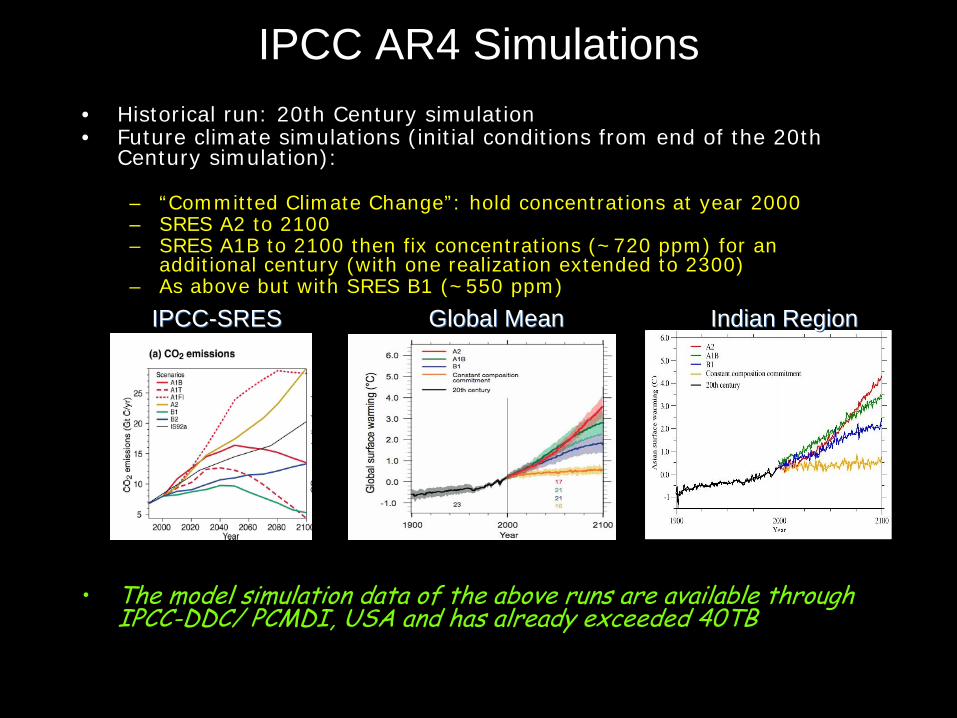
IPCC AR4 Simulations• Historical run: 20th Century simulation• Future climate simulations (initial conditions from end of the 20th
Century simulation):
– “Committed Climate Change”: hold concentrations at year 2000 – SRES A2 to 2100– SRES A1B to 2100 then fix concentrations (~720 ppm) for an
additional century (with one realization extended to 2300)– As above but with SRES B1 (~550 ppm)
•
The model simulation data of the above runs are available through IPCC-DDC/ PCMDI, USA and has already exceeded 40TB
Global MeanGlobal Mean Indian RegionIndian RegionIPCCIPCC--SRESSRES
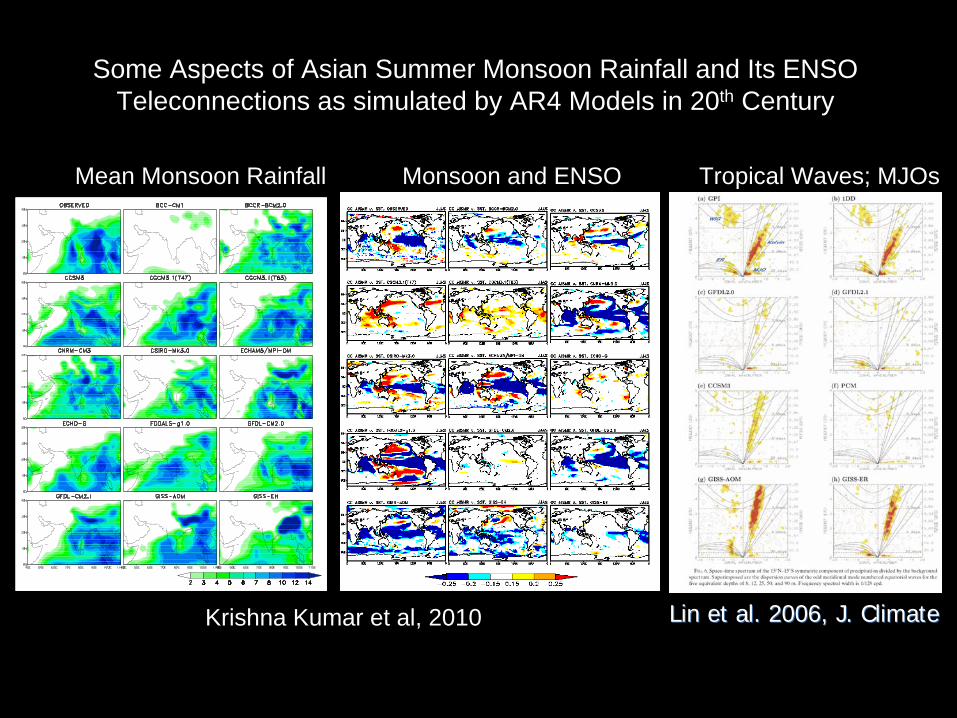
Some Aspects of Asian Summer Monsoon Rainfall and Its ENSO Teleconnections as simulated by AR4 Models in 20th Century
Lin et al. 2006, J. ClimateLin et al. 2006, J. ClimateKrishna Kumar et al, 2010
Mean Monsoon Rainfall Monsoon and ENSO Tropical Waves; MJOs

Observed and IPCC-AR4 Ensemble mean Monsoon Rainfall and Annual Surface Temperature
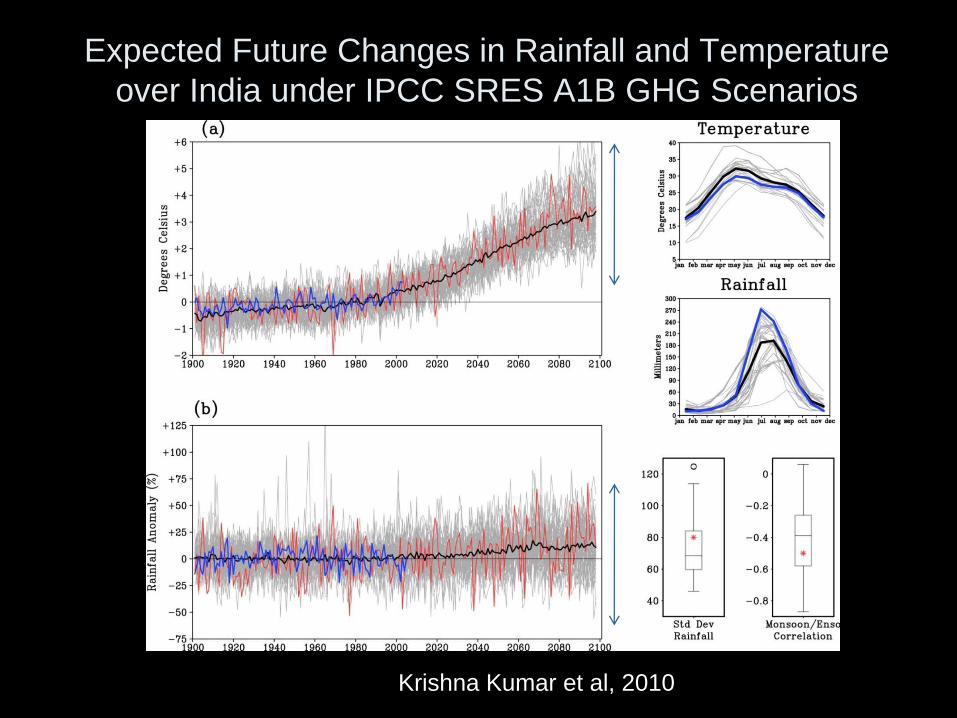
Expected Future Changes in Rainfall and Temperature over India under IPCC SRES A1B GHG Scenarios
Krishna Kumar et al, 2010
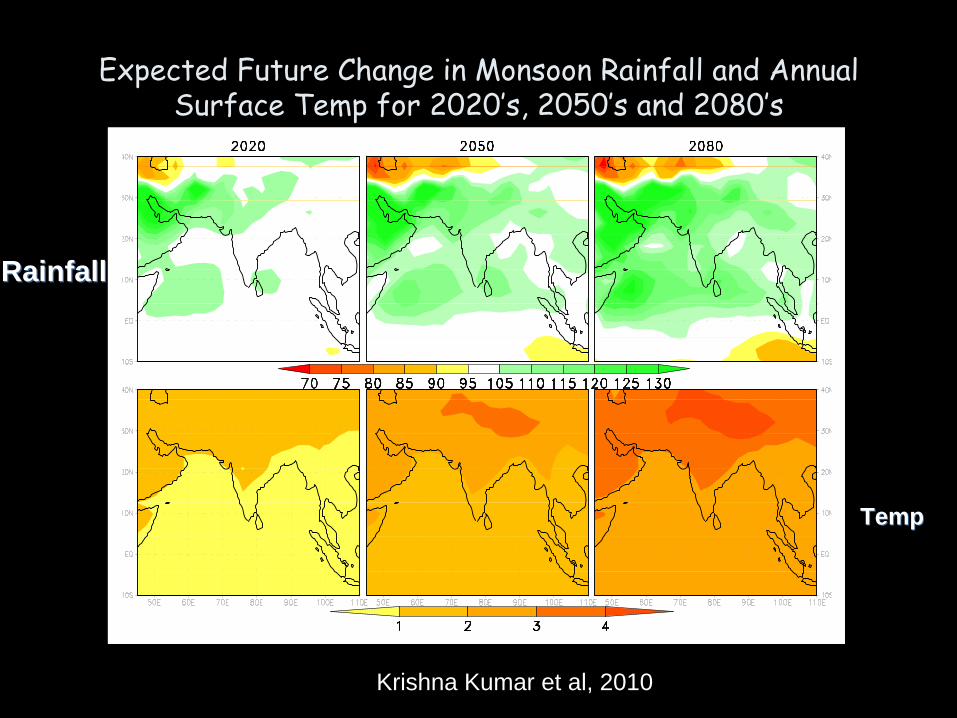
Expected Future Change in Monsoon Rainfall and Annual Surface Temp for 2020’s, 2050’s and 2080’s
RainfallRainfall
TempTemp
Krishna Kumar et al, 2010
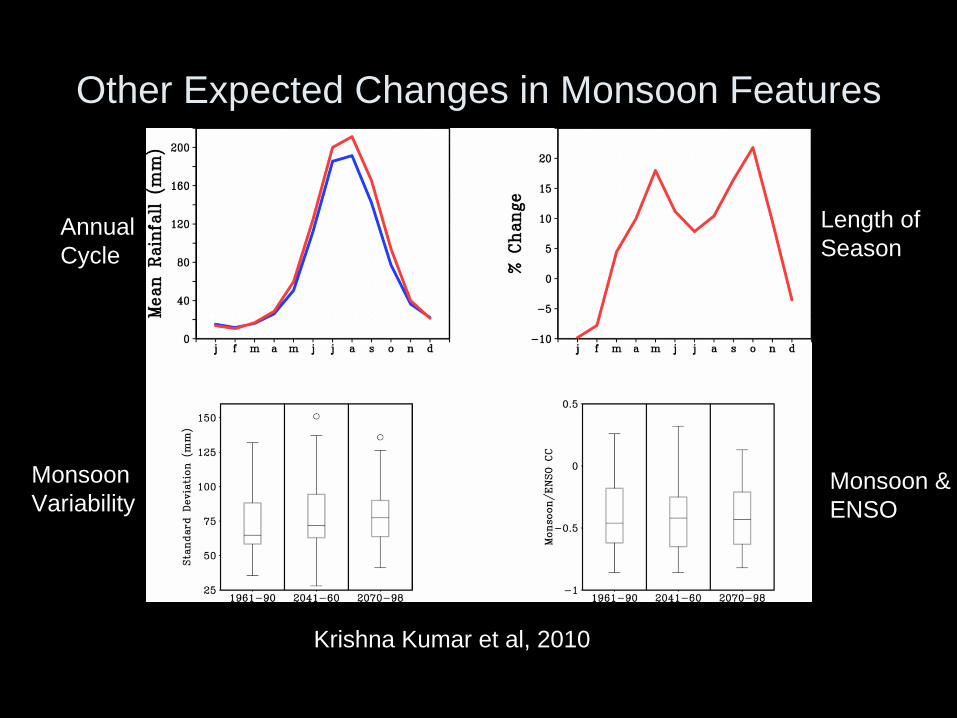
Other Expected Changes in Monsoon Features
Annual Cycle
Length ofSeason
Monsoon &ENSO
MonsoonVariability
Krishna Kumar et al, 2010
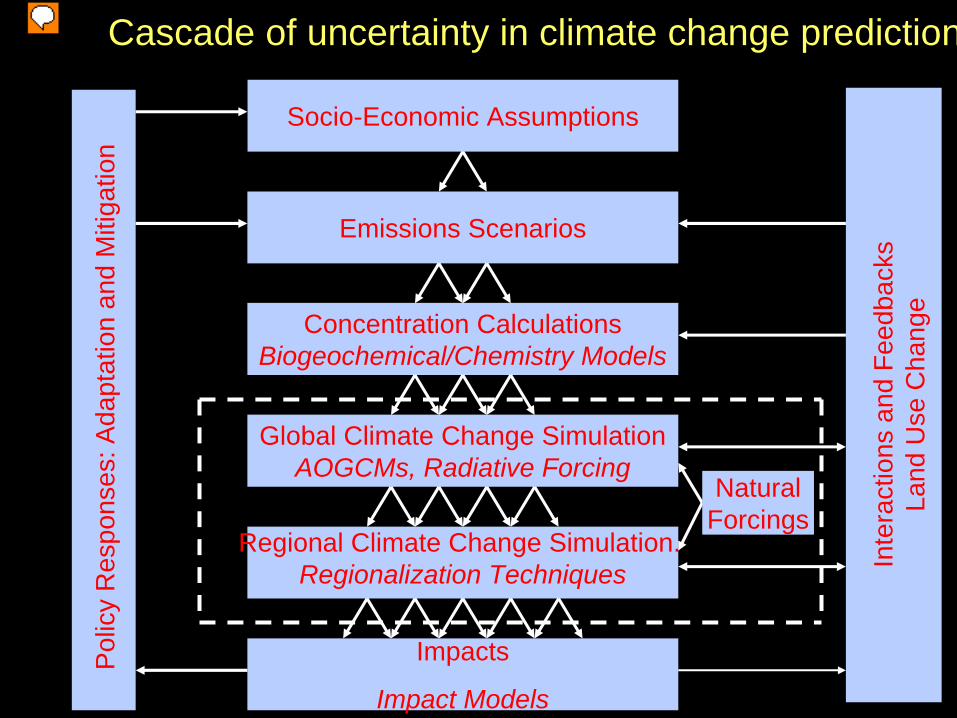
Socio-Economic Assumptions
Emissions Scenarios
Concentration CalculationsBiogeochemical/Chemistry Models
Global Climate Change SimulationAOGCMs, Radiative Forcing
Impacts
Impact Models
Inte
ract
ions
and
Fee
dbac
ksLa
nd U
se C
hang
e
Pol
icy
Res
pons
es: A
dapt
atio
n an
d M
itiga
tion
Regional Climate Change Simulation.Regionalization Techniques
Cascade of uncertainty in climate change prediction
NaturalForcings
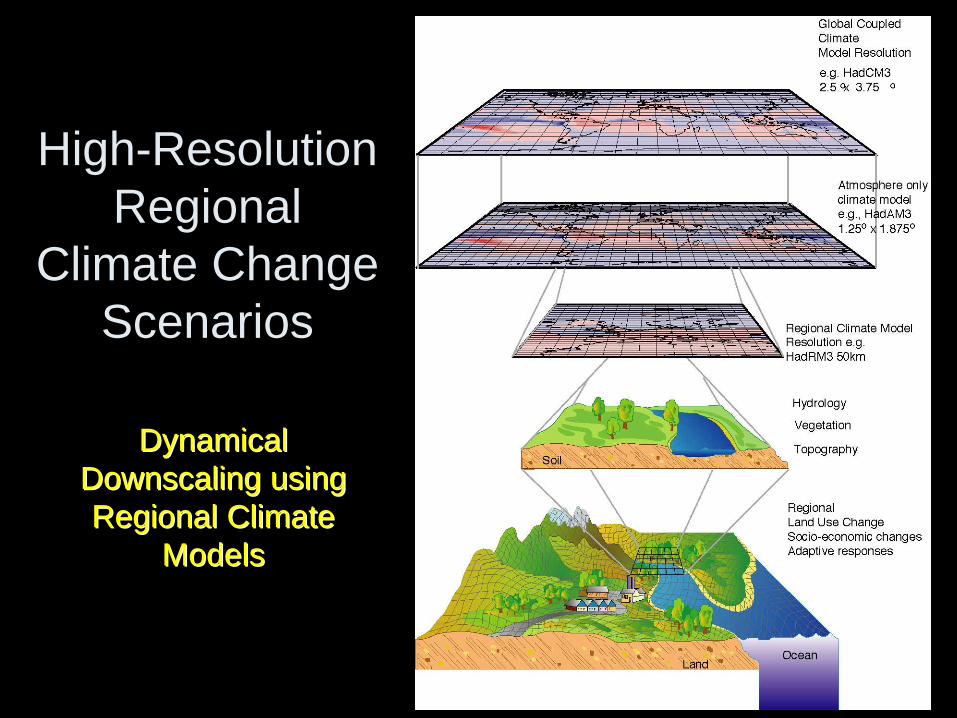
High-Resolution Regional
Climate Change Scenarios
Dynamical Dynamical Downscaling using Downscaling using Regional Climate Regional Climate
ModelsModels
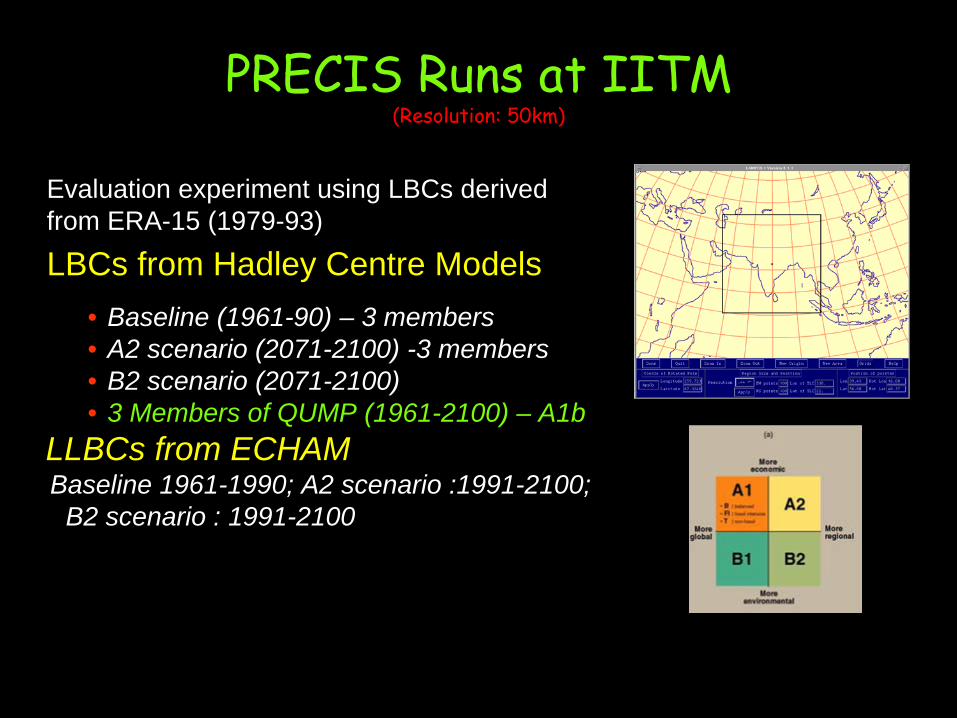
PRECIS Runs at IITM (Resolution: 50km)
Evaluation experiment using LBCs derived from ERA-15 (1979-93)
LBCs from Hadley Centre Models• Baseline (1961-90) – 3 members• A2 scenario (2071-2100) -3 members• B2 scenario (2071-2100)• 3 Members of QUMP (1961-2100) – A1b
LLBCs from ECHAMBaseline 1961-1990; A2 scenario :1991-2100;
B2 scenario : 1991-2100

PRECIS captures important regional
information on summer monsoon
rainfall missing in its parent GCM simulations.
HadCM3HadCM3 PRECISPRECIS
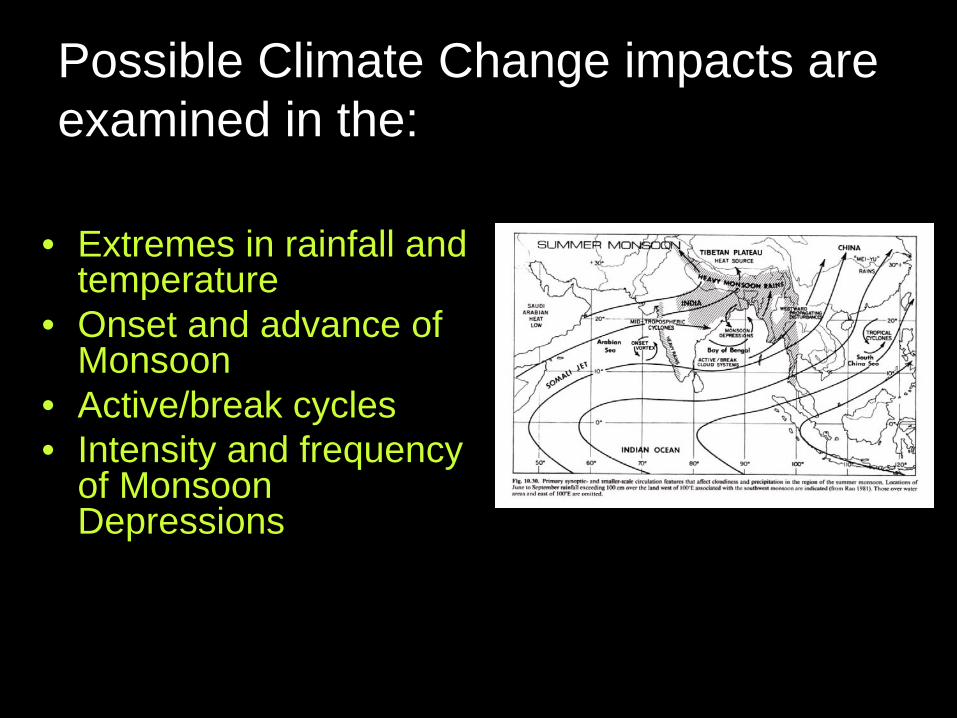
Possible Climate Change impacts are examined in the:
• Extremes in rainfall and temperature
• Onset and advance of Monsoon
• Active/break cycles• Intensity and frequency
of Monsoon Depressions
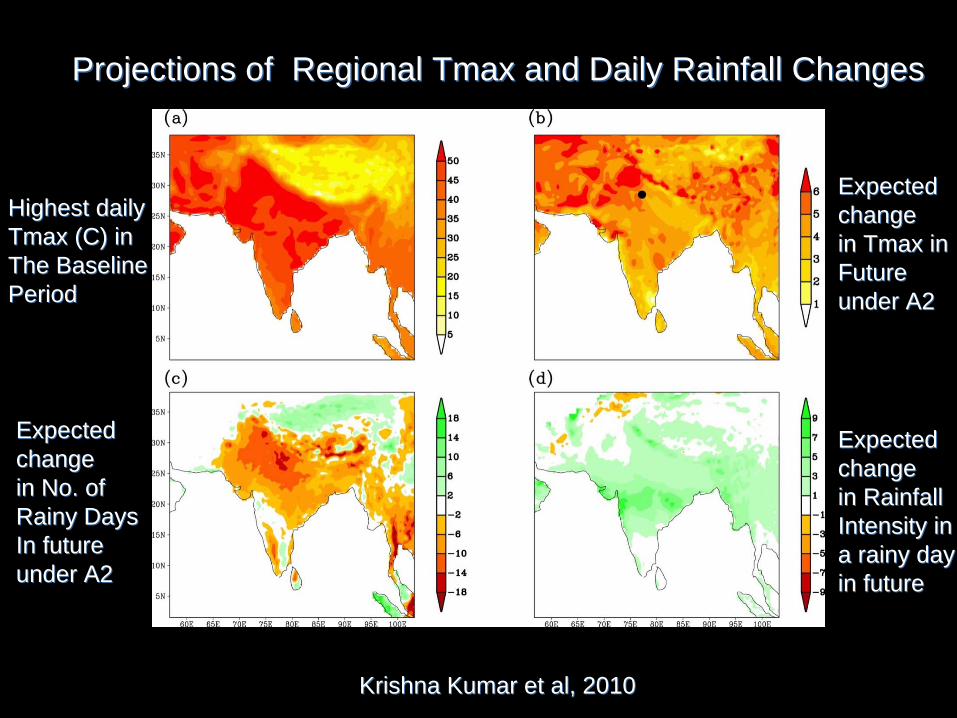
Projections of Regional Tmax and Daily Rainfall ChangesProjections of Regional Tmax and Daily Rainfall Changes
Highest dailyHighest dailyTmax (C) in Tmax (C) in The Baseline The Baseline PeriodPeriod
Expected Expected changechangein Tmax in in Tmax in FutureFutureunder A2under A2
Expected Expected changechangein Rainfallin RainfallIntensity inIntensity ina rainy daya rainy dayin futurein future
Expected Expected changechangein No. ofin No. ofRainy Days Rainy Days In futureIn futureunder A2under A2
Krishna Kumar et al, 2010Krishna Kumar et al, 2010

Impact of Growing Season Rainfall and Night time Temps on Rice YImpact of Growing Season Rainfall and Night time Temps on Rice Yields in Indiaields in India
Tmin (°C)
SRES A2
Baseline
Tmax (°C)
Impact of Daily Tmax on the Mortality rate at Delhi (Source: HazImpact of Daily Tmax on the Mortality rate at Delhi (Source: Hazat et al 2005)at et al 2005)
Krishna Kumar et al, 2010 Krishna Kumar et al, 2010
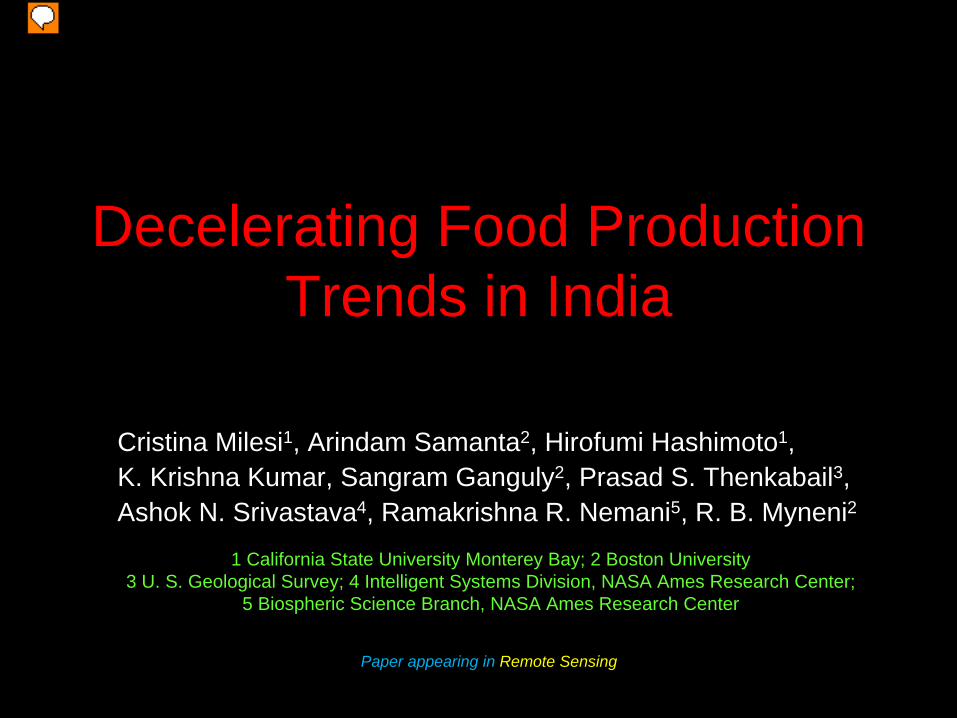
Decelerating Food Production Trends in India
Cristina Milesi1, Arindam Samanta2, Hirofumi Hashimoto1,K. Krishna Kumar, Sangram Ganguly2, Prasad S. Thenkabail3,Ashok N. Srivastava4, Ramakrishna R. Nemani5, R. B. Myneni2
1 California State University Monterey Bay; 2 Boston University3 U. S. Geological Survey; 4 Intelligent Systems Division, NASA Ames Research Center;
5 Biospheric Science Branch, NASA Ames Research Center
Paper appearing in Remote Sensing
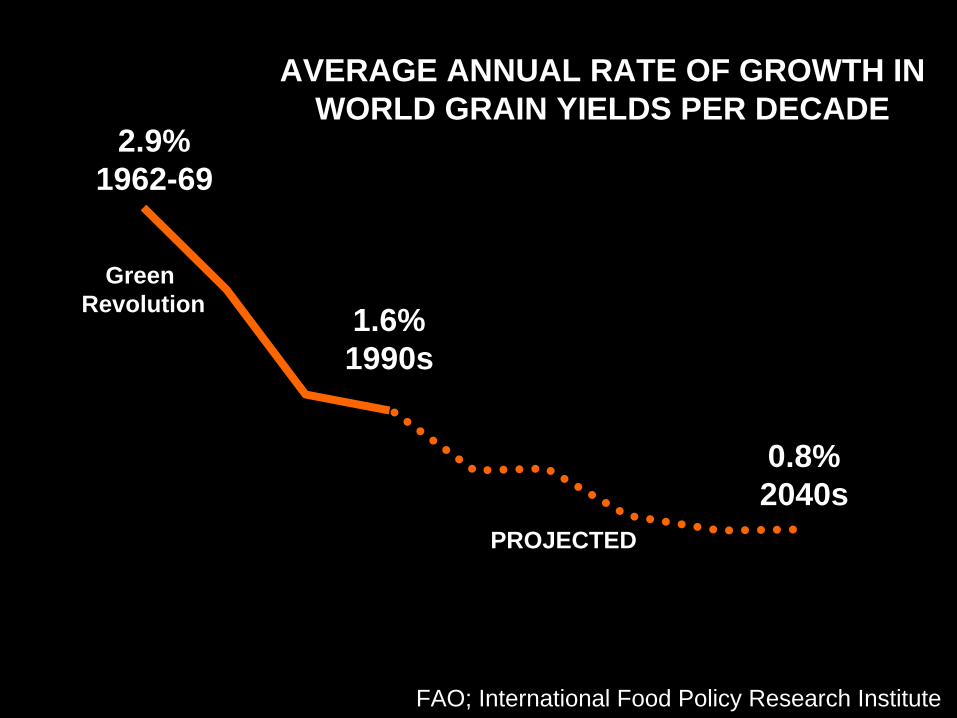
2.9%1962-69
0.8%2040s
1.6%1990s
PROJECTED
FAO; International Food Policy Research Institute
Green Revolution
AVERAGE ANNUAL RATE OF GROWTH IN WORLD GRAIN YIELDS PER DECADE
20
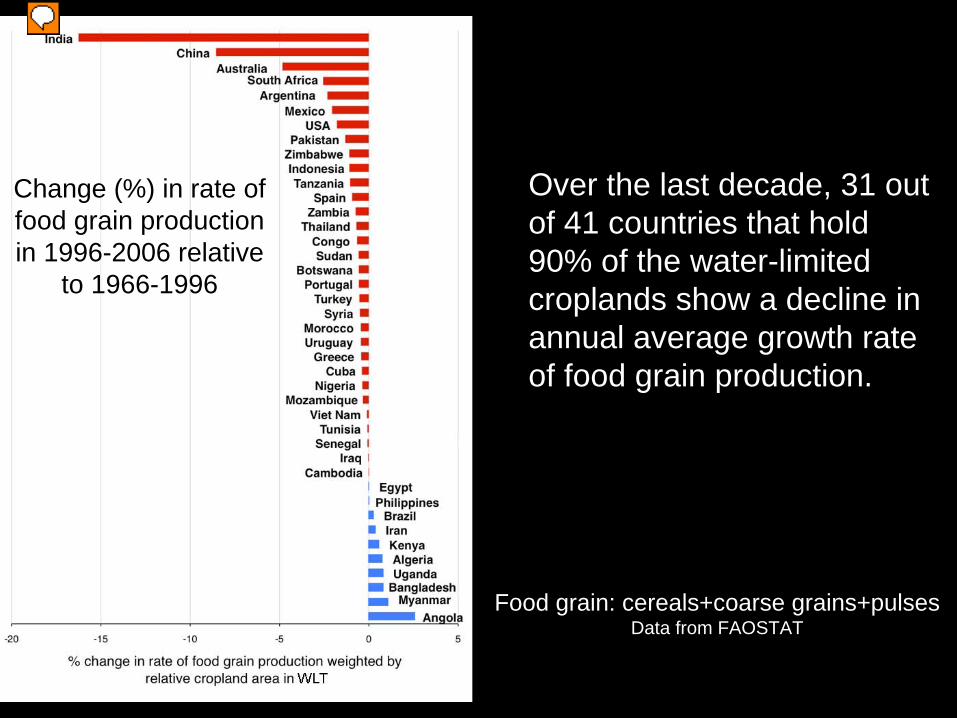
Over the last decade, 31 out of 41 countries that hold 90% of the water-limited croplands show a decline in annual average growth rate of food grain production.
Food grain: cereals+coarse grains+pulsesData from FAOSTAT
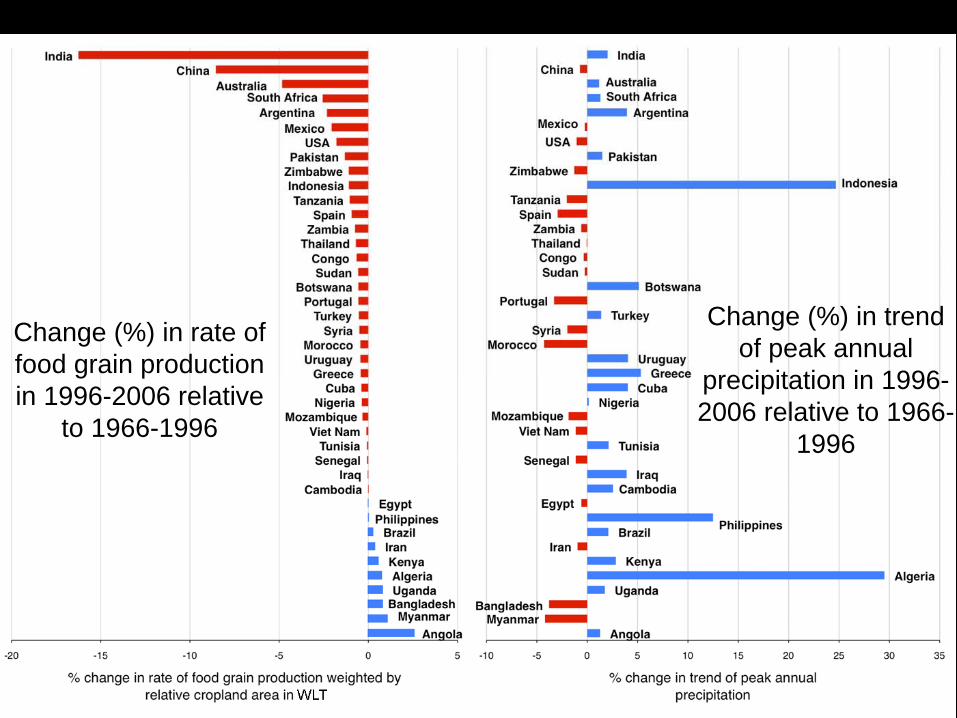
Change (%) in rate of food grain production in 1996-2006 relative
to 1966-1996
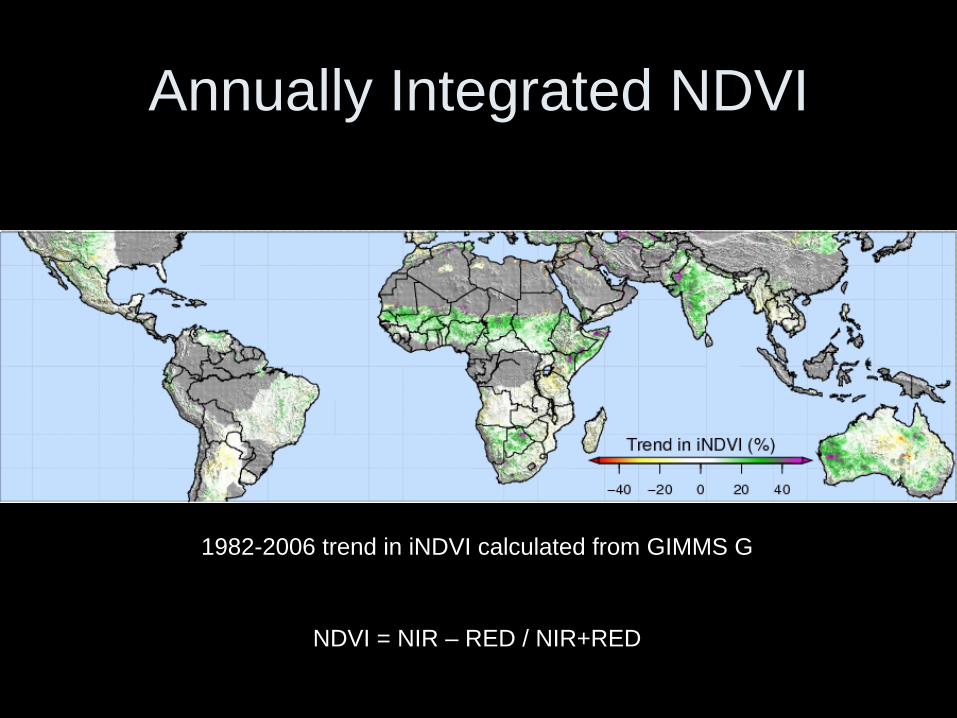
Annually Integrated NDVI
NDVI = NIR – RED / NIR+RED
1982-2006 trend in iNDVI calculated from GIMMS G

DECLINE IN AGRICULTURAL PRODUCTIVITY IN THE SEMI-ARID TROPICSDURING THE LAST DECADE
% change in vegetation greenness during 1996-2006 compared to 1982-1992 as calculated from GIMMS-G NDVI
45% of the water-limited tropical croplands show a decline in relative growth of integrated NDVI over
the last decade
NDVI = NIR – RED / NIR+RED
23
Change (%) in rate of food grain production in 1996-2006 relative
to 1966-1996
Change (%) in trend of peak annual
precipitation in 1996- 2006 relative to 1966-
1996
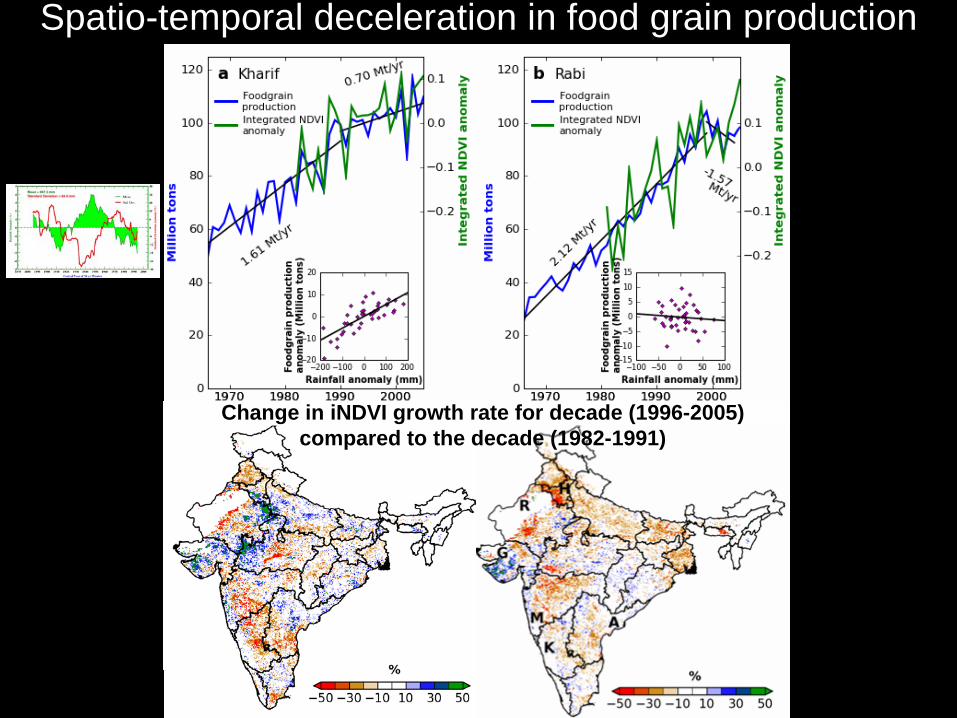
Spatio-temporal deceleration in food grain production
Change in iNDVI growth rate for decade (1996-2005) compared to the decade (1982-1991)
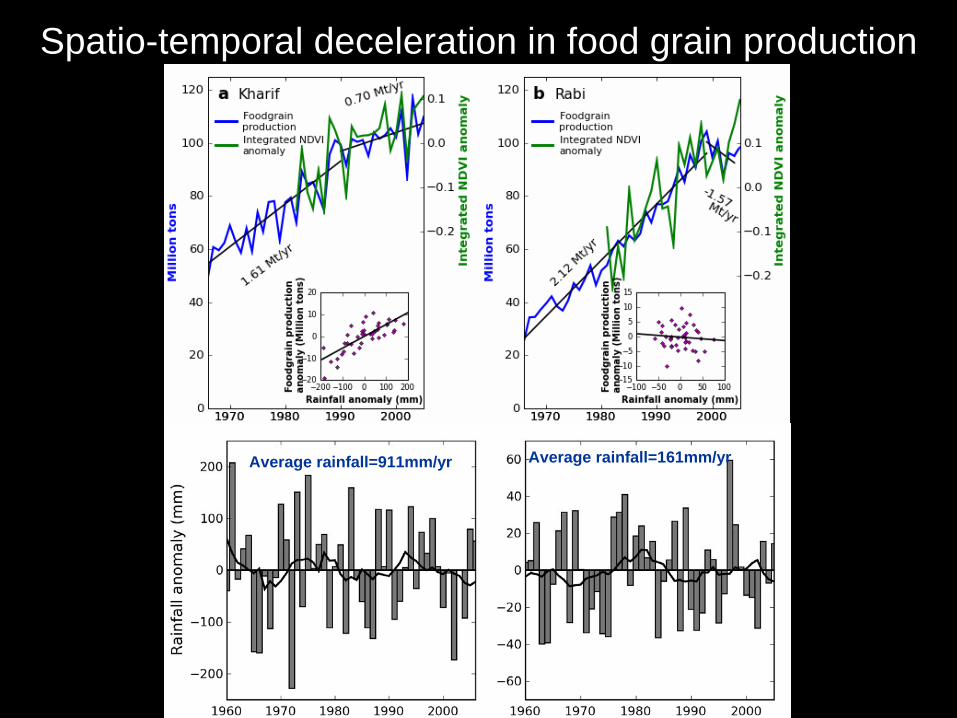
Spatio-temporal deceleration in food grain production
Average rainfall=911mm/yr Average rainfall=161mm/yr
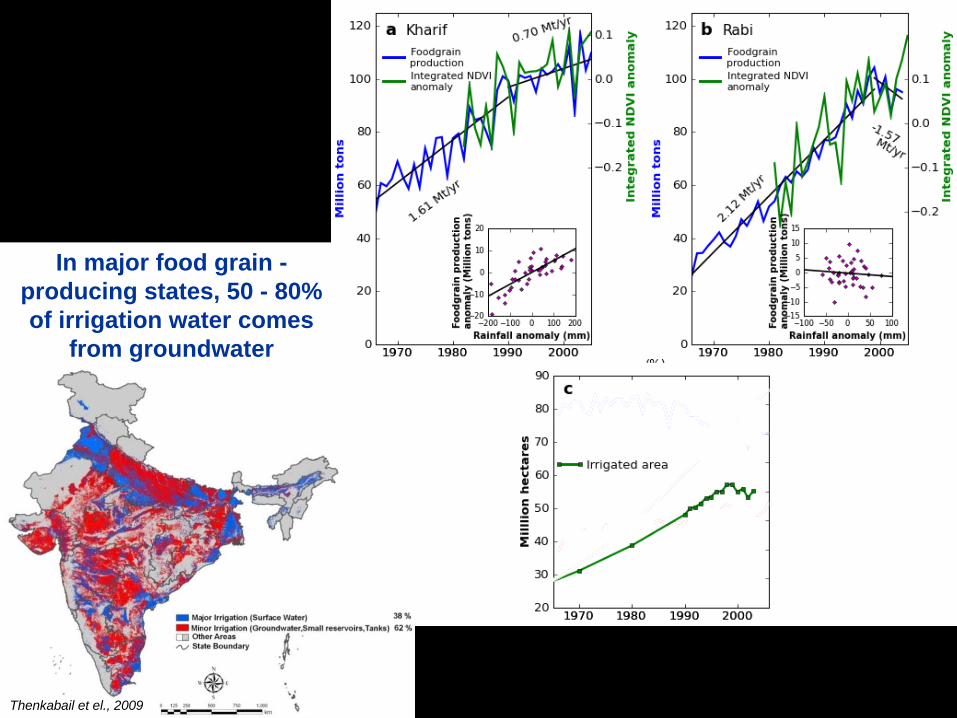
In major food grain - producing states, 50 - 80% of irrigation water comes
from groundwater
Thenkabail et el., 2009

Relative increase (%) in water consumption due to increased rabi (dry season) crop
production
( )) ⎪⎭
⎪⎬⎫
⎪⎩
⎪⎨⎧
⎥⎦
⎤⎢⎣
⎡−−
−=54.084.0
minmax
max
(0.107.1
NDVINDVI
NDVINDVIKcb m
m
∫=
=
=12
1
m
mmmy PETKcbAET
( ) ( )[ ]EPnyearsAETWC meantrend=Δ
ΔWC
Er-Raki et al., 2007

Relative increase (%) in water consumption due to increased rabi (dry season) crop
production
ΔWC
Central Groundwater Board
29
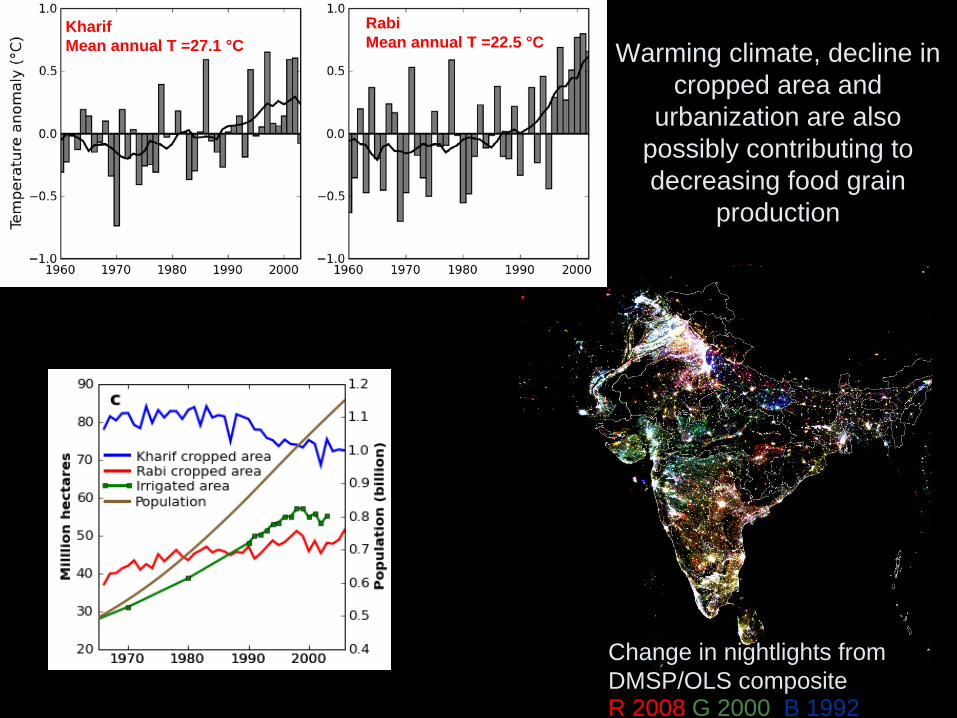
Warming climate, decline in cropped area and
urbanization are also possibly contributing to decreasing food grain
production
KharifMean annual T =27.1 °C
RabiMean annual T =22.5 °C
Change in nightlights from DMSP/OLS compositeR 2008 G 2000 B 1992

Thank you!