detection of terrain structures in airborne laser …
TRANSCRIPT
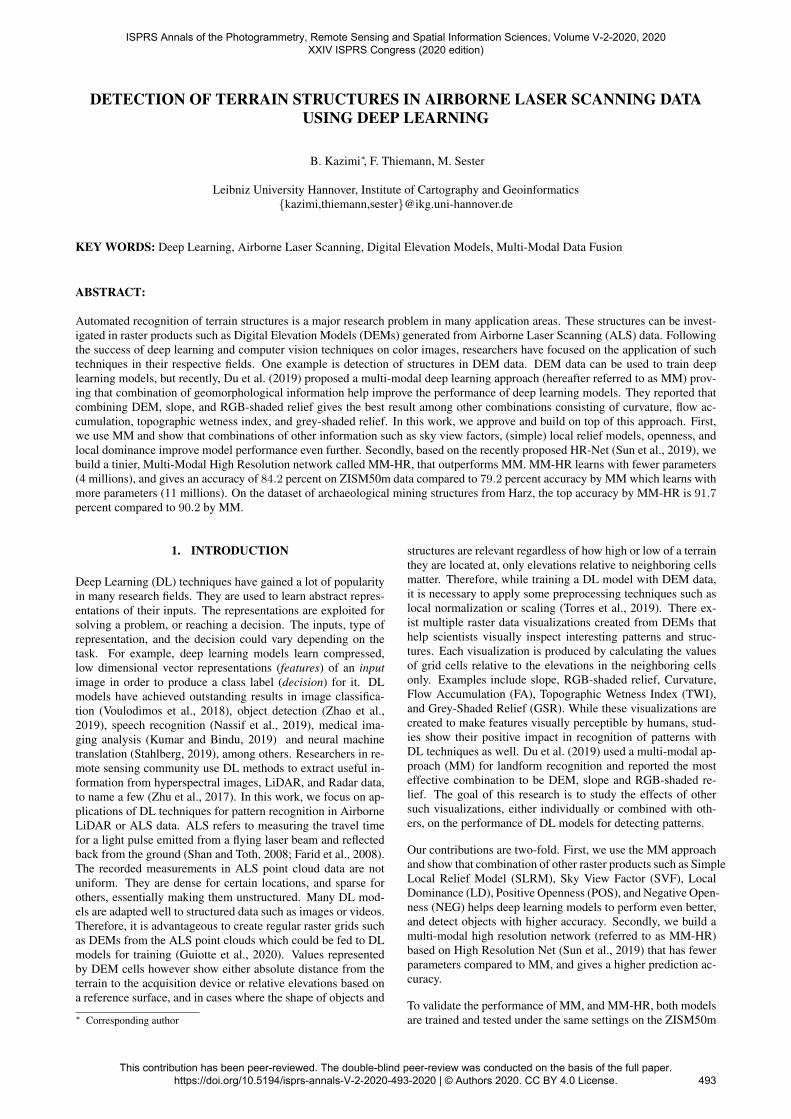
DETECTION OF TERRAIN STRUCTURES IN AIRBORNE LASER SCANNING DATAUSING DEEP LEARNING
B. Kazimi∗, F. Thiemann, M. Sester
Leibniz University Hannover, Institute of Cartography and Geoinformatics{kazimi,thiemann,sester}@ikg.uni-hannover.de
KEY WORDS: Deep Learning, Airborne Laser Scanning, Digital Elevation Models, Multi-Modal Data Fusion
ABSTRACT:
Automated recognition of terrain structures is a major research problem in many application areas. These structures can be invest-igated in raster products such as Digital Elevation Models (DEMs) generated from Airborne Laser Scanning (ALS) data. Followingthe success of deep learning and computer vision techniques on color images, researchers have focused on the application of suchtechniques in their respective fields. One example is detection of structures in DEM data. DEM data can be used to train deeplearning models, but recently, Du et al. (2019) proposed a multi-modal deep learning approach (hereafter referred to as MM) prov-ing that combination of geomorphological information help improve the performance of deep learning models. They reported thatcombining DEM, slope, and RGB-shaded relief gives the best result among other combinations consisting of curvature, flow ac-cumulation, topographic wetness index, and grey-shaded relief. In this work, we approve and build on top of this approach. First,we use MM and show that combinations of other information such as sky view factors, (simple) local relief models, openness, andlocal dominance improve model performance even further. Secondly, based on the recently proposed HR-Net (Sun et al., 2019), webuild a tinier, Multi-Modal High Resolution network called MM-HR, that outperforms MM. MM-HR learns with fewer parameters(4 millions), and gives an accuracy of 84.2 percent on ZISM50m data compared to 79.2 percent accuracy by MM which learns withmore parameters (11 millions). On the dataset of archaeological mining structures from Harz, the top accuracy by MM-HR is 91.7percent compared to 90.2 by MM.
1. INTRODUCTION
Deep Learning (DL) techniques have gained a lot of popularityin many research fields. They are used to learn abstract repres-entations of their inputs. The representations are exploited forsolving a problem, or reaching a decision. The inputs, type ofrepresentation, and the decision could vary depending on thetask. For example, deep learning models learn compressed,low dimensional vector representations (features) of an inputimage in order to produce a class label (decision) for it. DLmodels have achieved outstanding results in image classifica-tion (Voulodimos et al., 2018), object detection (Zhao et al.,2019), speech recognition (Nassif et al., 2019), medical ima-ging analysis (Kumar and Bindu, 2019) and neural machinetranslation (Stahlberg, 2019), among others. Researchers in re-mote sensing community use DL methods to extract useful in-formation from hyperspectral images, LiDAR, and Radar data,to name a few (Zhu et al., 2017). In this work, we focus on ap-plications of DL techniques for pattern recognition in AirborneLiDAR or ALS data. ALS refers to measuring the travel timefor a light pulse emitted from a flying laser beam and reflectedback from the ground (Shan and Toth, 2008; Farid et al., 2008).The recorded measurements in ALS point cloud data are notuniform. They are dense for certain locations, and sparse forothers, essentially making them unstructured. Many DL mod-els are adapted well to structured data such as images or videos.Therefore, it is advantageous to create regular raster grids suchas DEMs from the ALS point clouds which could be fed to DLmodels for training (Guiotte et al., 2020). Values representedby DEM cells however show either absolute distance from theterrain to the acquisition device or relative elevations based ona reference surface, and in cases where the shape of objects and
∗ Corresponding author
structures are relevant regardless of how high or low of a terrainthey are located at, only elevations relative to neighboring cellsmatter. Therefore, while training a DL model with DEM data,it is necessary to apply some preprocessing techniques such aslocal normalization or scaling (Torres et al., 2019). There ex-ist multiple raster data visualizations created from DEMs thathelp scientists visually inspect interesting patterns and struc-tures. Each visualization is produced by calculating the valuesof grid cells relative to the elevations in the neighboring cellsonly. Examples include slope, RGB-shaded relief, Curvature,Flow Accumulation (FA), Topographic Wetness Index (TWI),and Grey-Shaded Relief (GSR). While these visualizations arecreated to make features visually perceptible by humans, stud-ies show their positive impact in recognition of patterns withDL techniques as well. Du et al. (2019) used a multi-modal ap-proach (MM) for landform recognition and reported the mosteffective combination to be DEM, slope and RGB-shaded re-lief. The goal of this research is to study the effects of othersuch visualizations, either individually or combined with oth-ers, on the performance of DL models for detecting patterns.
Our contributions are two-fold. First, we use the MM approachand show that combination of other raster products such as SimpleLocal Relief Model (SLRM), Sky View Factor (SVF), LocalDominance (LD), Positive Openness (POS), and Negative Open-ness (NEG) helps deep learning models to perform even better,and detect objects with higher accuracy. Secondly, we build amulti-modal high resolution network (referred to as MM-HR)based on High Resolution Net (Sun et al., 2019) that has fewerparameters compared to MM, and gives a higher prediction ac-curacy.
To validate the performance of MM, and MM-HR, both modelsare trained and tested under the same settings on the ZISM50m
ISPRS Annals of the Photogrammetry, Remote Sensing and Spatial Information Sciences, Volume V-2-2020, 2020 XXIV ISPRS Congress (2020 edition)
This contribution has been peer-reviewed. The double-blind peer-review was conducted on the basis of the full paper. https://doi.org/10.5194/isprs-annals-V-2-2020-493-2020 | © Authors 2020. CC BY 4.0 License.
493
dataset provided by Du et al. (2019). We calculate SVF, SLRM,NEG, POS, and LD from the original dataset1 and make themavailable online2. We also run experiments on our own datasetcollected from Harz, Lower Saxony with the same raster datavariations and similar settings.
The rest of the paper is designed as follows. Section 2 listsrelated work. Section 3 describes the contributions of this re-search, followed by the experiments in Section 4. Results ofthe experiments and discussions are included in Section 5, andfinally Section 6 concludes this study and points out future re-search in this direction.
2. RELATED WORK
Deep learning techniques, especially Convolutional Neural Net-works (CNNs), became popular after AlexNet (Krizhevsky etal., 2012) won the ImageNet classification challenge (Russakovskyet al., 2015). AlexNet consists of a series of convolutional andmax pooling layers, followed by two dense layers, and a fi-nal classification layer. The final layer uses a softmax func-tion producing class probabilities for a given image. Therehave been many improvements in image classification usingCNNs after AlexNet. Simonyan and Zisserman (2014) intro-duced VGGNet which uses smaller convolutional kernels andstrides, and more layers leading to faster training time and bet-ter generalization. He et al. (2016) introduced residual learn-ing in the ResNet model which facilitates adding more layersand non-linearities for learning complex mappings between theinput and output while not harming simpler mappings, if any.Szegedy et al. (2014) proposed inception modules which ratherthan using one fixed-size kernel, use multiple kernels with dif-ferent sizes to account for the variability in the size of import-ant features in an image. DenseNet is proposed by Huang etal. (2017) which uses the output of each layer as input to everysubsequent layer, contrary to previous approaches that only feedthe output of one layer only to the following layer. This leads tohigher prediction accuracy with reduced number of parameters.Other examples include Xception (Chollet, 2016), MobileNets(Howard et al., 2017; Sandler et al., 2018), and EfficientNet(Tan, Le, 2019). Most of the previous methods perform down-sampling, i.e., max pooling or striding, to reduce the resolu-tion of the features and increase efficiency. As a result a lot ofinformation is lost during the process. Recently High Resol-ution Network (HRNet) (Wang et al., 2019; Sun et al., 2019)was proposed that maintains high resolution, and produces richsemantic representations of the input through multiple parallelhigh and low resolution convolution and consistent exchangeof information among them. This high resolution representa-tion has proved to be superior for many tasks in computer vis-ion such as semantic and instance segmentation, and object de-tection. If classification is intended, only the final outputs ofmultiple parallel convolutional branches are downsampled tobe given to a classifier.
In addition to their success in natural images, deep learningtechniques have been widely used in pattern recognition fromALS raster data. Many researchers use DEM as input data. Forexample Marmanis et al. (2015) use DEM to train a deep clas-sification model for above-ground objects in urban area, Torreset al. (2018) apply deep learning to identify mountain sum-mits in DEM data, and Politz et al. (2018) and Kazimi et al.
1 http://www.adv-ci.com/download/geomorphology/2 https://seafile.cloud.uni-hannover.de/d/17ce9a0f343e415aaff1/
(2019a,b) explore detection of archaeological objects with deeplearning. Patterns in DEM, especially smaller changes, are noteasily visually comprehensible by the human eye. Other rasterderivatives such as SLRM, SVF, POS, NEG, and LD help makethe DEM patterns understandable. Kokalj and Hesse (2017)give detailed explanations and examples of previously men-tioned raster derivatives created from DEM, but we give a shortdescription of the ones we use in this research in Section 2.1below:
2.1 ALS raster data derivatives
• Simple Local Relief Model (SLRM): SLRM is calculatedby smoothing the original DEM, extracting points that aresimilar in both, the original and the smoothed DEM, andfinally subtracting it from the original DEM. It is used toremove the major features in a DEM and highlight smallstructures such as those in archaeological mining (Gallweyet al., 2019).
• Local Dominance (LD): LD is the steepness angle of apoint relative to its surrounding surface, calculated for aspecified radius around the point. LD is suitable for pro-truded features such as barrows, and also deep featuressuch as hollow ways.
• Sky View Factor (SVF): SVF for a point is calculated re-lative to its surrounding points within a specified radiusto show what portion of the sky is visible. SVF is wellsuited for archaeological structures such as mining sink-holes (Kokalj, Hesse, 2017).
• Openness: Openness is calculated using the mean zenithor mean nadir angles for a certain point relative to its sur-rounding points within a defined radius. Mean zenith angledefines Positive Openness (POS), and mean nadir angledefines Negative Openness (NEG) (Doneus, 2013). WhilePOS highlights protruded features such as rims in bombcraters, and ridges between hollow ways, NEG highlightsdeep features such as the actual hollow ways.
Since the aforementioned raster derivatives can help identifystructures, they should be helpful in automatic learning tasksas well. Gallwey et al. (2019) used raster products such asSLRM, POS and NEG separately to train deep learning mod-els for detection of mining pits. Other researchers used SLRMfor their deep learning tasks (Trier et al., 2019; Verschoof-vanet al., 2019). Recently, Du et al. (2019) conducted experimentsand proved that the addition of other rasters in a multi-modalfashion improve deep learning models’ performances. They re-port combining DEM with RGB-shaded relief, and slope lead toa higher accuracy in classification using a multi-modal learningapproach explained in detail in Section 2.2.
2.2 Multi-Modal network
The MM network by Du et al. (2019) takes n input types andextract features for each of them in parallel. It then fuses theextracted features together and uses them to classify the giveninputs. The parallel feature extractors for each input type worksbetter than using a single feature extractor where all input typesare fed together. This is because rather than extracting generalfeatures for the input types as a whole, extracting distinct fea-tures individually for all input types help the following layersdiscriminate objects and structures better. The overall architec-ture of the MM model is shown in Figures 1, 2, and 3.
ISPRS Annals of the Photogrammetry, Remote Sensing and Spatial Information Sciences, Volume V-2-2020, 2020 XXIV ISPRS Congress (2020 edition)
This contribution has been peer-reviewed. The double-blind peer-review was conducted on the basis of the full paper. https://doi.org/10.5194/isprs-annals-V-2-2020-493-2020 | © Authors 2020. CC BY 4.0 License.
494

The current paper builds on top of the MM approach, exploringbetter raster alternatives, and a better multi-modal network forthis purpose, details of which are given in Section 3.1.
Figure 1. Architecture of the MM model. M and n denote thenumber of classes and input raster types, respectively. The
feature extractor module is illustrated in Figure 2. Conv BlockType 2 is shown in Figure 3
Figure 2. Feature extractor for the MM model shown in Figure 1.
Figure 3. Convolutional Block Type 2 for the MM model shownin Figure 1.
3. METHOD
The main contribution of this research is proposing a multi-modal high resolution network referred to as MM-HR. It fol-lows the idea of MM, but extends it to a simpler version of therecently proposed HRNet model proposed by Sun et al. (2019).Additionally, we propose and confirm the use and efficiencyof other raster derivatives such as SLRM, SVF, LD, POS, andNEG for multi-modal learning tasks. Details of the proposedMM-HR model are given in Section 3.1.
3.1 Multi-Modal High Resolution network
The MM-HR model we propose follows the approach used inMM for feature extraction. The layers following feature fusionhave the same structure as that of HRNet (Sun et al., 2019), butwith fewer number of blocks and layers, and fewer parameters.MM-HR, similar to HRNet, does not downsample features inthe layers after concatenation of the parallel feature extractoroutputs. It rather maintains the high resolution throughout the
network till the end, before feeding it to a classification layer.Not downsampling leads to reduced loss of information, andbetter prediction. The MM-HR architecture is illustrated in Fig-ures 4, 5, 6, and 7.
Figure 4. Architecture of the MM-HR model. M and n denotethe number of classes and input raster types, respectively. The
feature extractor module is illustrated in Figure 5. ConvolutionalBlock and Residual Block are shown in Figures 6 and 7
Figure 5. Feature extractor for the MM-HR model shown inFigure 4.
Figure 6. Convolutional Block for the MM-HR model shown inFigure 4. f depends on the number of input filters to the block.
Figure 7. Residual Block for the MM-HR model shown inFigure 4. f depends on the number of input filters to the block.
ISPRS Annals of the Photogrammetry, Remote Sensing and Spatial Information Sciences, Volume V-2-2020, 2020 XXIV ISPRS Congress (2020 edition)
This contribution has been peer-reviewed. The double-blind peer-review was conducted on the basis of the full paper. https://doi.org/10.5194/isprs-annals-V-2-2020-493-2020 | © Authors 2020. CC BY 4.0 License.
495

(a) DEM (b) LD (c) SLRM (d) SVF
(e) POS (f) NEG (g) RGB (h) SLOPE
Figure 8. Examples of different raster derivatives for a fluvial landform.
(a) DEM (b) LD (c) SLRM (d) SVF
(e) POS (f) NEG (g) RGB (h) SLOPE
Figure 9. Examples of different raster derivatives for bomb craters from Harz.
Experiments are conducted training and evaluating both modelsunder the same settings on both, ZISM50m and Harz dataset,details and results of which are given in Sections 4 and 5.
4. EXPERIMENTS
4.1 Data
For this research, we use two datasets. The first one is ZISM50mdataset provided by Du et al. (2019). It contains examples of sixtypical landform categories including aeolian, arid, loess, karst,fluvial, and periglacial from central China. There are 8400 ex-amples (1400 for each category) in this dataset which are di-vided into 80, 10, and 10 percent splits for training, validation,and test set, respectively. The data has a resolution of 50 meters
per pixel. Each example is around 600x600 pixels, which rep-resents a region of 900 km2. For memory restrictions and tospeed up the experiments, we resize each example to 224x224pixels each during training.
The second dataset is DEM acquired from the Harz Region inLower Saxony which includes examples of archaeological min-ing structures such as bomb craters, charcoal kilns, barrows,and mining sinkholes. The DEM has a resolution of 0.5 metersper pixel. There are 1107 bomb craters, 1042 charcoal kilns,1293 barrows and 2666 mining sinkholes. Each example has asize of 256x256 pixels. This dataset is divided into 80, 10, and10 percent for training, validation, and testing, respectively.
With the available DEMs from both datasets, we calculate otherraster products such as SVF, SLRM, LD, POS, Slope, RGB-
ISPRS Annals of the Photogrammetry, Remote Sensing and Spatial Information Sciences, Volume V-2-2020, 2020 XXIV ISPRS Congress (2020 edition)
This contribution has been peer-reviewed. The double-blind peer-review was conducted on the basis of the full paper. https://doi.org/10.5194/isprs-annals-V-2-2020-493-2020 | © Authors 2020. CC BY 4.0 License.
496

(a) Top 10 accuracies on ZISM50m data sorted by MM (b) Top 10 accuracies on ZISM50m data sorted by MM-HR
(c) Top 10 accuracies on Harz data sorted by MM (d) Top 10 accuracies on Harz data sorted by MM-HR
(e) Top results on ZISM50m data (f) Top results on Harz data
Figure 10. Top 10 accuracies among different combinations for both models.
shaded relief, and NEG using the Relief Visualization Tool-box (Kokalj, Somrak, 2019). An example of fluvial landformfrom ZISM50m dataset is shown in Figure 8, and an exampleof bomb craters from Harz is illustrated in Figure 9 .
4.2 Multi-Modal learning
To observe the effects of different raster products on detectionof structures using deep learning, we use different combina-tions of 6 raster products: SVF, SLRM, LD, POS, NEG, andthe origital DEM. The 6 raster products can form 63 differentcombinations without repetition. They include single productsand combinations of two, three, four, five, and finally six rasterderivatives. Additionally, we use the best combination: RGB-shaded relief, slope and DEM , reported by Du et al. (2019).Thus, we run both models 64 times each.
For the Harz data, we use SVF, SLRM, LD, POS, NEG, DEM,RGB-shaded relief, and slope. Due to time constraints, we onlytry combinations of 1, 2, and 3 raster derivatives. Consequently,we run both models 92 times each on the Harz data. The resultsare detailed in Section 5.
4.3 Model training
Both models discussed in Section 3 are trained, and evaluatedusing the exact same settings, and on both datasets . The imple-mentations are in Python using the Keras (Chollet et al., 2015)library. Models are trained to minimize sparse categorical crossentropy, aiming for the maximum categorical accuracy. Optim-ization function is stochastic gradient descent with the learningrate of 0.00001 and momentum of 0.9. Training is done usingtwo GPUs for 100 epochs and batch size of 50 on ZISM50mdata. The number of training epochs and batch size for Harzdataset are 50 and 32, respectively. Parameters leading to max-imum accuracy on validation data during training are saved todisk, and used for evaluation on the test data.
5. RESULTS AND DISCUSSION
In this section, we first evaluate and compare the performancesof both methods: MM and MM-HR on the two datasets. Ad-ditionally, we compare both methods in terms of computationand memory efficiency.
5.1 Detection performance
To compare the results of combinations of different raster de-rivatives, and the performance of both models, we first run theMM model on each (of the 64) combinations and calculate itsaccuracy on the test data. We sort the accuracies in descendingorder and show the corresponding accuracy achieved for eachcombination using the MM model on both datasets in Figures10a and 10c. We only show the results for top 10 for visibility.
It is observed in Figure 10a that the highest accuracy by MM is79.2% achieved with the combination of 5 raster types, namelyDEM, NEG, POS, SLRM, and SVF. It is followed by combin-ation of fewer features with a slightly lower accuracy, 78.3%.Combination of RGB-shaded relief, DEM, and SLOPE whichwas reported to have the highest accuracy in the study by Du etal. (2019) gives the 5th best accuracy, 77.5%.
It is also observed that almost for all the combinations, the ac-curacy produced by MM-HR is higher than that of MM. The topaccuracy by MM-HR (91.7%) on Harz dataset is achieved usingPOS and SVF which is also higher than that of MM (90.2%)using DEM, RGB and slope. In Figures 10b and 10d, we il-lustrate the top 10 accuracies by MM-HR in a sorted manner.As illustrated in Figures 10e and 10f, MM-HR can output pre-dictions with a higher accuracy using solely the DEM on bothdatasets. For further comparison, the confusion matrices by thebest performing combination with both models on both data-sets are shown in Figure 11. Numbers 0 to 5 indicate classes:aeolian, arid, loess, karst, fluvial, and periglacial, respectivelyfor ZISM50m. For Harz, numbers 0 to 3 represent bomb craters,charcoal kilns, mining sinkholes and barrows, respectively, In
ISPRS Annals of the Photogrammetry, Remote Sensing and Spatial Information Sciences, Volume V-2-2020, 2020 XXIV ISPRS Congress (2020 edition)
This contribution has been peer-reviewed. The double-blind peer-review was conducted on the basis of the full paper. https://doi.org/10.5194/isprs-annals-V-2-2020-493-2020 | © Authors 2020. CC BY 4.0 License.
497

(a) MM on ZISM50m (b) MM-HR on ZISM50m
(c) MM on Harz (d) MM-HR on Harz
Figure 11. Confusion matrices.
the cells excluding the final row and column, the number at thetop shows the either the number of correctly classified example(indicated by white) or that of incorrectly classified examples(indicated by red). The number at the bottom shows the per-centage of its contribution to the total accuracy shown in thebottom right cell. The last row shows precision (P) and the lastcolumn shows recall (R) for each category.
5.2 Efficiency
In addition to giving a higher prediction accuracy as detailed inSection 5.1, MM-HR model has fewer parameters compared tothat of MM model, making it almost 3 times smaller in size. Onthe other hand, since the feature extractor in MM downsamplesfeatures rapidly, and into very small resolutions compared tothe gradual downsampling and high resolution features in MM-HR, MM model requires less memory than that of MM-HR andruns faster. Details of model parameters for both models aregiven in Table 1.
Model Trainable Non-trainable TotalMM 10,814,598 768 10,815,366MM-HR 4,021,446 7,968 4,029,414
Table 1. Parameters for both models. The parameters are for 3parallel feature extractor modules for both models with input
channels of 3, 1, and 1.
6. CONCLUSION AND OUTLOOK
In this research, we conducted experiments to see the effectof including other raster derivatives LRM, SVF, LD, POS, andNEG in addition to the commonly used DEM, in detection ofstructures using deep learning. We based our experiments onthe recently proposed MM approach by (Du et al., 2019), andshowed that the best accuracy (79.2%) is achieved by usingcombinations of DEM, NEG, POS, SLRM and SVF on ZISM50mdata. The best accuracy by MM on Harz data is 90.2%. Addi-tionally, we build a multimodal high resolution network, MM-HR, that is based on the High Resolution Network (Sun et al.,2019) and learns with fewer parameters (4 millions) than MM(11 millions). It produces a higher accuracy (84.2%) than that
ISPRS Annals of the Photogrammetry, Remote Sensing and Spatial Information Sciences, Volume V-2-2020, 2020 XXIV ISPRS Congress (2020 edition)
This contribution has been peer-reviewed. The double-blind peer-review was conducted on the basis of the full paper. https://doi.org/10.5194/isprs-annals-V-2-2020-493-2020 | © Authors 2020. CC BY 4.0 License.
498

of MM (79.2%) on ZISM50m data. The MM-HR accuracy(91.7%) is also higher than that of MM (90.2%) on Harz data.Classification methods are good when the desired task is to de-termine the existence of an object in a given location. However,if accurate location and boundaries of objects are expected, thenwe need to create models that perform pixel level predictionsand give bounding box coordinates. Therefore, future researchin this direction includes extension of the MM-HR approach forsemantic and instance segmentation.
ACKNOWLEDGEMENTS
The project is funded by the Ministry of Science in Lower Sax-ony. We gratefully acknowledge the support of NVIDIA Cor-poration with the donation of the Titan X Pascal GPU used forthis research.
REFERENCES
Chollet, F., 2016. Xception: Deep learning with depthwise sep-arable convolutions. arXiv preprint.
Chollet, F. et al., 2015. keras.
Doneus, M., 2013. Openness as Visualization Techniquefor Interpretative Mapping of Airborne Lidar Derived Di-gital Terrain Models. Remote Sensing, 5(12), 6427–6442.https://www.mdpi.com/2072-4292/5/12/6427.
Du, L., You, X., Li, K., Meng, L., Cheng, G., Xiong, L., Wang,G., 2019. Multi-modal deep learning for landform recognition.ISPRS Journal of Photogrammetry and Remote Sensing, 158,63 - 75.
Farid, A., Goodrich, D., Bryant, R., Sorooshian, S., 2008. Usingairborne lidar to predict Leaf Area Index in cottonwood treesand refine riparian water-use estimates. Journal of Arid Envir-onments, 72(1), 1 - 15.
Gallwey, J., Eyre, M., Tonkins, M., Coggan, J., 2019. Bring-ing Lunar LiDAR Back Down to Earth: Mapping Our Indus-trial Heritage through Deep Transfer Learning. Remote Sensing,11(17). https://www.mdpi.com/2072-4292/11/17/1994.
Guiotte, F., Pham, M., Dambreville, R., Corpetti, T., Lefvre,S., 2020. Semantic Segmentation of d Points Clouds: Rasteriz-ation Beyond Digital Elevation Models. IEEE Geoscience andRemote Sensing Letters, 1-4.
He, K., Zhang, X., Ren, S., Sun, J., 2016. Deep residual learn-ing for image recognition. Proceedings of the IEEE conferenceon computer vision and pattern recognition, 770–778.
Howard, A. G., Zhu, M., Chen, B., Kalenichenko, D., Wang,W., Weyand, T., Andreetto, M., Adam, H., 2017. Mobilenets:Efficient convolutional neural networks for mobile vision ap-plications. arXiv preprint arXiv:1704.04861.
Huang, G., Liu, Z., Van Der Maaten, L., Weinberger, K. Q.,2017. Densely connected convolutional networks. Proceedingsof the IEEE conference on computer vision and pattern recog-nition, 4700–4708.
Kazimi, B., Thiemann, F., Sester, M., 2019a. Object instancesegmentation in digital terrain models. M. Vento, G. Per-cannella (eds), Computer Analysis of Images and Patterns,Springer International Publishing, Cham, 488–495.
Kazimi, B., Thiemann, F., Sester, M., 2019b. Semantic Seg-mentation of Manmade Landscape Structures in Digital Ter-rain Models. ISPRS Annals of Photogrammetry, Remote Sens-ing and Spatial Information Sciences, IV-2/W7, 87-94.
Kokalj, Z., Hesse, R., 2017. Airborne laser scanning rasterdata visualization: A Guide to Good Practice.
Kokalj, Z., Somrak, M., 2019. Why not a single image? Com-bining visualizations to facilitate fieldwork and on-screen map-ping. Remote Sensing, 11(7), 747.
Krizhevsky, A., Sutskever, I., Hinton, G. E., 2012. Imagenetclassification with deep convolutional neural networks. Ad-vances in neural information processing systems, 1097–1105.
Kumar, E., Bindu, C., 2019. Medical Image Analysis UsingDeep Learning: A Systematic Literature Review. 81–97.
Marmanis, D., Adam, F., Datcu, M., Esch, T., Stilla, U., 2015.Deep neural networks for above-ground detection in very highspatial resolution digital elevation models. ISPRS Annals of thePhotogrammetry, Remote Sensing and Spatial Information Sci-ences, 2(3), 103.
Nassif, A. B., Shahin, I., Attili, I., Azzeh, M., Shaalan, K.,2019. Speech recognition using deep neural networks: A sys-tematic review. IEEE Access, 7, 19143–19165.
Politz, F., Kazimi, B., Sester, M., 2018. Classification of laserscanning data using deep learning. 38th Scientific Technical An-nual Meeting of the German Society for Photogrammetry, Re-mote Sensing and Geoinformation, 27.
Russakovsky, O., Deng, J., Su, H., Krause, J., Satheesh, S.,Ma, S., Huang, Z., Karpathy, A., Khosla, A., Bernstein, M.,Berg, A. C., Fei-Fei, L., 2015. ImageNet Large Scale VisualRecognition Challenge. International Journal of Computer Vis-ion (IJCV), 115(3), 211-252.
Sandler, M., Howard, A., Zhu, M., Zhmoginov, A., Chen, L.-C.,2018. Mobilenetv2: Inverted residuals and linear bottlenecks.Proceedings of the IEEE conference on computer vision andpattern recognition, 4510–4520.
Shan, J., Toth, C. K., 2008. Topographic laser ranging and scan-ning: principles and processing.
Simonyan, K., Zisserman, A., 2014. Very deep convolutionalnetworks for large-scale image recognition. arXiv preprintarXiv:1409.1556.
Stahlberg, F., 2019. Neural Machine Translation: A Review.arXiv preprint arXiv:1912.02047.
Sun, K., Zhao, Y., Jiang, B., Cheng, T., Xiao, B., Liu,D., Mu, Y., Wang, X., Liu, W., Wang, J., 2019. High-Resolution Representations for Labeling Pixels and Regions.CoRR, abs/1904.04514. http://arxiv.org/abs/1904.04514.
Szegedy, C., Liu, W., Jia, Y., Sermanet, P., Reed, S. E.,Anguelov, D., Erhan, D., Vanhoucke, V., Rabinovich, A.,2014. Going Deeper with Convolutions. CoRR, abs/1409.4842.http://arxiv.org/abs/1409.4842.
Tan, M., Le, Q., 2019. Efficientnet: Rethinking model scalingfor convolutional neural networks. International Conference onMachine Learning, 6105–6114.
ISPRS Annals of the Photogrammetry, Remote Sensing and Spatial Information Sciences, Volume V-2-2020, 2020 XXIV ISPRS Congress (2020 edition)
This contribution has been peer-reviewed. The double-blind peer-review was conducted on the basis of the full paper. https://doi.org/10.5194/isprs-annals-V-2-2020-493-2020 | © Authors 2020. CC BY 4.0 License.
499

Torres, R. N., Fraternali, P., Milani, F., Frajberg, D., 2018. Adeep learning model for identifying mountain summits in di-gital elevation model data. 2018 IEEE First International Con-ference on Artificial Intelligence and Knowledge Engineering(AIKE), IEEE, 212–217.
Torres, R. N., Fraternali, P., Milani, F., Frajberg, D., 2019.Mountain summit detection with Deep Learning: evaluationand comparison with heuristic methods. Applied Geomatics, 1–22.
Trier, . D., Cowley, D. C., Waldeland, A. U., 2019.Using deep neural networks on airborne laser scan-ning data: Results from a case study of semi-automaticmapping of archaeological topography on Arran, Scot-land. Archaeological Prospection, 26(2), 165-175. ht-tps://onlinelibrary.wiley.com/doi/abs/10.1002/arp.1731.
Verschoof-van, d. V. W., Lambers, K. et al., 2019. Learning toLook at LiDAR: The use of R-CNN in the automated detectionof archaeological objects in LiDAR data from the Netherlands.Journal of Computer Applications, 2, 10.
Voulodimos, A., Doulamis, N., Doulamis, A., Protopapadakis,E., 2018. Deep learning for computer vision: A brief review.Computational intelligence and neuroscience, 2018.
Wang, J., Sun, K., Cheng, T., Jiang, B., Deng, C., Zhao, Y.,Liu, D., Mu, Y., Tan, M., Wang, X. et al., 2019. Deep high-resolution representation learning for visual recognition. arXivpreprint arXiv:1908.07919.
Zhao, Z.-Q., Zheng, P., Xu, S.-t., Wu, X., 2019. Object detec-tion with deep learning: A review. IEEE transactions on neuralnetworks and learning systems, 30(11), 3212–3232.
Zhu, X. X., Tuia, D., Mou, L., Xia, G.-S., Zhang, L., Xu, F.,Fraundorfer, F., 2017. Deep learning in remote sensing: A com-prehensive review and list of resources. IEEE Geoscience andRemote Sensing Magazine, 5(4), 8–36.
ISPRS Annals of the Photogrammetry, Remote Sensing and Spatial Information Sciences, Volume V-2-2020, 2020 XXIV ISPRS Congress (2020 edition)
This contribution has been peer-reviewed. The double-blind peer-review was conducted on the basis of the full paper. https://doi.org/10.5194/isprs-annals-V-2-2020-493-2020 | © Authors 2020. CC BY 4.0 License.
500