detection of pollution transport events southeast of ... · sis of example days of each of the...
TRANSCRIPT

Atmos. Chem. Phys., 9, 4827–4840, 2009www.atmos-chem-phys.net/9/4827/2009/© Author(s) 2009. This work is distributed underthe Creative Commons Attribution 3.0 License.
AtmosphericChemistry
and Physics
Detection of pollution transport events southeast of Mexico Cityusing ground-based visible spectroscopy measurements ofnitrogen dioxide
M. L. Melamed1, R. Basaldud1, R. Steinbrecher2, S. Emeis2, L. G. Ruız-Suarez1, and M. Grutter 1
1Centro de Ciencias de la Atmosfera, Univ. Nacional Autonoma de Mexico, Mexico D.F., Mexico2Institute for Meteorology and Climate Research, Atmospheric Environmental Research (IMK-IFU),Forschungszentrum Karlsruhe GmbH, Garmisch-Partenkirchen, Germany
Received: 19 December 2008 – Published in Atmos. Chem. Phys. Discuss.: 24 February 2009Revised: 9 June 2009 – Accepted: 7 July 2009 – Published: 22 July 2009
Abstract. This work presents ground based differential opti-cal absorption spectroscopy (DOAS) measurements of nitro-gen dioxide (NO2) during the MILAGRO field campaign inMarch 2006 at the Tenango del Aire research site located tothe southeast of Mexico City. The DOAS NO2 column den-sity measurements are used in conjunction with ceilometer,meteorological and surface nitric oxide (NO), nitrogen ox-ides (NOx) and total reactive nitrogen (NOy) measurementsto analyze pollution transport events to the southeast of Mex-ico City during the MILARGO field campaign. The studydivides the data set into three case study pollution transportevents that occurred at the Tenango del Aire research site.The unique data set is then used to provide an in depth analy-sis of example days of each of the pollution transport events.An in depth analysis of 13 March 2006, a Case One day,shows the transport of several air pollution plumes duringthe morning through the Tenango del Aire research site whensoutherly winds are present and demonstrates how DOAStropospheric NO2 vertical column densities (VCD), surfaceNO2 mixing ratios and ceilometer data are used to determinethe vertical homogeneity of the pollution layer. The anal-ysis of 18 March 2006, a Case Two day, shows that whennortherly winds are present for the entire day, the air at theTenango del Aire research site is relatively clean and no ma-jor pollution plumes are detected. Case 3 days are charac-terized by relatively clean air throughout the morning withlarge DOAS NO2 enhancements detected in the afternoon.
Correspondence to:M. L. Melamed([email protected])
The analysis of 28 March 2006 show the DOAS NO2 en-hancements are likely due to lightning activity and demon-strate how suitable ground-based DOAS measruements arefor monitoring anthropogenic and natural pollution sourcesthat reside above the mixing layer.
1 Introduction
Megacities (cities with a population greater than 10 million)play a critical role in local, regional and global air pollu-tion. One megacity of primary interest is Mexico City, theworld’s second largest city with an estimated population of22 million within an area of 1500 km2. Mexico City is lo-cated in the sub-tropics at 19◦ N and 99◦ W at 2240 m a.s.l.in a flat basin surrounded by mountains on three sides. Theprimary sources of pollution in Mexico City are transporta-tion, industrial processes and domestic related activities. Thehigh-density population, the unique geographical setting andmultiple emission sources lead to high pollution episodes ona regular basis in Mexico City. These episodes have seriousimmediate and longer-term impacts on human health and theenvironment.
Recent research has begun to unravel the complexity ofthe air pollution problem in Mexico City and its effectsnot only on a local but on a regional and global scales aswell. Since 1986, an automated network for atmosphericmonitoring in Mexico City (Red Automatica de MonitoreoAmbiental or RAMA) has been measuring surface mix-ing ratios of ozone (O3), nitrogen oxides (NOx), carbonmonoxide (CO), sulfur dioxide (SO2) and particulate matter
Published by Copernicus Publications on behalf of the European Geosciences Union.

4828 M. L. Melamed et al.: NO2 DOAS measurements at Tenango del Aire
Fig. 1. Map of the Mexico City metropolitan area indicating the T0,T1 and T2 supersites as well as the Tenango del Aire research siteto the southeast of the city center.
(PM10), (http://www.sma.df.gob.mx/simat). Meteorologicaldata has been available since 1948 from the National Me-teorology Service, (http://smn2.cna.gob.mx). In addition tothese continuous measurements, several large-scale, inten-sive field campaigns have augmented the data-base of air pol-lution and meteorological profiles. These include the MexicoCity Air Quality Initiative (MARI 1990–1993), the Investi-gacion sobre Materia Particulada y Deterioro Atmosferico-Aerosol and Visibility Research (IMADA-AVER 1997) andthe Mexico City Metropolitan Area (MCMA 2003) experi-ment (Molina and Molina, 2002). In response to previousstudies the Megacity Initiative: Local and Global ResearchObservations (MILAGRO 2006) campaign took place duringMarch of 2006. The goal of MILAGRO 2006 was to conductmeasurements of gas phase and aerosol air pollutants in theMexico City metropolitan area in order to study the transportand transformation of the measured air pollutants on local,regional and global scales (http://www.eol.ucar.edu/projects/milagro/). The MILAGRO 2006 campaign had three primarysurface research sites (T0, T1 and T2) to study the trans-port of pollution from the city center to the northeast. Todate, many articles have been published from these three sur-face research sites, (Doran et al., 2007; DeCarlo et al., 2008;Moffet et al., 2008; Querol et al., 2008; Stone et al., 2008;Thornhill et al., 2008; Hennigan et al., 2008, and referencestherein).
Here, we present an analysis of pollution transport eventsto the southeast of Mexico City through the Tenango delAire research site using a unique data set of surface ni-
5
4
3
2
1
0
NO
2 [m
olec
1016
cm
-2]
08:0018/3/06
10:00 12:00 14:00 16:00
Date a Time [CDT, -6 GMT]
6040200-20-40-60
Solar Zenith Angle [degrees]
NO2 DSCD NO2 Tropospheric VCD
Fig. 2. The NO2 DSCD (black line) is converted to the troposphericNO2 VCD by applying an AMF of the sec(SZA) in order to ac-count for the increased optical path length of photons as they travelthrough the stratospheric NO2 layer at large SZA.
tric oxide (NO), NOx and reactive nitrogen (NOy) mixingratios, differential optical absorption spectroscopy (DOAS)tropospheric nitrogen dioxide NO2 vertical column densi-ties (VCD), mixing layer heights (MLH) derived from back-scattering ceilometer measurements and meteorological data.Tenango del Aire, located at 19◦09′18′′ N and 98◦51′50′′ Wat 2377 m (Fig.1), was the only research site located tothe south of Mexico City during the MILAGRO campaign.Winds blew from the city center to the south on many daysthroughout the campaign (de Foy et al., 2008) making theTenango del Aire research site an integral part of interpretingthe results of the MILAGRO 2006 camaign. We first presentan overview of air pollution transportation events through theTenango del Aire research site using surface NO and NOxmixing ratios, DOAS tropospheric NO2 VCDs and meteo-rological data by dividing the data set into three pollutiontransport case studies. Secondly, the extent of mixing withinthe mixing layer (ML) in the Mexico City metropolitan areais complex and not well understood (Velasco et al., 2008;Molina et al., 2007; de Foy et al., 2006; Whiteman et al.,2000; Raga et al., 1999). Using the unique data set at theTenango del Aire research site, we present a new methodto study the vertical homogeneity of the ML using DOAStropospheric NO2 VCD and ceilometer MLH data in con-junction with surface NO2 mixing ratios. Finally, the impactof natural and anthropogenic pollution sources that resideabove the mixing layer (ML) on air quality within the Mex-ico City metropolitan area remains unknown (Raga et al.,1999; Yokelson et al., 2007). We show DOAS measure-ments and surface mixing ratios provide a technique to ob-serve pollution sources residing above the ML. The analysis
Atmos. Chem. Phys., 9, 4827–4840, 2009 www.atmos-chem-phys.net/9/4827/2009/
M. L. Melamed et al.: NO2 DOAS measurements at Tenango del Aire 4829
presented here shows a more comprehensive analysis of ur-ban air pollution results when a measurement site has bothsurface and remote sensing instruments.
2 Instrumentation and data anaylsis
The Tenango de Aire research site included DOAS measure-ments of NO2, a ceilometer to determine the MLH, surfacemeaurements of NO, NOx, NOy and surface meteorologicaldata (temperature, humidity, wind direction and wind speed).
2.1 DOAS instrumentation and method
Scattered sunlight in the zenith view direction was col-lected with a small-sized telescope (2.54 cm lens with a10 cm focal length) connected to a 600µm diameter op-tical fiber. The optical fiber feeds the collected zenithsky sunlight to an Ocean Optics S2000 Miniature FiberOptic Spectrometer with a TR-2 Thermoelectric Tempera-ture Regulator. The S2000 is a commercially purchasedcrossed Czarny-Turner fixed grating spectrometer with aone-dimensional (2048 pixel) charged coupled device (CCD)array, a 1200 line mm−1 grating and a 50µm entrance slitwidth resulting in an optical resolution of 1.07 nm full-width-half-maximum (FWHM) over the wavelength range from418 to 731 nm. The maximum integration time was set to75 msec and decreased automatically to prevent saturationthroughout the day reaching a minimum integration time of3 msec. The effect of having a maximum integration time of75 msec means that during the morning and late afternoon,the signal-to-noise ratio is small because the signal cannotbe maximized in 75 msec. Thus during the early morningand evening, the detection limit of the spectrometer was re-duced. In addition, varying the integration time in order toprevent saturation means the time-resolution of the recordedspectra varies throughout the day increasing as the intensityincreases. The acquisition program averages 100 spectra be-fore recording the spectra analyzed in this study.
The visible zenith sky spectra are analyzed using the dif-ferential optical absorption spectroscopy (DOAS) methodthat has been extensively discussed byNoxon (1975);Sanders(1996); Platt and Stutz(2008). The DOAS methoduses a Beer-Lambert type of equation to describe the atten-uation of radiation by molecular absorbers between a fore-ground and background spectrum,
IFG(λ)
IBG(λ)= P(λ)exp(−
m∑i=0
S′
mσ′
m(λ)), (1)
whereIFG(λ) is the foreground spectrum andIBG(λ) is thebackground spectrum. The background spectrum is typicallya noon-time spectrum measured in clear skies and is charac-terized by the column densities of the absorbers in the non-polluted atmosphere (the particular background spectrum
used in this study is discussed later). The foreground spec-trum is a measured spectrum taken at a different time than thebackground spectrum. The polynomial,P(λ), is used to de-scribe the broad molecular absorption features and Rayleigh,aerosol and cloud scattering. The difference in molecularabsorption between the foreground and background spectrais given by the sum of the differential molecular absorptioncross sections of the species,σ
′
m(λ), times their differentialslant column densities (DSCD),S
′
m. To approximately ac-count for the wavelength smoothing performed by the instru-ment, the molecular absorption cross sections are convolvedby the slit function of the spectrometer used to measure theforeground and background spectra. It is important to notethat since the background solar spectrum is taken from theground and not outside the Earth’s atmosphere,S
′
m, is thedifference in the slant column density of the absorber of in-terest betweenIFG(λ) amd IBG(λ) and is not an absolutecolumn measurement.
A critical step in the DOAS method is converting theDSCD to a vertical column density (VCD) by applying anappropriate air mass factor (AMF) that accounts for the in-creased optical path length through the atmosphere of theforeground spectrum relative to the vertical optical pathlength (Perliski and Solomon, 1993). In the absence of multi-ple scattering due to clouds or aerosols, the AMF of NO2 col-umn density measurements for solar zenith angles (SZA) lessthan∼60◦ is the secant of the SZA (Solomon et al., 1987;Perliski and Solomon, 1993).
In the presences of multiple scattering, the retrieval ofthe oxygen collision complex (O4) can provide importantinformation in regards to the optical path length and at-mospheric aerosols (Erle et al., 1995; Wagner et al., 1998,2002, 2004; Pfleilsticker et al., 1999; Pfeilsticker et al., 2001;Wittrock et al., 2004; Sinreich et al., 2005; Heckel et al.,2005; Wang et al., 2005, 2006; Friess et al., 2006; Ladstatter-Weissenmayer et al., 2007; Melamed et al., 2008, and ref-erences therein). The atmospheric O4 mixing ratio is pro-portional to the square of the oxygen (O2) mixing ratio andany non-pressure-related change in the absorption of visiblelight due to O4 is an indicator of an increased optical pathlength due to multiple scattering in the atmosphere and nota true enhancement in the amount of O4 in the atmosphere(Perner and Platt, 1979; Greenblatt et al., 1990). It is impor-tant to note that since O4 is an O2-O2 collision complex, theO4 absorption cross section has the units cm5 molecules−2.The O4 “column densities” will be expressed with respect tothe quadratic O2 concentration in the units molecules2 cm−5.Since these units are not traditional units for a molecular ab-sorption cross section nor a column density, the O4 quantitieswill use the symbol DSCD∗ throughout the text to denote thisspecialty.
In this study, an AMF of the secant of the SZA is appliedto the NO2 DSCDs for SZA less than 60◦. The resultingNO2 VCD represents the tropospheric enhancement in the
www.atmos-chem-phys.net/9/4827/2009/ Atmos. Chem. Phys., 9, 4827–4840, 2009

4830 M. L. Melamed et al.: NO2 DOAS measurements at Tenango del Aire
-0.8
-0.4
0.0
0.4
0.8
Opt
ical
Dep
th [%
]
505500495490485480475470Wavelength [nm]
Fig. 3. The retrieved optical depth (red line) and the retrivedoptical depth plus the residual of the nonlinear least squaresfit (black line) of NO2. The ∼1% absorption corresponds to5.5×1016molecules cm−2 measured on 13 March 2008 duringPlume 2.
NO2 VCD due to pollution related events or increases in theoptical path length due to multiple scattering by clouds andaerosols. The O4 DSCD∗ are then used to qualitatively re-strain the source and cause of the tropospheric NO2 VCDenhancements as discussed in Sects.3.1, 3.2and3.3. This isdone by calculating an AMF for O4 according toMelamedet al.(2008), where the O4 AMF, AO4, is defined as
AO4 =S
′∗
O4+ S∗
BG,O4
V ∗
O4
, (2)
whereS′∗
O4is the retrieved O4 DSCD∗, S∗
BG, O4is the calcu-
lated O4 SCD∗ in the background spectrum andV ∗
O4is the
calculated O4 VCD∗ at the Tenango del Aire research site. Ifthe vertical distribution of NO2 and O4 were identical thenthe O4 AMF could be applied to the retrieved NO2 DSCDs.However, since the vertical profiles of NO2 and O4 differ, inthis study the O4 AMF is used to qualitatively restrain theinterpretation of the enhancements of the NO2 VCDs.
NO2 DSCDs are retrieved in the visible spectral windowof 470–505 nm. In addition to NO2, the other atmosphericabsorbers included in the retrieval are O3 and O4. The high-resolution laboratory absorption cross section for O3 at 223 K(Voigt et al., 2001), O4 at 296 K (Greenblatt et al., 1990)and NO2 at 293 K (Voigt et al., 2002) are convolved to theinstrument resolution for use in Eq. (1). The analysis alsoincludes a Ring cross section (Grainger and Ring, 1962) de-rived according toMelamed et al.(2008) from theKuruczet al.(1984) solar spectrum. A “shift and stretch” is appliedin order to align the laboratory cross sections acquired by adifferent spectrometer at different temperatures and air den-
sities with the foreground spectra. The broad absorption andattenuation features are accounted for by including a secondorder polynomial. The DOAS shift, stretch, polynomial co-efficients and DSCDs are solved for using the Levenberg-Marquardt nonlinear least squares fitting algorithm (Leven-berg, 1944; Marquardt, 1963). An example NO2 DOAS re-trieval is shown in Fig.3. The estimated detection limitfor the NO2 retrievals is 2.50×10¹⁵ molecules cm−2, assum-ing the intensity of the photons reaching the spectrometeris maximized, and the estimated error in the retrievals is±1.50×10¹⁵ molecules cm−2.
The same background spectrum was used for the en-tire campaign and was taken on 18 March 2006 at12:43 p.m. CDT when the SZA was the lowest for the entireday at 20◦. This background spectrum was chosen because itwas taken under clear skies at a low SZA and when the sur-face NO2 mixing ratio was small, 1.5 ppbv. The stratosphericNO2 column density on 18 March 2006 derived from SCIA-MACHY limb satellite data (A. Richter, personal communi-cation, 2009) at 10:00 CDT was 2.5×10¹⁵ molecules cm−2.Thus the background spectrum chosen in this analysis ac-counts for this NO2 stratospheric column and the DSCDspresented below are enhancements due to an increase inthe tropospheric NO2 column density or an enhanced pathlength through the atmosphere due to changes in SZA andmultiple scattering due to clouds and aerosol. Through-out the measurement period, the stratospheric NO2 columndensity measured by SCIAMACHY varied from 2.08 to2.87×1015 molecules cm−2. In addition, the diurnal varia-tion of stratospheric NO2 at 28◦ N has been shown to be onthe order of 1.4×10¹⁵ molecules cm−2 (Gil et al., 2008) andwe assume a similar diurnal variation in stratospheric NO2above Mexico City. Although the influence of the strato-spheric NO2 layer is small on the large NO2 enhancementspresented in this study, it provides another source of error inthe DOAS measurements.
The O4 DSCD∗s are retrieved in a similar wavelength re-gion as the NO2 retrievals since photons in different wave-length regions can exhibit different optical path lengths(Solomon et al., 1987; Platt et al., 1997). The O4 DSCD∗s areretrieved in the 460–490 nm wavelength region. The O4 re-trievals include the following: a “shift and stretch”, a secondorder polynomial and the Ring, NO2 and O3 cross sectionsused in the NO2 retrievals. The same background spectrumthat was used in the NO2 DOAS retrievals is used for theO4 retrievals. An example O4 DOAS retrieval is shown inFig. 4. The estimated detection limit under a maximum sig-nal is 2.0×1042 molecules2 cm−5 and the estimated error inthe O4 DOAS retrievals is±1.06×1042 molecules2 cm−5.
2.2 Ceilometer instrument and analysis
The ceilometer is a Vaisala double-lens ceilometer (Munkelet al., 2004). It measures the optical attenuated backscat-ter intensity at 0.855µm averaged over 15 s. This special
Atmos. Chem. Phys., 9, 4827–4840, 2009 www.atmos-chem-phys.net/9/4827/2009/

M. L. Melamed et al.: NO2 DOAS measurements at Tenango del Aire 4831
wavelength has been chosen because the absorption by wa-ter vapor is much lower here than at 0.910µm; a wavelengthfor which laser diodes are easily available. 0.885µm wouldhave been ideal but no laser diodes were available for thiswavelength. The typical vertical range of this instrumentis 4000 m; the vertical resolution is 7.5 m. Apart from thevery strong backscatter from clouds (that is what the instru-ment had originally been designed for) and fog, weaker gra-dients in the backscatter intensity are mainly determined bythe number and the size spectrum of aerosol particles float-ing in the air. Reliable analysis of the vertical profile ofparticle-induced backscatter can be made from heights above∼140 m. Below that height the overlap between the emittedbeam and the field-of-view of the receiver is smaller than30%. The overlap is zero for heights below 60 m. Any signalreceived from distances below 60 m is generated by multi-ple scattering and scattering of light at dust and dirt particleson the weather protection glass of the transmitter into thefield-of-view of the receiver. A slight contamination of theglass thus results in a signal amplitude decrease for distancesabove 60 m, but a signal amplitude increase for distances be-low 60 m (Emeis et al., 2007).
The MLH is retrieved using a refined approach of the re-trieval by Schafer et al.(2004), which is described in de-tail by Emeis et al.(2007). This retrieval algorithm is basedon an analysis of the minima of the vertical gradients of theaerosol backscatter intensity (i.e. the greatest decreases in thebackscatter intensity with height) recorded by the ceilometer.
Prior to the determination of gradient minima the overlapand range corrected attenuated backscatter profiles have to beaveraged over time and height to suppress noise generated ar-tifacts. Between 140 m and 500 m height sliding averaging isdone over 15 min and a height interval1h of 80 m. In thelayer between 500 and 2000 m1h for vertical averaging isextended to 160 m. Two additional parameters have been in-troduced to further reduce the number of false hits. The min-imum accepted attenuated backscatter intensity right belowa lifted inversion is set to 200×10−9 m−1 sr−1 in the lowerlayer and 250×10−9 m−1 sr−1 in the upper layer. Addition-ally the vertical gradient value of a lifted inversion must bemore negative than−0.30×10⁻⁹ m−1 sr−1 in the lower layerand more negative than−0.30×10⁻⁹ m−1 sr−1 in the upperlayer.
If B(z) denotes the measured attenuated backscatter in-tensity in the heightz above ground averaged over time andheight and1h is the height averaging interval, then a gradi-ent minimum is characterized by a change of sign from minusto plus of the second derivative ofB(z). The height intervalunder examination is searched from bottom to top for thesegradient minima. There is a gradient minimum in the heightz if the second derivative ofB(z) one range gate belowz isnot positive, if the second derivative ofB(z) in the heightzis positive and if the false hit conditions mentioned above arefulfilled. The MLH from optical remote sensing is taken asthe lowest height found by this procedure.
-2.0
-1.0
0.0
1.0
2.0
Opt
ical
Dep
th [%
]
490485480475470465460Wavelength [nm]
Fig. 4. The retrieved optical depth (red line) and the retrivedoptical depth plus the residual of the nonlinear least squaresfit (black line) of O4. The ∼2% absorption corresponds to4.7×1043molecules2 cm−5 measured on 28 March 2008 during athunderstorm. Please note O4 is an O2-O2 collision complex andtherefore the retrieved O4 values are reported with respect to thequadratic of the O2 concentrations in units molecules2 cm−5.
The retrieval algorithm for MLH fails in case of strongmist and fog and especially during rainfall because thenthe backscatter intensity is determined by the water or raindroplets only.
2.3 Surface mixing ratio measurements
NO, NOx and NOy surface mixing ratios were measured us-ing a TEI 42C chemiluinescence monitor (Thermo Scien-tific www.thermo.com) with several monitoring ranges span-ning from 0–5 ppbv and from 0–200 ppbv with a linearity of+/−1% of full scale reading. The lower detectable mixing ra-tio is 0.4 ppbv NO for all three species. When in NOy mode,an additional Mo catalitic converter is used on top of the mo-bile unit and a short PFA Teflon inlet was used to mimizewall losses of nitric acid, HNO3. Oxidized N species are con-verted to NO by a molybdenum NO2-to-NO converter heatedto about 325
◦
C and measured as such in the TEI 42C instru-ment (McClenny, 2000).
In the following analysis, the surface NO2 mix-ing ratio is inferred from the NOx and NO measure-ments ([NO2]=[NOx]−[NO]). However, commercial NOxchemiluinescence monitors with a molybdenum converterare able to partially reduce more oxidized nitrogen com-pound (HNO3, HONO, PAN, PPN). Therefore, the NO2 mix-ing ratio inferred from the above equation in this study is anupper limit dependent on the catalyst design and tempera-ture, input pipe length and photochemical age of the pollutedair parcel being observed. On 21 March the NO and NOx
www.atmos-chem-phys.net/9/4827/2009/ Atmos. Chem. Phys., 9, 4827–4840, 2009
4832 M. L. Melamed et al.: NO2 DOAS measurements at Tenango del Aire
10
8
6
4
2
0
Win
d S
peed
[m s
-1]
08:0013/3/06
10:00 12:00 14:00 16:00Date and Time [CDT, -6 GMT]
360
270
180
90
0
Wind D
irection [degrees]
35
30
25
20
15
10
5
0
Tem
pera
ture
[˚C
]
100
80
60
40
20
0
Hum
idity [%]
(a)
(b)
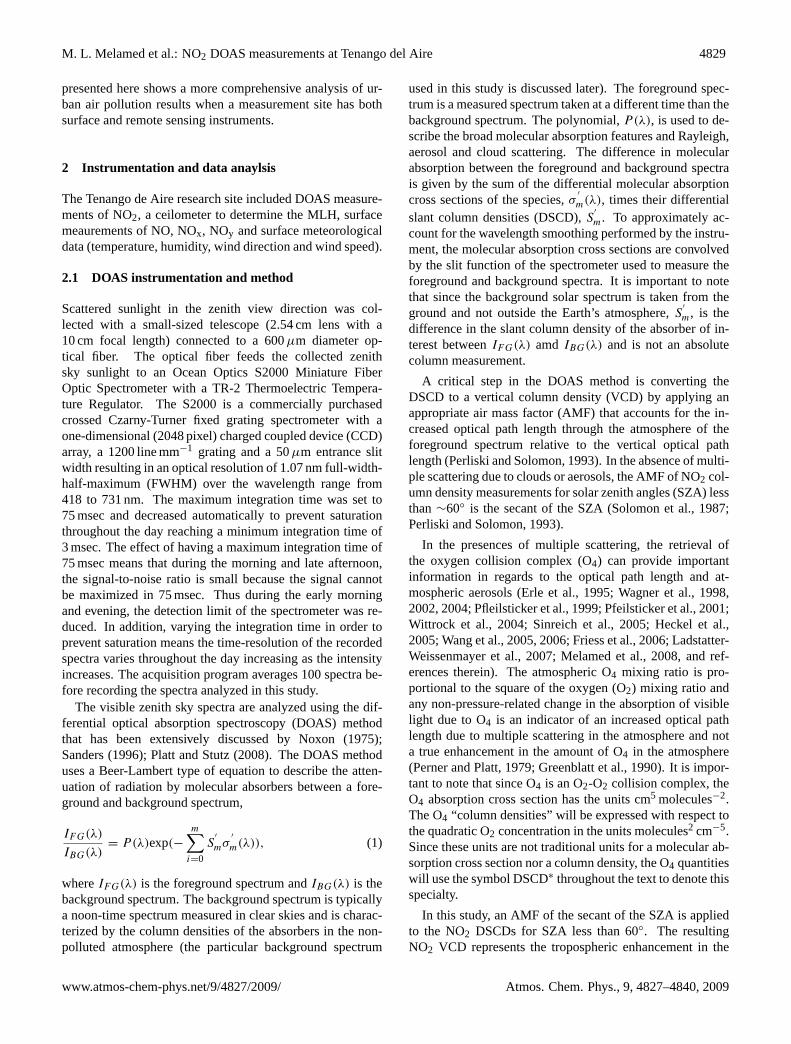
Fig. 5. Meteorological condition for 13 March 2006 at Tenango delAire (a) air temperature and relative humidity and(b) wind speedand wind direction.
surface instrument switched to measuring NOy and thereforethe surface mixing ratio of NO2 could not be inferred afterthis date.
3 Results and discussion
The Tengango del Aire data set is divided into three casestudies based on surface wind direction, surface NO2 andNOy mixing ratios and DOAS tropospheric NO2 VCD mea-surements as shown in Table1. The three different cases arethen compared with the basin-scale wind analysis conductedby de Foy et al.(2008).
Case 1 days are dominated by northerly winds during themorning. Since the research site is located to the southeastof the city center, the surface mixing ratio and DOAS mea-surements detect various pollution plumes being transportedthrough the research site when northerly winds exist. On themajority of the Case 1 days, the wind direction shifts mid-to late-afternoon from northerly to southerly. According tothe basin-scale wind transport analysis conducted byde Foyet al. (2008), the Case 1 days are classified as South Vent-ing (SV), O3-South (O3S), or Cold Surge (CS) episodes. SV,O3S and CS days were all dominated by northerly winds.
Case 2 days are all dominated by southerly winds. Thesurface mixing ratio and DOAS NO2 measurements do notdetect any significant increase in NO2 throughout these daysas the air to the south of the Tenango del Aire research site isrelatively clean. The majority of Case 2 days are classified asO3-North (O3N) episodes, which are dominated by southerlywinds throughout the entire day, (de Foy et al., 2008).
Case 3 days exhibit mainly southerly winds but the winddirection tends to be more variable throughout the day com-
pared to the Case 1 and Case 2 days. In the mornings, the sur-face mixing ratio and DOAS NO2 measurements do not de-tect any significant increase in air pollution. However, in theafternoon, the DOAS measurements observe large enhance-ments in the tropospheric NO2 VCD while the surface NO,NOx and NOy mixing ratios show no corresponding increase.Case 3 days are classified as “convection-north” (CNVN) or“convection-south” (CNVS) episodes that are characterizedby mostly clear skies in the morning, followed by afternoonshowers and exhibited either a stronger north or south trans-port in the afternoon (de Foy et al., 2008).
In the following three sections, an example day from eachcase is analyzed in depth and the importance of having bothsurface mixing ratio and remote sensing measurements aturban air pollution research sites to gain a more compre-hensive understanding of air pollution is discussed. DOASmeasurements are dependent on sufficient sunlight to makemesurements. Therefore, the following days are analyzedfrom 07:45 to 17:45 local time (CDT) in order to analyzepollution transport events when DOAS measurements wereavailable. It should be noted that all DOAS NO2 enhance-ments in the following analysis occur when the SZA is lessthan 60◦ and thus the use of the secant of the SZA, in the ab-sence of multiple scattering as determined by the O4 AMF,is valid.
3.1 Case 1 – 13 March 2006
A typical Case 1 day is 13 March 2006. On this day,northerly surface winds persist at Tenango del Aire between08:00 and 14:00 CDT. At 14:00 CDT, the wind directionchanges to southerly (Fig.5). During the six hour periodof northerly winds, the surface NO2 measurements indicatethree distinct plumes transported through the research site(Fig. 6). When the wind direction changes to southerly at14:00 CDT, the surface NO2 mixing ratio decreases and thehumidity increases as relatively clean air from the south istransported through the Tenango del Aire research site.
The first NO2 plume occurred early in the morning from07:43 to 08:42 CDT and had a maximum surface NO2 mixingratio of 29 ppbv. The average wind direction during plume 1was 95±69◦ due to a shift in the wind direction as the plumepassed through the research site. The average wind speedwas 1.1±0.5 m s−1. The mixing layer height (MLH) is lowduring this Plume 1 with an average height of 312±7 m. Ifthe ML was completely mixed and the intensity of the pho-tons reaching the spectrometer was maximized, the tropo-spheric NO2 VCD would be 1.7×10¹⁶ molecules cm−2 andshould be detected by the DOAS instrument. However, theDOAS NO2 measurements do not detect the first plume dueto a combination of two possible factors. The first factor isthat the maximum integration time was limited to 75 msec.With a large SZA during Plume 1, 64◦ to 75◦, the amountof light reaching the spectrometer was small, resulting ina very low signal-to-noise ratio. The second factor is it is
Atmos. Chem. Phys., 9, 4827–4840, 2009 www.atmos-chem-phys.net/9/4827/2009/

M. L. Melamed et al.: NO2 DOAS measurements at Tenango del Aire 4833
Table 1. Tenango del Aire days by case.
Date1 Case 1 Case 2 Case 3 SV O3S O3N CS CNVS CNVN
2 X X3 X X4 X X5 X X6 X X7 X X8 X X9 X X10 X X11 X X12 X X13 X X14 X X15 X X16 X X17 X X18 X X19 X X20 X X21 X X22 X X23 X X24 X X25 X X26 X X27 X X28 X X29 X X30 X X31 X X
SV = South Venting, O3S = O3-South; O3N = O3-North; CS = Cold Surge; CNVS = Convection-South; CNVN = Convection-North (de Foyet al., 2008).1 Day of month for March 2006
assumed NO2 has a strong source at the ground and in theearly morning, mixing of the ML is limited due to a smallamount of convective mixing and low horizontal wind speedsof 1.0 m s−1. It is likely Plume 1 is a thin low lying NO2 layerthat has a high surface mixing ratio of 29 ppbv but a smalltropospheric column density. Therefore, Plume 1 is not ob-served by the DOAS measurements due to a combination ofthese two factors.
A second Plume from the north was transported throughthe Tenango del Air research site from 09:13 to 10:34 CDT.The average wind direction during Plume 2 was 12±8◦ andthe average wind speed was 3.3±0.8 m s−1. The maximumsurface NO2 mixing ratio was 30 ppbv. With increased sur-face temperatures, convective mixing increases and the MLHduring Plume 2 increasing from 300 m to 500 m. Plume 2 isdetected in the DOAS measurements due to an increase inthe intensity of the photons reaching the spectrometer and anincrease in the total NO2 molecules in the atmosphere. As
can be seen in Fig.6, the tropospheric NO2 VCD reaches amaximum of 1.7×10¹⁶ molecules cm−2.
A third NO2 plume is transported through the Tenangodel Aire research site from 10:45 to 11:58 CDT. The averagewind direction during Plume 3 was still out of the north at4±18◦ and the average wind speed was 3.8±1.0 m s−1. Dur-ing the passage of Plume 3, the MLH continued to increaseto 1200 m and the maximum surface NO2 mixing ratio was32 ppbv. The DOAS tropospheric NO2 VCD reaches a max-imum column density of 4.8×10¹⁶ molecules cm−2.
After Plume 3, a smaller enhancement in the surface NO2mixing ratio and tropospheric NO2 VCD was observed. At14:00 CDT when southerly winds dominated, both the sur-face mixing ratio and the tropospheric VCD of NO2 de-creased as relatively clean air was transported to the re-search site from the south. The winds were southerly for therest of the day and no enhancements in the surface nor theDOAS NO2 measurements were detected. The surface NO2
www.atmos-chem-phys.net/9/4827/2009/ Atmos. Chem. Phys., 9, 4827–4840, 2009

4834 M. L. Melamed et al.: NO2 DOAS measurements at Tenango del Aire
5
4
3
2
1
0NO
2 V
CD
[mol
ec 1
016 c
m-2
]
35
30
25
20
15
10
5
0
NO
2 [p
pbv]
08:0013/3/06
10:00 12:00 14:00 16:00Date and Time [CDT, -6 GMT]
Plume 1 Plume 2 Plume 3
2.5
2.0
1.5
1.0
0.5
0.0Mix
ing
Laye
r H
eigh
t [km
] (a)
(b)
(c)
Fig. 6. Measurements of(a) ceilometer mixing layer height(b)tropospheric NO2 vertical column densities and(c) surface NO2mixing ratios on 13 March 2006. Plumes 1, 2 and 3 indicated threedistinct NO2 plumes that passed through the Tenango del Aire re-search site during the morning on 13 March 2006.
mixing ratios indicated a background level NO2 mixing ratioof 6.6±0.8 ppbv.
A comparison between Plume 2 and Plume 3 high-lights the difference between surface and column den-sity measurement and the importance of having both mea-surement techniques at an urban research site. TheDOAS measurements show that between Plume 2 andPlume 3, the total tropospheric NO2 VCD increases from1.7×10−16 molecules cm−2 to 4.8×10⁻¹⁶ molecules cm−2.However, the maximum surface NO2 mixing ratio stayedmore or less equal, 29 ppbv during Plume 2 and 32 ppbvduring Plume 3. This is a consequence of mainly two pro-cesses: (1) the NO2 molecules occupy more space due to anincrease in MLH and (2) with on-going surface emissionsinto a larger air volume and a decomposition of atmosphericnitrogen strong compounds such as PAN in the warmer atmo-sphere around noon, the total amount of the target moleculesin the volume increase but the mole fraction of NO2 near theground stays more or less constant.
5
4
3
2
1
0
O4
Airm
asse
s
08:0013/3/06
10:00 12:00 14:00 16:00
Date and Time [CDT, -6GMT]
Plume 1Plume 2
Plume 3
Fig. 7. The O4 AMF for 13 March 2006. Plume 1, Plume 2 andPlume 3 represent the time period in which the NO2 plumes passedthrough the Tenango del Aire research site on the morning of 13March 2006.
The O4 AMF did not significantly increase during Plume 2nor Plume 3 indicating the enhancements seen in the tropo-spheric DOAS NO2 VCD are due to an increase in pollutionrather than an increased optical path length caused by mul-tiple scattering by aerosols or clouds (Fig.7). Due to thefact that the O4 AMF does not detect an increased opticalpath length due to multiple scattering throughout the day, anAMF of the secant of the SZA was applied to the NO2 DSDSon this day for SZA≤60◦.
Using the MLH from the ceilometer data, the troposphericNO2 VCD can be used to estimate a mixing ratio,
NO2(ppbv) =NO2 VCD∗1e9
AZB
, (3)
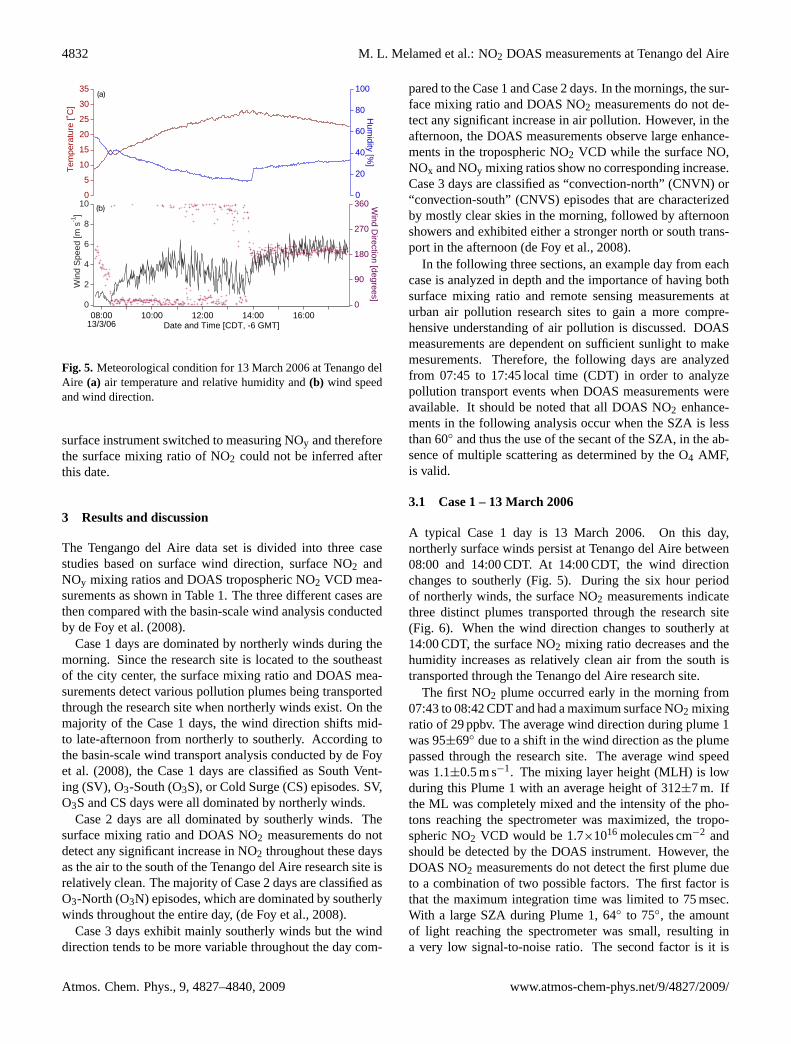
where NO2 VCD is the measured tropospheric NO2 VCD inmolecules cm−2, A is the average number of air moleculesin the ML in molecules cm−3 andZB is the MLH in cm. Ifthe ML is vertically homogeneous and the tropospheric NO2VCD enhancement is located within the well mixed ML, thenthe calculated DOAS NO2 mixing ratio should equal the sur-face NO2 mixing ratio. If the measured surface mixing ratioand the estimated DOAS mixing ratio are not equal, then ei-ther the ML is not vertically homogeneous and/or the NO2molecules measured by DOAS may not reside in the ML.Using Eq. (3), the DOAS tropospheric NO2 VCD is con-verted to a mixing ratio for Plumes 2 and 3. Figure8 showsthe measured surface and the calculated NO2 mixing ratios.The comparison between the measured and estimated NO2mixing ratios indicate that as Plume 2 passes through the re-search site, the ML becomes vertically homogeneous and bylate morning the ML is well mixed as seen in Plume 3. In
Atmos. Chem. Phys., 9, 4827–4840, 2009 www.atmos-chem-phys.net/9/4827/2009/
M. L. Melamed et al.: NO2 DOAS measurements at Tenango del Aire 4835
50
40
30
20
10
0
NO
2 [p
pbv]
08:0013/3/06
10:00 12:00 14:00 16:00Date and Time [CDT, -6 GMT]
Measured surface NO2 mixing ratio Estimated NO2 mixing ratio from
MLH and DOAS measurements
Plume 1Plume 2
Plume 3
Fig. 8. A comparison of measured surface NO2 mixing ratios (greenline) to estimated DOAS NO2 mixing ratios (red line) in ppbv forPlume 2 and Plume 3 on 13 March 2006.
addition, the agreement between the measured and estimatedNO2 mixing ratios support the conclusion that the NO2 VCDobserved by DOAS instrument resides within the ML.
3.2 Case 2 – 18 March 2006
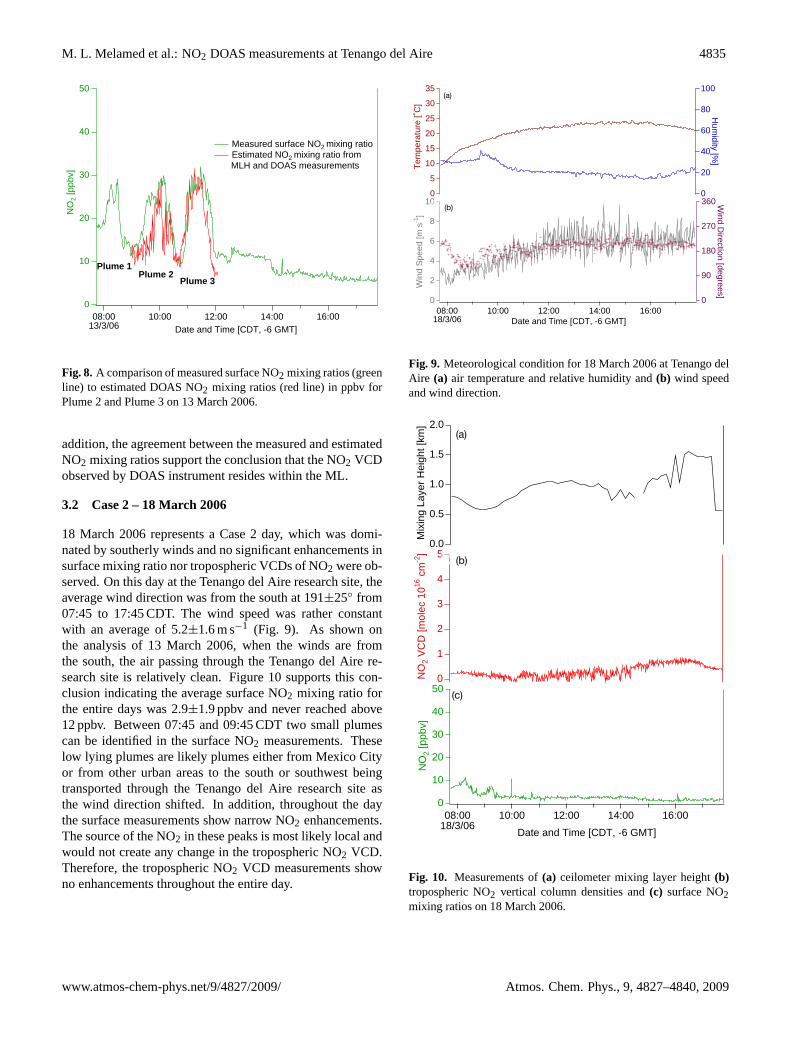
18 March 2006 represents a Case 2 day, which was domi-nated by southerly winds and no significant enhancements insurface mixing ratio nor tropospheric VCDs of NO2 were ob-served. On this day at the Tenango del Aire research site, theaverage wind direction was from the south at 191±25◦ from07:45 to 17:45 CDT. The wind speed was rather constantwith an average of 5.2±1.6 m s−1 (Fig. 9). As shown onthe analysis of 13 March 2006, when the winds are fromthe south, the air passing through the Tenango del Aire re-search site is relatively clean. Figure10 supports this con-clusion indicating the average surface NO2 mixing ratio forthe entire days was 2.9±1.9 ppbv and never reached above12 ppbv. Between 07:45 and 09:45 CDT two small plumescan be identified in the surface NO2 measurements. Theselow lying plumes are likely plumes either from Mexico Cityor from other urban areas to the south or southwest beingtransported through the Tenango del Aire research site asthe wind direction shifted. In addition, throughout the daythe surface measurements show narrow NO2 enhancements.The source of the NO2 in these peaks is most likely local andwould not create any change in the tropospheric NO2 VCD.Therefore, the tropospheric NO2 VCD measurements showno enhancements throughout the entire day.
10
8
6
4
2
0
Win
d S
peed
[m s
-1]
08:0018/3/06
10:00 12:00 14:00 16:00Date and Time [CDT, -6 GMT]
360
270
180
90
0
Wind D
irection [degrees]
35
30
25
20
15
10
5
0
Tem
pera
ture
[˚C
]
8:00 AM3/18/06
10:00 AM 12:00 PM 2:00 PM 4:00 PMDate and Time (Local, -6 GMT)
100
80
60
40
20
0
Hum
idity [%]
(a)
(b)
Fig. 9. Meteorological condition for 18 March 2006 at Tenango delAire (a) air temperature and relative humidity and(b) wind speedand wind direction.
5
4
3
2
1
0NO
2 V
CD
[mol
ec 1
016 c
m-2
]
8:00 AM3/18/06
10:00 AM 12:00 PM 2:00 PM 4:00 PM 6:00 PMDate and Time (Local, -6 GMT)
2.0
1.5
1.0
0.5
0.0
Mix
ing
Laye
r H
eigh
t [km
]
8:00 AM3/18/08
10:00 AM 12:00 PM 2:00 PM 4:00 PMDate and Time [6 CDT, -6 GMT]
50
40
30
20
10
0
NO
2 [p
pbv]
08:0018/3/06
10:00 12:00 14:00 16:00
Date and Time [CDT, -6 GMT]
(a)
(b)
(c)
Fig. 10. Measurements of(a) ceilometer mixing layer height(b)tropospheric NO2 vertical column densities and(c) surface NO2mixing ratios on 18 March 2006.
www.atmos-chem-phys.net/9/4827/2009/ Atmos. Chem. Phys., 9, 4827–4840, 2009

4836 M. L. Melamed et al.: NO2 DOAS measurements at Tenango del Aire
10
8
6
4
2
0
Win
d S
peed
[m s
-1]
08:0028/3/06
10:00 12:00 14:00 16:00Date and Time [CDT, -6 GMT]
360
270
180
90
0
Wind D
irection [degrees]
35
30
25
20
15
10
5
0
Tem
pera
ture
[˚C
]
100
80
60
40
20
0
Hum
idity [%]
(a)
(b)
Fig. 11. Meteorological condition for 28 March 2006 at Tenangodel Aire (a) air temperature and relative humidity and(b) windspeed and wind direction.
3.3 Case 3 – 28 March 2006
Case 3 days are classified byde Foy et al.(2008) as eitherCNVN or CNVS days, depending on the stronger componentof transport in the late afternoon. These days occurred afterhumid conditions from a cold surge on 23 March 2006 per-sisted, leading to afternoon convection and rainfall (de Foyet al., 2008). Based on the meteorological data and the sur-face NOy measurements, a Case 3 day appears to be verysimilar to a Case 2 day in that the dominant wind directionis from the south and no major enhancements were observedin the surface NOy measurements. The large difference isthat on all Case 3 days significant enhancements in the tropo-spheric NO2 VCD were observed in the afternoon that werenot detected by the surface mixing ratio measurements.
An example Case 3 day is 28 March 2006, a CNVSday. On this day the average wind direction was fromthe southwest at 212±43◦ and the average wind speed was3.2±1.3 m s−1 (Fig. 11). The surface NOy mixing ratio mea-surements show no significant plumes throughout the day ex-cept for a low layer passing through the research site in themorning that coincides with the change in the wind directionin the morning from northerly to southerly, which was alsoobserved on 13 and 18 March (Fig.12). Two enhancementsin the tropospheric NO2 VCD were detected in the afternoon,a large one from 12:50 to 14:50 CDT followed by a smallerone from 13:00 to 16:20 CDT (Fig.12). Neither of theseenhancements were detected in the surface NOy mixing ra-tio measurements. The following analysis will show that thetropospheric NO2 VCD enhancements were likely due to acombination of an increased optical path length from multi-ple scattering within a cloud and an increase in NO2 due tolightning (Erle et al., 1995; Pfleilsticker et al., 1999).
35
30
25
20
15
10
5
0
NO
Y [p
pbv]
08:0028/3/06
10:00 12:00 14:00 16:00Date and Time [CDT, -6 GMT]
10
8
6
4
2
0NO
2 V
CD
[mol
ec 1
016 c
m-2
]
2.0
1.5
1.0
0.5
0.0Mix
ing
Laye
r H
eigh
t [km
] (a)
(c)
(b)
Fig. 12. Measurements of(a) ceilometer mixing layer height(b)tropospheric NO2 vertical column densities and(c) surface NO2mixing ratios on 28 March 2006.
Figure13 shows the DOAS O4 AMF for 28 March 2006.A large enhancement in the O4 AMF and hence the opti-cal photon path length was detected starting at 12:50 CDTand continuing until 14:50 CDT. In addition to an increasedO4 AMF, the intensity of the photons reaching the spec-trometer decreases, indicating that the large enhancement inthe optical path length is due to multiple scattering withinthick clouds passing over the Tenango del Aire researchsite. The ceilometer data supports this conclusion detecting acloud present above the Tenango del Aire research site fromabout 13:00 to 14:00 CDT and another cloud from 14:00 to15:00 CDT. The cloud height between 13:00 and 14:00 CDTwas∼200 m above ground a.g.l. and the height of the pre-cipitating cloud between 14:00 and 15:00 CDT was∼500 ma.g.l. The algorithm for the retrieval of the the MLH fails dur-ing periods of rainfall. Therefore, the MLH curve in Fig.12is not indicated past 12:30 CDT due to the presence of raindroplets.
The increase in the O4 AMF during the first cloud wasfrom 1.0 to 4.5 air masses. This increase in the O4 AMFdue to multiple scattering within the cloud accounts for themajority of the increase in the tropospheric NO2 VCD, but
Atmos. Chem. Phys., 9, 4827–4840, 2009 www.atmos-chem-phys.net/9/4827/2009/

M. L. Melamed et al.: NO2 DOAS measurements at Tenango del Aire 4837
3000
2500
2000
1500
1000
500
0
Intensity [a.u.]
08:0028/3/06
10:00 12:00 14:00 16:00Date and Time [CDT, -6 GMT]
5
4
3
2
1
0
O4
Air
Mas
ses
Fig. 13. The O4 AMF (blue line) and intensity (red line) of pho-tons reaching the spectrometer in the wavelength region of the O4retrievals on 28 March 2006.
not all of it. A portion of the tropospheric NO2 VCDenhancement is therefore due to an actual increase in the col-umn density of NO2 within the cloud. This increase is likelydue to NO2 produced from lightning or a transport of NO2into the convective cloud from its surroundings, (Pickeringet al., 1992; Solomon et al., 1999; Langford et al., 2004; Erleet al., 1995; Pfleilsticker et al., 1999, and references therein).Figure14shows lightning was detected in the vicinity of theTenango del Aire research site on the afternoon of 28 Marchby the World Wide Lightning Location Network (WWLLN),suggesting that the NO2 within the cloud is likely due tolightning (www.wwlln.net). However, doing an analysis toestimate the amount of NO2 produced by lightning as doneby Langford et al.(2004) or Fraser et al.(2007) is not pos-sible due to the low resolution,∼20 km, of the WWLLN inMexico and the lack of radar measurements.
4 Conclusions
Surface and remote sensing instruments at the Tenango delAire research site during the MILAGRO 2006 campaign areused to analyze air pollution transport events to the southeastof Mexico City. Using surface NO, NOx and NOy mixingratios, tropospheric NO2 VCD and meteorological data, thedata set was divided into three air pollution transport casestudies. Case 1 days are characterized by northerly windsfor the majority of the day, which transports several plumesfrom the north through the Tenango del Aire research sitethat are detected by both DOAS and surface NO2 measure-ments. Case 2 days are characterized by southerly winds forthe entire day. The air to the south is relatively clean and nomajor enhancements in the DOAS nor the surface NO2 mea-surements are observed. Case 3 days appear to be very simi-
Fig. 14. The green arrows show the time and location of light-ning strikes detected by the World Wide Lightning Network(WWWLLN) near the Tenango del Aire research site on 28 March2006 (www.wwlln.net).
lar to Case 2 days in that the dominant wind direction wassoutherly and no major enhancements in the surface NOymeasurements were observed. However, during the after-noon on Case 3 days, the DOAS NO2 measurements detectlarge NO2 enhancements that are not observed in the surfaceNO, NOx and NOy measurements.
The combination of surface monitors and DOAS columndensity measurements, in conjunction with ceilometer andmeteorological data, give the possibility to differentiate be-tween localized and aged plumes, providing important infor-mation about the extent of mixing in the pollution layer anddetected NO2 enhancements above the MLH. The analysisof a Case 1 day, 13 March 2006, highlights the difference be-tween DOAS column measurements and surface mixing ra-tio measurements. DOAS column density measurements ob-serve the total number of molecules in the atmosphere whilein-situ instruments near the surface provide local mixing ra-tios. Therefore, as shown in the analysis of 13 March 2006,the NO2 mixing ratio within a variety of plumes can remainconstant even though the remotely measured NO2 columndensity may change.
The unique data set is also used to determine the verticalhomogeneity of the ML. If the MLH is well known, the tro-pospheric NO2 VCD measurements can also be used to es-timate a surface mixing ratio. The measured surface mixingratio should be equal to the estimated DOAS mixing ratio ifNO2 is well mixed within the ML and the NO2 molecules ob-served by the DOAS instrument reside within the ML. Thisconcept was tested using the tropospheric DOAS NO2 VCD
www.atmos-chem-phys.net/9/4827/2009/ Atmos. Chem. Phys., 9, 4827–4840, 2009
4838 M. L. Melamed et al.: NO2 DOAS measurements at Tenango del Aire
measurements on 13 March 2006. The analysis shows thatduring two of the plumes transported through the Tengangodel Aire research site, NO2 was well mixed within the ML.
In addition, the analysis of Case 3 days demonstrates theability of DOAS measurements to determine the influenceof pollution sources in the Mexico City basin that may re-side above the ML. On 28 March 2006, a large enhancementin the tropopsheric NO2 VCD is observed with no coincid-ing surface NOy enhancement. We show the observed NO2enhancement in the DOAS measurement is likely do to light-ning produced NO, which is rapidly oxidized to NO2. Thisexhibits the ability of DOAS measurements to provide im-portant information regarding the influence of natural and an-thropogenic pollution sources that may reside above the ML,such as NO2 produced from lightning and biomass burning,as well as SO2 emissions from volcanic activity, on pollutionevents within the Mexico City metropolitan area.
Acknowledgements.This material is based upon work supported bythe National Science Foundation International Research FellowshipProgram under Grant No. 0653087, the SEMARNAT-CONACYTGrant No. C01-0116 and the MCMA 2006 project.
The authors acknowledge R. T. Jardon and A. Torres for theoperation of the mobile laboratory at the Tenango del Aire researchsite.
Edited by: S. Madronich
References
de Foy, B., Varela, J. R., Molina, L. T., and Molina, M. J.: Rapidventilation of the Mexico City basin and regional fate of the ur-ban plume, Atmos. Chem. Phys., 6, 2321–2335, 2006,http://www.atmos-chem-phys.net/6/2321/2006/.
de Foy, B., Fast, J. D., Paech, S. J., Phillips, D., Walters, J. T.,Coulter, R. L., Martin, T. J., Pekour, M. S., Shaw, W. J., Kasten-deuch, P. P., Marley, N. A., Retama, A., and Molina, L. T.: Basin-scale wind transport during the MILAGRO field campaign andcomparison to climatology using cluster analysis, Atmos. Chem.Phys., 8, 1209–1224, 2008,http://www.atmos-chem-phys.net/8/1209/2008/.
DeCarlo, P. F., Dunlea, E. J., Kimmel, J. R., Aiken, A. C., Sueper,D., Crounse, J., Wennberg, P. O., Emmons, L., Shinozuka, Y.,Clarke, A., Zhou, J., Tomlinson, J., Collins, D. R., Knapp, D.,Weinheimer, A. J., Montzka, D. D., Campos, T., and Jimenez,J. L.: Fast airborne aerosol size and chemistry measurementsabove Mexico City and Central Mexico during the MILAGROcampaign, Atmos. Chem. Phys., 8, 4027–4048, 2008,http://www.atmos-chem-phys.net/8/4027/2008/.
Doran, J. C., Barnard, J. C., Arnott, W. P., Cary, R., Coulter, R.,Fast, J. D., Kassianov, E. I., Kleinman, L., Laulainen, N. S., Mar-tin, T., Paredes-Miranda, G., Pekour, M. S., Shaw, W. J., Smith,D. F., Springston, S. R., and Yu, X.-Y.: The T1-T2 study: evo-lution of aerosol properties downwind of Mexico City, Atmos.Chem. Phys., 7, 1585–1598, 2007,http://www.atmos-chem-phys.net/7/1585/2007/.
Emeis, S., Jahn, C., Munkel, C., Muensterer, C., and Schafer, K.:Multiple atmospheric layering and mixing-layer height in the Innvalley observed by remote sensing, Meteorol. Z., 16, 415–424,2007.
Erle, F., Pfeilsticker, K., and Platt, U.: On the influence of tropo-spheric clouds on zenith-scattered-light measurements of strato-spheric species, Geophys. Res. Lett., 22, 2725–2728, 1995.
Fraser, A., Goutail, F., McLinden, C. A., Melo, S. M. L., and Strong,K.: Lightning-produced NO2 observed by two ground-basedUV-visible spectrometers at Vanscoy, Saskatchewan in August2004, Atmos. Chem. Phys., 7, 1683–1692, 2007,http://www.atmos-chem-phys.net/7/1683/2007/.
Friess, U., Monks, P., Remedios, J., Rozanov, A., Sinreich,R., Wagner, T., and Platt, U.: MAX-DOAS O4 measure-ments: A new technique to derive information on atmosphericaerosols: 2. Modeling studies, J. Geophys. Res.-Atmos., 111,D14, doi:10.1029/2005JD006618, 2006.
Gil, M., Yela, M., Gunn, L. N., Richter, A., Alonso, I., Chipper-field, M. P., Cuevas, E., Iglesias, J., Navarro, M., Puentedura, O.,and Rodrıguez, S.: NO2 climatology in the northern subtropi-cal region: diurnal, seasonal and interannual variability, Atmos.Chem. Phys., 8, 1635–1648, 2008,http://www.atmos-chem-phys.net/8/1635/2008/.
Grainger, J. and Ring, J.: Anomalous Fraunhofer Line Profiles, Na-ture, 193, 762 pp., 1962.
Greenblatt, G. D., Orlando, J. J., Burkholder, J. B., and Ravis-hankara, A. R.: Absorption Measurements of Oxygen between330 nm and 1140 nm, J. Geophys. Res.-Atmos., 95, 18577–18582, 1990.
Heckel, A., Richter, A., Tarsu, T., Wittrock, F., Hak, C., Pundt, I.,Junkermann, W., and Burrows, J. P.: MAX-DOAS measurementsof formaldehyde in the Po-Valley, Atmos. Chem. Phys., 5, 909–918, 2005
Hennigan, C. J., Sullivan, A. P., Fountoukis, C. I., Nenes, A., Heco-bian, A., Vargas, O., Peltier, R. E., Case Hanks, A. T., Huey, L.G., Lefer, B. L., Russell, A. G., and Weber, R. J.: On the volatil-ity and production mechanisms of newly formed nitrate and wa-ter soluble organic aerosol in Mexico City, Atmos. Chem. Phys.,8, 3761–3768, 2008,http://www.atmos-chem-phys.net/8/3761/2008/.
Kurucz, R., Furenhild, I., Brault, J., and Testermann, L.: Solar Fluxfrom 296 nm to 1300 nm, National Solar Observation Atlas, Har-vard Univertisty, Cambridge, Massachusetts, 1984.
Ladstatter-Weißenmayer, A., Altmeyer, H., Bruns, M., Richter, A.,Rozanov, A., Rozanov, V., Wittrock, F., and Burrows, J. P.: Mea-surements of O3, NO2 and BrO during the INDOEX campaignusing ground based DOAS and GOME satellite data, Atmos.Chem. Phys., 7, 283–291, 2007,http://www.atmos-chem-phys.net/7/283/2007/.
Langford, A. O., Portmann, R. W., Daniel, J. S., Miller, H. L., andSolomon, S.: Spectroscopic measurements of NO2 in a Coloradothunderstorm: Determination of the mean production by cloud-to-ground lightning flashes, J. Geophys. Res.-Atmos., 109, D11,doi:10.1029/2003JD004158, 2004.
Levenberg, K.: A Method for the Solution of Certain Problems inLeast Squares, Q. Appl. Math., 2, 164–168, 1944.
Marquardt, D.: An Algorithm for Least-Squares Estimation of Non-linear Parameters, SIAM J. Appl. Math., 11, 431–441, 1963.
McClenny, W.: Recommended Methods for Ambient Air Monitor-
Atmos. Chem. Phys., 9, 4827–4840, 2009 www.atmos-chem-phys.net/9/4827/2009/
M. L. Melamed et al.: NO2 DOAS measurements at Tenango del Aire 4839
ing of NO, NO2, NOy and individual NOz species, Tech. rep.,US Environmental Protection Agency, Traingle Park, NC 27711,2000.
Melamed, M. L., Langford, A. O., Daniel, J. S., Portmann, R. W.,Miller, H. L., Eubank, C. S., Schofield, R., Holloway, J., andSolomon, S.: Sulfur dioxide emission flux measurements frompoint sources using airborne near ultraviolet spectroscopy dur-ing the New England Air Quality Study 2004, J. Geophys. Res.-Atmos., 113, D02305, doi:10.1029/2007jd008923, 2008.
Moffet, R. C., de Foy, B., Molina, L. T., Molina, M. J., and Prather,K. A.: Measurement of ambient aerosols in northern Mexico Cityby single particle mass spectrometry, Atmos. Chem. Phys., 8,4499–4516, 2008,http://www.atmos-chem-phys.net/8/4499/2008/.
Molina, L. T. and Molina, M. J. (Eds.): Air Quality in the Mex-ico Megacity: An Integrated Assesment, vol. 2 of Alliance forGlobal Sustainability Bookseries, Kluwer Academic Publishers,Dordrecht, 1–384, 2002.
Molina, L. T., Kolb, C. E., de Foy, B., Lamb, B. K., Brune, W.H., Jimenez, J. L., Ramos-Villegas, R., Sarmiento, J., Paramo-Figueroa, V. H., Cardenas, B., Gutierrez-Avedoy, V., and Molina,M. J.: Air quality in North America’s most populous city –overview of the MCMA-2003 campaign, Atmos. Chem. Phys.,7, 2447–2473, 2007,http://www.atmos-chem-phys.net/7/2447/2007/.
Munkel, C., Emeis, S., Muller, W., and Schafrer, K.: Aerosolconcentration measurements with a lidar ceilometer: Results ofa one year measuring campaign, Proc. SPIE, 5235, 486 pp.,doi:10.1117/12.511104, 2004.
Noxon, J.: Nitrogen Dioxide in Stratosphere and Troposphere Mea-sured by Ground-Based Absorption Spectroscopy, Science, 189,547–549, 1975.
Perliski, L. and Solomon, S.: On the Evaluation of Air Mass Factorsfor Atmospheric Near-Ultraviolet and Visible Absorption Spec-troscopy, J. Geophys. Res.-Atmos., 96, 10363–10374, 1993.
Perner, D. and Platt, U.: Detection of Nitrous-Acid in the Atmo-sphere by Differential Optical-Absorption, Geophys. Res. Lett.,6, 917–920, 1979.
Pfeilsticker, K., Bosch, H., Camy-Peyret, C., Fitzenberger, R.,Harder, H., and Osterkamp, H.: First atmospheric profile mea-surements of UV/visible O4 absorption band intensities: Impli-cations for the spectroscopy, and the formation enthalpy of theO2-O2 dimer, Geophys. Res. Lett., 28, 4595–4598, 2001.
Pfleilsticker, K., Arlander, D., Burrows, J., Erle, F., Gil, M., Goutail,F., Hermans, C., Lambert, J., Platt, U., Pommereau, J., Ritcher,A., Sarkissian, A., Van Roozendael, M., Wagner, T., and Winter-rath, T.: Intercomparison of the influence of tropospheric cloudson UV-Visible absorptions detected during the NDSC Intercom-parison Campaign at OHP in June 1996, Geophys. Res. Lett., 8,1169–1172, 1999.
Pickering, K., Thompson, A., Scala, J., Tao, W., Dickerson, R.,and Simpson, J.: Free Tropospheric Ozone Production FollowingEntrainment of Urban Plumes Into Deep Convection, J. Geophys.Res.-Atmos., 97, 17985–18000, 1992.
Platt, U. and Stutz, J.: Differential Optical Absorption Spec-troscopy; Principles and Application, Springer-Verlag GmbH,Heidelberg, Germany, 2008.
Platt, U., Marquard, L., Wagner, T., and Perner, D.: Correctionsfor zenith scattered light DOAS, Geophys. Res. Lett., 24, 1759–
1762, 1997.Querol, X., Pey, J., Minguillon, M. C., Perez, N., Alastuey, A.,
Viana, M., Moreno, T., Bernabe, R. M., Blanco, S., Cardenas, B.,Vega, E., Sosa, G., Escalona, S., Ruiz, H., and Artınano, B.: PMspeciation and sources in Mexico during the MILAGRO-2006Campaign, Atmos. Chem. Phys., 8, 111–128, 2008,http://www.atmos-chem-phys.net/8/111/2008/.
Raga, G. B., Kok, G. L., Baumgardner, D., Baez, A., and Rosas, I.:Evidence for volcanic influence on Mexico City aerosols, Geo-phys. Res. Lett., 26, 1149–1152, 1999.
Sanders, R. W.: Improved analysis of atmospheric absorption spec-tra by including the temperature dependence of NO2, J. Geophys.Res.-Atmos., 101, 20945–20952, 1996.
Schafer, K., Emeis, S., Rauch, C., Munkel, C., and Voigt, S.: De-termination of mixing-layer heights from ceilometer data, Proc.SPIE, 5571, 248 pp., doi:10.1117/12.565592, 2004.
Sinreich, R., Friess, U., Wagner, T., and Platt, U.: Multi axis differ-ential optical absorption spectroscopy (MAX-DOAS) of gas andaerosol distributions, Faraday Discuss., 130, 153–164, 2005.
Solomon, S., Schmeltekopf, A. L., and Sanders, R. W.: On the Inter-pretation of Zenith Sky Absorption-Measurements, J. Geophys.Res.-Atmos., 92, 8311–8319, 1987.
Solomon, S., Portmann, R. W., Sanders, R. W., Daniel, J. S., Mad-sen, W., Bartram, B., and Dutton, E. G.: On the role of nitrogendioxide in the absorption of solar radiation, J. Geophys. Res.-Atmos., 104, 12047–12058, 1999.
Stone, E. A., Snyder, D. C., Sheesley, R. J., Sullivan, A. P., Weber,R. J., and Schauer, J. J.: Source apportionment of fine organicaerosol in Mexico City during the MILAGRO experiment 2006,Atmos. Chem. Phys., 8, 1249–1259, 2008,http://www.atmos-chem-phys.net/8/1249/2008/.
Thornhill, D. A., de Foy, B., Herndon, S. C., Onasch, T. B., Wood,E. C., Zavala, M., Molina, L. T., Gaffney, J. S., Marley, N. A.,and Marr, L. C.: Spatial and temporal variability of particulatepolycyclic aromatic hydrocarbons in Mexico City, Atmos. Chem.Phys., 8, 3093–3105, 2008,http://www.atmos-chem-phys.net/8/3093/2008/.
Velasco, E., Marquez, C., Bueno, E., Bernabe, R. M., Sanchez, A.,Fentanes, O., W¨hrnschimmel, H., Cardenas, B., Kamilla, A.,Wakamatsu, S., and Molina, L. T.: Vertical distribution of ozoneand VOCs in the low boundary layer of Mexico City, Atmos.Chem. Phys., 8, 3061–3079, 2008,http://www.atmos-chem-phys.net/8/3061/2008/.
Voigt, S., Orphal, J., Bogumil, K., and Burrows, J. P.: The temper-ature dependence (203–293 K) of the absorption cross sectionsof O3 in the 230–850 nm region measured by Fourier-transformspectroscopy, J. Photoch. Photobio. A, 143, 1–9, 2001.
Voigt, S., Orphal, J., and Burrows, J. P.: The temperature andpressure dependence of the absorption cross-sections of NO2in the 250–800 nm region measured by Fourier-transform spec-troscopy, J. Photoch. Photobio. A, 149, 1–7, 2002.
Wagner, T., Erle, F., Marquard, L., Otten, C., Pfeilsticker, K., Senne,T., Stutz, J., and Platt, U.: Cloudy sky optical paths as derivedfrom differential optical absorption spectroscopy observations,J. Geophys. Res.-Atmos., 103, 25307–25321, 1998.
Wagner, T., von Friedeburg, C., Wenig, M., Otten, C., and Platt,U.: UV-visible observations of atmospheric O4 absorptions us-ing direct moonlight and zenith-scattered sunlight for clear-skyand cloudy sky conditions, J. Geophys. Res.-Atmos., 107, D20,
www.atmos-chem-phys.net/9/4827/2009/ Atmos. Chem. Phys., 9, 4827–4840, 2009

4840 M. L. Melamed et al.: NO2 DOAS measurements at Tenango del Aire
doi:10.1029/2001JD001026, 2002.Wagner, T., Dix, B., von Friedeburg, C., Friess, U., Sanghavi, S.,
Sinreich, R., and Platt, U.: MAX-DOAS O4 measurements: Anew technique to derive information on atmospheric aerosols– Principles and information content, J. Geophys. Res.-Atmos.,109, D22205, doi:10.1029/2004JD004904, 2004.
Wang, P., Richter, A., Bruns, M., Rozanov, V. V., Burrows, J. P.,Heue, K.-P., Wagner, T., Pundt, I., and Platt, U.: Measurementsof tropospheric NO2 with an airborne multi-axis DOAS instru-ment, Atmos. Chem. Phys., 5, 337–343, 2005,http://www.atmos-chem-phys.net/5/337/2005/.
Wang, P., Richter, A., Bruns, M., Burrows, J. P., Scheele, R., Junker-mann, W., Heue, K.-P., Wagner, T., Platt, U., and Pundt, I.:Airborne multi-axis DOAS measurements of tropospheric SO2plumes in the Po-valley, Italy, Atmos. Chem. Phys., 6, 329–338,2006,http://www.atmos-chem-phys.net/6/329/2006/.
Whiteman, C., Zhong, S., Bian, X., Fast, J., and Doran, J.:Boundary layer evolution and regional-scale diurnal circulationsover the Mexico Basin and Mexican plateau, J. Geophys. Res.-Atmos., 105, 10081–10102, 2000.
Wittrock, F., Oetjen, H., Richter, A., Fietkau, S., Medeke, T.,Rozanov, A., and Burrows, J. P.: MAX-DOAS measurementsof atmospheric trace gases in Ny-Alesund – Radiative transferstudies and their application, Atmos. Chem. Phys., 4, 955–966,2004,http://www.atmos-chem-phys.net/4/955/2004/.
Yokelson, R. J., Urbanski, S. P., Atlas, E. L., Toohey, D. W., Al-varado, E. C., Crounse, J. D., Wennberg, P. O., Fisher, M. E.,Wold, C. E., Campos, T. L., Adachi, K., Buseck, P. R., and Hao,W. M.: Emissions from forest fires near Mexico City, Atmos.Chem. Phys., 7, 5569–5584, 2007,http://www.atmos-chem-phys.net/7/5569/2007/.
Atmos. Chem. Phys., 9, 4827–4840, 2009 www.atmos-chem-phys.net/9/4827/2009/