detection of non-technical losses in power utilities—a
TRANSCRIPT
energies
Article
Detection of Non-Technical Losses in PowerUtilities—A Comprehensive Systematic Review
Muhammad Salman Saeed 1,2, Mohd Wazir Mustafa 1, Nawaf N. Hamadneh 3 ,Nawa A. Alshammari 3 , Usman Ullah Sheikh 1, Touqeer Ahmed Jumani 1,4 ,Saifulnizam Bin Abd Khalid 1 and Ilyas Khan 5,*
1 School of Electrical Engineering, Universiti Teknologi Malaysia, Johor Bahru 81310, Malaysia;[email protected] (M.S.S.); [email protected] (M.W.M.); [email protected] (U.U.S.);[email protected] (T.A.J.); [email protected] (S.B.A.K.)
2 Multan Electric Power Company (MEPCO), Multan 60000, Pakistan3 Department of Basic Sciences, College of Science and Theoretical Studies, Saudi Electronic University,
Riyadh 11673, Saudi Arabia; [email protected] (N.N.H.); [email protected] (N.A.A.)4 Department of Electrical Engineering, Mehran University of Engineering and Technology, SZAB Campus,
Khairpur Mirs 66020, Pakistan5 Faculty of Mathematics & Statistics, Ton Duc Thang University, Ho Chi Minh City 72915, Vietnam* Correspondence: [email protected]
Received: 29 June 2020; Accepted: 2 September 2020; Published: 11 September 2020�����������������
Abstract: Electricity theft and fraud in energy consumption are two of the major issues for powerdistribution companies (PDCs) for many years. PDCs around the world are trying differentmethodologies for detecting electricity theft. The traditional methods for non-technical losses(NTLs) detection such as onsite inspection and reward and penalty policy have lost their place inthe modern era because of their ineffective and time-consuming mechanism. With the advancement inthe field of Artificial Intelligence (AI), newer and efficient NTL detection methods have been proposedby different researchers working in the field of data mining and AI. The AI-based NTL detectionmethods are superior to the conventional methods in terms of accuracy, efficiency, time-consumption,precision, and labor required. The importance of such AI-based NTL detection methods can be judgedby looking at the growing trend toward the increasing number of research articles on this importantdevelopment. However, the authors felt the lack of a comprehensive study that can provide aone-stop source of information on these AI-based NTL methods and hence became the motivation forcarrying out this comprehensive review on this significant field of science. This article systematicallyreviews and classifies the methods explored for NTL detection in recent literature, along with theirbenefits and limitations. For accomplishing the mentioned objective, the opted research articles forthe review are classified based on algorithms used, features extracted, and metrics used for evaluation.Furthermore, a summary of different types of algorithms used for NTL detection is provided alongwith their applications in the studied field of research. Lastly, a comparison among the major NTLcategories, i.e., data-based, network-based, and hybrid methods, is provided on the basis of theirperformance, expenses, and response time. It is expected that this comprehensive study will providea one-stop source of information for all the new researchers and the experts working in the mentionedarea of research.
Keywords: non-technical loss; electricity theft; power utilities; Artificial Intelligence; machine learning
1. Introduction
Losses of electrical energy in the power grids at the transmission and distribution level include bothtechnical losses (TL) and non-technical losses (NTLs) [1]. The computation of TL is generally needed
Energies 2020, 13, 4727; doi:10.3390/en13184727 www.mdpi.com/journal/energies
Energies 2020, 13, 4727 2 of 25
for the correct estimation of NTL [2]. TLs are unavoidable as these occur in the equipment duringthe transmission and distribution (T&D) process, whereas NTLs are labeled as administrative lossesthat occur because of non-billed electricity, malfunction of the equipment, error in billings, low-qualityinfrastructure, and illegal usage of electricity [3]. The fraudulent behavior of energy customers isusually associated with electricity theft, regularized corruption, and organized crime [4]. Therefore,such sort of losses cannot be precisely estimated. Generally, the expenses linked with these NTLactivities are compensated by legitimate customers. The effect of the NTLs is worse in under-developedor developing countries; however, it can affect the developed economies too [5]. The researchers andexperts in power industries and academia have been trying different methods to address the mentionedproblem effectively. The traditional methods utilize the statistical analysis of data to understandthe significant indicators of fraudulent behavior, allowing the development of effective policies toaddress the issue. The installation of smart meters has appeared to be one of the meaningful andlatest solutions to address the NTL detection issue [6]. However, their deployment, operationalcost, and design involve massive amounts, which are not practical solutions for weak economies [7].Other methodologies include the utilization of machine learning algorithms for analyzing the datafrom meters and the evaluation of the consumption patterns that may imply fraudulent activities.Installations of specific equipment, sensors, and grid structures have also been suggested for efficientdetection of NTLs [8]. There is a great number of research articles available in the literature thathave used several methods to address the NTL detection issue. Hence a systematic compilation of allthe related articles is the need of the hour which consequently led the motivation behind carrying outcurrent systematic review study on this important topic.
Even though the author in [9] provided a useful review in the mentioned field, however, it onlyincludes the paper until the year 2013. Furthermore, the authors have only discussed the technicalaspects of the fraud detection system (FDS) while completely ignoring the features commonly usedand the metrics which are used to evaluate the performance of the classifiers. The authors in [10]provided a detailed review of the NTL detection articles published in a few important conferencesand journals, but the detailed description of the methodologies is lacking. Similarly, the author in [11]provides a comprehensive review in similar area of research. However, it covers articles up to 2017and lacks in critical review of the literature. Furthermore, contrary to current work, the authors inthe mentioned work did not adopt a systematic review approach. Therefore, the authors of the currentresearch work felt the necessity of a comprehensive review in the mentioned field of study as thereis a vast amount of research work with a variety of novel techniques left unattended which need tobe summarized in order to provide a single comprehensive source of information in modern NTLdetection methods. This article offers a comprehensive review of the literature on the subject of NTLsdetection, offering a helping hand to the utilities and researchers on the latest development in NTLdetection methods. The clear objectives of the paper are as follows:
i. Review for evaluating the available NTL detection solutions.ii. Review of the various features used for NTL detection.iii. Review of various metrics required for the evaluation of machine learning classifiers.iv. The detailed comparison of the current approaches with their advantages and limitations.
It is worthwhile to mention here that, for achieving the objectives of the current review, an analysisof 85 papers has been carried out. The selected articles are thoroughly reviewed and analyzed inthe current systematic literature review by using the guidelines of a general systematic literature review.
The article is set out as follows:In Section 2 the approach described in the article is discussed. Section 3 sets out a description of
NTL forms and sources. Section 4 provides a description of the outcomes of NTL detection approaches.The meanings are set out in Section 5.
Energies 2020, 13, 4727 3 of 25
2. Review Methodology
In this section, the methodology adopted for screening and selecting the articles for the currentreview is described in detail. The section is further divided into the following subsections based onthe articles’ selection process.
2.1. Search Terms
The articles that were published after the year 2000 are adopted, while the rest are discarded.A wide variety of keywords such as electricity theft, non-technical losses, fraud in energy consumption,and supervised machine learning-based electrical theft detection methods.
2.2. Inclusion and Exclusion Criteria
Criteria for exclusion and inclusion are used to select the research articles from the pool of studies.The inclusion criteria in this review consist of:
i. The study should identify, estimate, or predict any form of NTLs in the electric grid.ii. The study must present the analysis and determinants influencing the NTL.iii. The study should suggest a novel strategy for detecting NTLs.
The exclusion criteria are stated below:
i. Studies must not be published before the year 2000.ii. Duplicate articles with the same methodologies are discarded.iii. It should not be a feasibility study of a specific area.
After performing the inclusion and exclusion criteria, only 85 most relevant articles were selectedfor the review.
2.3. Prisma Flowchart
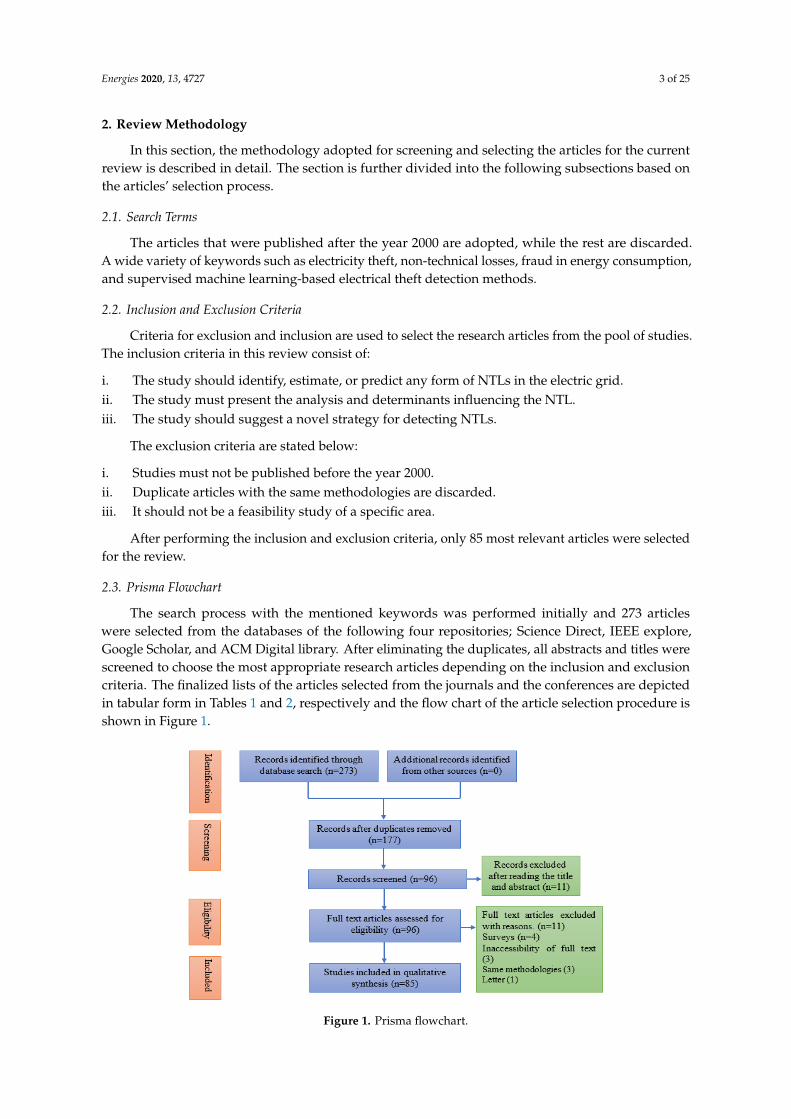
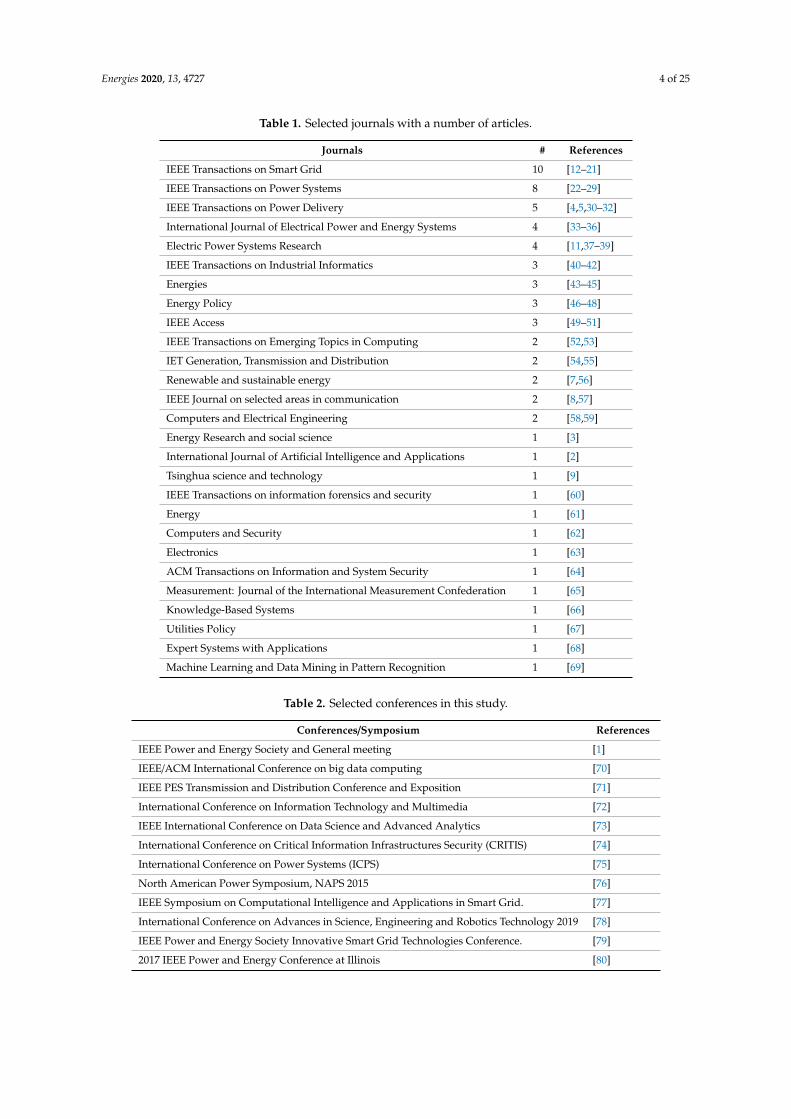
The search process with the mentioned keywords was performed initially and 273 articleswere selected from the databases of the following four repositories; Science Direct, IEEE explore,Google Scholar, and ACM Digital library. After eliminating the duplicates, all abstracts and titles werescreened to choose the most appropriate research articles depending on the inclusion and exclusioncriteria. The finalized lists of the articles selected from the journals and the conferences are depictedin tabular form in Tables 1 and 2, respectively and the flow chart of the article selection procedure isshown in Figure 1.
Energies 2020, 13, x FOR PEER REVIEW 3 of 27
2. Review Methodology
In this section, the methodology adopted for screening and selecting the articles for the current review is described in detail. The section is further divided into the following subsections based on the articles’ selection process.
2.1. Search Terms
The articles that were published after the year 2000 are adopted, while the rest are discarded. A wide variety of keywords such as electricity theft, non-technical losses, fraud in energy consumption, and supervised machine learning-based electrical theft detection methods.
2.2. Inclusion and Exclusion Criteria
Criteria for exclusion and inclusion are used to select the research articles from the pool of studies. The inclusion criteria in this review consist of:
i. The study should identify, estimate, or predict any form of NTLs in the electric grid. ii. The study must present the analysis and determinants influencing the NTL. iii. The study should suggest a novel strategy for detecting NTLs.
The exclusion criteria are stated below:
i. Studies must not be published before the year 2000. ii. Duplicate articles with the same methodologies are discarded. iii. It should not be a feasibility study of a specific area.
After performing the inclusion and exclusion criteria, only 85 most relevant articles were selected for the review.
2.3. Prisma Flowchart
The search process with the mentioned keywords was performed initially and 273 articles were selected from the databases of the following four repositories; Science Direct, IEEE explore, Google Scholar, and ACM Digital library. After eliminating the duplicates, all abstracts and titles were screened to choose the most appropriate research articles depending on the inclusion and exclusion criteria. The finalized lists of the articles selected from the journals and the conferences are depicted in tabular form in Tables 1 and 2, respectively and the flow chart of the article selection procedure is shown in Figure 1.
Figure 1. Prisma flowchart. Figure 1. Prisma flowchart.
Energies 2020, 13, 4727 4 of 25
Table 1. Selected journals with a number of articles.
Journals # References
IEEE Transactions on Smart Grid 10 [12–21]
IEEE Transactions on Power Systems 8 [22–29]
IEEE Transactions on Power Delivery 5 [4,5,30–32]
International Journal of Electrical Power and Energy Systems 4 [33–36]
Electric Power Systems Research 4 [11,37–39]
IEEE Transactions on Industrial Informatics 3 [40–42]
Energies 3 [43–45]
Energy Policy 3 [46–48]
IEEE Access 3 [49–51]
IEEE Transactions on Emerging Topics in Computing 2 [52,53]
IET Generation, Transmission and Distribution 2 [54,55]
Renewable and sustainable energy 2 [7,56]
IEEE Journal on selected areas in communication 2 [8,57]
Computers and Electrical Engineering 2 [58,59]
Energy Research and social science 1 [3]
International Journal of Artificial Intelligence and Applications 1 [2]
Tsinghua science and technology 1 [9]
IEEE Transactions on information forensics and security 1 [60]
Energy 1 [61]
Computers and Security 1 [62]
Electronics 1 [63]
ACM Transactions on Information and System Security 1 [64]
Measurement: Journal of the International Measurement Confederation 1 [65]
Knowledge-Based Systems 1 [66]
Utilities Policy 1 [67]
Expert Systems with Applications 1 [68]
Machine Learning and Data Mining in Pattern Recognition 1 [69]
Table 2. Selected conferences in this study.
Conferences/Symposium References
IEEE Power and Energy Society and General meeting [1]
IEEE/ACM International Conference on big data computing [70]
IEEE PES Transmission and Distribution Conference and Exposition [71]
International Conference on Information Technology and Multimedia [72]
IEEE International Conference on Data Science and Advanced Analytics [73]
International Conference on Critical Information Infrastructures Security (CRITIS) [74]
International Conference on Power Systems (ICPS) [75]
North American Power Symposium, NAPS 2015 [76]
IEEE Symposium on Computational Intelligence and Applications in Smart Grid. [77]
International Conference on Advances in Science, Engineering and Robotics Technology 2019 [78]
IEEE Power and Energy Society Innovative Smart Grid Technologies Conference. [79]
2017 IEEE Power and Energy Conference at Illinois [80]
Energies 2020, 13, 4727 5 of 25
3. Features Used in NTL Detection
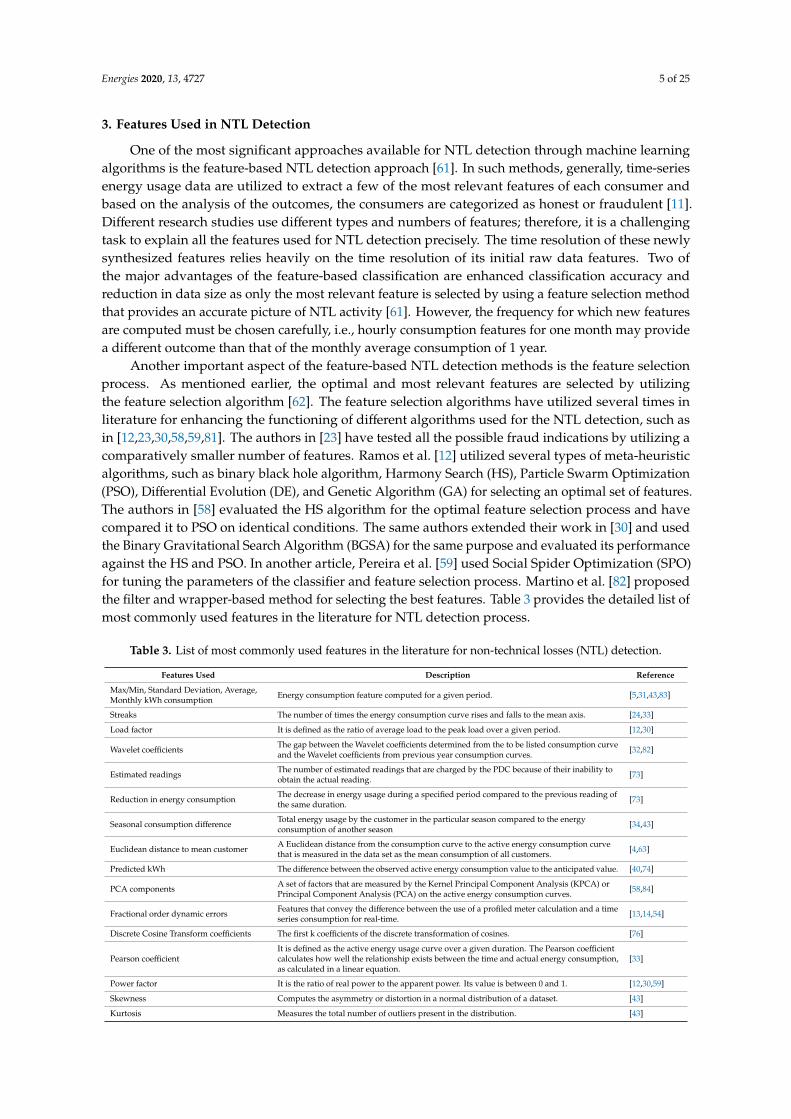
One of the most significant approaches available for NTL detection through machine learningalgorithms is the feature-based NTL detection approach [61]. In such methods, generally, time-seriesenergy usage data are utilized to extract a few of the most relevant features of each consumer andbased on the analysis of the outcomes, the consumers are categorized as honest or fraudulent [11].Different research studies use different types and numbers of features; therefore, it is a challengingtask to explain all the features used for NTL detection precisely. The time resolution of these newlysynthesized features relies heavily on the time resolution of its initial raw data features. Two ofthe major advantages of the feature-based classification are enhanced classification accuracy andreduction in data size as only the most relevant feature is selected by using a feature selection methodthat provides an accurate picture of NTL activity [61]. However, the frequency for which new featuresare computed must be chosen carefully, i.e., hourly consumption features for one month may providea different outcome than that of the monthly average consumption of 1 year.
Another important aspect of the feature-based NTL detection methods is the feature selectionprocess. As mentioned earlier, the optimal and most relevant features are selected by utilizingthe feature selection algorithm [62]. The feature selection algorithms have utilized several times inliterature for enhancing the functioning of different algorithms used for the NTL detection, such asin [12,23,30,58,59,81]. The authors in [23] have tested all the possible fraud indications by utilizing acomparatively smaller number of features. Ramos et al. [12] utilized several types of meta-heuristicalgorithms, such as binary black hole algorithm, Harmony Search (HS), Particle Swarm Optimization(PSO), Differential Evolution (DE), and Genetic Algorithm (GA) for selecting an optimal set of features.The authors in [58] evaluated the HS algorithm for the optimal feature selection process and havecompared it to PSO on identical conditions. The same authors extended their work in [30] and usedthe Binary Gravitational Search Algorithm (BGSA) for the same purpose and evaluated its performanceagainst the HS and PSO. In another article, Pereira et al. [59] used Social Spider Optimization (SPO)for tuning the parameters of the classifier and feature selection process. Martino et al. [82] proposedthe filter and wrapper-based method for selecting the best features. Table 3 provides the detailed list ofmost commonly used features in the literature for NTL detection process.
Table 3. List of most commonly used features in the literature for non-technical losses (NTL) detection.
Features Used Description Reference
Max/Min, Standard Deviation, Average,Monthly kWh consumption Energy consumption feature computed for a given period. [5,31,43,83]
Streaks The number of times the energy consumption curve rises and falls to the mean axis. [24,33]
Load factor It is defined as the ratio of average load to the peak load over a given period. [12,30]
Wavelet coefficients The gap between the Wavelet coefficients determined from the to be listed consumption curveand the Wavelet coefficients from previous year consumption curves. [32,82]
Estimated readings The number of estimated readings that are charged by the PDC because of their inability toobtain the actual reading. [73]
Reduction in energy consumption The decrease in energy usage during a specified period compared to the previous reading ofthe same duration. [73]
Seasonal consumption difference Total energy usage by the customer in the particular season compared to the energyconsumption of another season [34,43]
Euclidean distance to mean customer A Euclidean distance from the consumption curve to the active energy consumption curvethat is measured in the data set as the mean consumption of all customers. [4,63]
Predicted kWh The difference between the observed active energy consumption value to the anticipated value. [40,74]
PCA components A set of factors that are measured by the Kernel Principal Component Analysis (KPCA) orPrincipal Component Analysis (PCA) on the active energy consumption curves. [58,84]
Fractional order dynamic errors Features that convey the difference between the use of a profiled meter calculation and a timeseries consumption for real-time. [13,14,54]
Discrete Cosine Transform coefficients The first k coefficients of the discrete transformation of cosines. [76]
Pearson coefficientIt is defined as the active energy usage curve over a given duration. The Pearson coefficientcalculates how well the relationship exists between the time and actual energy consumption,as calculated in a linear equation.
[33]
Power factor It is the ratio of real power to the apparent power. Its value is between 0 and 1. [12,30,59]
Skewness Computes the asymmetry or distortion in a normal distribution of a dataset. [43]
Kurtosis Measures the total number of outliers present in the distribution. [43]

Energies 2020, 13, 4727 6 of 25
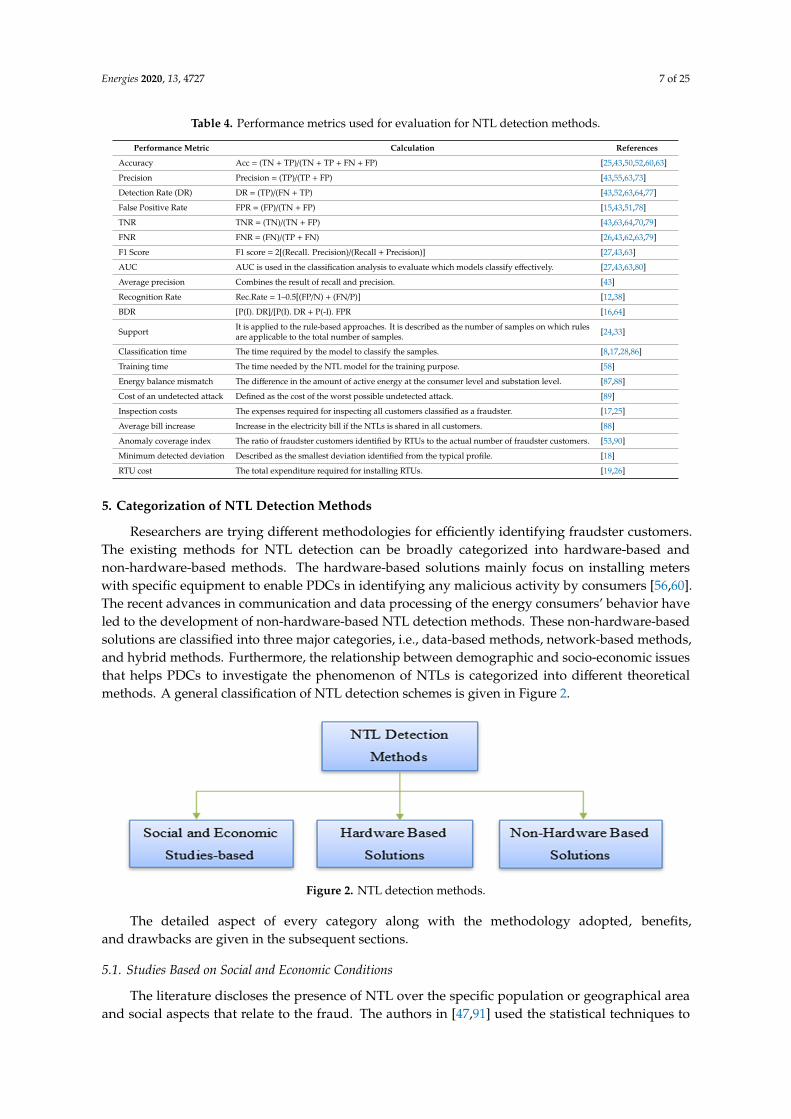
4. Performance Metrics Used for NTL Detection
Generally, the performance of a classifier is assessed by evaluating different performance indicators.One of such indicators is the confusion matrix. It presents the details for the accurate classificationas “True” and of the wrong classification as “False.” The True Positive (TP) in the confusion matrixsignifies the fraudster customers who are rightly identified as the fraudsters, whereas the False Positive(FP) portrays the honest customers that are incorrectly classified as fraudsters. Likewise, the TrueNegative (TN) reflects legitimate customers accurately identified as legitimate and False Negative (FN)signifies the fraudulent customers incorrectly classified as honest. The other well-known metrics thatare evaluated through the confusion matrix in the NTL classification problems are Accuracy (Acc),precision, Detection Rate (DR), True Negative Rate (TNR), False-Negative Rate (FNR), False PositiveRate (FPR), and F1 score.
The most commonly used matrix in the literature for NTL detection and in almost all the data-basedapproaches are Acc and DR. A better DR and good Acc reflect that the model operates well and has anexcellent classifying ability for the samples belonging to both classes. However, there is a need forother performance metrics in the scenarios where the dataset is imbalanced, i.e., when the numberof samples of negative class (honest) is significantly higher than the number of samples of positivetype (fraudulent). Detection Rate (DR), Recall, or True Positive Rate are the metrics that are popularlyused in such situations. These metrics describe the percentage of NTL samples classified accurately tothe total amount of NTL in the dataset. High DR values usually imply a well-operating NTL detectionmodel; however, to verify this, other metrics should also be considered. Therefore, both accuracyand DR must be considered when determining the efficiency of the model. FPR and precision arethe other two most utilized metrics for NTL detection. Precision or Positive Predictive Value (PPV) ofthe classifier can be calculated by dividing the total number of fraudster customers correctly identifiedto the overall customers classified as fraudsters. On the other hand, the high precision of the classifierindicates that the majority of the customers that are classified as fraudsters are truly fraudsters. It isworthwhile to mention here that recall and precision are antagonistic metrics. The improvement inthe performance of the one metric will result in the reduction of the performance of the other. Therefore,it is essential to achieve the perfect balance between both metrics. This balance between the two metricsis evaluated by computing the F1 score. A high value of the F1 score indicated that the model identifiesmaximum fraud cases with a very low rate of false positives. Nevertheless, his metric is occasionallyused in literature for NTL detection, yet it is still one of the most relevant and vital metrics whileworking with imbalanced data [73,85]. In fact, numerous research works have been conducted on thisissue as it offers a perfect solution for the correct assessment of the classifier [37]. Another importantperformance evaluation metric is FPR. It is expressed as the number of samples that are wronglymarked as positive (fraudster) to the overall negative (honest) samples. If the value for FPR is high forany classifier, it leads to the excessive meter inspections that result in a large operational cost burdenon PDCs. Therefore, the PDCs always want to achieve a low value of FPR because the threshold levelrelies on the overall size of the two classified categories, i.e., theft and healthy.
It is important to note that making decisions on the basis of any single metric may providemisleading information. For example, for a collection of 1000 customers with ten fraudulent and 990honest consumers, the FPR is calculated as 10 percent, which implies that 99 customers are fraudulent.This assumption will lead to 99 needless inspections of meters to identify 10 cases of fraud. The FPR of1% indicates that ten false reports would be generated in detecting ten genuine fraud cases. Therefore,the selection of the performance metrics is very tricky while addressing the class imbalance problemsas in NTL detection. In the scenarios of imbalanced datasets, the combination of different metricssuch as precision, accuracy, FPR, TNR, and DR should be utilized. The Bayesian Detection Rate(BDR) is another crucial metric, but that is not commonly used in literature for NTL detection [64].This parameter usually obtains small values in the intrusion and fraud detection domains becausethe fraud in these scenarios is not that frequent. Table 4 provides the list of most commonly usedperformance metrics for the evaluation of NTL detection models.
Energies 2020, 13, 4727 7 of 25
Table 4. Performance metrics used for evaluation for NTL detection methods.
Performance Metric Calculation References
Accuracy Acc = (TN + TP)/(TN + TP + FN + FP) [25,43,50,52,60,63]
Precision Precision = (TP)/(TP + FP) [43,55,63,73]
Detection Rate (DR) DR = (TP)/(FN + TP) [43,52,63,64,77]
False Positive Rate FPR = (FP)/(TN + FP) [15,43,51,78]
TNR TNR = (TN)/(TN + FP) [43,63,64,70,79]
FNR FNR = (FN)/(TP + FN) [26,43,62,63,79]
F1 Score F1 score = 2[(Recall. Precision)/(Recall + Precision)] [27,43,63]
AUC AUC is used in the classification analysis to evaluate which models classify effectively. [27,43,63,80]
Average precision Combines the result of recall and precision. [43]
Recognition Rate Rec.Rate = 1–0.5[(FP/N) + (FN/P)] [12,38]
BDR [P(I). DR]/[P(I). DR + P(-I). FPR [16,64]
Support It is applied to the rule-based approaches. It is described as the number of samples on which rulesare applicable to the total number of samples. [24,33]
Classification time The time required by the model to classify the samples. [8,17,28,86]
Training time The time needed by the NTL model for the training purpose. [58]
Energy balance mismatch The difference in the amount of active energy at the consumer level and substation level. [87,88]
Cost of an undetected attack Defined as the cost of the worst possible undetected attack. [89]
Inspection costs The expenses required for inspecting all customers classified as a fraudster. [17,25]
Average bill increase Increase in the electricity bill if the NTLs is shared in all customers. [88]
Anomaly coverage index The ratio of fraudster customers identified by RTUs to the actual number of fraudster customers. [53,90]
Minimum detected deviation Described as the smallest deviation identified from the typical profile. [18]
RTU cost The total expenditure required for installing RTUs. [19,26]
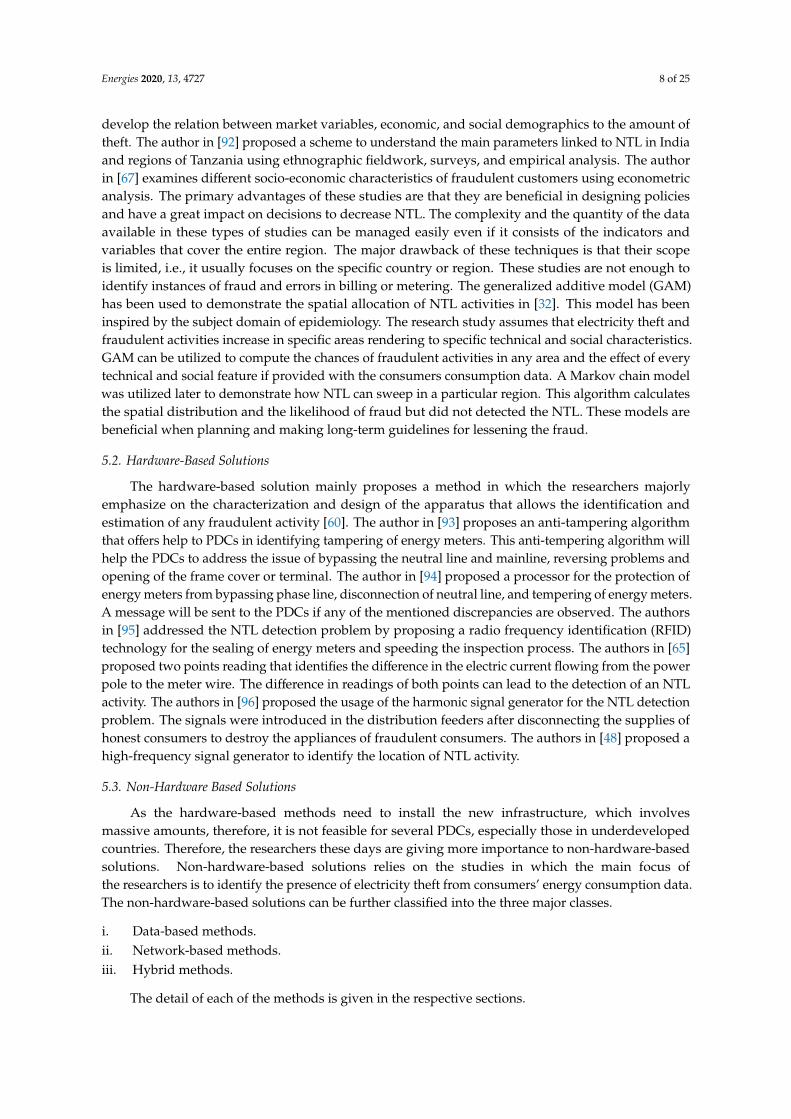
5. Categorization of NTL Detection Methods
Researchers are trying different methodologies for efficiently identifying fraudster customers.The existing methods for NTL detection can be broadly categorized into hardware-based andnon-hardware-based methods. The hardware-based solutions mainly focus on installing meterswith specific equipment to enable PDCs in identifying any malicious activity by consumers [56,60].The recent advances in communication and data processing of the energy consumers’ behavior haveled to the development of non-hardware-based NTL detection methods. These non-hardware-basedsolutions are classified into three major categories, i.e., data-based methods, network-based methods,and hybrid methods. Furthermore, the relationship between demographic and socio-economic issuesthat helps PDCs to investigate the phenomenon of NTLs is categorized into different theoreticalmethods. A general classification of NTL detection schemes is given in Figure 2.
Energies 2020, 13, x FOR PEER REVIEW 8 of 27
Inspection costs The expenses required for inspecting all customers classified as a fraudster. [17,25]
Average bill increase
Increase in the electricity bill if the NTLs is shared in all customers. [88]
Anomaly coverage index
The ratio of fraudster customers identified by RTUs to the actual number of fraudster customers. [53,90]
Minimum detected deviation
Described as the smallest deviation identified from the typical profile.
[18]
RTU cost The total expenditure required for installing RTUs. [19,26]
5. Categorization of NTL Detection Methods
Researchers are trying different methodologies for efficiently identifying fraudster customers. The existing methods for NTL detection can be broadly categorized into hardware-based and non-hardware-based methods. The hardware-based solutions mainly focus on installing meters with specific equipment to enable PDCs in identifying any malicious activity by consumers [56,60]. The recent advances in communication and data processing of the energy consumers’ behavior have led to the development of non-hardware-based NTL detection methods. These non-hardware-based solutions are classified into three major categories, i.e., data-based methods, network-based methods, and hybrid methods. Furthermore, the relationship between demographic and socio-economic issues that helps PDCs to investigate the phenomenon of NTLs is categorized into different theoretical methods. A general classification of NTL detection schemes is given in Figure 2.
Figure 2. NTL detection methods.
The detailed aspect of every category along with the methodology adopted, benefits, and drawbacks are given in the subsequent sections.
5.1. Studies Based on Social and Economic Conditions
The literature discloses the presence of NTL over the specific population or geographical area and social aspects that relate to the fraud. The authors in [91] and [47] used the statistical techniques to develop the relation between market variables, economic, and social demographics to the amount of theft. The author in [92] proposed a scheme to understand the main parameters linked to NTL in India and regions of Tanzania using ethnographic fieldwork, surveys, and empirical analysis. The author in [67] examines different socio-economic characteristics of fraudulent customers using econometric analysis. The primary advantages of these studies are that they are beneficial in designing policies and have a great impact on decisions to decrease NTL. The complexity and the quantity of the data available in these types of studies can be managed easily even if it consists of the indicators and variables that cover the entire region. The major drawback of these techniques is that their scope is limited, i.e., it usually focuses on the specific country or region. These studies are not enough to identify instances of fraud and errors in billing or metering. The generalized additive model (GAM) has been used to demonstrate the spatial allocation of NTL activities in [32]. This model has been inspired by the subject domain of epidemiology. The research study assumes that electricity
Figure 2. NTL detection methods.
The detailed aspect of every category along with the methodology adopted, benefits,and drawbacks are given in the subsequent sections.
5.1. Studies Based on Social and Economic Conditions
The literature discloses the presence of NTL over the specific population or geographical areaand social aspects that relate to the fraud. The authors in [47,91] used the statistical techniques to
Energies 2020, 13, 4727 8 of 25
develop the relation between market variables, economic, and social demographics to the amount oftheft. The author in [92] proposed a scheme to understand the main parameters linked to NTL in Indiaand regions of Tanzania using ethnographic fieldwork, surveys, and empirical analysis. The authorin [67] examines different socio-economic characteristics of fraudulent customers using econometricanalysis. The primary advantages of these studies are that they are beneficial in designing policiesand have a great impact on decisions to decrease NTL. The complexity and the quantity of the dataavailable in these types of studies can be managed easily even if it consists of the indicators andvariables that cover the entire region. The major drawback of these techniques is that their scopeis limited, i.e., it usually focuses on the specific country or region. These studies are not enough toidentify instances of fraud and errors in billing or metering. The generalized additive model (GAM)has been used to demonstrate the spatial allocation of NTL activities in [32]. This model has beeninspired by the subject domain of epidemiology. The research study assumes that electricity theft andfraudulent activities increase in specific areas rendering to specific technical and social characteristics.GAM can be utilized to compute the chances of fraudulent activities in any area and the effect of everytechnical and social feature if provided with the consumers consumption data. A Markov chain modelwas utilized later to demonstrate how NTL can sweep in a particular region. This algorithm calculatesthe spatial distribution and the likelihood of fraud but did not detected the NTL. These models arebeneficial when planning and making long-term guidelines for lessening the fraud.
5.2. Hardware-Based Solutions
The hardware-based solution mainly proposes a method in which the researchers majorlyemphasize on the characterization and design of the apparatus that allows the identification andestimation of any fraudulent activity [60]. The author in [93] proposes an anti-tampering algorithmthat offers help to PDCs in identifying tampering of energy meters. This anti-tempering algorithm willhelp the PDCs to address the issue of bypassing the neutral line and mainline, reversing problems andopening of the frame cover or terminal. The author in [94] proposed a processor for the protection ofenergy meters from bypassing phase line, disconnection of neutral line, and tempering of energy meters.A message will be sent to the PDCs if any of the mentioned discrepancies are observed. The authorsin [95] addressed the NTL detection problem by proposing a radio frequency identification (RFID)technology for the sealing of energy meters and speeding the inspection process. The authors in [65]proposed two points reading that identifies the difference in the electric current flowing from the powerpole to the meter wire. The difference in readings of both points can lead to the detection of an NTLactivity. The authors in [96] proposed the usage of the harmonic signal generator for the NTL detectionproblem. The signals were introduced in the distribution feeders after disconnecting the supplies ofhonest consumers to destroy the appliances of fraudulent consumers. The authors in [48] proposed ahigh-frequency signal generator to identify the location of NTL activity.
5.3. Non-Hardware Based Solutions
As the hardware-based methods need to install the new infrastructure, which involvesmassive amounts, therefore, it is not feasible for several PDCs, especially those in underdevelopedcountries. Therefore, the researchers these days are giving more importance to non-hardware-basedsolutions. Non-hardware-based solutions relies on the studies in which the main focus ofthe researchers is to identify the presence of electricity theft from consumers’ energy consumption data.The non-hardware-based solutions can be further classified into the three major classes.
i. Data-based methods.ii. Network-based methods.iii. Hybrid methods.
The detail of each of the methods is given in the respective sections.
Energies 2020, 13, 4727 9 of 25
5.3.1. Data-Based Methods
Data-based methods are merely based on machine learning techniques and data analytics.The main difference between data-based and network-based methods is the utilization of the networkin the electricity grid [11]. The data-based methods are further subdivided into the supervised methodsand unsupervised methods, each of which is discussed in the subsequent subsections.
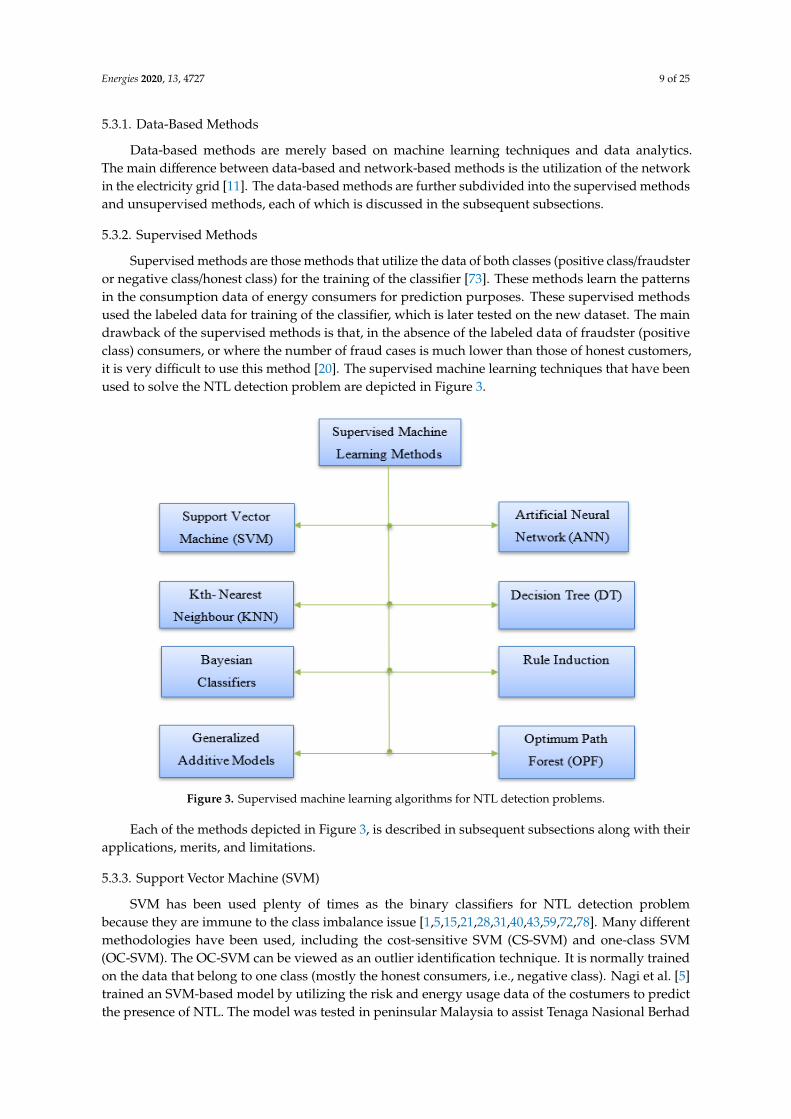
5.3.2. Supervised Methods
Supervised methods are those methods that utilize the data of both classes (positive class/fraudsteror negative class/honest class) for the training of the classifier [73]. These methods learn the patternsin the consumption data of energy consumers for prediction purposes. These supervised methodsused the labeled data for training of the classifier, which is later tested on the new dataset. The maindrawback of the supervised methods is that, in the absence of the labeled data of fraudster (positiveclass) consumers, or where the number of fraud cases is much lower than those of honest customers,it is very difficult to use this method [20]. The supervised machine learning techniques that have beenused to solve the NTL detection problem are depicted in Figure 3.
Energies 2020, 13, x FOR PEER REVIEW 10 of 27
new dataset. The main drawback of the supervised methods is that, in the absence of the labeled data of fraudster (positive class) consumers, or where the number of fraud cases is much lower than those of honest customers, it is very difficult to use this method [20]. The supervised machine learning techniques that have been used to solve the NTL detection problem are depicted in Figure 3.
Figure 3. Supervised machine learning algorithms for NTL detection problems.
Each of the methods depicted in Figure 3, is described in subsequent subsections along with their applications, merits, and limitations.
5.3.3. Support Vector Machine (SVM)
SVM has been used plenty of times as the binary classifiers for NTL detection problem because they are immune to the class imbalance issue [1,5,15,21,28,31,40,43,59,72,78]. Many different methodologies have been used, including the cost-sensitive SVM (CS-SVM) and one-class SVM (OC-SVM). The OC-SVM can be viewed as an outlier identification technique. It is normally trained on the data that belong to one class (mostly the honest consumers, i.e., negative class). Nagi et al. [5] trained an SVM-based model by utilizing the risk and energy usage data of the costumers to predict the presence of NTL. The model was tested in peninsular Malaysia to assist Tenaga Nasional Berhad (TNB) sdn.bhd. The SVM-based model increased the detection rate from 3 to 60%. The CS-SVM can give distinct weights to different classes, for example, one class can allot a higher cost to the wrong classifications of the class with a smaller number of labels that ultimately results in better performance, i.e., low FPR and high BDR. The study of recent literature indicates that SVMs can be used for NTL detection even though it is time-taking and problematic to tune the parameters of SVM. The other most frequently used classes of SVM are the radial basis function kernel (RBF) SVM (SVM-RBF) and linear kernel SVM (Linear-SVM). The difference between SVM-RBF and linear- SVM is that in SVM-RBF, the cost and gamma are required to be tuned, whereas only cost parameter must be tuned in case of Linear-SVM. To increase the classification performance, SVMs are sometimes combined with other well-known classifiers like fuzzy inference system (FIS), DT, or artificial neural networks (ANN).
5.3.4. Artificial Neural Networks (ANN)
Figure 3. Supervised machine learning algorithms for NTL detection problems.
Each of the methods depicted in Figure 3, is described in subsequent subsections along with theirapplications, merits, and limitations.
5.3.3. Support Vector Machine (SVM)
SVM has been used plenty of times as the binary classifiers for NTL detection problembecause they are immune to the class imbalance issue [1,5,15,21,28,31,40,43,59,72,78]. Many differentmethodologies have been used, including the cost-sensitive SVM (CS-SVM) and one-class SVM(OC-SVM). The OC-SVM can be viewed as an outlier identification technique. It is normally trainedon the data that belong to one class (mostly the honest consumers, i.e., negative class). Nagi et al. [5]trained an SVM-based model by utilizing the risk and energy usage data of the costumers to predictthe presence of NTL. The model was tested in peninsular Malaysia to assist Tenaga Nasional Berhad
Energies 2020, 13, 4727 10 of 25
(TNB) sdn.bhd. The SVM-based model increased the detection rate from 3 to 60%. The CS-SVM cangive distinct weights to different classes, for example, one class can allot a higher cost to the wrongclassifications of the class with a smaller number of labels that ultimately results in better performance,i.e., low FPR and high BDR. The study of recent literature indicates that SVMs can be used for NTLdetection even though it is time-taking and problematic to tune the parameters of SVM. The other mostfrequently used classes of SVM are the radial basis function kernel (RBF) SVM (SVM-RBF) and linearkernel SVM (Linear-SVM). The difference between SVM-RBF and linear- SVM is that in SVM-RBF,the cost and gamma are required to be tuned, whereas only cost parameter must be tuned in case ofLinear-SVM. To increase the classification performance, SVMs are sometimes combined with otherwell-known classifiers like fuzzy inference system (FIS), DT, or artificial neural networks (ANN).
5.3.4. Artificial Neural Networks (ANN)
ANN are multilayered machine learning algorithms. It has an interrelated set of artificial neuronsthat are used for addressing prediction and complex problems [97]. Multi-layer perceptron (MLP) isthe most used version of ANN that is used as a binary classifier for NTL detection problems alongwith back propagation MLP (BP-BLP) [1,2,29,41,43,98]. Furthermore, ANN models have also beenutilized for time series forecasting of energy consumption. The difference between the measuredvalue and the predicted value is used for detecting fraud in energy consumption. The selection ofdifferent thresholds and the likelihood that fraudulent consumers’ energy consumption data will affectthe output of ANN must be considered. However, in both cases (forecast and binary classification),the training of the model must be done after choosing the structure of the network. Even thoughin most of the recent works, the selection of the optimal network structure is important, yet few ofthe methodologies select the number of hidden layers and a corresponding number of neurons bythe trial and error method. The cross-validation process is used in this scenario to ensure that the modelhas good generalization ability. Extreme learning machine (ELM) has also been proposed apart fromthe BP-MLP for forecast and binary classification. ELMs have single or multiple layers of hiddennodes. Hence the parameter tuning of the hidden layers is not needed. In most of the cases, the outputweights of the hidden layers are generally computed in a single step. Therefore, ELM models can betrained much faster without having any decline in their performance.
5.3.5. Optimum Path Forest
Optimum path forest (OPF) is also a supervised machine learning graph-based algorithm thatis usually used for classification applications. The classification process in OPF is comprised of twosteps, i.e., i. Fit and ii. Predict. Compared to the previously used machine learning algorithms whichattempt to obtain the optimal hyperplane for the separation of the two classes. The OPF classifierfunctions by splitting the graph into optimum path trees (two or more than two trees), each onecharacterizing a separate class. Every tree is connected to the prototype and the assembly of thesetrees makes the OPF classifier. In the prediction process, the testing samples are assigned the labels ofthe prototype with the help of cost function. The main advantage of OPF classifier is that it can handlethe overlapped class issue with less training time. Therefore, making it feasible for online training ofNTL detection [12,23,30,38,58]. These features are critical in the scenarios where the testing samplesmay differ significantly from the training samples.
5.3.6. Rule Induction Methods
A set of rules can be utilized for NTL detection comes in the category of rule induction methods.Expert knowledge and statistical analysis are mostly used in defining the rules for this purpose. In mostof the cases, such knowledge is not enough. Therefore, the rule induction methods are utilized forextracting the rules hidden in the data (customarily labelled). The major aim of the process is toforecast the sample belonging to a specific class using the values of other features. FIS has been usedfor the NTL detection process to explain the reasoning procedure of the experts [24,31,33,35,44,66,68].
Energies 2020, 13, 4727 11 of 25
To improve the classification performance of the rule-based systems, they are sometimes joined withwell-known classifiers like DT, Bayesian networks and SVM, etc.
5.3.7. Decision Tree
DTs have been used several times for addressing the NTL detection problem [25,33,40,43,62,63,99–101].A DT is a support tool that uses a flowchart-like graph or model to form a set of rules that helps inclassifying new samples. DT algorithms are regarded as one of the highly promising AI algorithms insupervised machine learning methods. DT maps the non-linear relations much better than linear models.These are used for performing both classification and regression problems. The rule formed by DTshelps in better understanding the characteristics of the NTL. Ensembles of DTs are formed by combiningthe practices of DTs with other specific rules, as defined by the experts [63]. DTs are highly dependent onthe training of the dataset and are sensitive to the class imbalance issue. A number of different DTs suchas QUEST, CART, C5.0, and EBT have been used for solving NTL detection problems in the literature.The key benefit of using DTs includes their easy interpretation and transparency to the operatives.
5.3.8. Kth Nearest Neighbor
Kth nearest neighbor (K-NN) is one of the simplest supervised machine learning algorithms usedfor both classification and regression. K-NN classifies the new data by comparing it with the alreadypresent data using the similarity measure. K-NN is usually used in the literature for NTL detection as abaseline for comparison with other machine learning algorithms [20,55,63,102]. The class membershipis the output in the k-NN classification. The plurality vote of the neighbors is used for classifyingthe object which is just allocated to the specific class if the value of k = 1 of its nearest neighbor.
5.3.9. Bayesian Classifiers
The Bayesian classifiers are the probabilistic classifiers in which the responsibility of the classis to predict the values of the features. The Bayesian classifier needs the previous information ofNTL probability that can be obtained from the general statistics [27,33,62,64,103]. The working of thisclassifier is based on the fact that if the class of the sample is known, it can be utilized to calculatethe values of the different features. It accomplishes the mentioned objective by using the non-intrusiveload monitoring (NILM) procedure to learn the pattern of every device being used by the customer.In the scenario of the new sample, NILM is performed repeatedly and the chance of fraud is estimatedat the end of the process. These methods need a huge amount of previous information that significantlyaffects the output of the classifier. Bayesian networks in Bayesian classifiers utilize a set of variablesthat graphically signify the class probability. The main advantage of Bayesian networks is that theycan be easily understood by humans and hence provide a human-friendly interface.
5.3.10. Unsupervised Methods
All those methods that do not require any labels (positive/negative) for the training of the classifiersare known as unsupervised methods [38]. These methods do not need supervision and hence the modelwork at its own to learn the information hidden in the provided data. As compared to the supervisedmachine learning algorithms, unsupervised methods can perform more complicated processing tasks.The following types of unsupervised machine learning algorithms have been used for the NTLdetection problem.
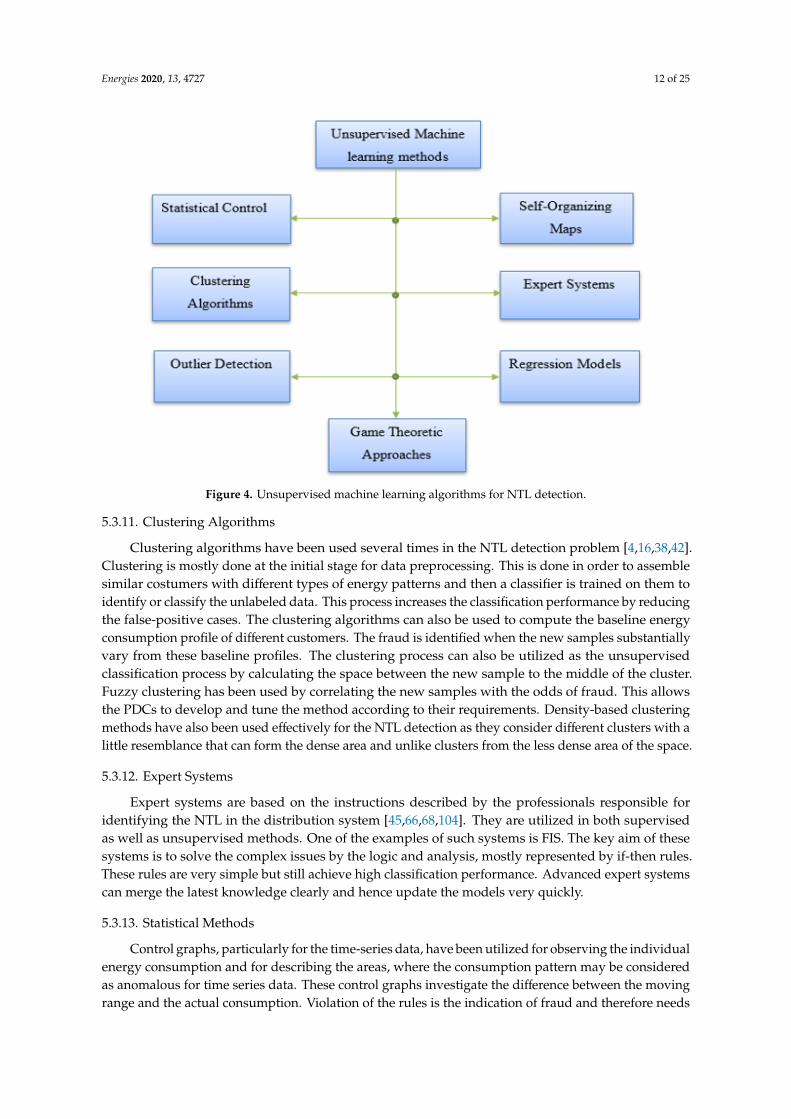
Each of the mentioned algorithms in Figure 4 is discussed in the subsequent subsections.
Energies 2020, 13, 4727 12 of 25Energies 2020, 13, x FOR PEER REVIEW 13 of 27
Figure 4. Unsupervised machine learning algorithms for NTL detection.
5.3.11. Clustering Algorithms
Clustering algorithms have been used several times in the NTL detection problem [4,16,38,42]. Clustering is mostly done at the initial stage for data preprocessing. This is done in order to assemble similar costumers with different types of energy patterns and then a classifier is trained on them to identify or classify the unlabeled data. This process increases the classification performance by reducing the false-positive cases. The clustering algorithms can also be used to compute the baseline energy consumption profile of different customers. The fraud is identified when the new samples substantially vary from these baseline profiles. The clustering process can also be utilized as the unsupervised classification process by calculating the space between the new sample to the middle of the cluster. Fuzzy clustering has been used by correlating the new samples with the odds of fraud. This allows the PDCs to develop and tune the method according to their requirements. Density-based clustering methods have also been used effectively for the NTL detection as they consider different clusters with a little resemblance that can form the dense area and unlike clusters from the less dense area of the space.
5.3.12. Expert Systems
Expert systems are based on the instructions described by the professionals responsible for identifying the NTL in the distribution system [45,66,68,104]. They are utilized in both supervised as well as unsupervised methods. One of the examples of such systems is FIS. The key aim of these systems is to solve the complex issues by the logic and analysis, mostly represented by if-then rules. These rules are very simple but still achieve high classification performance. Advanced expert systems can merge the latest knowledge clearly and hence update the models very quickly.
5.3.13. Statistical Methods
Control graphs, particularly for the time-series data, have been utilized for observing the individual energy consumption and for describing the areas, where the consumption pattern may be considered as anomalous for time series data. These control graphs investigate the difference between the moving range and the actual consumption. Violation of the rules is the indication of fraud and
Figure 4. Unsupervised machine learning algorithms for NTL detection.
5.3.11. Clustering Algorithms
Clustering algorithms have been used several times in the NTL detection problem [4,16,38,42].Clustering is mostly done at the initial stage for data preprocessing. This is done in order to assemblesimilar costumers with different types of energy patterns and then a classifier is trained on them toidentify or classify the unlabeled data. This process increases the classification performance by reducingthe false-positive cases. The clustering algorithms can also be used to compute the baseline energyconsumption profile of different customers. The fraud is identified when the new samples substantiallyvary from these baseline profiles. The clustering process can also be utilized as the unsupervisedclassification process by calculating the space between the new sample to the middle of the cluster.Fuzzy clustering has been used by correlating the new samples with the odds of fraud. This allowsthe PDCs to develop and tune the method according to their requirements. Density-based clusteringmethods have also been used effectively for the NTL detection as they consider different clusters with alittle resemblance that can form the dense area and unlike clusters from the less dense area of the space.
5.3.12. Expert Systems
Expert systems are based on the instructions described by the professionals responsible foridentifying the NTL in the distribution system [45,66,68,104]. They are utilized in both supervisedas well as unsupervised methods. One of the examples of such systems is FIS. The key aim of thesesystems is to solve the complex issues by the logic and analysis, mostly represented by if-then rules.These rules are very simple but still achieve high classification performance. Advanced expert systemscan merge the latest knowledge clearly and hence update the models very quickly.
5.3.13. Statistical Methods
Control graphs, particularly for the time-series data, have been utilized for observing the individualenergy consumption and for describing the areas, where the consumption pattern may be consideredas anomalous for time series data. These control graphs investigate the difference between the movingrange and the actual consumption. Violation of the rules is the indication of fraud and therefore needs
Energies 2020, 13, 4727 13 of 25
immediate inspection [32,66,69,75]. Non-parametric cumulative sum control chart and exponentiallyweighted moving average (EWMA) control chart are few other types of charts that have been exploredfor NTL detection. These types of maps are famous in industries for the rapid identification of NTLas they provide online information and have the ability of visual examination of data. Such quickdetections commonly result in a large number of FPs, therefore, reducing the overall outcome. One ofthe major limitations of these types of methods is that it fails to identify the fraudulent activity ifthe consumer is involved in the fraud from its very initial monitoring phase since their very workingmechanism is based on detecting the change in consumption patterns. Another limitation of thismethod is that it interprets the different types of energy consumption changes as the fraud which isnot the case in real scenario and hence results in a lot of unnecessary FPs.
5.3.14. Regression Methods
Auto-regressive moving average (ARMA) and auto-regressive integrated moving average (ARIMA)are the regression models that are applied for estimating time series models. The methodology ofregression methods depends on the difference between the expected and the calculated value ifthe regression model has been trained with one class of consumers’ consumption data. The chances offraud will be higher if the difference between the forecasted and calculated values is higher [36,105].ARIMA and ARMA are two well-known regression models for solving the time series forecastingproblems. ARIMA-based models are superior in performance for domestic customers.
5.3.15. Outlier Detection
NTL detection is generally carried out by borrowing many concepts from outlier detectionmethods [38,42,51,106–108]. For example, consider a data set of honest customers in MultivariateGaussian Distribution (MGD) where every cluster of samples is demonstrated as the Gaussiandistribution [38]. The probability of the new sample belonging to both of the distributions isdetermined. The likelihood of the samples is evaluated with the threshold value to decide whetherthe new sample belongs to the anomaly or not. The difficult task in these scenarios is to decide the totalnumber of clusters and the boundaries of the gaussian distribution. K-means clustering and OPF areusually utilized for the outlier detection purpose. The local outlier factor (LOF) has also been usedin [109]. It is the density-based indication of the fraud. LOF is used to compute the local density ofthe sample and then makes its comparison to the average of the density of the nearest neighbor’ssample. All samples will be considered as anomalies if the local density is considerably less thanits neighbors. In this context, it is important to identify the true indication of fraud as a very highLOF is not necessarily an indicator of the fraud. Therefore, new rules should be made and testedbefore marking a sample as an anomaly. Kaulback-Lieber-Divergence (KLD) has been used in [110]for NTL detection purposes. It is computed by calculating the distance among the two probabilitydistributions. KLD is utilized for the comparison of the distribution of classes with the standardattained from the historical distribution. KLD is utilized for identifying the smart attacks which concealthe fraudulent consumption usage by adjusting it into the authentic ARIMA models. One obviousbenefit of these methodologies is that they can still identify the fraudulent activity even if they werenot previously present in the training set.
5.3.16. Network-Based Methods
Network-based methods rely on the information attained from the smart meters and calculation ofdifferent physical parameters of the electrical network for efficiently identifying the NTL activity [11,111].Several studies have used the power flow process to calculate the total volume of NTL activity. The areawhere the fraudulent activity occurs is identified by calculating the energy stability and other parameterswith the help of the central observer meter. In contrast, other studies have used distribution stateestimation and false data detection for the problems mentioned above. Network-based methodsusually are more accurate; however, these methods are not easy to implement. Dedicated sensors are
Energies 2020, 13, 4727 14 of 25
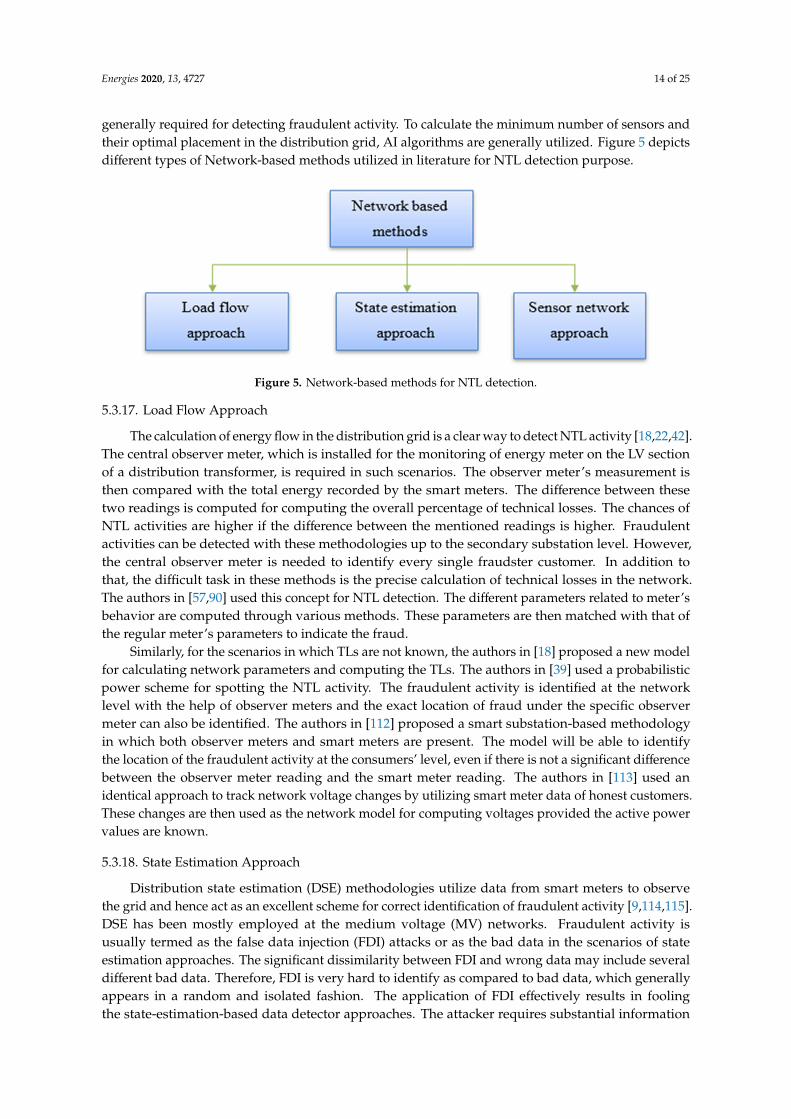
generally required for detecting fraudulent activity. To calculate the minimum number of sensors andtheir optimal placement in the distribution grid, AI algorithms are generally utilized. Figure 5 depictsdifferent types of Network-based methods utilized in literature for NTL detection purpose.
Energies 2020, 13, x FOR PEER REVIEW 15 of 27
based methods usually are more accurate; however, these methods are not easy to implement. Dedicated sensors are generally required for detecting fraudulent activity. To calculate the minimum number of sensors and their optimal placement in the distribution grid, AI algorithms are generally utilized. Figure 5 depicts different types of Network-based methods utilized in literature for NTL detection purpose.
Figure 5. Network-based methods for NTL detection.
5.3.17. Load Flow Approach
The calculation of energy flow in the distribution grid is a clear way to detect NTL activity [18,22,42]. The central observer meter, which is installed for the monitoring of energy meter on the LV section of a distribution transformer, is required in such scenarios. The observer meter’s measurement is then compared with the total energy recorded by the smart meters. The difference between these two readings is computed for computing the overall percentage of technical losses. The chances of NTL activities are higher if the difference between the mentioned readings is higher. Fraudulent activities can be detected with these methodologies up to the secondary substation level. However, the central observer meter is needed to identify every single fraudster customer. In addition to that, the difficult task in these methods is the precise calculation of technical losses in the network. The authors in [90] and [57] used this concept for NTL detection. The different parameters related to meter’s behavior are computed through various methods. These parameters are then matched with that of the regular meter’s parameters to indicate the fraud.
Similarly, for the scenarios in which TLs are not known, the authors in [18] proposed a new model for calculating network parameters and computing the TLs. The authors in [39] used a probabilistic power scheme for spotting the NTL activity. The fraudulent activity is identified at the network level with the help of observer meters and the exact location of fraud under the specific observer meter can also be identified. The authors in [112] proposed a smart substation-based methodology in which both observer meters and smart meters are present. The model will be able to identify the location of the fraudulent activity at the consumers’ level, even if there is not a significant difference between the observer meter reading and the smart meter reading. The authors in [113] used an identical approach to track network voltage changes by utilizing smart meter data of honest customers. These changes are then used as the network model for computing voltages provided the active power values are known.
5.3.18. State Estimation Approach
Distribution state estimation (DSE) methodologies utilize data from smart meters to observe the grid and hence act as an excellent scheme for correct identification of fraudulent activity [9,114,115]. DSE has been mostly employed at the medium voltage (MV) networks. Fraudulent activity is usually termed as the false data injection (FDI) attacks or as the bad data in the scenarios of state estimation approaches. The significant dissimilarity between FDI and wrong data may include several different bad data. Therefore, FDI is very hard to identify as compared to bad data, which generally appears
Figure 5. Network-based methods for NTL detection.
5.3.17. Load Flow Approach
The calculation of energy flow in the distribution grid is a clear way to detect NTL activity [18,22,42].The central observer meter, which is installed for the monitoring of energy meter on the LV sectionof a distribution transformer, is required in such scenarios. The observer meter’s measurement isthen compared with the total energy recorded by the smart meters. The difference between thesetwo readings is computed for computing the overall percentage of technical losses. The chances ofNTL activities are higher if the difference between the mentioned readings is higher. Fraudulentactivities can be detected with these methodologies up to the secondary substation level. However,the central observer meter is needed to identify every single fraudster customer. In addition tothat, the difficult task in these methods is the precise calculation of technical losses in the network.The authors in [57,90] used this concept for NTL detection. The different parameters related to meter’sbehavior are computed through various methods. These parameters are then matched with that ofthe regular meter’s parameters to indicate the fraud.
Similarly, for the scenarios in which TLs are not known, the authors in [18] proposed a new modelfor calculating network parameters and computing the TLs. The authors in [39] used a probabilisticpower scheme for spotting the NTL activity. The fraudulent activity is identified at the networklevel with the help of observer meters and the exact location of fraud under the specific observermeter can also be identified. The authors in [112] proposed a smart substation-based methodologyin which both observer meters and smart meters are present. The model will be able to identifythe location of the fraudulent activity at the consumers’ level, even if there is not a significant differencebetween the observer meter reading and the smart meter reading. The authors in [113] used anidentical approach to track network voltage changes by utilizing smart meter data of honest customers.These changes are then used as the network model for computing voltages provided the active powervalues are known.
5.3.18. State Estimation Approach
Distribution state estimation (DSE) methodologies utilize data from smart meters to observethe grid and hence act as an excellent scheme for correct identification of fraudulent activity [9,114,115].DSE has been mostly employed at the medium voltage (MV) networks. Fraudulent activity isusually termed as the false data injection (FDI) attacks or as the bad data in the scenarios of stateestimation approaches. The significant dissimilarity between FDI and wrong data may include severaldifferent bad data. Therefore, FDI is very hard to identify as compared to bad data, which generallyappears in a random and isolated fashion. The application of FDI effectively results in foolingthe state-estimation-based data detector approaches. The attacker requires substantial information
Energies 2020, 13, 4727 15 of 25
of the grid parameters to initiate the process successfully. The authors in [57] proposed Kalmanfilter state-estimator-based centralized solution for locating biases and line currents. The users areexpected to be committing fraud if their preferences are higher than the already defined threshold.The Kalman filter ensured privacy by offering a distributed solution. In such scenarios, the operatordoes not need to acquire permission to access the voltage measurements and power measurement ofthe users. The proposed solution provides excellent results in the microgrids with the small line spans.In [52], the fraudulent customer is supposed to have incomplete information of the network topologyand hence lacks the ability to enlarge or reduce the values of many smart meters at the uniformspell. These attempts result in non-detection by conventional electricity stability schemes. The authorproposed sensor placement, communication devices and smart meters for identifying these types ofattacks. The authors in [114] proposed a weighted least square (WLS) based state estimator approach forcalculating a total load of MV/LV transformers from three-phase current, voltage, reactive, and activepower values. The considerable variation in estimated and measured values indicate a potential NTLactivity. The authors in [115] proposed a methodology based on network clustering for the detectionof bad data. The process is repeated for each of the networks for the identification of bad data andnetwork partitioning.
5.3.19. Sensor Network Approach
The installation of the specific sensors in the power distribution system is an emerging developmentin the network-oriented-methods. The aim is to reduce the infrastructure expenses and to computethe optimal position and number of sensors to localize and detect NTLs efficiently [8,17,52,116].These approaches usually need accurate information on the network structure. They are closely linkedto the state estimation approaches, as the objective of the majority of these models is to increasethe inspection of the network. Instead of locating the ideal position of smart meters with sensors,the work also examines the positioning of unnecessary smart meters. The issue is resolved by installingthe central observer meter and the inspector box before each customer’s smart meter. The centralobserver meter exchanges the information with customers’ smart meters and compares the energy usageinformation to detect NTL activity. The fraud is authenticated if the difference between the measuredreadings is significant.
5.3.20. Hybrid Methods
Hybrid-based approaches are used to implement the techniques and algorithms of bothdata-oriented and network-based methods for NTL detection with suitable accuracy [16,26,40].The authors in [16] used the SVM algorithm along with the central observer meter. The observermeter cross-checks the SVM output to calculate the active power measurements of the network.The difference in the active power measurement and the system’s technical losses are calculated withthe SVM algorithm. The inspection is required if the customer is classified as fraudulent, i.e., if the SVMyields positive output and the difference is higher than the predefined limit. Similarly, the authorsin [40] used the same methodology and proposed a combination of DT and SVM for the same purpose.The authors in [26] proposed the installation of the remote technical unit (RTU) for NTL detection.The power distribution system is divided initially into sub-networks according to the availabilityof the RTU. The projected methodology identifies the sub-networks with electricity theft utilizingthe calculations from smart meters and RTUs directly. A meter tampering is confirmed if the differencebetween the RTUs and the smart meters is higher than a predefined threshold. In the last stage,SVM and fuzzy c-means are used to identify the individual customers that are committing fraud.The authors in [34] proposed a network loss analysis method to estimate the number of customersthat are involved in fraudulent activities. The suspected boundary region is calculated by rough sets.The authors in [117] proposed the asymmetric control limit (ACL)-based control charts for addressingthe same problem. The upper and lower limits are used to enhance the balance between total energyused by customers, the total energy measured, and the total losses. Another approach proposed
Energies 2020, 13, 4727 16 of 25
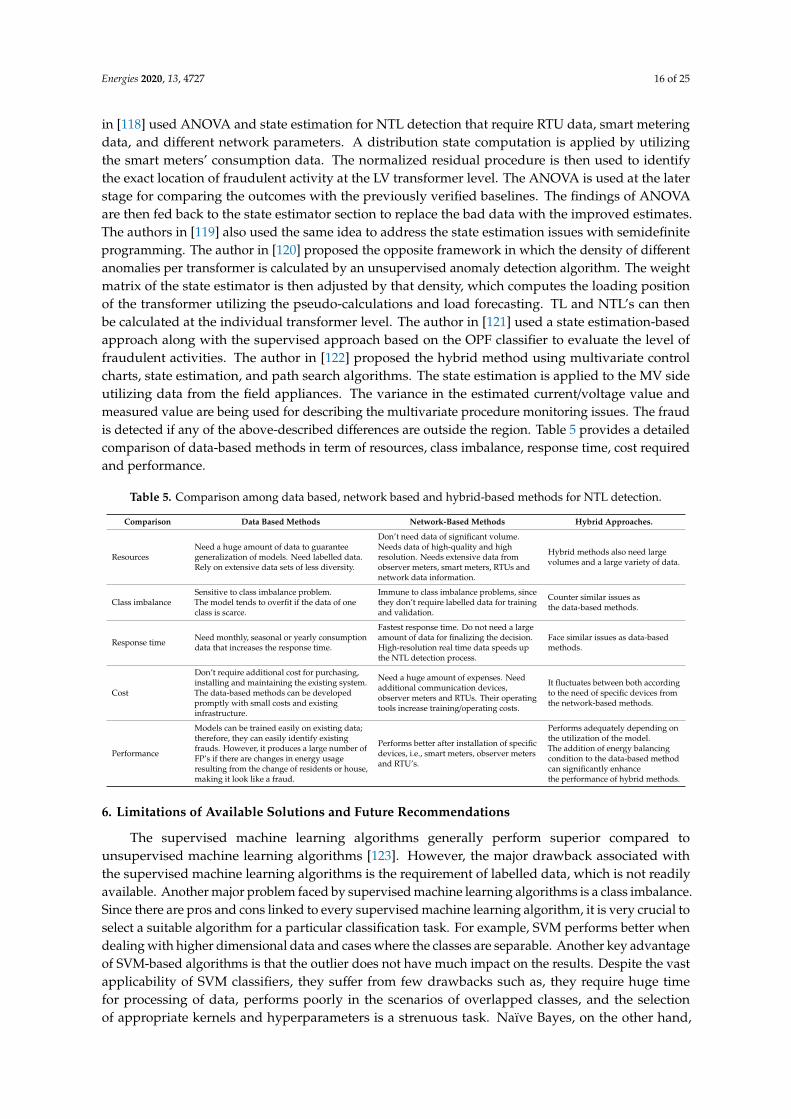
in [118] used ANOVA and state estimation for NTL detection that require RTU data, smart meteringdata, and different network parameters. A distribution state computation is applied by utilizingthe smart meters’ consumption data. The normalized residual procedure is then used to identifythe exact location of fraudulent activity at the LV transformer level. The ANOVA is used at the laterstage for comparing the outcomes with the previously verified baselines. The findings of ANOVAare then fed back to the state estimator section to replace the bad data with the improved estimates.The authors in [119] also used the same idea to address the state estimation issues with semidefiniteprogramming. The author in [120] proposed the opposite framework in which the density of differentanomalies per transformer is calculated by an unsupervised anomaly detection algorithm. The weightmatrix of the state estimator is then adjusted by that density, which computes the loading positionof the transformer utilizing the pseudo-calculations and load forecasting. TL and NTL’s can thenbe calculated at the individual transformer level. The author in [121] used a state estimation-basedapproach along with the supervised approach based on the OPF classifier to evaluate the level offraudulent activities. The author in [122] proposed the hybrid method using multivariate controlcharts, state estimation, and path search algorithms. The state estimation is applied to the MV sideutilizing data from the field appliances. The variance in the estimated current/voltage value andmeasured value are being used for describing the multivariate procedure monitoring issues. The fraudis detected if any of the above-described differences are outside the region. Table 5 provides a detailedcomparison of data-based methods in term of resources, class imbalance, response time, cost requiredand performance.
Table 5. Comparison among data based, network based and hybrid-based methods for NTL detection.
Comparison Data Based Methods Network-Based Methods Hybrid Approaches.
ResourcesNeed a huge amount of data to guaranteegeneralization of models. Need labelled data.Rely on extensive data sets of less diversity.
Don’t need data of significant volume.Needs data of high-quality and highresolution. Needs extensive data fromobserver meters, smart meters, RTUs andnetwork data information.
Hybrid methods also need largevolumes and a large variety of data.
Class imbalanceSensitive to class imbalance problem.The model tends to overfit if the data of oneclass is scarce.
Immune to class imbalance problems, sincethey don’t require labelled data for trainingand validation.
Counter similar issues asthe data-based methods.
Response time Need monthly, seasonal or yearly consumptiondata that increases the response time.
Fastest response time. Do not need a largeamount of data for finalizing the decision.High-resolution real time data speeds upthe NTL detection process.
Face similar issues as data-basedmethods.
Cost
Don’t require additional cost for purchasing,installing and maintaining the existing system.The data-based methods can be developedpromptly with small costs and existinginfrastructure.
Need a huge amount of expenses. Needadditional communication devices,observer meters and RTUs. Their operatingtools increase training/operating costs.
It fluctuates between both accordingto the need of specific devices fromthe network-based methods.
Performance
Models can be trained easily on existing data;therefore, they can easily identify existingfrauds. However, it produces a large number ofFP’s if there are changes in energy usageresulting from the change of residents or house,making it look like a fraud.
Performs better after installation of specificdevices, i.e., smart meters, observer metersand RTU’s.
Performs adequately depending onthe utilization of the model.The addition of energy balancingcondition to the data-based methodcan significantly enhancethe performance of hybrid methods.
6. Limitations of Available Solutions and Future Recommendations
The supervised machine learning algorithms generally perform superior compared tounsupervised machine learning algorithms [123]. However, the major drawback associated withthe supervised machine learning algorithms is the requirement of labelled data, which is not readilyavailable. Another major problem faced by supervised machine learning algorithms is a class imbalance.Since there are pros and cons linked to every supervised machine learning algorithm, it is very crucial toselect a suitable algorithm for a particular classification task. For example, SVM performs better whendealing with higher dimensional data and cases where the classes are separable. Another key advantageof SVM-based algorithms is that the outlier does not have much impact on the results. Despite the vastapplicability of SVM classifiers, they suffer from few drawbacks such as, they require huge timefor processing of data, performs poorly in the scenarios of overlapped classes, and the selectionof appropriate kernels and hyperparameters is a strenuous task. Naïve Bayes, on the other hand,
Energies 2020, 13, 4727 17 of 25
are suitable for real-time classification/predictions and perform well with high dimensional data.The key limitation of this algorithm is that the significance of the single feature does not holdprominent as a combination of all the features contributes to the outcome. The advantage of logisticregression (LR)-based algorithms is that these algorithms are simple and effective to implement astuning of hyperparameters and scaling of features is not needed; however, they perform poorly inthe case of non-linear data-set where they are generally outperformed by its counterpart algorithms.Decision tree-based algorithms does not require scaling and normalization of data. They can tacklethe missing values and can be easily interpreted. The major drawbacks of DT-based algorithms arethat they result in overfitting, sensitive to the class imbalance and need massive time for the trainingof models. Similarly, ensemble methods like Bagging and Boosting reduces the error due to votingof weak learners to reach the final decision and, at the same time, perform well in the scenarios ofimbalanced data sets. Another important aspect of the mentioned category of classifiers is that theycan handle huge data and missing values better than conventional algorithms such as SVM and DTs.Furthermore, the outliers have a very minute impact on the final predictions in ensemble methods andhence these models do not result in overfitting to the training data. Despite the mentioned benefits,this method also suffers from few prominent drawbacks such as; they appear as the black box, trees areneeded to be uncorrelated and each feature needs to have the predictive ability; otherwise, they arenot considered.
Contrary to the supervised machine learning methods, the unsupervised machine learningmethods do not require labelled data for the model training purpose. This is because of the reason thatthese methods are applied in the scenarios where positive samples (fraudster customers data) cases arerare and large number of negative samples (honest customers data) are available. Unlike the supervisedML methods, the unsupervised methods possess the capability of detecting the new fraud cases;hence they can be applied conveniently for NTL detection; however, they normally result in poorperformance with a large number of false positives.
Owing to the above mentioned facts, it is evident that the supervised methods can beexplicitly used in the scenarios where there sufficient samples of positive class (fraudster) areavailable while unsupervised methods are suitable when the data for the mentioned class is scarce.Concluding the above discussion, it is important to note that all algorithms respond differently todifferent types of data. For example, Naïve Bayes performs best when features are highly independent.SVM, on the other hand, is suited for a medium-sized data set with a large number of features.Linear regression and logistic regression are best suited for training the models when there exists alinear relationship between independent and dependent variables. K-NN can be used in the scenarioswhen the data set is of small size and the relationship between the independent and dependent variablesis not known. Hence, different machine learning algorithms respond differently to different types ofdata sets. Therefore, there is no thumb rule for selecting an algorithm accurately for a classificationproblem; however, based on the above discussion one can try the most relevant algorithms consideringthe available data and its stated features.
The detailed review of the literature reveals that there is a scarcity of research that assessesthe impact of NTL in non-developed countries. Contrary to that, the developed countries havemuch less impact of NTL; yet the impact is considerable. It is worthwhile to mention that, there is alack of research on assessing the financial impact of implementing the network-based methods, i.e.,installation of specific sensors and smart meters. The stated assessment is important to infer whetherthe benefit from NTL reduction from installing new infrastructure exceeds the equipment cost. Mostof the published research work on this area of research focuses on a single aspect of NTL sources.The authors of the current research, after a detailed literature review in the current area of research,felt the necessity of a systematic study that considers all types of potential NTL sources and theirimplications. Furthermore, the applications that incorporate numerous solutions to classify the NTLsfrom a variety of possible sources are also lacking in the existing literature. The author, therefore,
Energies 2020, 13, 4727 18 of 25
envisages that the future studies should emphasize on developing the applications which utilizethe multiple solutions of NTL detection in an integrated manner.
7. Conclusions
This article presents a detailed review of state-of-the-art methodologies for identifying fraudulentactivities in PDCs as discussed in three significant repositories: ACM Digital Library, Science Direct,and IEEE explore published since 2000. The study focuses mainly on the proposed solutions, criteria,and drawbacks. The literature review in the current article focused primarily on nor-hardware-basedsolutions, 79 of 91 studies belongs to non-hardware-based solutions. The summary of the literaturerevealed a sufficient gap in the category of theoretical methods as there is a strong need to investigatethe causes of NTL in developing countries. The developed countries have a much low percentageof NTLs, yet the consequences are substantial. There is an insufficient evaluation of the financialviability in the hardware-based methods, as this is essential for concluding that the reduction fromthe NTLs activities can recover the cost of equipment. How hardware-based methods communicatewith non-hardware-based methods should also be examined in-depth since these methodologies goside by side typically.
Author Contributions: Conceptualization, M.S.S.; methodology, U.U.S.; software, T.A.J. and M.S.S.; validation,N.N.H., N.A.A. and I.K.; formal analysis, T.A.J. and S.B.A.K.; investigation, S.B.A.K.; resources, M.W.M.;data curation, N.A.A. and N.N.H.; writing—original draft preparation, M.S.S.; writing—review and editing, T.A.J.and U.U.S.; visualization, U.U.S. and I.K.; supervision, M.W.M.; project administration, I.K.; funding acquisition,N.N.H., N.A.A. and I.K. All authors have read and agreed to the published version of the manuscript.
Funding: This research received no external funding.
Conflicts of Interest: The authors declare no conflict of interest.
Nomenclature
Acc AccuracyANN Artificial Neural NetworkARMA Auto-Regressive Moving AverageARIMA Auto-Regressive Integrated Moving AverageANOVA Analysis of varianceAUC Area Under CurveBP-MLP Back propagation multi-layer perceptronCART Classification and Regression TreesDR Detection RateDT Decision TreeEBT Ensemble Bagged TreeEWMA Exponentially Weighted Moving AverageFDS Fraud Detection SystemFPR False Positive RateFNR False Negative RateGAM Generalized Additive ModelKLD Kaulback-Lieber-DivergenceK-NN Kth-Nearest NeighborLOF Local Outlier FactorLV Low VoltageMGD Multivariate Gaussian DistributionMLP Multi-Layer PerceptronMV Medium VoltageNILM Non-Intrusive Load MonitoringNTL Non-Technical LossesOPF Optimum Path Forest
Energies 2020, 13, 4727 19 of 25
PDC Power Distribution CompaniesPPV Positive Predictive ValueROC Receiver Operating CharacteristicRTU Remote Technical UnitSVM Support Vector MachineTL Technical LossesTNR True Negative RateTPR True Positive RateWLS Weighted Least SquareQUEST Quick, Unbiased, Efficient, Statistical Tree
References
1. Depuru, S.S.S.R.; Wang, L.; Devabhaktuni, V.; Nelapati, P. A hybrid neural network model and encodingtechnique for enhanced classification of energy consumption data. In Proceedings of the 2011 IEEE Powerand Energy Society General Meeting, Detroit, MI, USA, 24–28 July 2011; pp. 1–8.
2. Costa, B.C.; Alberto, B.L.A.; Portela, A.M.; Maduro, W.; Eler, E.O. Fraud Detection in Electric PowerDistribution Networks using an Ann-Based Knowledge-Discovery Process. Int. J. Artif. Intell. Appl. 2013, 4,17–23. [CrossRef]
3. Sharma, T.; Pandey, K.K.; Punia, D.K.; Rao, J. Of pilferers and poachers: Combating electricity theft in India.Energy Res. Soc. Sci. 2016, 11, 40–52. [CrossRef]
4. Dos Angelos, E.W.S.; Saavedra, O.R.; Cortés, O.A.C.; De Souza, A.N. Detection and identification ofabnormalities in customer consumptions in power distribution systems. IEEE Trans. Power Deliv. 2011, 26,2436–2442. [CrossRef]
5. Nagi, J.; Mohammad, A.M.; Yap, K.S.; Tiong, S.K.; Ahmed, S.K.; Mohamad, M.; Mohammad, A.M.; Yap, K.S.;Tiong, S.K.; Ahmed, S.K. Nontechnical Loss Detection for Metered Consumers in Power Utility UsingSupport Vector Machines. IEEE Trans. Power Deliv. 2010, 25, 1162–1171. [CrossRef]
6. Rengaraju, P.; Pandian, S.R.; Lung, C.-H. Communication networks and non-technical energy loss controlsystem for smart grid networks. In Proceedings of the 2014 IEEE Innovative Smart Grid Technologies (ISGTASIA), Kuala lumpur, Malaysia, 20–23 May 2014; pp. 418–423.
7. Depuru, S.S.S.R.; Wang, L.; Devabhaktuni, V. Smart meters for power grid: Challenges, issues, advantagesand status. Renew. Sustain. Energy Rev. 2011, 15, 2736–2742. [CrossRef]
8. McLaughlin, S.; Holbert, B.; Fawaz, A.; Berthier, R.; Zonouz, S. A multi-sensor energy theft detectionframework for advanced metering infrastructures. IEEE J. Sel. Areas Commun. 2013, 31, 1319–1330.[CrossRef]
9. Jiang, R.; Lu, R.; Wang, Y.; Luo, J.; Shen, C.; Shen, X.; Cited, R.; Wang, Z. Energy-theft detection issues foradvanced metering infrastructure in smart grid. Tsinghua Sci. Technol. 2014, 19, 105–120. [CrossRef]
10. McLaughlin, S.; Podkuiko, D.; McDaniel, P. Energy theft in the advanced metering infrastructure.In Proceedings of the Lecture Notes in Computer Science, Bonn, Germany, 30 September–2 October2009; pp. 176–187.
11. Messinis, G.M.; Hatziargyriou, N.D. Review of non-technical loss detection methods. Electr. Power Syst. Res.2018, 158, 250–266. [CrossRef]
12. Ramos, C.C.O.O.; Rodrigues, D.; De Souza, A.N.A.N.; Papa, J.P.J.P. On the study of commercial losses inBrazil: A binary black hole algorithm for theft characterization. IEEE Trans. Smart Grid 2018, 9, 676–683.[CrossRef]
13. Chen, S.J.; Zhan, T.S.; Huang, C.H.; Chen, J.L.; Lin, C.H. Nontechnical loss and outage detection usingfractional-order self-synchronization error-based fuzzy petri nets in micro-distribution systems. IEEE Trans.Smart Grid 2015, 6, 411–420. [CrossRef]
14. Lin, C.H.; Chen, S.J.; Kuo, C.L.; Chen, J.L. Non-cooperative game model applied to an advanced meteringinfrastructure for non-technical loss screening in micro-distribution systems. IEEE Trans. Smart Grid 2014, 5,2468–2469. [CrossRef]
15. Punmiya, R.; Choe, S. Energy theft detection using gradient boosting theft detector with featureengineering-based preprocessing. IEEE Trans. Smart Grid 2019, 10, 2326–2329. [CrossRef]
Energies 2020, 13, 4727 20 of 25
16. Jokar, P.; Arianpoo, N.; Leung, V.C.M. Electricity theft detection in AMI using customers’ consumptionpatterns. IEEE Trans. Smart Grid 2016, 7, 216–226. [CrossRef]
17. Xiao, Z.; Xiao, Y.; Du, D.H.C. Exploring malicious meter inspection in neighborhood area smart grids.IEEE Trans. Smart Grid 2013, 4, 214–226. [CrossRef]
18. Tariq, M.; Poor, H.V. Electricity Theft Detection and Localization in Grid-Tied Microgrids. IEEE Trans.Smart Grid 2018, 9, 1920–1929. [CrossRef]
19. Liao, C.; Ten, C.W.; Hu, S. Strategic FRTU deployment considering cybersecurity in secondary distributionnetwork. IEEE Trans. Smart Grid 2013, 4, 1264–1274. [CrossRef]
20. Buzau, M.M.; Tejedor-Aguilera, J.; Cruz-Romero, P.; Gomez-Exposito, A. Detection of non-technical lossesusing smart meter data and supervised learning. IEEE Trans. Smart Grid 2019, 10, 2661–2670. [CrossRef]
21. Messinis, G.M.; Rigas, A.E.; Hatziargyriou, N.D. A Hybrid Method for Non-Technical Loss Detection inSmart Distribution Grids. IEEE Trans. Smart Grid 2019, 10, 6080–6091. [CrossRef]
22. Ferreira, T.S.D.; Trindade, F.C.L.; Vieira, J.C.M. Load Flow-Based Method for Nontechnical Electrical LossDetection and Location in Distribution Systems Using Smart Meters. IEEE Trans. Power Syst. 2020, 35,3671–3681. [CrossRef]
23. Ramos, C.C.O.; De Sousa, A.N.; Papa, J.P.; Falcão, A.X. A new approach for nontechnical losses detectionbased on optimum-path forest. IEEE Trans. Power Syst. 2011, 26, 181–189. [CrossRef]
24. León, C.; Biscarri, F.; Monedero, I.; Guerrero, J.I.; Biscarri, J.; Millán, R. Variability and trend-based generalizedrule induction model to NTL detection in power companies. IEEE Trans. Power Syst. 2011, 26, 1798–1807.[CrossRef]
25. Guerrero, J.I.; Monedero, I.; Biscarri, F.; Biscarri, J.; Millan, R.; Leon, C. Non-Technical Losses Reduction byImproving the Inspections Accuracy in a Power Utility. IEEE Trans. Power Syst. 2018, 33, 1209–1218.
26. Guo, Y.; Ten, C.W.; Jirutitijaroen, P. Online data validation for distribution operations against cybertampering.IEEE Trans. Power Syst. 2014, 29, 550–560. [CrossRef]
27. Massaferro, P.; Di Martino, J.M.; Fernandez, A. Fraud Detection in Electric Power Distribution: An Approachthat Maximizes the Economic Return. IEEE Trans. Power Syst. 2020, 35, 703–710. [CrossRef]
28. Nizar, A.H.; Dong, Z.Y.; Wang, Y. Power utility nontechnical loss analysis with extreme learning machinemethod. IEEE Trans. Power Syst. 2008, 23, 946–955. [CrossRef]
29. Buzau, M.-M.; Tejedor-Aguilera, J.; Cruz-Romero, P.; Gomez-Exposito, A. Hybrid deep neural networks fordetection of non-technical losses in electricity smart meters. IEEE Trans. Power Syst. 2019, 35, 1254–1263.
30. Ramos, C.C.O.; De Souza, A.N.; Falcão, A.X.; Papa, J.P. New insights on nontechnical losses characterizationthrough evolutionary-based feature selection. IEEE Trans. Power Deliv. 2012, 27, 140–146. [CrossRef]
31. Nagi, J.; Yap, K.S.; Tiong, S.K.; Ahmed, S.K.; Nagi, F. Improving SVM-based nontechnical loss detection inpower utility using the fuzzy inference system. IEEE Trans. Power Deliv. 2011, 26, 1284–1285. [CrossRef]
32. Faria, L.T.; Melo, J.D.; Padilha-Feltrin, A. Spatial-Temporal Estimation for Nontechnical Losses. IEEE Trans.Power Deliv. 2016, 31, 362–369. [CrossRef]
33. Monedero, I.; Biscarri, F.; León, C.; Guerrero, J.I.; Biscarri, J.; Millán, R. Detection of frauds and othernon-technical losses in a power utility using Pearson coefficient, Bayesian networks and decision trees. Int. J.Electr. Power Energy Syst. 2012, 34, 90–98. [CrossRef]
34. Spiric, J.V.; Stankovic, S.S.; Docic, M.B.; Popovic, T.D. Using the rough set theory to detect fraud committedby electricity customers. Int. J. Electr. Power Energy Syst. 2014, 62, 727–734. [CrossRef]
35. Depuru, S.S.S.R.; Wang, L.; Devabhaktuni, V.; Green, R.C. High performance computing for detection ofelectricity theft. Int. J. Electr. Power Energy Syst. 2013, 47, 21–30. [CrossRef]
36. Yip, S.C.; Wong, K.S.; Hew, W.P.; Gan, M.T.; Phan, R.C.W.; Tan, S.W. Detection of energy theft and defectivesmart meters in smart grids using linear regression. Int. J. Electr. Power Energy Syst. 2017, 91, 230–240.[CrossRef]
37. Guo, X.; Yin, Y.; Dong, C.; Yang, G.; Zhou, G. On the class imbalance problem. Electr. Power Syst. Res. 2008, 4,192–201.
38. Júnior, L.A.P.; Ramos, C.C.O.; Rodrigues, D.; Pereira, D.R.; de Souza, A.N.; da Costa, K.A.P.; Papa, J.P.Unsupervised non-technical losses identification through optimum-path forest. Electr. Power Syst. Res. 2016,140, 413–423. [CrossRef]
39. Neto, E.A.C.A.; Coelho, J. Probabilistic methodology for Technical and Non-Technical Losses estimation indistribution system. Electr. Power Syst. Res. 2013, 97, 93–99. [CrossRef]
Energies 2020, 13, 4727 21 of 25
40. Jindal, A.; Dua, A.; Kaur, K.; Singh, M.; Kumar, N.; Mishra, S. Decision Tree and SVM-Based Data Analyticsfor Theft Detection in Smart Grid. IEEE Trans. Ind. Inform. 2016, 12, 1005–1016. [CrossRef]
41. Zheng, Z.; Yang, Y.; Niu, X.; Dai, H.N.; Zhou, Y. Wide and Deep Convolutional Neural Networks forElectricity-Theft Detection to Secure Smart Grids. IEEE Trans. Ind. Inform. 2018, 14, 1606–1615. [CrossRef]
42. Zheng, K.; Chen, Q.; Wang, Y.; Kang, C.; Xia, Q. A Novel Combined Data-Driven Approach for ElectricityTheft Detection. IEEE Trans. Ind. Inform. 2019, 15, 1809–1819. [CrossRef]
43. Saeed, M.S.; Mustafa, M.W.; Sheikh, U.U.; Jumani, T.A.; Khan, I.; Atawneh, S.; Hamadneh, N.N. An EfficientBoosted C5.0 Decision-Tree-Based Classification Approach for Detecting Non-Technical Losses in PowerUtilities. Energies 2020, 13, 3242.
44. Vahabzadeh, A.; Kasaeian, A.; Monsef, H.; Aslani, A. A fuzzy-SOM method for fraud detection in powerdistribution networks with high penetration of roof-top grid-connected PV. Energies 2020, 13, 1287. [CrossRef]
45. Lu, X.; Zhou, Y.; Wang, Z.; Yi, Y.; Feng, L.; Wang, F. Knowledge embedded semi-supervised deep learning fordetecting non-technical losses in the smart grid. Energies 2019, 12, 3452. [CrossRef]
46. Jamil, F.; Ahmad, E. Policy considerations for limiting electricity theft in the developing countries. Energy Policy2019, 129, 452–458. [CrossRef]
47. Mimmi, L.M.; Ecer, S. An econometric study of illegal electricity connections in the urban favelas of BeloHorizonte, Brazil. Energy Policy 2010, 38, 5081–5097. [CrossRef]
48. Depuru, S.S.S.R.; Wang, L.; Devabhaktuni, V. Electricity theft: Overview, issues, prevention and a smartmeter based approach to control theft. Energy Policy 2011, 39, 1007–1015. [CrossRef]
49. Bin-Halabi, A.; Nouh, A.; Abouelela, M. Remote Detection and Identification of Illegal Consumers in PowerGrids. IEEE Access 2019, 7, 71529–71540. [CrossRef]
50. Kim, J.Y.; Hwang, Y.M.; Sun, Y.G.; Sim, I.; Kim, D.I.; Wang, X. Detection for Non-Technical Loss by SmartEnergy Theft with Intermediate Monitor Meter in Smart Grid. IEEE Access 2019, 7, 129043–129053. [CrossRef]
51. Fenza, G.; Gallo, M.; Loia, V. Drift-aware methodology for anomaly detection in smart grid. IEEE Access2019, 7, 9645–9657. [CrossRef]
52. Lo, C.H.; Ansari, N. CONSUMER: A novel hybrid intrusion detection system for distribution networks insmart grid. IEEE Trans. Emerg. Top. Comput. 2013, 1, 33–44. [CrossRef]
53. Zhou, Y.; Chen, X.; Zomaya, A.Y.; Wang, L.; Hu, S. A Dynamic Programming Algorithm for LeveragingProbabilistic Detection of Energy Theft in Smart Home. IEEE Trans. Emerg. Top. Comput. 2015, 3, 502–513.[CrossRef]
54. Zhan, T.S.; Chen, S.J.; Kao, C.C.; Kuo, C.L.; Chen, J.L.; Lin, C.H. Non-technical loss and power blackoutdetection under advanced metering infrastructure using a cooperative game based inference mechanism.IET Gener. Transm. Distrib. 2016, 10, 873–882. [CrossRef]
55. No, J.G.; Han, S.Y.; Joo, Y.J.; Shin, J.-H.H.; No, J.G.; Shin, J.-H.H.; Joo, Y.J. Conditional abnormality detectionbased on AMI data mining. IET Gener. Transm. Distrib. 2016, 10, 3010–3016.
56. Viegas, J.L.; Esteves, P.R.; Melício, R.; Mendes, V.M.F.; Vieira, S.M. Solutions for detection of non-technicallosses in the electricity grid: A review. Renew. Sustain. Energy Rev. 2017, 80, 1256–1268. [CrossRef]
57. Salinas, S.; Li, M.; Li, P. Privacy-preserving energy theft detection in smart grids: A P2P computing approach.IEEE J. Sel. Areas Commun. 2013, 31, 257–267. [CrossRef]
58. Ramos, C.C.O.; Souza, A.N.; Chiachia, G.; Falcão, A.X.; Papa, J.P. A novel algorithm for feature selectionusing Harmony Search and its application for non-technical losses detection. Comput. Electr. Eng. 2011, 37,886–894. [CrossRef]
59. Pereira, D.R.; Pazoti, M.A.; Pereira, L.A.M.; Rodrigues, D.; Ramos, C.O.; Souza, A.N.; Papa, J.P. Social-SpiderOptimization-based Support Vector Machines applied for energy theft detection. Comput. Electr. Eng. 2016,49, 25–38. [CrossRef]
60. Xia, X.; Xiao, Y.; Liang, W. SAI: A Suspicion Assessment-Based Inspection Algorithm to Detect MaliciousUsers in Smart Grid. IEEE Trans. Inf. Forensics Secur. 2020, 15, 361–374. [CrossRef]
61. Viegas, J.L.; Vieira, S.M.; Melício, R.; Mendes, V.M.F.; Sousa, J.M.C. Classification of new electricity customersbased on surveys and smart metering data. Energy 2016, 107, 804–817. [CrossRef]
62. Chebrolu, S.; Abraham, A.; Thomas, J.P. Feature deduction and ensemble design of intrusion detectionsystems. Comput. Secur. 2005, 24, 295–307. [CrossRef]
Energies 2020, 13, 4727 22 of 25
63. Saeed, M.S.; Mustafa, M.W.; Sheikh, U.U.; Jumani, T.A.; Mirjat, N.H. Ensemble bagged tree based classificationfor reducing non-technical losses in multan electric power company of Pakistan. Electronics 2019, 8, 860.[CrossRef]
64. Axelsson, S. The Base-Rate Fallacy and the Difficulty of Intrusion Detection. ACM Trans. Inf. Syst. Secur.2000, 3, 186–205. [CrossRef]
65. Henriques, H.O.; Barbero, A.P.L.; Ribeiro, R.M.; Fortes, M.Z.; Zanco, W.; Xavier, O.S.; Amorim, R.M.Development of adapted ammeter for fraud detection in low-voltage installations. Meas. J. Int. Meas. Confed.2014, 56, 1–7. [CrossRef]
66. Guerrero, J.I.; León, C.; Monedero, I.; Biscarri, F.; Biscarri, J. Improving Knowledge-Based Systems withstatistical techniques, text mining, and neural networks for non-technical loss detection. Knowl.-Based Syst.2014, 71, 376–388. [CrossRef]
67. Yurtseven, Ç. The causes of electricity theft: An econometric analysis of the case of Turkey. Util. Policy 2015,37, 70–78. [CrossRef]
68. León, C.; Biscarri, F.; Monedero, I.; Guerrero, J.I.; Biscarri, J.; Millán, R. Integrated expert system applied tothe analysis of non-technical losses in power utilities. Expert Syst. Appl. 2011, 38, 10274–10285. [CrossRef]
69. Nikovski, D.N.; Wang, Z.; Esenther, A.; Sun, H.; Sugiura, K.; Muso, T.; Tsuru, K. Smart Meter Data Analysisfor Power Theft Detection. In Proceedings of the 14th International Conference of Machine Learning andData Mining in Pattern Recognition, New York, NY, USA, 19–25 July 2013; pp. 379–389.
70. Glauner, P.; Meira, J.A.; Dolberg, L.; State, R.; Bettinger, F.; Rangoni, Y. Neighborhood features help detectingnon-technical losses in big data sets. In Proceedings of the 3rd IEEE/ACM International Conference onBig Data Computing, Applications and Technologies (BDCAT 2016), Shanghai, China, 6–9 December 2016;pp. 253–261.
71. Bandim, C.J.; Alves, J.E.R.; Pinto, A.V.; Souza, F.C.; Loureiro, M.R.B.; Magalhaes, C.A.; Galvez-Durand, F.Identification of energy theft and tampered meters using a central observer meter: A mathematical approach.In Proceedings of the 2003 IEEE PES Transmission and Distribution Conference & Exposition, Dallas, TX,USA, 7–12 September 2003; pp. 163–168.
72. Nagi, J.; Mohammad, A.M.; Yap, K.S.; Tiong, S.K.; Ahmed, S.K. Non-Technical Loss analysis for detection ofelectricity theft using support vector machines. In Proceedings of the IEEE 2nd International Power andEnergy Conference, Johor Bahru, Malaysia, 1–3 December 2008; pp. 907–912.
73. Coma-Puig, B.; Carmona, J.; Gavalda, R.; Alcoverro, S.; Martin, V. Fraud detection in energy consumption:A supervised approach. In Proceedings of the IEEE 3rd International Conference on Data Science andAdvanced Analytics (DSAA 2016), Montreal, QC, Canada, 17–19 December 2016; pp. 120–129.
74. Azzini, L.G.B.I.; Giannopoulos, G. A Methodology for Resilience Optimisation. In Proceedings of the 10thInternational Conference on Critical Information Infrastructures Security, Berlin, Germany, 5–7 October 2015;Volume 9578, pp. 56–66.
75. Singh, S.K.; Bose, R.; Joshi, A. Minimizing Energy Theft by Statistical Distance based Theft Detector inAMI. In Proceedings of the National Conference on Communications (NCC 2018), Hyderabad, India, 25–28February 2018; pp. 1–5.
76. Trevizan, R.D.; Bretas, A.S.; Rossoni, A. Nontechnical Losses detection: A Discrete Cosine Transform andOptimum-Path Forest based approach. In Proceedings of the North American Power Symposium (NAPS2015), Charlotte, NC, USA, 4–6 October 2015; pp. 1–6.
77. Ford, V.; Siraj, A.; Eberle, W. Smart grid energy fraud detection using artificial neural networks. In Proceedingsof the IEEE Symposium on Computational Intelligence Applications in Smart Grid (CIASG 2014), Orlando,FL, USA, 9–12 December 2014; pp. 1–6.
78. Toma, R.N.; Hasan, M.N.; Al Nahid, A.; Li, B. Electricity Theft Detection to Reduce Non-Technical Loss usingSupport Vector Machine in Smart Grid. In Proceedings of the 1st International Conference on Advances inScience, Engineering and Robotics Technology (ICASERT 2019), Dhaka, Bangladesh, 3–5 May 2019.
79. Glauner, P.; Boechat, A.; Dolberg, L.; State, R.; Bettinger, F.; Rangoni, Y.; Duarte, D. Large-scale detectionof non-technical losses in imbalanced data sets. In Proceedings of the IEEE Power and Energy SocietyInnovative Smart Grid Technologies Conference (ISGT 2016), Minneapolis, MN, USA, 6–9 September 2016;pp. 1–5.
Energies 2020, 13, 4727 23 of 25
80. Meira, J.A.; Glauner, P.; State, R.; Valtchev, P.; Dolberg, L.; Bettinger, F.; Duarte, D. Distillingprovider-independent data for general detection of non-technical losses. In Proceedings of the IEEEPower and Energy Conference at Illinois (PECI 2017), Champaign, IL, USA, 23–24 February 2017; pp. 1–5.
81. Tzafestas, S.G. (Ed.) Advances in Intelligent Systems; Springer: Berlin, Germany, 1999; ISBN 9783642365294.82. Di Martino, M.; Decia, F.; Molinelli, J.; Fernández, A. A Novel Framework for Nontechnical Losses Detection
in Electricity Companies. In Pattern Recognition-Applications and Methods; Springer: Berlin, Germany, 2013;pp. 109–120.
83. Nagi, J.; Ahmed, S.K.; Nagi, F. Intelligent System for Detection of Abnormalities and Theft of Electricity UsingGenetic Algorithm and Support Vector Machines; UNITEN: Kajang, Malaysia, 2008; pp. 122–127.
84. Singh, S.K. PCA based Electricity Theft Detection in Advanced Metering Infrastructure. In Proceedings ofthe 2017 7th International Conference on Power Systems (ICPS), Pune, India, 21–23 December 2017; IEEE:Piscataway, NJ, USA, 2018; pp. 441–445.
85. Messinis, G.; Dimeas, A.; Rogkakos, V.; Andreadis, K.; Menegatos, I.; Hatziargyriou, N.; Electricity, H.;Network, D. Utilizing Smart Meter Data for Electricity Fraud Detection; SEERC: Portoroz, Slovenia, 2016.
86. Depuru, S.S.S.R. Modeling, Detection, and Prevention of Electricity Theft for Enhanced Performance andSecurity of Power Grid. Ph.D. Thesis, University of Toledo, Toledo, OH, USA, 2012; p. 141.
87. Ahmad, T. Non-technical loss analysis and prevention using smart meters. Renew. Sustain. Energy Rev. 2017,72, 573–589. [CrossRef]
88. Liu, Y.; Hu, S. Cyberthreat analysis and detection for energy theft in social networking of smart homes.IEEE Trans. Comput. Soc. Syst. 2015, 2, 148–158. [CrossRef]
89. Mashima, D.; Cardenas, A. Evaluating Electricity Theft Detectors in Smart Grid Networks. In InternationalWorkshop on Recent Advances in Intrusion Detection; Springer: Amsterdam, The Netherlands, 2012.
90. Han, W.; Xiao, Y. A novel detector to detect colluded non-technical loss frauds in smart grid. Comput. Netw.2017, 117, 19–31. [CrossRef]
91. Jamil, F. On the electricity shortage, price and electricity theft nexus. Energy Policy 2013, 54, 267–272.[CrossRef]
92. Winther, T. Energy for Sustainable Development Electricity theft as a relational issue: A comparative look atZanzibar, Tanzania, and the Sunderban Islands, India. Energy Sustain. Dev. 2012, 16, 111–119. [CrossRef]
93. Lydia, M.; Kumar, G.E.P.; Levron, Y. Detection of Electricity Theft based on Compressed Sensing.In Proceedings of the 5th International Conference on Advanced Computing & Communication Systems(ICACCS 2019), Coimbatore, India, 15–16 March 2019; pp. 995–1000.
94. Dineshkumar, K.; Ramanathan, P.; Ramasamy, S. Development of ARM processor based electricity theftcontrol system using GSM network. In Proceedings of the IEEE International Conference on Circuit,Power and Computing Technologies (ICCPCT 2015), Nagercoil, India, 19–20 March 2015; pp. 1–6.
95. Khoo, B.; Cheng, Y. Using RFID for anti-theft in a Chinese electrical supply company: A cost-benefitanalysis. In Proceedings of the Wireless Telecommunications Symposium (WTS 2011), New York, NY, USA,13–15 April 2011.
96. Depuru, S.S.S.R.; Wang, L.; Devabhaktuni, V. A conceptual design using harmonics to reduce pilfering ofelectricity. In Proceedings of the IEEE PES General Meeting (PES 2010), Providence, RI, USA, 25–29 July 2010;pp. 1–7.
97. Arfeen, Z.A.; Khairuddin, A.B.; Larik, R.M.; Saeed, M.S. Control of distributed generation systems formicrogrid applications: A technological review. Int. Trans. Electr. Energy Syst. 2019, 29, 1–26. [CrossRef]
98. Anas, M.; Javaid, N.; Mahmood, A.; Raza, S.M.; Qasim, U.; Khan, Z.A. Minimizing electricity theft usingsmart meters in AMI. In Proceedings of the 7th International Conference on P2P, Parallel, Grid, Cloud andInternet Computing (3PGCIC 2012), Victoria, BC, Canada, 12–14 November 2012; pp. 176–182.
99. Filho, J.R.; Gontijo, E.M.; Delaíba, A.C.; Mazina, E.; Cabral, J.E.; Pinto, J.O.P. Fraud identification in electricitycompany costumers using decision tree. In Proceedings of the IEEE International Conference on Systems,Man and Cybernetics, The Hague, The Netherlands, 10–13 October 2004; pp. 3730–3734.
100. Cody, C.; Ford, V.; Siraj, A. Decision tree learning for fraud detection in consumer energy consumption.In Proceedings of the 14th IEEE International Conference on Machine Learning and Applications (ICMLA2015), Miami, FL, USA, 9–11 December 2015; pp. 1175–1179.
Energies 2020, 13, 4727 24 of 25
101. Saeed, M.S.; Mustafa, M.W.B.; Sheikh, U.U.; Salisu, S.; Mohammed, O.O. Fraud Detection for MeteredCostumers in Power Distribution Companies Using C5.0 Decision Tree Algorithm. J. Comput. Theor. Nanosci.2020, 17, 1318–1325. [CrossRef]
102. Sakhnini, J.; Karimipour, H.; Dehghantanha, A. Smart Grid Cyber Attacks Detection Using SupervisedLearning and Heuristic Feature Selection. In Proceedings of the 7th international conference on Smart EnergyGrid Engineering (SEGE 2019), Oshawa, ON, Canada, 12–14 August 2019; pp. 108–112.
103. Nizar, A.H.; Dong, Z.Y.; Zhao, J.H.; Zhang, P. A Data Mining Based NTL Analysis Method. In Proceedings ofthe IEEE Power Engineering Society General Meeting, Tampa, FL, USA, 24–28 June 2007; pp. 1–8.
104. Glauner, P.; Meira, J.A.; Valtchev, P.; State, R.; Bettinger, F. The challenge of non-technical loss detection usingartificial intelligence: A survey. Int. J. Comput. Intell. Syst. 2017, 10, 760–775. [CrossRef]
105. Yip, S.C.; Tan, C.K.; Tan, W.N.; Gan, M.T.; Bakar, A.H.A. Energy theft and defective meters detection in AMIusing linear regression. In Proceedings of the 2017 IEEE International Conference on Environment andElectrical Engineering and 2017 IEEE Industrial and Commercial Power Systems Europe (EEEIC/I&CPSEurope), Milan, Italy, 6–9 June 2017; pp. 1–6.
106. Kou, Y.; Lu, C.-T.; Sirwongwattana, S.; Huang, Y.-P. Survey of fraud detection techniques. In Proceedings ofthe IEEE International Conference on Networking, Sensing and Control, Taipei, Taiwan, 21–23 March 2004;pp. 749–754.
107. Yip, S.C.; Tan, W.N.; Tan, C.K.; Gan, M.T.; Wong, K.S. An anomaly detection framework for identifying energytheft and defective meters in smart grids. Int. J. Electr. Power Energy Syst. 2018, 101, 189–203. [CrossRef]
108. Otuoze, A.O.; Mustafa, M.W.; Sofimieari, I.E.; Dobi, A.M.; Sule, A.H.; Abioye, A.E.; Saeed, M.S. Electricitytheft detection framework based on universal prediction algorithm. Indones. J. Electr. Eng. Comput. Sci. 2019,15, 758–768. [CrossRef]
109. Kharraz, A.; Kirda, E. Redemption: Real-Time Protection Against Ransomware at End-Hosts. In Proceedingsof the 20th International Symposium, Atlanta, GA, USA, 18–20 September 2017; pp. 98–119.
110. Krishna, V.B.; Lee, K.; Weaver, G.A.; Iyer, R.K.; Sanders, W.H. F-DETA: A framework for detecting electricitytheft attacks in smart grids. In Proceedings of the 46th IEEE/IFIP International Conference on DependableSystems and Networks (DSN 2016), Toulouse, France, 28 June–1 July 2016; pp. 407–418.
111. Otuoze, A.O.; Mustafa, M.W.; Mohammed, O.O.; Saeed, M.S.; Surajudeen-Bakinde, N.T.; Salisu, S.Electricity theft detection by sources of threats for smart city planning. IET Smart Cities 2019, 1, 52–60.[CrossRef]
112. Kadurek, P.; Blom, J.; Cobben, J.F.G.; Kling, W.L. Theft detection and smart metering practices and expectationsin the Netherlands. In Proceedings of the IEEE PES Innovative Smart Grid Technologies, Gothenberg,Sweden, 11–13 October 2010; pp. 1–6.
113. Weckx, S.; Gonzalez, C.; Tant, J.; De Rybel, T.; Driesen, J. Parameter identification of unknown radial gridsfor theft detection. In Proceedings of the IEEE PES Innovative Smart Grid Technologies Europe Conference,Berlin, Germany, 14–17 October 2012; pp. 1–6.
114. Chen, L.; Xu, X.; Wang, C. Research on anti-electricity stealing method base on state estimation. In Proceedingsof the IEEE Power Engineering and Automation Conference, Wuhan, China, 8–9 September 2011; pp. 413–416.
115. Liu, T.; Gu, Y.; Wang, D.; Gui, Y.; Guan, X. A novel method to detect bad data injection attack in smartgrid. In Proceedings of the 32nd IEEE International Conference on Computer Communications, Turin, Italy,14–19 April 2013; pp. 3423–3428.
116. Silva, L.G.d.O.; Da Silva, A.A.P.; De Almeida-Filho, A.T. Allocation of power-quality monitors usingthe p-median to identify nontechnical losses. IEEE Trans. Power Deliv. 2016, 31, 2242–2249. [CrossRef]
117. Spiric, J.V.; Stankovic, S.S.; Docic, M.B. Determining a set of suspicious electricity customers using statisticalACL Tukey’s control charts method. Int. J. Electr. Power Energy Syst. 2016, 83, 402–410. [CrossRef]
118. Huang, S.C.; Lo, Y.L.; Lu, C.N. Non-technical loss detection using state estimation and analysis of variance.IEEE Trans. Power Syst. 2013, 28, 2959–2966. [CrossRef]
119. Su, C.L.; Lee, W.H.; Wen, C.K. Electricity theft detection in low voltage networks with smart meters usingstate estimation. In Proceedings of the IEEE International Conference on Industrial Technology, Taipei,Taiwan, 14–17 March 2016; pp. 493–498.

Energies 2020, 13, 4727 25 of 25
120. Aquiles, R.; Gazzana, D.; Passos, L.; Trevizan, R.; Bettiol, A.; Martin, R.; Bretas, A. Hybrid formulation fortechnical and non-technical losses estimation and identification in distribution networks: Application in abrazilian power system. In Proceedings of the 23rd International Conference and Exhibition on ElectricityDistribution, Lyon, France, 15–18 June 2015; pp. 15–18.
121. Trevizan, R.D.; Rossoni, A.; Bretas, A.S.; Gazzana, D.d.S.; Martin, R.d.P.; Bretas, N.G.; Bettiol, A.L.;Carniato, A.; Passos, L.F.D.N. Non-technical losses identification using Optimum-Path Forest and stateestimation. In Proceedings of the IEEE Eindhoven PowerTech (PowerTech 2015), Eindhoven, The Netherlands,29 June–2 July 2015.
122. Leite, J.B.; Mantovani, J.R.S. Detecting and locating non-technical losses in modern distribution networks.IEEE Trans. Smart Grid 2018, 9, 1023–1032. [CrossRef]
123. Hamadneh, N. Logic Programming in Radial Basis Function Neural Networks. Ph.D. Thesis, Universiti SainsMalaysia, Penang, Malaysia, 2013.
© 2020 by the authors. Licensee MDPI, Basel, Switzerland. This article is an open accessarticle distributed under the terms and conditions of the Creative Commons Attribution(CC BY) license (http://creativecommons.org/licenses/by/4.0/).