detection of estrogens in aqueous and solid environmental matrices by direct injection lcmsms
DESCRIPTION
Su ve Toprakta Östrojen Hormonlarının LCMSMS Direk Enjeksiyon Yöntemiyle TayiniTRANSCRIPT

p 1
Detection of Estrogens in Aqueous and Solid EnvironmentalMatrices by Direct Injection LC-MS/MSD. Loeffler1, M. Ramil1, T. Ternes1, M. Suter2, R. Schönenberger2, H.-R. Aerni2, S, König3, A. Besa4, A.Schreiber5
1 Federal Institute od Hydrology (BfG) Koblenz (Germany), 2 EAWAG Dübendorf (Switzerland), 3 AB SCIEXRotkreuz (Switzerland), 4 AB SCIEX Darmstadt (Germany), 5 AB SCIEX Concord, Ontario (Canada)
IntroductionVarious analyses of water have shown ubiquitary presence ofpharmaceutical residues in the aqueous environment.1 Due totheir ecotoxic effects native and synthetic estrogens, Estrone(E1), 17β-Estradiol (E2), Estriol (E3) and 17α-Ethinylestradiol(EE2), are of special relevance even at very low concentrations.A significant feminization could be observed at a concentration ofapproximately 1 pg/mL reflecting the strong endocrine potentialof these compounds.2 As a result of these very lowconcentrations a powerful analytical set-up is essential for theirreliable detection and quantification. Residues of estrogens inaqueous and solid environmental samples are commonlyanalyzed by GC-MSn, however the necessary derivatizationsteps are time consuming and laborious. This study investigatesthe power of LC-MS/MS for the analysis of estrogens, andcompares a traditional Solid Phase Extraction (SPE) approach todirect injections of filtered wastewater, sediment and sludgesamples.
ExperimentalSample Preparation
Direct injections of environmental samples were compared tosamples prepared using the following procedure. Wastewater(250-500 mL), sediment (5 g), and sludge samples (0.5 g) wereprepared according to the following scheme:
Liquid Chromatography
• Clean-up column: Phenomenex MercuryMS Luna C18(2)20x2 mm, 3 μm
• Analytical column: Phenomenex Gemini 50x2 mm, 5 μm
• Eluent A: water, eluent B: acetonitrile
• Eluent C (post column): water + 2.5% NH3
Water sample
Filtration, pH to 3
SPE, 500 mg C18ec
Sediment, sludge sample
Clean-up, 1 g Silica gel
SPE, 500 mg C18ec
USE with acetone/methanol
LC-MS/MS using negative Electrospray ionization

p 2
• Injection volume: 20 μL of extracts and 100 μL of wastewaterwithout clean-up
Table 1. LC Flow and Gradient
Time (min) Flow (µl/min) A/B C Flow (µl/min)
0.0 1000 90/10 0
4.0 1000 90/10 0
4.5 250 90/10 10
15.0 250 34/66 10
16.0 250 0/100 10
20.0 250 0/100 10
4.0 Re-equilibration to 1000 µL/min and 90/10
Switching Valve
Switching valve: 0.0 min position A, 4.6 min position B, 25.0 minposition A For valve connections see the following schematics:
Mass Spectrometric Detection
An AB SCIEX API 5000™ LC/MS/MS system with Turbo V™source with Electrospray Ionization (ESI) probe in negativepolarity was used. Gas and source parameters:
CUR: 20 psi; GS1: 45 psi; GS2: 65 psi; TEM: 360°C (optimizedfor Ethinylestradiol); and CAD value: 7; IonSpray voltage (IS)was set to 0 V between 0.0-4.7 min and 20.0-21.0 min, while ISwas set to -4500 V between 4.7- 20.0 min, respectively.
The following Multiple Reaction Monitoring (MRM) transitionswere detected with a dwell time of 80 ms:
E1: 269/145, E2: 271/145, E3: 287/171, EE2: 295/145, InternalStandards E1-D4: 273/147, E2-13C2: 273/147and EE2-D2:297/145.
Results and DiscussionEcotoxic effects down to sub-ng/L levels in combination with thelimited sensitivity of older LC-MS/MS systems are the reasons touse time consuming sample preparation steps. A typical samplepreparation step is Solid Phase Extraction (SPE) of wastewateror Ultrasonic Extraction (USE) followed by SPE of sediment andsludge samples.3-4 However, simultaneously matrix componentsare enriched as well, leading to an increased background whichin the worst case leads to false positive results.
Figure 1. Chromatogram of E3 (1), E2 (2), EE3 (3), E1 (4) and theirinternal standards E1-D4 and E2-13C2
Waste
Waste
10 19 2
8 3
7 46 5
Pump
10 1
7
3
9 2
8
46 5
Pump
Position A:
Position B:
Pump C
Pump C
Analytical column
Analytical columnMS/MS
MS/MS
1
23
4

p 3
An example chromatogram of all analytes and internal standardsis presented in Figure 1. The ionization conditions wereoptimized for Ethinylestradiol, the least sensitive analyte. Theuse of APCI or APPI sources results in thermal degradation ofEthinylestradiol to Estradiol. Electrospray Ionization (ESI) innegative polarity with post column infusion of ammonia showshighest intensity. The sensitivity of these conditions using theAPI 5000™ LC/MS/MS system is presented in Figure 2. Allinvestigated estrogens have a Signal-to-Noise ratio (S/N) higherthan 10 at a concentration of 10 pg/mL.
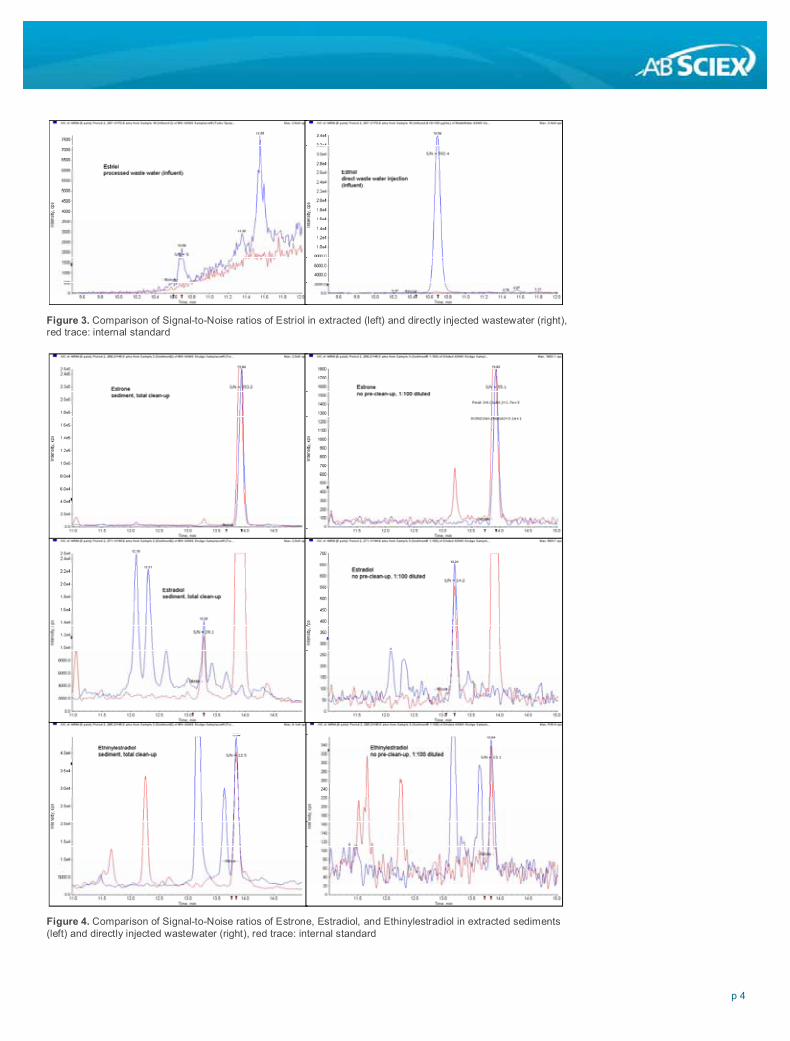
It is known that Estriol can be entirely eliminated during clean-up.However, the direct injection of 100 μL of a filtered wastewatersample results in an Estriol response of 3.4e4 counts per second(Figure 3).
Extraction of sediment and sludge samples followed by atraditional SPE clean-up leads to high background as well asmany interfering signals. Figure 4 shows chromatograms ofEstrone, Estradiol, and Ethinylestradiol after a traditional clean-up procedure and non- SPE treated sediment samples whichwere diluted by a factor of 100. The analysis of non-SPE treated100 times diluted samples delivers results with comparable S/Nratios to those samples analyzed after complete clean-upprocedure.
Estriol could not be detected in sludge samples.
Figure 2. Injection of a 10 pg/mL standard of Estrone, Estradiol, Estriol, and Ethinylestradiol
CH3OH
OH
CH3O
OH
CH3OH
OH
OH
CH3OH
OH
CH
p 4
Figure 3. Comparison of Signal-to-Noise ratios of Estriol in extracted (left) and directly injected wastewater (right),red trace: internal standard
Figure 4. Comparison of Signal-to-Noise ratios of Estrone, Estradiol, and Ethinylestradiol in extracted sediments(left) and directly injected wastewater (right), red trace: internal standard

For Research Use Only. Not for use in diagnostic procedures.
© 2010 AB SCIEX. The trademarks mentioned herein are the property of AB Sciex Pte. Ltd. or their respective owners. AB SCIEX™ is being used under license.
Publication number: 1280910-01
Headquarters International Sales353 Hatch Drive Foster City CA 94404 USA For our office locations please call the division
Phone 650-638-5800 headquarters or refer to our website atwww.absciex.com www.absciex.com/offices
SummaryLimits of quantitation of all detected estrogens in a mix includingEstrone, 17β-Estradiol, Estriol and 17α-Ethinylestradiol werefound below 10 pg/mL. In this study highest sensitivity wasachieved using Turbo V™ source in negative polarity on anAPI 5000™ LC/MS/MS with post column infusion of ammonia.
The developed direct injection method provides enoughsensitivity to analyze estrogens in filtered wastewater sampleswith minimum sample preparation. This approach reduces timeconsuming sample preparation and avoids disturbing matrixsignals. Furthermore it eliminates the loss of Estriol duringtraditional Solid Phase Extraction.
The improvement in sensitivity allows similar Signal-to-Noiseratios analyzing sediment and sludge samples to those preparedwith traditional clean-up or a simplified procedure. Dilution ofcrude samples reduces the background noise and the presenceof interfering signals while reducing time of sample treatmentsignificantly.
References1 Baronti et al.: Environ. Sci. & Technol. Vol. 34 (2000) 5059-
50662
2 Routledgeet al.: Environ. Sci. & Technol. Vol. 32 (1998)1559-1565
3 Ternes: Trends Anal. Chem. 20 (2001) 419-434
4 Ternes, et al.: Anal. Chem. 74 (2002) 3498-3504