detection of adulteration in cooked meat products by mid-infrared spectroscopy
TRANSCRIPT
Detection of Adulteration in Cooked Meat Products byMid-Infrared Spectroscopy
OSAMA AL-JOWDER,† E. K. KEMSLEY,*,‡ AND REGINALD H. WILSON‡
College of Science, Chemistry Department, University of Bahrain, Isa Town, Bahrain, and Institute ofFood Research, Norwich Research Park, Colney, Norwich NR4 7UA, United Kingdom
Mid-infrared spectroscopy was used to discriminate between pure beef and beef containing 20%w/w of a range of potential adulterants (heart, tripe, kidney, and liver). Spectra were acquired fromraw samples and from samples cooked using two different cooking regimes. Chemometric methods(principal component analysis, partial least squares regression, and linear discriminant analysis)applied to the spectra showed that discrimination between the pure and adulterated sample typeswas possible, irrespective of cooking regime. The cross-validated classification success rate obtainedwas ∼97%. Discrimination between all five sample types (pure beef and beef containing one of eachof the four adulterants) at each level of cook was also possible, but became more difficult as thecooking level increased.
KEYWORDS: Infrared; spectroscopy; beef; adulteration; cooked; offal; discrimination
INTRODUCTION
The nature of some meat products (pies, sausages, burgers)offers many possibilities for adulteration. Cheaper cuts or offalmay be substituted for more expensive cuts, and water orvegetable matter may be added. In previous work (1), weconducted a feasibility study with the aim of determiningwhether mid-infrared (MIR) spectroscopy could be used forspecies identification, and if the method had potential as a rapid,low-cost, easy-to-use screening method for the food industry.We showed that it was possible to discriminate between threemeats (turkey, chicken, and pork) and were additionally ableto identify fresh samples from those that had been previouslyfrozen. Subsequently, McElhinney et al. (2) have performedsimilar studies using red meats and a combination of analyticaltechniques.
Spectroscopy is not the only approach to such analysis. Othermethods such as immunological (3, 4), and enzymic methods(5) can be used, and may be both cheap and quick. However,the detection of nonmeat additives requires complex and moreprolonged examination of the sample. The addition of offal canbe particularly difficult to detect and may require detailedmicroscopic examination (6). We have recently shown that MIRspectroscopy, used in conjunction with appropriate chemometricmethods, can discriminate between pure beef and beef mixedwith selected offal (7). Furthermore, such methods could providequantitative information if the potential adulterant was known.
A primary aim of the present work was to ascertain whetherthe discrimination obtained for raw meats could be obtainedwith cooked samples. We have again chosen to concentrate on
the addition of offal to beef. However, we have elected to useonly one type of cut (silverside), because the earlier study (7)showed that it was not readily possible to discriminate betweendifferent cuts of beef. We have also chosen to work at oneadulterant level (20% w/w). This amount was chosen as beingreasonably challenging, and representative of a realistic adul-teration level. The detection limits for kidney and liver suggestedby earlier work were around 10% w/w. In the present study,we have additionally included two other offal types, heart andtripe, the detection limits of which were not known in advance.
EXPERIMENTAL PROCEDURES
Samples.Samples of beef (cut: silverside), ox kidney, oxliver, ox heart, and tripe (stomach) were purchased from localretailers and butchers. The samples were minced to a coarsepaste soon after purchase, using a Krups (Peoria, IL) coffeegrinder, which was carefully washed between each preparation,using 0.2% Triton-X 100 solution followed by distilled water.Mixtures of offal and beef were prepared by adding 20% w/wof selected offal samples to randomly selected beef samples.Twelve samples of pure beef and of beef adulterated with eachoffal type, were used in the experiments. All samples werefrozen at-20°C after preparation, and thawed in the refrigeratorbefore spectral acquisition or cooking.
Cooking. Samples were shaped into small patties of ap-proximately 4 cm diameter and 1 cm thickness. These werecooked in a R-202M 800W IEC 705 microwave oven (SharpElectronics Ltd, Manchester, UK) for 8 min, using either powersetting ‘medium-low’ (240 W) or ‘medium’ (400 W). We willcall these cooking regimes ‘level 1’ and ‘level 2’, respectively.The ‘level 1’ regime was just sufficient to cook the samplesthoroughly, leaving no visibly raw areas. The ‘level 2’ regimecooked the samples thoroughly, without causing burning, but
* To whom correspondence should be addressed. Fax:+44 1603 507723;E-mail [email protected].
† University of Bahrain.‡ Norwich Research Park.
J. Agric. Food Chem. 2002, 50, 1325−1329 1325
10.1021/jf0108967 CCC: $22.00 © 2002 American Chemical SocietyPublished on Web 02/09/2002
with some dehydration. The cooked samples appeared to be ofhomogeneous color and texture throughout.
Instrumentation and Spectral Acquisition. All spectra werecollected on a Spectra-Tech Applied Systems Inc (Shelton, CT)Monitir Fourier transform infrared (FTIR) spectrometer systemequipped with a sealed and desiccated interferometer and room-temperature deuterated triglycine sulfate detector. An attenuatedtotal reflectance (ATR) accessory was built into one of twodedicated sampling stations. The ATR crystal was removablefrom the instrument which remained sealed by the presence ofpotassium bromide windows. In this way, the crystal could becleaned without ingress of water vapor into the spectrometer.The ATR crystal was a nominal 11-reflection zinc selenidecrystal mounted in a trough plate. The crystal geometry was45° parallelogram with mirrored angled faces.
Uncooked samples were applied to the ATR plate, taking careto achieve good contact between the sample and the ATRcrystal, with no trapped air. A single-beam MIR spectrum ofthe sample was collected over the range 800 to 4000 cm-1 at aresolution of 4 cm-1. Sixty-four interferograms were co-addedbefore Fourier transformation using triangular apodization. Thesingle-beam spectrum of each sample was converted to absor-bance units using a single-beam background spectrum collectedof a clean, dry ATR crystal.
Cooked samples were ground using the Krups coffee grinderafter cooking and cooling to room temperature. The finelypowdered, semi-dry material was spread onto the ATR crystaland held in place with gentle hand pressure applied to a rubbertop-plate. Spectral acquisition conditions were the same as forthe uncooked samples.
Between spectral acquisition of all samples, the ATR platewas cleaned with 0.2% Triton-X 100 solution, rinsed withdistilled water, and then dried.
Chemometric Analysis. All data analysis was carried outusing Matlab (The Mathworks Inc, Cambridge, UK). Allabsorbance spectra were truncated to 470 data points in theregion 990-1895 cm-1. Two chemometric methods wereemployed in this work. For data exploration, we have usedprincipal component analysis (PCA) using the covariance matrix.For modeling the group structures in the data, we have used acombination of methods: partial least squares (PLS) regressiononto dummy variables representing the proposed group structure
(“discriminant” PLS (8)), followed by distance-based lineardiscriminant analysis (LDA), using the Mahalanobis distancemetric, applied to subsets of the PLS scores. PLS-LDA modelperformance was measured by classification success ratesobtained by “leave-one-out” or internal cross-validation (ICV),which has been shown to give a realistic indication of modelperformance (9).
RESULTS AND DISCUSSION
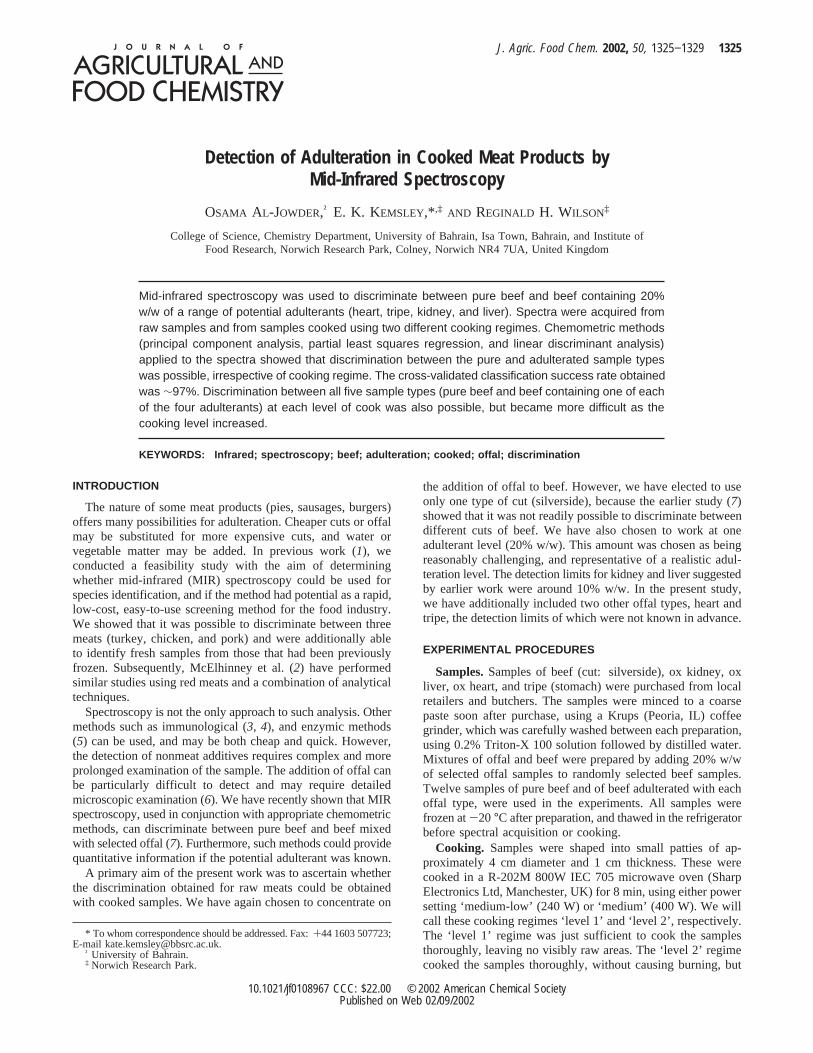
Spectra collected from all uncooked samples are shown inFigure 1. The spectra of raw beef, beef with kidney, and beefwith liver were similar in appearance to those collected in earlierwork (7). It is not possible to distinguish the spectra ofadulterated from unadulterated samples by visual inspectionalone.
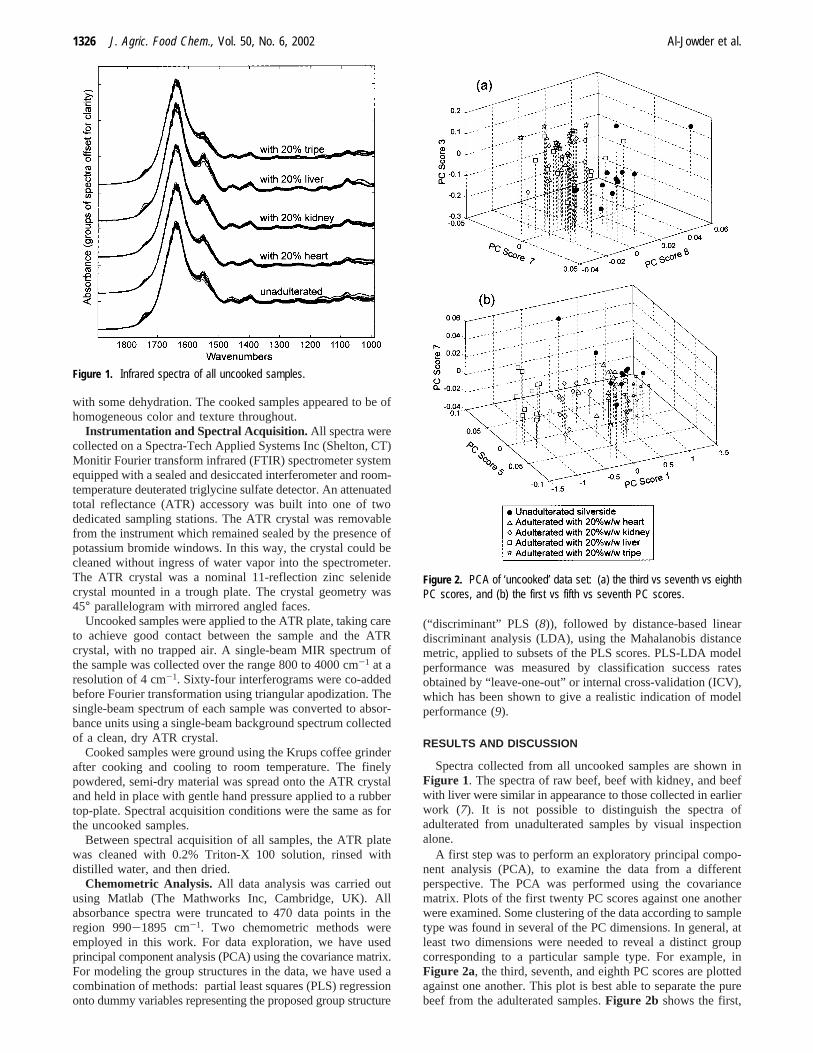
A first step was to perform an exploratory principal compo-nent analysis (PCA), to examine the data from a differentperspective. The PCA was performed using the covariancematrix. Plots of the first twenty PC scores against one anotherwere examined. Some clustering of the data according to sampletype was found in several of the PC dimensions. In general, atleast two dimensions were needed to reveal a distinct groupcorresponding to a particular sample type. For example, inFigure 2a, the third, seventh, and eighth PC scores are plottedagainst one another. This plot is best able to separate the purebeef from the adulterated samples.Figure 2b shows the first,
Figure 1. Infrared spectra of all uncooked samples.
Figure 2. PCA of ‘uncooked’ data set: (a) the third vs seventh vs eighthPC scores, and (b) the first vs fifth vs seventh PC scores.
1326 J. Agric. Food Chem., Vol. 50, No. 6, 2002 Al-Jowder et al.
fifth, and seventh PC scores, which perhaps best simultaneouslydistinguish all five groups. It is interesting to note that inFigure2b, the groups corresponding to the two new adulterant typesused in this study, heart and tripe, lie closest to the ‘unadulter-ated’ group.
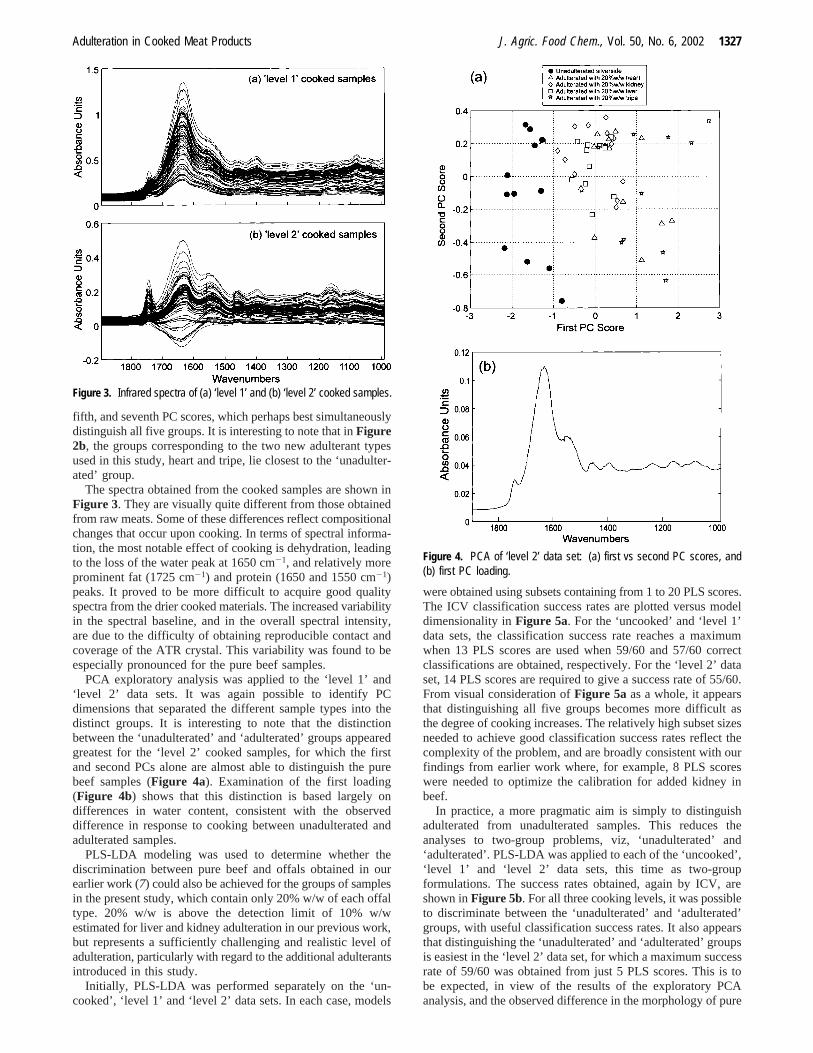
The spectra obtained from the cooked samples are shown inFigure 3. They are visually quite different from those obtainedfrom raw meats. Some of these differences reflect compositionalchanges that occur upon cooking. In terms of spectral informa-tion, the most notable effect of cooking is dehydration, leadingto the loss of the water peak at 1650 cm-1, and relatively moreprominent fat (1725 cm-1) and protein (1650 and 1550 cm-1)peaks. It proved to be more difficult to acquire good qualityspectra from the drier cooked materials. The increased variabilityin the spectral baseline, and in the overall spectral intensity,are due to the difficulty of obtaining reproducible contact andcoverage of the ATR crystal. This variability was found to beespecially pronounced for the pure beef samples.
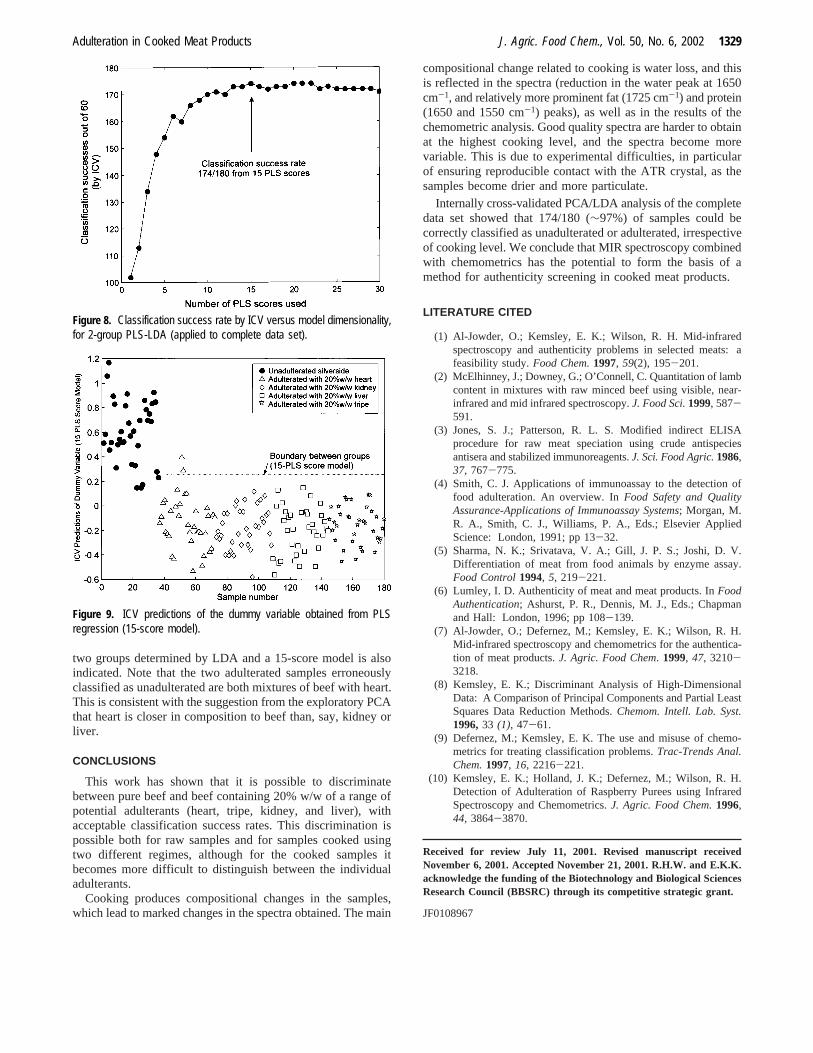
PCA exploratory analysis was applied to the ‘level 1’ and‘level 2’ data sets. It was again possible to identify PCdimensions that separated the different sample types into thedistinct groups. It is interesting to note that the distinctionbetween the ‘unadulterated’ and ‘adulterated’ groups appearedgreatest for the ‘level 2’ cooked samples, for which the firstand second PCs alone are almost able to distinguish the purebeef samples (Figure 4a). Examination of the first loading(Figure 4b) shows that this distinction is based largely ondifferences in water content, consistent with the observeddifference in response to cooking between unadulterated andadulterated samples.
PLS-LDA modeling was used to determine whether thediscrimination between pure beef and offals obtained in ourearlier work (7) could also be achieved for the groups of samplesin the present study, which contain only 20% w/w of each offaltype. 20% w/w is above the detection limit of 10% w/westimated for liver and kidney adulteration in our previous work,but represents a sufficiently challenging and realistic level ofadulteration, particularly with regard to the additional adulterantsintroduced in this study.
Initially, PLS-LDA was performed separately on the ‘un-cooked’, ‘level 1’ and ‘level 2’ data sets. In each case, models
were obtained using subsets containing from 1 to 20 PLS scores.The ICV classification success rates are plotted versus modeldimensionality inFigure 5a. For the ‘uncooked’ and ‘level 1’data sets, the classification success rate reaches a maximumwhen 13 PLS scores are used when 59/60 and 57/60 correctclassifications are obtained, respectively. For the ‘level 2’ dataset, 14 PLS scores are required to give a success rate of 55/60.From visual consideration ofFigure 5a as a whole, it appearsthat distinguishing all five groups becomes more difficult asthe degree of cooking increases. The relatively high subset sizesneeded to achieve good classification success rates reflect thecomplexity of the problem, and are broadly consistent with ourfindings from earlier work where, for example, 8 PLS scoreswere needed to optimize the calibration for added kidney inbeef.
In practice, a more pragmatic aim is simply to distinguishadulterated from unadulterated samples. This reduces theanalyses to two-group problems, viz, ‘unadulterated’ and‘adulterated’. PLS-LDA was applied to each of the ‘uncooked’,‘level 1’ and ‘level 2’ data sets, this time as two-groupformulations. The success rates obtained, again by ICV, areshown inFigure 5b. For all three cooking levels, it was possibleto discriminate between the ‘unadulterated’ and ‘adulterated’groups, with useful classification success rates. It also appearsthat distinguishing the ‘unadulterated’ and ‘adulterated’ groupsis easiest in the ‘level 2’ data set, for which a maximum successrate of 59/60 was obtained from just 5 PLS scores. This is tobe expected, in view of the results of the exploratory PCAanalysis, and the observed difference in the morphology of pure
Figure 3. Infrared spectra of (a) ‘level 1’ and (b) ‘level 2’ cooked samples.
Figure 4. PCA of ‘level 2’ data set: (a) first vs second PC scores, and(b) first PC loading.
Adulteration in Cooked Meat Products J. Agric. Food Chem., Vol. 50, No. 6, 2002 1327

and adulterated cooked samples. The ‘uncooked’ and ‘level 1’data sets required 12 and 15 scores, respectively, to achievethe same classification performance. We surmise that in thesecases, the distinction between the two groups is based uponmore subtle compositional changes, although it is beyond thescope of the present work to determine the exact nature of thesedifferences.
It is of interest to determine whether such discriminationbetween unadulterated and adulterated samples can be achievedfrom the complete data set. Such a model would be needed ina working adulteration screening test, where the amount ofheating received by a product may not be known. PCA wasapplied to the complete set of 180 spectra. The first PC accountsfor in excess of 99% of the variability in the data set. Fromvisual examination of the scores with respect to this axis, it isclearly strongly associated with cooking level (Figure 6a). Thisscores plot also illustrates the increased variability at highercooking levels. Examination of the first loading (Figure 6b)showed that this PC again represents mainly variation in thewater content, consistent with the findings from visual inspectionof the spectra. Note that it is also highly similar to the first PCloading from the ‘level 2’ data set (Figure 4b). Among the PCscores with lower variances, some were identified that were ableto distinguish, at least partially, the ‘adulterated’ from ‘unadul-terated’ groups (Figure 7).
PLS-LDA was applied, again using cross-validation for a two-group model. The classification success rate is shown versusmodel dimensionality inFigure 8. We see that a usefulclassification success rate of 174/180 is obtained from 15 PLSscores. A graphical impression of the performance of the modelcan be obtained by examining the ICV predictions of the dummyvariable made by the PLS regression (10). These are plottedagainst sample number inFigure 9. The boundary between the
Figure 5. Classification success rates by ICV plotted versus model dimensionality, for (a) five-group discrimination, and (b) two-group discrimination.
Figure 6. PCA of complete set of 180 spectra: (a) first vs second PCscores, and (b) first PC loading.
Figure 7. Sixth vs seventh vs ninth PC scores from the entire data set.
1328 J. Agric. Food Chem., Vol. 50, No. 6, 2002 Al-Jowder et al.
two groups determined by LDA and a 15-score model is alsoindicated. Note that the two adulterated samples erroneouslyclassified as unadulterated are both mixtures of beef with heart.This is consistent with the suggestion from the exploratory PCAthat heart is closer in composition to beef than, say, kidney orliver.
CONCLUSIONS
This work has shown that it is possible to discriminatebetween pure beef and beef containing 20% w/w of a range ofpotential adulterants (heart, tripe, kidney, and liver), withacceptable classification success rates. This discrimination ispossible both for raw samples and for samples cooked usingtwo different regimes, although for the cooked samples itbecomes more difficult to distinguish between the individualadulterants.
Cooking produces compositional changes in the samples,which lead to marked changes in the spectra obtained. The main
compositional change related to cooking is water loss, and thisis reflected in the spectra (reduction in the water peak at 1650cm-1, and relatively more prominent fat (1725 cm-1) and protein(1650 and 1550 cm-1) peaks), as well as in the results of thechemometric analysis. Good quality spectra are harder to obtainat the highest cooking level, and the spectra become morevariable. This is due to experimental difficulties, in particularof ensuring reproducible contact with the ATR crystal, as thesamples become drier and more particulate.
Internally cross-validated PCA/LDA analysis of the completedata set showed that 174/180 (∼97%) of samples could becorrectly classified as unadulterated or adulterated, irrespectiveof cooking level. We conclude that MIR spectroscopy combinedwith chemometrics has the potential to form the basis of amethod for authenticity screening in cooked meat products.
LITERATURE CITED
(1) Al-Jowder, O.; Kemsley, E. K.; Wilson, R. H. Mid-infraredspectroscopy and authenticity problems in selected meats: afeasibility study.Food Chem.1997, 59(2), 195-201.
(2) McElhinney, J.; Downey, G.; O’Connell, C. Quantitation of lambcontent in mixtures with raw minced beef using visible, near-infrared and mid infrared spectroscopy.J. Food Sci.1999, 587-591.
(3) Jones, S. J.; Patterson, R. L. S. Modified indirect ELISAprocedure for raw meat speciation using crude antispeciesantisera and stabilized immunoreagents.J. Sci. Food Agric.1986,37, 767-775.
(4) Smith, C. J. Applications of immunoassay to the detection offood adulteration. An overview. InFood Safety and QualityAssurance-Applications of Immunoassay Systems; Morgan, M.R. A., Smith, C. J., Williams, P. A., Eds.; Elsevier AppliedScience: London, 1991; pp 13-32.
(5) Sharma, N. K.; Srivatava, V. A.; Gill, J. P. S.; Joshi, D. V.Differentiation of meat from food animals by enzyme assay.Food Control1994, 5, 219-221.
(6) Lumley, I. D. Authenticity of meat and meat products. InFoodAuthentication; Ashurst, P. R., Dennis, M. J., Eds.; Chapmanand Hall: London, 1996; pp 108-139.
(7) Al-Jowder, O.; Defernez, M.; Kemsley, E. K.; Wilson, R. H.Mid-infrared spectroscopy and chemometrics for the authentica-tion of meat products.J. Agric. Food Chem. 1999, 47, 3210-3218.
(8) Kemsley, E. K.; Discriminant Analysis of High-DimensionalData: A Comparison of Principal Components and Partial LeastSquares Data Reduction Methods.Chemom. Intell. Lab. Syst.1996,33 (1), 47-61.
(9) Defernez, M.; Kemsley, E. K. The use and misuse of chemo-metrics for treating classification problems.Trac-Trends Anal.Chem.1997, 16, 2216-221.
(10) Kemsley, E. K.; Holland, J. K.; Defernez, M.; Wilson, R. H.Detection of Adulteration of Raspberry Purees using InfraredSpectroscopy and Chemometrics.J. Agric. Food Chem.1996,44, 3864-3870.
Received for review July 11, 2001. Revised manuscript receivedNovember 6, 2001. Accepted November 21, 2001. R.H.W. and E.K.K.acknowledge the funding of the Biotechnology and Biological SciencesResearch Council (BBSRC) through its competitive strategic grant.
JF0108967
Figure 8. Classification success rate by ICV versus model dimensionality,for 2-group PLS-LDA (applied to complete data set).
Figure 9. ICV predictions of the dummy variable obtained from PLSregression (15-score model).
Adulteration in Cooked Meat Products J. Agric. Food Chem., Vol. 50, No. 6, 2002 1329