detection, formation and reactivity of tetravalent lead corrosion product (pbo … ·...
TRANSCRIPT

DETECTION, FORMATION AND
REACTIVITY OF TETRAVALENT LEAD
CORROSION PRODUCT (PbO2) AND ITS
ROLE IN WATER QUALITY IN DRINKING
WATER DISTRIBUTION SYSTEM
ZHANG YUANYUAN
NATIONAL UNIVERSITY OF SINGAPORE
2012
DETECTION, FORMATION AND REACTIVITY OF
TETRAVALENT LEAD CORROSION PRODUCT
(PbO2) AND ITS ROLE IN WATER QUALITY IN
DRINKING WATER DISTRIBUTION SYSTEM
NAME: ZHANG YUANYUAN
A THESIS SUBMITTED
FOR THE DEGREE OF DOCTOR OF PHILOSOPHY
DEPARTMENT OF CIVIL & ENVIRONMENTAL
ENGINEERING
NATIONAL UNIVERSITY OF SINGAPORE
2012

I
DECLARATION
I hereby declare that the thesis is my original work
and it has been written by me in its entirety. I have
duly acknowledged all the sources of information
which have been used in the thesis.
This thesis has also not been submitted for any degree
in any university previously.
Zhang Yuanyuan
December 2012

II
ACKNOWLEDGEMENTS
I sincerely express my deep gratitude to my advisor Dr. Yi-Pin Lin for his
valuable guidance, support and patience throughout my Ph.D. study in National
University of Singapore.
I would like to thank Mr. Chia Phai Ann, Dr. Yuan Ze Liang and Ms. Khoh Leng
Khim in Department of Chemical and Biomolecular Engineering and Ms. Tan
Teng Jar in Department of Physics for teaching me how to operate SEM, XPS,
BET and XRD.
Special thanks to members of Dr. Lin’s group and the staffs in CEE for their kind
help, valuable suggestion and support.
Appreciation goes to my friends for their support, patience, friendship and
encouragement during my Ph.D. program.
Deeply grateful to my family for their love, faith, encouragement and endless
supporting!!!
Last but not least, the financial support from the National University of
Singapore is acknowledged.
Zhang Yuanyuan

III
TABLE OF CONTENTS
DECLARATION………………………………………………. I
ACKNOWLEDGEMENTS…………………........................... II
TABLE OF CONTENTS……………………………................ III
SUMMARY…………………………………………………..... VI
LIST OF TABLES……………………………………………... VIII
LIST OF FIGURES………………............................................ X
ABBREVIATIONS…………..................................................... XVI
CHAPTER 1 INTRODUCTION AND RESEARCH
OBJECTIVES.............................................................................
1
1.1 Background…..................................................................................
1.2 Objectives….....................................................................................
1.3 Organization of thesis …………….................................................
1
3
6
CHAPTER 2 LITERATURE REVIEW…............................. 7
2.1 PbO2 detection…………….............................................................
2.2 PbO2 formation……………...........................................................
2.3 PbO2 stability………………………..............................................
7
8
8
CHAPTER 3 MATERIALS AND METHODS...................... 17
3.1 Chemicals……................................................................................
3.2 Iodometric method development….................................................
3.3 Lead measurement and recovery tests…….....................................
3.4 PbO2 formation experiments...........................................................
3.5 PbO2 reduction experiments in the presence of NH2Cl and Br-......
3.6 Analytical Methods.........................................................................
17
22
26
29
31
34
CHAPTER 4 FAST DETECTION OF LEAD DIOXIDE
(PbO2) IN CHLORINATED DRINKING WATER BY A
TWO-STAGE IODOMETRICMETHOD................................
35
4.1 PbO2 measurement in the absence of free chlorine………………. 35

IV
4.2 PbO2 measurement in the presence of free chlorine……………...
4.3 Interference of PbCO3 particle…………………………………....
4.4 Interference of Fe2O3 and MnO2 particles………………………..
4.5 PbO2 measurement in chlorinated drinking water………………..
40
42
44
48
CHAPTER 5 IODIDE-ASSISTED TOTAL LEAD
MEASUREMENT AND DETERMINATION OF
DIFFERENT LEAD FRACTIONS IN DRINKING WATER
SAMPLES…………………........................................................
49
5.1 Recovery tests for chlorinated drinking water with low PbO2
concentrations................................................................................................
5.2 Recovery tests for chlorinated drinking water with high PbO2
concentrations................................................................................................
5.3 Total lead measurement using iodide-assisted USEPA method.....
49
52
56
CHAPTER 6 DETERMINATION OF PbO2
FORMATION KINETICS FROM THE CHLORINATION
OF Pb(II) CARBONATE SOLIDS VIA DIRECT PbO2
MEASUREMENT.......................................................................
58
6.1 Influence of Pb(II) solid loading…...............................................
6.2 Influence of initial free chlorine concentration…...........................
6.3 Influence of DIC…….....................................................................
6.4 Influence of pH value………..........................................................
6.5 Determination of rate equations………..........................................
6.6 Stoichiometry of free chlorine consumption and PbO2 formation..
6.7 SEM observations……...................................................................
59
61
62
65
66
69
71
CHAPTER 7 ELEVATED Pb(II) RELEASE FROM THE
REDCUTION OF Pb(IV) CORROSION PRODUCT (PbO2)
INDUCED BY BROMIDE-CATALYZED
MONOCHLORAMINE DECOMPOSITION...........................
74
7.1 Synergistic influences of Br- and NH2Cl concentration on the
reduction of PbO2………………………………….......................................
7.2 Influence of pH value…..................................................................
74
77

V
7.3 Influence of Br- concentration…….................................................
7.4 Influence of initial NH2Cl concentration………............................
7.5 Relationship between NH2Cl decomposition and Pb(II) release....
7.6 Modeling of Pb(II) release..............................................................
79
81
83
87
CHAPTER 8 CONCLUSIONS AND
RECOMMENDATIONS............................................................
90
8.1 Conclusions………………………………………………….........
8.2 Recommendations…………….......................................................
90
93
REFERENCES…….................................................................... 95

VI
SUMMARY
Tetravalent lead corrosion product (PbO2) formed from the chlorination of
lead-containing plumbing materials (LCPMs) has been linked to lead
contamination in drinking water. Despite the importance of PbO2 in lead
contamination is well recognized, several challenges still remain. Quantitative
determination of PbO2 in water samples has been proven difficult due to the
incomplete dissolution of PbO2 in standard sample preservation and acidic
digestion procedure. Due to the limitation in accurate PbO2 measurement, most
studies on its formation were qualitative in nature without providing quantitative
kinetic information. Hence, it is essential to develop a method that can quickly
and accurately detect PbO2 in water samples. The stability of PbO2 tends to be
impacted by constituents present in drinking water. It has been reported that
Pb(II) release from PbO2 is associated with NH2Cl decomposition. It is known
that NH2Cl decomposition can be catalyzed by Br- which is present in many
water supplies. Whether Br--catalyzed NH2Cl decomposition can enhance the
release of lead from PbO2 should be explored.
The objectives of this work were to (1) develop a new method for fast and
accurate detection of PbO2 in drinking water, (2) determinate the mechanism and
kinetics of PbO2 formation from the chlorination of Pb(II) carbonate solids, and
(3) explore the stability of PbO2 in chloraminated water in the presence of Br- to
advance our understanding of the role of PbO2 in lead release in drinking water.
Firstly, a modified iodometric method was developed to detect PbO2 in
water. PbO2 can oxidize iodide to form triiodide (I3-), a yellow-colored anion that
can be detected by the UV-vis spectrometry. Complete reduction of up to 20

VII
mg/L PbO2 can be achieved within 10 min at pH 2.0 and KI = 4 mg/L. A two-
stage method combining the iodometric step and pH adjustment was proposed to
account for the interference of free chlorine presented in water. This approach,
allows free chlorine to completely react with iodide at ambient pH followed by
sample acidification to pH 2.0 to accelerate the iodide oxidation by PbO2. Good
recoveries of PbO2 (90 – 111 %) in chlorinated water samples with a
concentration ranging from 0.01 to 20 mg/L were achieved.
The proposed method was then employed to determine the kinetics of PbO2
formation from the chlorination of hydrocerussite (Pb3(CO3)2(OH)2) and
cerussite (PbCO3). The obtained rate equations suggest that for both Pb(II)
carbonate solids, the formation of PbO2 is first-order with respect to the available
Pb(II) solid surface area, free chlorine concentration and OH- concentration,
respectively. Dissolved inorganic carbon (DIC) was found to inhibit PbO2
formation due to the formation of carbonate-lead surface complexes that protect
the surface Pb(II) sites from oxidation. The rate of PbO2 formation from the
chlorination of hydrocerussite was faster than that of cerussite under the same
Pb(II) solid loading. However, after normalization of the surface area, the rate
constants obtained for both Pb(II) solids are similar. The kinetics of PbO2
formation is elucidated for the first time in this study.
Finally, the stability of PbO2 was investigated in a chloraminated solution
containing bromide. It was found that Br- was able to enhance Pb(II) release
from PbO2 by catalyzing NH2Cl decomposition. A single linear correlation
between the amount of Pb(II) released and the amount of NH2Cl decomposed
either in the absence or presence of Br- was found, suggesting that Br
--catalyzed

VIII
NH2Cl decomposition and NH2Cl auto-decomposition may generate the same
intermediate toward the reduction of PbO2. The modeling of NH2Cl
decomposition and Pb(II) release was also attempted to elucidate the mechanism.
An important implication from the results obtained is that special attention on
lead contamination should be paid to water utilities using brackish water and
desalinated seawater as their source water which may contain relatively high
bromide concentration.
The developed method for PbO2 measurement may allow in-situ PbO2
detection in the distribution system and facilitate the research requiring accurate
PbO2 measurement. This study also provides insights into PbO2 redox chemistry
which may allow water utilities to develop suitable strategies to control lead
contamination and ensure drinking water safety.

IX
LIST OF TABLES
Table 2.1 Models for NH2Cl auto-decomposition.
Table 2.2 Models for Br--catalyzed NH2Cl decomposition.
Table 3.1 UV351 measurements and corresponding concentrations for
free chlorine and monochloramine in the presence of excess
iodide at pH 8.0 and pH 2.0. The results suggest that complete
quenching of free chlorine by iodide can be achieved at pH 8.0
as shown by the consistency of UV351 at pH 8.0 and 2.0. For
monochloramine, complete quenching by iodide cannot be
achieved at pH 8.0. At pH 2.0, the measured UV351 were about
15% more than those measured at pH 8.0.
Table 4.1
Recovery of PbO2 using the USEPA digestion method: 5%
HNO3 and Temp = 85oC. Digestion period was 2 hr.
Table 5.1 Spiked Pb concentrations in the form of Pb2+
and PbCO3 and
determined Pb concentrations in the form of Pb2+
, Pb(II)
carbonate and PbO2 using the proposed procedure and USEPA
method for recovery tests in low PbO2 conditions. Experimental
condition: pH = 7.3, initial free chlorine = 1.5 mg/L as Cl2,
Temp = 25˚C. Recovery of total lead is shown in the
parentheses.
Table 5.2 Spiked and determined Pb concentrations in the form of Pb2+
,
PbCO3 and PbO2 using the proposed method and USEPA
method for recovery tests in high PbO2 conditions.
Experimental condition: pH = 7.3, initial free chlorine = 1.5
mg/L as Cl2, Temp = 25˚C. The values in parentheses are the
recoveries of each lead fraction. Experimental condition: pH =

X
7.3, initial free chlorine = 1.5 mg/L as Cl2, Temp = 25˚C.
Table 7.1 Proposed reactions for the formation of Pb(II) and reactions of
secondary intermediate I*.

XI
LIST OF FIGURES
Figure 2.1 pH-potential diagram for the lead-water-carbonate system.
Condition: Lead species = 0.015 mg/L, dissolved organic carbon
= 10 mg C/L, ionic strength correction = 0.
Figure 2.2 The redox process of reduction of PbO2 in the presence of Fe2+
and Mn2+
.
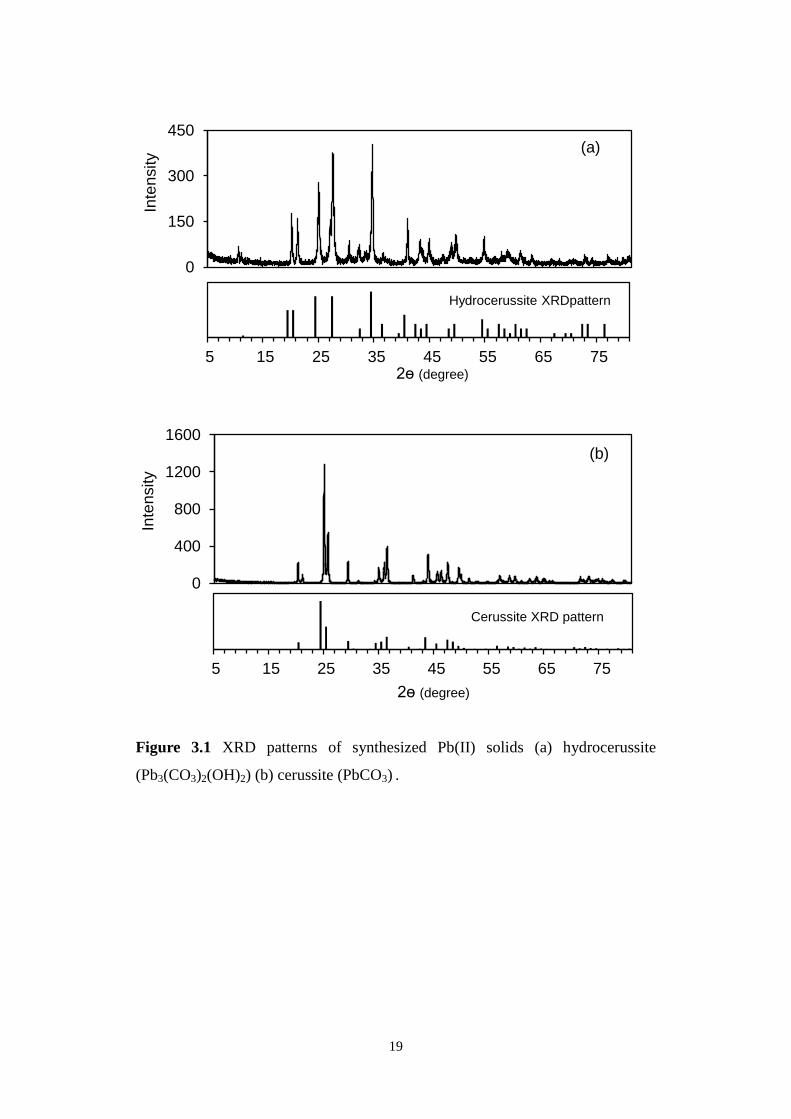
Figure 3.1 XRD patterns of synthesized Pb(II) solids (a) hydrocerussite
(Pb3(CO3)2(OH)2) (b) cerussite (PbCO3).
Figure 3.2 SEM image and XRD pattern of the synthesized PbO2 particles.
Figure 3.3 Graphical illustrations for the concept of the two-stage
iodometric method by showing I3- formation as a function of
time (a) in the absence of free chlorine and (b) in the presence of
free chlorine. In (b), the time zero (t0) refers to the point when
the pH adjustment is made, i.e., 10 sec after KI addition. For the
cases where free chlorine was present, the difference between
the plateau I3- and the initial I3- caused by free chlorine (the
value at t0) was used to determine the PbO2 concentration.
Figure 3.4
Proposed procedures for the determination of different lead
species and total lead concentration.
Figure 3.5
Plot showing the relationship between the spiked and
determined PbO2 concentration in the presence of 571 mg/L of
cerussite or hydrocerussite. Inset shows the data for PbO2 < 0.5
mg/L (2.0 µM).
Figure 3.6 Effect of pH on Pb(II) release as a function of time in the

XII
absence of NH2Cl (a) Br--PbO2 system (b) PbO2-only system.
Experimental condition: PbO2 = 10 mg/L, DIC = 4 mM, Temp =
25 oC.
Figure 4.1
Plots illustrating the effects of pH on PbO2 measurement in the
absence of free chlorine, including (a) typical I3- formation as a
function of time and (b) relationship between spiked and
determined PbO2 concentration. KI = 4.0 g/L (24 mM), Temp =
25 oC. Before acidification, the solution pH was 8.0 and CT = 4
mM. Inset shows the data for PbO2 < 0.5 mg/L. For those with
PbO2 concentration less than 0.2 mg/L, a 10-cm cuvette was
used to measure UV351.
Figure 4.2 Plot illustrating effects of KI concentration on the relationship
between spiked and determined PbO2 concentration. Before
acidifying to pH 2.0, the solution pH was 8.0 and DIC = 4 mM.
Figure 4.3 Plots showing PbO2 measurements in the presence of free
chlorine, including (a) typical I3- formation as a function of time
and (b) relationship between spiked and determined PbO2
concentration in samples containing different concentrations of
free chlorine. Inset shows the data for PbO2 < 0.5 mg/L. KI =
4.0 g/L (24 mM), Temp = 25 oC. Before acidifying to pH 2.0, the
solution pH was 8.0 and DIC = 4 mM.
Figure 4.4 Plot showing effects of PbCO3 particle on the relationship
between spiked and determined PbO2 concentration in the
absence and presence of free chlorine. PbCO3 = 50 mg/L, KI =
4.0 g/L (24 mM). Before acidifying to pH 2.0, the solution pH
was 8.0 and DIC = 4 mM, Temp = 25 oC.
Figure 4.5
Formation of I3- as a function of time resulting from the
oxidation of iodide by (a) PbO2 (b) MnO2 (3) Fe2O3. KI = 4 g/L,

XIII
pH = 2.0. Note the different scales in y-axis.
Figure 4.6 Plots showing formation of I3- as a function of time resulting
from the oxidation of iodide by (a) Fe2O3/PbO2 mixture and (b)
MnO2/PbO2 mixture. KI = 4 g/L, pH = 2.0.
Figure 4.7 Plot showing the relationship between spiked and determined
PbO2 concentration in real drinking water samples. Inset shows
the data for PbO2 < 0.5 mg/L.
Figure 5.1 Relationship between spiked and determined total lead
concentration for low PbO2-containing samples using (a) the
proposed procedure and (b) the USEPA method.
Figure 5.2
Relationship between spiked and determined total lead
concentration for high PbO2-containing samples using (a) the
proposed procedure and (b) the USEPA method.
Figure 5.3 Relationship between spiked and determined total lead
concentration for high PbO2-containing samples using the
iodide-assisted USEPA method.
Figure 6.1 PbO2 formation as a function of time at different Pb(II) solid
loadings. (a) hydrocerussite (b) cerussite. Initial free chlorine =
58.5 µM, DIC = 4 mM, pH 7.0, Temp = 25 oC.
Figure 6.2 Effect of Pb(II) solid loading on the initial PbO2 formation rate.
Initial free chlorine = 58.5 µM, pH 7.0, DIC = 4 mM, Temp = 25
oC.
Figure 6.3 Effect of initial free chlorine concentration on the initial PbO2
formation rate. Pb(II) solids = 286 mg/L, DIC = 4 mM, pH 7.0,
Temp = 25 oC.

XIV
Figure 6.4 Best linear relationships between the initial PbO2 formation rate
and 1/(1+α1β1CT+α2β2CT). Pb(II) solids = 286 mg/L, initial free
chlorine = 59.6 µM, pH 7.0, Temp = 25 oC. The four data points
were obtained at DIC = 1, 2, 4 and 8 mM. At pH 7.0, α1 =
8.2×10⁻¹
and α2 = 3.8×10⁻⁴
. For hydrocerussite, β1 = 102.2
and β2
= 106.4
; for cerussite, β1 = 102.0
and β2 = 106.0
.
Figure 6.5 Effect of [OH-] on the initial PbO2 formation rate corrected by
dividing 1/(1+ α1β1CT+α2β2CT). Pb(II) solids = 286 mg/L, initial
free chlorine = 59.6 µM, DIC = 4 mM, Temp = 25 oC. The data
points were obtained at pH 6, 7, 8 and 9. r represents the initial
PbO2 formation rate. The inset shows the data for [OH-] ≤ 0.1
µM.
Figure 6.6 Relationship between the experimentally measured initial PbO2
formation rates and the calculated initial rates for the
chlorination of (a) hydrocerussite (n = 12) (b) cerussite (n = 13).
Figure 6.7 Plots of PbO2 formation vs. free chlorine consumption in all
experimental conditions. (a) hydrocerussite (n=81) (b) cerussite
(n=91).
Figure 6.8 SEM images of lead particles before and after chlorination. (a)
hydrocerussite before chlorination (b) cerussite before
chlorination (c) hydrocerussite after 24 hr chlorination (d)
cerussite after 24 hr chlorination (e) hydrocerussite after 48 hr
chlorination. Chlorination condition: Pb(II) solids = 428 mg/L,
DIC = 1 mM, pH 9.0, Temp = 25 oC, initial free chlorine = 59.6
µM for (c) and (d), and 90.0 µM for (e), respectively.
Figure 6.9 Photographic images of color changes of particulate samples
before and after chlorination: (a) hydrocerussite before

XV
chlorination, (b) cerussite before chlorination, (c) hydrocerussite
after 24 hr chlorination, and (d) cerussite after 24 hr
chlorination. Pb(II) solids = 428 mg/L, initial free chlorine =
59.6 µM, DIC = 1 mM, pH 9.0, Temp = 25 oC.
Figure 7.1 Synergistic influences of Br- and NH2Cl on Pb(II) release from
PbO2 and NH2Cl decomposition (a) NH2Cl decomposition as a
function of time (b) Pb(II) release from 10 mg/L PbO2 as a
function of time. Experimental condition: DIC = 4 mM, pH 7.0,
Temp = 25 oC.
Figure 7.2 Influence of pH on the Pb(II) release from PbO2 and Br--
catalyzed NH2Cl decomposition as a function of time. (a) NH2Cl
decomposition (b) Pb(II) release. The line represents the result
of modeling. Experimental condition: PbO2 = 10 mg/L, NH2Cl =
~28.0 µM, Br- = 6.3 µM, DIC = 4 mM, Temp = 25
oC. Solid
lines represent modeling results.
Figure 7.3 Influence of Br- concentration on Pb(II) release from PbO2 and
NH2Cl decomposition as a function of time. (a) NH2Cl
decomposition (b) Pb(II) release. Experimental condition:
PbO2= 10 mg/L, NH2Cl = ~28.0 µM, DIC = 4 mM, pH 7.0,
Temp = 25 oC. Solid lines represent modeling results.
Figure 7.4 Influence of initial NH2Cl concentration on Pb(II) release from
PbO2 and NH2Cl decomposition as a function of time. (a) NH2Cl
decomposition (b) Pb(II) release. Experimental condition: PbO2
= 10 mg/L, Br- = 6.3 µM, DIC = 4 mM, pH 7.0, Temp = 25
oC.
Solid lines represent modeling results.
Figure 7.5 Summary plot of NH2Cl decomposition vs. Pb(II) formation in
all experiment conditions.

XVI
Figure 7.6 Effect of pH on the Pb(II) release from PbO2 and NH2Cl
decomposition as a function of time in the absence of Br-. (a)
NH2Cl decomposition, (b) Pb(II) release. Experimental
condition: PbO2 = 10 mg/L, NH2Cl = ~28.0 µM, DIC = 4 mM,
pH 7.0, Temp = 25 oC. Solid lines represent modeling results.
Figure 7.7 Effect of initial NH2Cl concentration on the Pb(II) release from
PbO2 and NH2Cl decomposition as a function of time in the
absence of Br-. (a) NH2Cl decomposition, (a) Pb(II) release.
Experimental condition: PbO2 = 10 mg/L, DIC = 4 mM, pH 7.0,
Temp = 25 oC. Solid lines represent modeling results.

XVII
ABBREVIATIONS
LCPMs Lead-containing plumbing materials
DWDSs Drinking water distribution systems
Pb3(CO3)2(OH)2 Hydrocerussite
PbCO3 Cerussite
PbO2 Lead dioxide
α-PbO2 Scrutinyite
β-PbO2 Plattnerite
USEPA U.S. environmental protection agency
NH2Cl Monochloramine
Cl2/ClO- Free chlorine
LCR Lead and copper rule
LSLs Lead service lines
pH -Log [H+]
DIC Dissolved inorganic carbon
NOM Natural organic matter

XVIII
DOC Dissolved organic carbon
SEM Scanning electron microscope
Fe2+
Ferrous
MnO2 Manganese dioxide
Fe2O3 Iron oxide
Mn2+
Manganous
I- Iodide
Br- Bromide
H+ Hydrogen
OH- Hydroxyl
DBPs Disinfection by-productions
N2 Nitrogen gas
NH3 Ammonia
Cl- Chloride
·NH2 Amidogen radical
HNO3 Nitric acid
AAS Atomic absorbance spectroscopy
XIX
ICP-MS Inductively coupled plasma mass spectroscopy
N2-BET Physical adsorption of nitrogen gas molecules on
a solid surface and serves as the basis for an
important analysis technique for the
measurement of the specific surface area of a
material. In 1938, Stephen Brunauer, Paul Hugh
Emmett, and Edward Teller published an article
about the BET theory in a journal for the first
time. “BET” consists of the first initials of their
family names.
DPD-FAS The N, N-diethyl-p-phenylene diamine (DPD)-
Ferrous ammonium sulfate titration method
VA Voltarmetry
XRD X-ray diffraction
I3- Triiodide
Pb2+
Lead ion
Pb(NO3)2 Lead nitrate
NaOCl Sodium hypochlorite
HCl Hydrochloric acid
NaOH Sodium hydroxyl
NaHCO3 Sodium bicarbonate

XX
KNO3 Potassium nitrate
TOC Total organic carbon
CaCO3 Calcium carbonate

1
Chapter 1
Introduction and Research Objectives
1.1 Background
Lead-containing plumbing materials (LCPMs) including lead service lines,
leaded brass and leaded solders and fixture were commonly used in the drinking
water distribution systems (DWDSs) in the past due to their resistance to
corrosion and malleable nature that minimize fracture and leakage under
changing ground conditions [1]. Lead pipes were used to convey water from
water mainstream to buildings where drinking water is consumed (houses,
apartment, institutional buildings and industrial premises). Although pure lead
pipes have been banned in the 1980s, LCPMs are still in use to convey drinking
water due to the enormous cost and difficulties in complete replacement [2]. It
has been reported that numerous lead service lines (LSLs) are still in use in many
countries, which may result in long-term Pb deposits in premise piping [3].
A series of electrochemical reactions in drinking water can lead to the
formation of lead corrosion products on the surface of LCPMs. Pb(II) solids
including hydrocerussite (Pb3(CO3)2(OH)2) and cerussite (PbCO3) and Pb(IV)
solids including scrutinyite (α-PbO2) and plattnerite (β-PbO2) are the major lead
corrosion products found in the distribution systems with LCPMs [2]. Pb(II)
solids can be oxidized to form Pb(IV) solids in chlorinated drinking water
system. Laboratory studies have demonstrated that PbO2 can be formed via the
chlorination of Pb(II) solids as shown in Eq.(1.1) and Eq.(1.2) [4-7]:
Pb3(CO3)2(OH)2 + 3HOCl + 3OH- → 3PbO2 + 3Cl
- + 2H2CO3 + 2H2O (1.1)
PbCO3 + HOCl + OH- → PbO2 + Cl
- + H2CO3 (1.2)
Pipes scales from lead pigtails and service line collected from several
different drinking water distribution systems during 1980s~1990s showed that
one or both polymorphs of PbO2 (plattnerite (β-PbO2) and scrutinyite (α-PbO2))
were present on the pipe inner surfaces [8]. Pipe specimen from lead service line

2
in Madison, Wisconsin, were found to have a thin layer of continuous PbO2 at
the water interface, with PbCO3 making up the bulk of the underlying scale [9].
PbO2 corrosion scales were also found in pipes employed in Washington, D.C
service lines.
Soluble lead in drinking water mainly arises from the dissolution of lead
corrosion products formed on LCPMs [8, 10-12]. Historically, solubility of
corrosion Pb(II) solids have been considered to regulate soluble lead level in
drinking water [8, 13-15]. However, recent literatures have shown that Pb(IV)
solids play a critical role in lead contamination due to their high oxidation
potential and insoluble nature. Change of redox potential in water may trigger
the release of lead from PbO2. For example, in 2000, Washington, D.C. water
authority started a program to switch residual disinfectant from free chlorine to
monochloramine to control the level of disinfection by-products (DBPs).
Following this shift of disinfectant, high levels of lead were detected in drinking
water during the period of 2001-2003. The highest lead concentration found was
48000 µg/L which is 3000 times higher than the action level of 15 µg/L set by
the USEPA in the 1991 Lead and Copper Rule [16]. PbO2 was found in the
system and the alteration of its stability during the disinfectant changeover was
believed to trigger elevated lead level [10, 11]. Edwards et al. reported that
elevated blood lead levels were found in young children due to consumption of
the contaminated drinking water [17]. This incident compelled government
agencies to review current regulatory needs and water utilities to re-evaluate
their water as a possible source of lead to human exposure. In 2006, tap water in
Durham, North Carolina, was found to contain more than 800 μg/L lead despite
having no lead pipes in the city and leaded solders used in the premise pluming
system were identified as the source of lead [18]. High concentrations of lead
were also found in new buildings constructed in recent years [19].
Due to its low solubility, PbO2 is considered as a good passivation layer
preventing lead release from underneath materials when a sufficient redox
potential is maintained. However, it tends to be reductively dissolved to release
soluble lead into drinking water. Since PbO2 plays a critical role in regulating
lead contamination in drinking water, a precise and fast method for its detection

3
is required to determine its abundance in drinking water sample and assess its
bioavailability. The direct measurement of PbO2 may also facilitate the research
on the quantitative determination of its formation kinetics from chlorination of
Pb(II) solids, which is not achievable currently. NH2Cl is now commonly used in
drinking water distribution systems (DWDSs) to reduce the formation of DBPs.
The decomposition of NH2Cl in water has been found to induce PbO2 reduction
[21]. However, it is unknown whether any reaction that can enhance or catalyze
NH2Cl decomposition may also enhance Pb(II) release from PbO2.
1.2 Objectives
To advance our understanding on the redox chemistry and chemical
behaviors of PbO2 and provide relevant information for developing effective lead
control strategies, a systematic study on the detection, formation and stability of
PbO2 should be conducted. Specific objectives of this thesis are elucidated below
with relevant background:
Objective 1: Develop a simple and fast iodometric method for the detection
of PbO2 in the chlorinated drinking water
Background: Iodide has been previously used as a probe compound to
study the reactivity of PbO2 [20]. The results indicate that PbO2 can oxidize
iodide to form triiodide (I3-) in the excess of iodide and that the reaction rate is
accelerated as the pH decreases. I3- is a yellow-colored anion that can be
qualitatively determined by human eyes and quantitatively measured using a
UV-vis spectrometer [20-23]. Consequently, the iodometric method, which has
been used for the quantification of other strong oxidants such as free chlorine
and monochloramine [24], may be adopted for PbO2 measurement in drinking
water samples. Successful application of the method requires complete reduction
of PbO2 by iodide, while also accounting for oxidation of iodide by the existing
disinfectant. In this study, the effects of pH and iodide concentration on the
complete reduction of PbO2 in the presence and absence of free chlorine were
explored. In addition, possible interference from other particles such as PbCO3,
MnO2 and Fe2O3 that may also be present in water distribution systems were
investigated.

4
Objective 2: Develop and evaluate a new procedure for accurate
measurement of total lead and differentiation of soluble Pb2+
, particulate Pb(II)
carbonate and PbO2 concentrations in drinking water sample.
Background: Triantafyllidou et al. investigated the dissolution of lead-
containing particles in simulated gastric acid to determine their bioavailability
after ingestion and found that 70 % of PbO2 in their samples can be dissolved in
simulated gastric acid [25]. For the same samples, only 40 % of PbO2 can be
dissolved using the USEPA protocol, suggesting that the “missed” lead in the
USEPA method could become bioavailable when ingested. Their results called
for a more accurate method for total lead measurement particularly when PbO2 is
present. It is postulated that by combining the iodometric method and the
commonly used USEPA protocol, it is possible for more accurate quantification
of total lead concentration in drinking water samples containing PbO2. It might
also be possible to differentiate lead species including soluble Pb2+
, particulate
Pb(II) carbonates and PbO2 to provide more insights to diagnose the cause of
lead contamination as well as to assess human exposure.
Objective 3: Quantitatively determine the kinetics of PbO2 formation from
the chlorination of hydrocerussite and cerussite via direct PbO2 measurement
Background: To date, most PbO2 formation studies were conducted by
observing the mineralogical characteristics of formed PbO2 using XRD and SEM.
However, they are all qualitative in nature without providing quantitative kinetic
information directly linked to PbO2 formation. It is believed that the limitation is
aroused from the difficulties in measuring PbO2 concentration using inductively
coupled plasma mass spectrometry (ICP-MS) or atomic absorption spectroscopy
(AAS) due to incomplete dissolution of PbO2 in standard strong acid digestion
[25]. To resolve the analytical challenge, the proposed iodometric method may
make the quantification of PbO2 formation kinetics possible. The kinetics of
PbO2 formation from the chlorination of hydrocerussite and cerussite were
quantitatively determined via direct PbO2 measurement. The effects of Pb(II)
solid concentration, free chlorine concentration, DIC and pH value on the
formation kinetics in environmentally relevant conditions were investigated. The
5
rate equations for PbO2 formation were determined and the stoichiometry of free
chlorine consumption and PbO2 formation was also examined.
Objective 4: Determine and model of the kinetics of lead release from PbO2
reduced by Br-- catalyzed NH2Cl decomposition.
Background: The change of disinfectant from free chlorine to
monochlorine has been shown to alter the stability of PbO2 and trigger high
levels of lead released into drinking water. Lin and Valentine [21] investigated
the reduction of PbO2 in the presence of NH2Cl and found that the amount of
Pb(II) released from PbO2 was proportional to the amount of NH2Cl
decomposed. Since NH2Cl cannot be further oxidized, it was proposed that the
intermediate formed from the auto-decomposition of NH2Cl is capable of
reducing PbO2 to cause Pb(II) release [21]. It was hypothesized that catalyzed
NH2Cl decomposition may further enhance PbO2 reduction, in turn, cause
elevated Pb(II) release. Br- is a known catalyst for NH2Cl decomposition [26-
29]. Reduction of PbO2 in Br--catalyzed NH2Cl decomposition was investigated
to examine the hypothesis, which is important for lead control in systems with
high Br--containing source waters when switching from free chlorine to NH2Cl
for disinfection.

6
1.3 Organization of thesis
The organization of thesis consists of the 8 chapters. In Chapter 1, the
overview and objectives of this thesis were provided. In Chapter 2, literatures
relevant to this study were reviewed. In Chapter 3, the materials and methods
employed were provided. In Chapter 4, a two-stage iodometric method for the
detection of PbO2 in chlorinated water was described. In Chapter 5, a new
procedure for the determination of total lead and differentiation of different lead
species in tap water was evaluated. In Chapter 6, the kinetics of PbO2 formation
from the chlorination of Pb(II) carbonate solids were determined. In Chapter 7,
elevated Pb(II) release from the PbO2 reduction enhanced by the Br--catalyzed
NH2Cl decomposition was demonstrated. In Chapter 8, conclusions and future
works were presented.

7
Chapter 2
Literature Review
2.1 PbO2 detection
Despite the recognition of the important role of PbO2 in lead contamination,
accurately quantitative determination of PbO2 in water samples has been proven
difficult due to the incomplete dissolution of PbO2 in standard sample
preservation and acid digestion procedures [11, 25]. Edwards and Dudi [11]
reported that only 2% of PbO2 particles had dissolved in acidified samples (pH
1.9) after two months of holding time, while the undissolved particles could not
be captured and detected by the subsequent analytical procedures. Nitric acid
digestion, which serves as a sample pre-treatment step prior to atomic
absorbance spectroscopy (AAS) or inductively coupled plasma mass
spectroscopy (ICP-MS) [24], is ineffective in dissolving PbO2 under a normal
digestion period [11, 25]. According to the lead regulation set by USEPA, total
lead in drinking water is regulated. The use of USEPA method (No. 200.8) may
underestimates the actual total lead concentration due to the “miss” of particulate
lead because of (1) settling and attachment of lead particles in the bottle during
sample transfer [25] and (2) incomplete dissolution of particulate lead during
strong acid digestion [11, 25]. This is particular true when PbO2 is present.
Incomplete dissolution of PbO2 in standard acid digestion was believed to be the
main reason for the underestimation of total lead concentration in PbO2-
containing water if a “whole bottle” digestion is employed [11]. Hence, it is
essential to develop a method that can quickly and accurately detect PbO2 in
water samples.
8
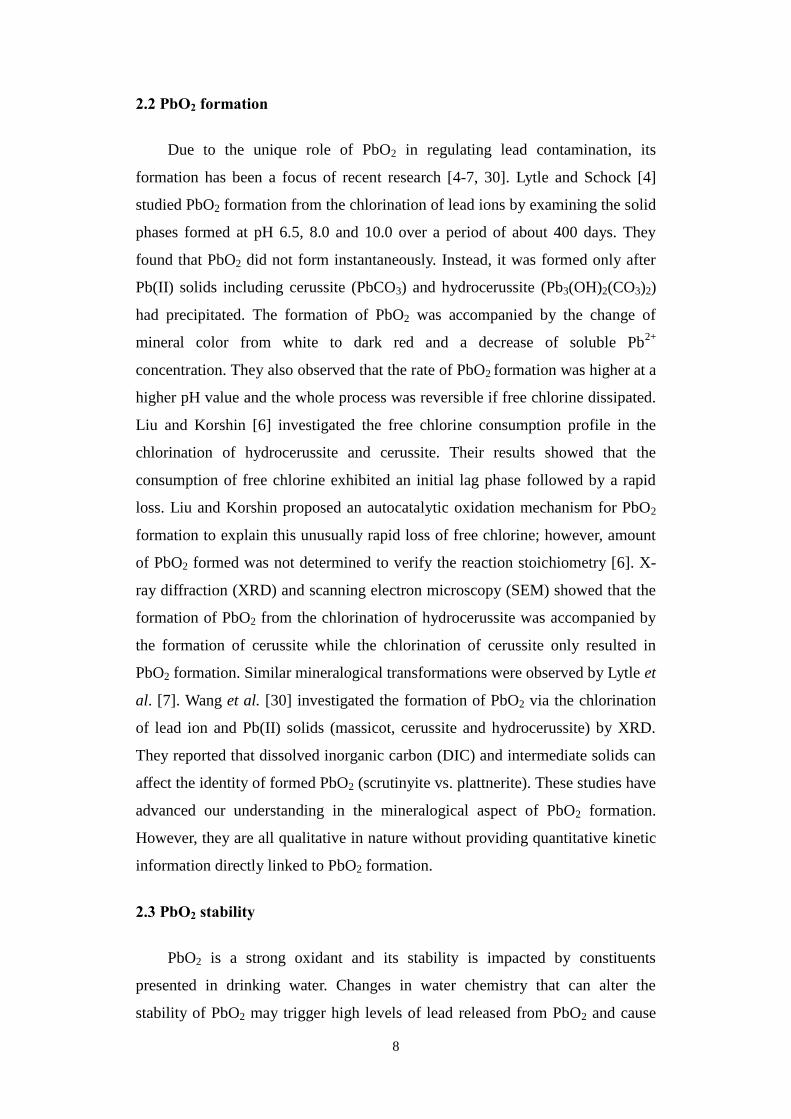
2.2 PbO2 formation
Due to the unique role of PbO2 in regulating lead contamination, its
formation has been a focus of recent research [4-7, 30]. Lytle and Schock [4]
studied PbO2 formation from the chlorination of lead ions by examining the solid
phases formed at pH 6.5, 8.0 and 10.0 over a period of about 400 days. They
found that PbO2 did not form instantaneously. Instead, it was formed only after
Pb(II) solids including cerussite (PbCO3) and hydrocerussite (Pb3(OH)2(CO3)2)
had precipitated. The formation of PbO2 was accompanied by the change of
mineral color from white to dark red and a decrease of soluble Pb2+
concentration. They also observed that the rate of PbO2 formation was higher at a
higher pH value and the whole process was reversible if free chlorine dissipated.
Liu and Korshin [6] investigated the free chlorine consumption profile in the
chlorination of hydrocerussite and cerussite. Their results showed that the
consumption of free chlorine exhibited an initial lag phase followed by a rapid
loss. Liu and Korshin proposed an autocatalytic oxidation mechanism for PbO2
formation to explain this unusually rapid loss of free chlorine; however, amount
of PbO2 formed was not determined to verify the reaction stoichiometry [6]. X-
ray diffraction (XRD) and scanning electron microscopy (SEM) showed that the
formation of PbO2 from the chlorination of hydrocerussite was accompanied by
the formation of cerussite while the chlorination of cerussite only resulted in
PbO2 formation. Similar mineralogical transformations were observed by Lytle et
al. [7]. Wang et al. [30] investigated the formation of PbO2 via the chlorination
of lead ion and Pb(II) solids (massicot, cerussite and hydrocerussite) by XRD.
They reported that dissolved inorganic carbon (DIC) and intermediate solids can
affect the identity of formed PbO2 (scrutinyite vs. plattnerite). These studies have
advanced our understanding in the mineralogical aspect of PbO2 formation.
However, they are all qualitative in nature without providing quantitative kinetic
information directly linked to PbO2 formation.
2.3 PbO2 stability
PbO2 is a strong oxidant and its stability is impacted by constituents
presented in drinking water. Changes in water chemistry that can alter the
stability of PbO2 may trigger high levels of lead released from PbO2 and cause

9
serious lead contamination in drinking water.
Effects of pH value and dissolved inorganic carbon (DIC)
PbO2 possesses a strong oxidation potential as shown in the lead pH-
potential diagram in Figure 2.1 [4].
Figure 2.1 pH-potential diagram for the lead-water-carbonate system. Condition:
Lead species = 0.015 mg/L, dissolved organic carbon = 10 mg C/L, ionic
strength correction = 0 [4].
At neutral and acidic pH values, PbO2 can be reduced by water via the
reaction given in Eq. (2.1) [31]:
2H+ + PbO2 → Pb
2+ + H2O + ½ O2 k =
2
2/1
)(
)(
))((22
H
aqOPb
a
aa (2.1)
where k is reaction equilibrium constant and its value is equal to 106.31
(M-1
) [20,
21].
Lin and valentine [31] studied the release of Pb(II) from water-induced
PbO2 reduction in the carbonate-buffered water at pH 6.0, 7.0 and 8.0. They
reported that the concentration of released Pb(II) from 10 mg/L PbO2 reached
around 200 µg/L after 7 days at pH 6.0 and 60 mg C /L. The released Pb(II)
concentrations were about 40 µg/L and 20 µg/L at pH 7.0 and pH 8.0,
respectively [31]. Xie et al. [32] investigated the pH influence on the rate of
PbO2 dissolution. They found that the rate of PbO2 dissolution increased with the

10
decreasing pH value. They also found that dissolved inorganic carbon can
facilitate lead release from PbO2 by forming lead-carbonate surface complexes
[32]. When the surface reaction reaching equilibrium at pH 7.5, soluble lead-
carbonate species including PbCO3(aq), Pb(CO3)22-
, and PbHCO3+ comprised 61 %
and 86 % of the total dissolved lead at 10 mg C/L and 50 mg C/L, respectively.
At pH 10, these three soluble Pb(II)-carbonate species comprised 17–26 % of the
total dissolved lead. The percentage of these three soluble species decreased with
the increasing pH values, indicating that soluble lead-hydroxide complexes (i.e.
PbOH+ and Pb(OH)2(aq)) may form and increase with increasing pH from 8.5 to
10 at low DIC levels [32, 33]. Similar function of carbonate was reported for the
surface complexation on goethite [34] and UO2 [35].
Effects of natural organic matter (NOM)
NOM is ubiquitous in natural water. It is well known that it can serve as a
reductant in redox reactions [29-32]. Recent studies have shown that NOM is
capable of inducing reductive dissolution of PbO2 [20, 23, 31, 36, 37]. Dryer and
Korshin [37] investigated the kinetics of PbO2 reduction by natural organic
matter (NOM) isolated from Potomac River water. The rate of released Pb
increased with the increasing dissolved organic carbon (DOC) concentration. Lin
and Valentine [31] investigated the release of Pb(II) from PbO2 in the presence of
NOM extracted from the Iowa river for a 28 day period. They found that the rate
of Pb(II) release from PbO2 increased with the increasing NOM concentrations
and decreasing pH value. Pre-chlorination of NOM was found to reduce the rate
of lead release, suggesting that oxidation of functional groups in NOM can
minimize lead release from PbO2 [31]. They also found that the surface
morphologies of exposed PbO2 solids in control experiment and in the presence
of 1 mg/L of NOM were similar to those of original reagent-grade PbO2,
indicating that exposure to NOM at this low concentration for 28 days did not
significantly change the surface morphology. For NOM concentration equal to or
more than 5 mg/L, the sharp and jagged edges of PbO2 become round and
particles seemed to “melt” together, suggesting that the edges of PbO2 particles
are more easier to be attack by NOM than flat cleavage planes, probably due to
their higher surface energy [31]. Zhi and Stone [36] identified that

11
hydroquinones can be the functional groups responsible for PbO2 reduction.
Interestingly, they also found that several subcomponents in NOM, such as
malonic acid, quinic acid, trehalose alginic acid and polygalacturonic acid,
actually inhibited lead release by adsorption on the PbO2 surface to keep
reductants away from PbO2.
Effects of reductive ions (Fe2+
, Mn2+
, I- and Br
-)
Fe2+
and Mn2+
: The release of Fe2+
from iron-containing pipe materials can
happen in drinking water distribution systems due to iron corrosion [38, 39].
Corrosion scales or tubercules covering pipe surfaces are rich in Fe2+
and provide
possible sites for the reduction of PbO2 to cause Pb(II) release into drinking
water [40].
Zhi and Stone reported the PbO2 can be reduced by Fe2+
to form Pb2+
at pH
3.0-8.5 and this reaction is retarded by the adsorption of formed Pb2+
or the
precipitation of Fe(III) (hydro)oxides on the PbO2 surfaces at pH > 5 [40]. Zhi
and Stone also observed that PbO2 can be reduced by Mn2+
and the formed
Mn(III)/Mn(IV) (hydro) oxides showed less impediment on release of Pb(II)
from PbO2. When Fe2+
and Mn2+
simultaneously existed, Fe2+
was able to reduce
not only PbO2, but also Mn(III)/Mn(IV) (hydro)oxides [40]. The redox reactions
involved in these processes are shown in Figure 2.2.
Figure 2.2 The redox process of reduction of PbO2 in the presence of Fe2+
and
Mn2+
[37].
I-
: Iodide has been found in drinking water even though at low
concentrations. I- can be thermodynamically oxidized by PbO2 considering the
Fe(II)
Fe(III)(OH)3
Fe(III)OOH(s)
Mn(IV)O2(s)
Mn(III)OOH(s)
Mn(II)
Pb(II)
PbO2

12
redox potentials of PbO2/Pb2+
(EH0 = 1.45 v) and I3
-/I
- (EH
0 = 0.54 v). The redox
half reaction of PbO2 and I- can be described by following reactions:
PbO2 reduction: 4H+ + PbO2 + 2e
- → Pb
2+ + 2H2O (2.2)
I- oxidation: I
- + H2O → HOI + 2e
- + H
+ (2.3)
In the presence of excess of I-, HOI can be converted to I3
-:
I- + HOI + H
+ ↔ I2 + H2O (2.4)
I-+I2 ↔I3
- (2.5)
Lin and Valentine [20] used iodide as a probe to investigate the reactivity of
PbO2 in water and found that the rate of I3- formation is proportional to the
concentration of PbO2 loading, I- and H
+. They reported that the presence of
buffer (phosphate, carbonate) facilitate the I-_
induced PbO2 reduction via the
formation of Pb(II)-Phosphate or Pb(II)-Carbonate complexes that can
accelerate the breakdown of transient complex of between Pb(II) and iodine.
Br-: Bromide is widely present in water supplies in coastal areas due to
seawater intrusion. In chlorinated drinking water, bromide can lead to the
formation of brominated DBPs, such as bromoacetic acid and bromoform [41-
43]. It has been shown that PbO2 is able to oxidize Br- in acidic solutions as
shown below [44]:
PbO2 + 2Br- + 4H
+ → Pb
2+ + Br2 + 2H2O (2.6)
The reduction rate was found to increase with the increasing PbO2
concentration and decreasing pH value. Lin and Valentine [44] postulated that
two consecutive one-electron transfer reactions facilitate the reduction of PbO2.
Effects of free chlorine
PbO2 is formed from the chlorination of Pb(II) corrosion solids and is stable
in the presence of free chlorine that can maintain a high redox potential. Lytle
and Schock [4] found that PbO2 can be formed from the chlorination of Pb(II)
ions with Pb(II) solids as the transient products and this reaction was reversible if
free chlorine was allowed to dissipate. Lin and Valentine [20] reported that the

13
presence of free chlorine suppressed the release of Pb(II) from NOM-induced
PbO2 reduction until the free chlorine was exhausted.
Effects of monochloramine
PbO2 has been identified as the mineral phase responsible for the high levels
of lead found in drinking water during the switch of disinfectant from fee
chlorine to monochloramine. Thus, the relationship between PbO2 stability and
NH2Cl decomposition has been a focus of recent research.
Monochloramine is a weaker oxidant than free chlorine and can go auto-
decomposition to generate nitrogen, ammonia, chloride as final products via a set
of reactions shown in Table 2.1 [26, 27, 45, 46]. There are several unidentified
intermediates formed during the auto-decomposition. The only intermediate that
has been confirmed is amidogen radical (·NH2) [47]. These intermediates are
expected to react with constituents in water.

14
Table 2.1 Models for NH2Cl auto-decomposition [45, 46].
No. Reaction Rate constant at 25oC
1. HOCl + NH3 → NH2Cl + H2O k1 = 1.5 × 10¹⁰
M-1
h-1
2. NH2Cl + H2O → HOCl + NH3 k2 = 7.6 × 10⁻²
h-1
3. HOCl + NH2Cl → NHCl2 + H2O k3 = 1.0 × 10⁶ M
-1h
-1
4. NHCl2 + H2O → HOCl + NH2Cl k4 = 2.3 × 10⁻³
h-1
5. NH2Cl + NH2Cl → NHCl2 + NH3 kd*
6. NHCl2 + NH3→ NH2Cl + NH2Cl k6 = 2.2 × 10⁸ M
-2h
-1
7. NHCl2 + H2O → I* k7 = 4.0 × 10⁵ M
-1h
-1
8. I* + NHCl2 → HOCl + Products k8 = 1.0 × 10⁸ M
-1h
-1
9. I* + NH2Cl →Products k9 = 3.0 × 10⁷ M
-1h
-1
10. NH2Cl + NHCl2 → Products k10 = 55.0 M-1
h-1
11. HOCl ↔ H+ + OCl
- pKa = 7.5
12. NH4+ ↔ NH3 + H
+ pKa = 9.3
13. H2CO3 ↔ HCO3- + H
+ pKa = 6.3
14. HCO3- ↔ CO3
-2 + H
+ pKa = 10.3
I* denotes the intermediates from NH2Cl auto-decomposition
Temperature dependencies of reaction rate and equilibrium constants
k1 = 2.37 × 10¹²
exp(-1510/T) M-1
h-1
k2 = 6.7 × 10¹¹
exp(-8800/T) M-1
h-1
k3 = 1.08 × 10⁹
exp(-2010/T) M-1
h-1
kd* = kH[H
+] + kHCO3[HCO3
-] + kH2CO3[H2CO3]
kH = 3.78 × 10¹⁰
exp(-2169/T) M-2
h-1
kHCO3 = 1.5 × 1035
exp(-22144/T) M-2
h-1
kH2CO3 = 2.95 × 1035
exp(-4026/T) M-2
h-1
HOCl → H+ + OCl
-, pKa = 1.18×10
-4 (T)
2 - 7.86×10
-2(T) + 20.5
NH4+
→ NH3 + H+, pKa = 1.03×10
-4 (T)
2 – 9.21×10
-2(T) + 27.6
H2CO3 → HCO3- + H
+, pKa = 1.48×10
-4 (T)
2 – 9.39×10
-2(T) + 21.2
HCO3- → CO3
-2 + H
+,
pKa = 1.19×10⁻⁴
(T)2
– 7.99×10⁻²
(T) + 23.9

15
In NH2Cl auto-decomposition, the intermediates might exist at the pseudo-
steady state at extremely low concentrations. Lin and Valentine [21] investigated
the release of Pb(II) from PbO2 induced by NH2Cl auto-decomposition under
various initial NH2Cl concentrations, solution pH values, DIC and Cl/N molar
ratios. They hypothesized that the reduction of PbO2 could be attributed to the
reaction involving an unidentified intermediate produced in the NH2Cl auto-
decomposition. They reported that the water chemistry parameters that
accelerated the auto-decomposition of NH2Cl, including the higher initial NH2Cl
concentration, lower solution pH, higher DIC and higher Cl/N ratio, can in turn
promote the formation of Pb(II) [21]. Their investigation indicated that the rate
of Pb(II) formation was positive proportional to the overall rate of NH2Cl auto-
decomposition, supporting the hypothesis that the unidentified intermediate
formed in NH2Cl decomposition is capable of reducing PbO2 [21]. Br-, a
common ion in natural water, is a known catalyst for NH2Cl decomposition. In
fresh water, Br- concentration usually ranges from trace amount to up to 0.5
mg/L. Specially, in saline water, Br- concentration can be up to 65 mg/L, which
is reduced to 0.6 mg/L after reverse osmosis desalination for drinking purpose
desalination [48]. Br--catalyzed NH2Cl decomposition proceeds via a series of
reactions as shown in Table 2.2. This study raises the question that whether Br-
that can catalyze NH2Cl decomposition, can also enhance the rate of PbO2
reduction.

16
Table 2.2. Models for Br--catalyzed NH2Cl decomposition [29, 49].
NO. Reaction Rate constant
1. NH2Cl + H+ ↔NH3Cl
+ K = 28 M
-1
2. NH3Cl+
+ Br- → NH2Br + Cl
- + H
+ kBr = 1.8 × 10
8 M
-1h
-1
3. NH2Cl + NH3Br+ → NHBrCl + NH4
+
4. HOCl + Br- → HOBr + Cl
- kHOCl = 5.1 × 10
5 M
-1h
-1
5. HOBr + NH2Cl → NHBrCl + H2O
6. NHBrCl + NH2Cl → N2 + Br- +Cl
- + 3H
+

17
Chapter 3
Materials and Methods
3.1 Chemicals
3.1.1 Commercial chemicals
All analytical grade particles including PbO2, PbCO3, MnO2 and Fe2O3,
were purchased from Sigma-Aldrich. Specific surface areas of PbO2, PbCO3,
MnO2 and Fe2O3, determined using the seven-point N2-BET, were 7, 4, 3 and 8
m2/g, respectively. Pb(NO3)2 (Sigma-Aldrich) was used as the source of Pb
2+.
Free chlorine solutions were prepared by diluting a ~4 % NaOCl stock solution
(Sigma-Aldrich). Monochloramine solutions were prepared by diluting a stock
NH2Cl solution (~280 mg/L as Cl2), which was freshly prepared by adding the
NaOCl stock solution to a carbonate-buffered ammonium chloride solution [27].
Concentrated HNO3 stock solution (Sigma-Aldrich) was used in acid digestion.
NaHCO3 (Nacalai Tesque) was used as the source of DIC. Na3PO4·12H2O
(Merck) was used as the source of orthophosphate. Analytical grade KNO3
(Sigma-Aldrich) was used to adjust ionic strength. KBr (Fisher Scientific) was
used as the source of Br-. 1 N HCl and NaOH were employed to adjust the
solution pH value. Ultra-pure water obtained from a Millipore DirectQ system
was used to prepare all experimental solutions.

18
3.1.2 Laboratory synthesis of hydrocerussite and cerussite
Hydrocerussite and cerussite were synthesized by adding 0.1 M Pb(NO3)2
(Sigma-Aldrich) to 0.1 M NaHCO3 (Nacalai Tesque) at pH 9.0 and pH 7.0,
respectively. In both conditions, white solids quickly precipitated. After mixing
for 2 hrs, the white slurry was transferred to several 50 mL polypropylene tubes
and centrifuged at 6000 rpm (g-force = 7144 g) for 6 min using a Jouan B4i
multifunction centrifuge (Thermo). The solids were collected and transferred to
dialysis membrane (Spectrumla/Por) sitting in an ultra-pure water bath for 3 days
with regular change of ultra-pure water. The final dry solids were obtained by
freeze-drying. The solids were verified by XRD with Cu-Κα radiation (X'Pert
PRO, PANalytical) to be pure hydrocerussite and cerussite (Figure 2.1). Their
specific surface areas were 6.2 and 0.8 m2/g, respectively.
19
Figure 3.1 XRD patterns of synthesized Pb(II) solids (a) hydrocerussite
(Pb3(CO3)2(OH)2) (b) cerussite (PbCO3) .
0
150
300
450In
ten
sity (a)
0
400
800
1200
1600
Inte
nsity
(b)
5 15 25 35 45 55 65 752ɵ (degree)
Hydrocerussite XRDpattern
5 15 25 35 45 55 65 75
2ɵ (degree)
Cerussite XRD pattern
20
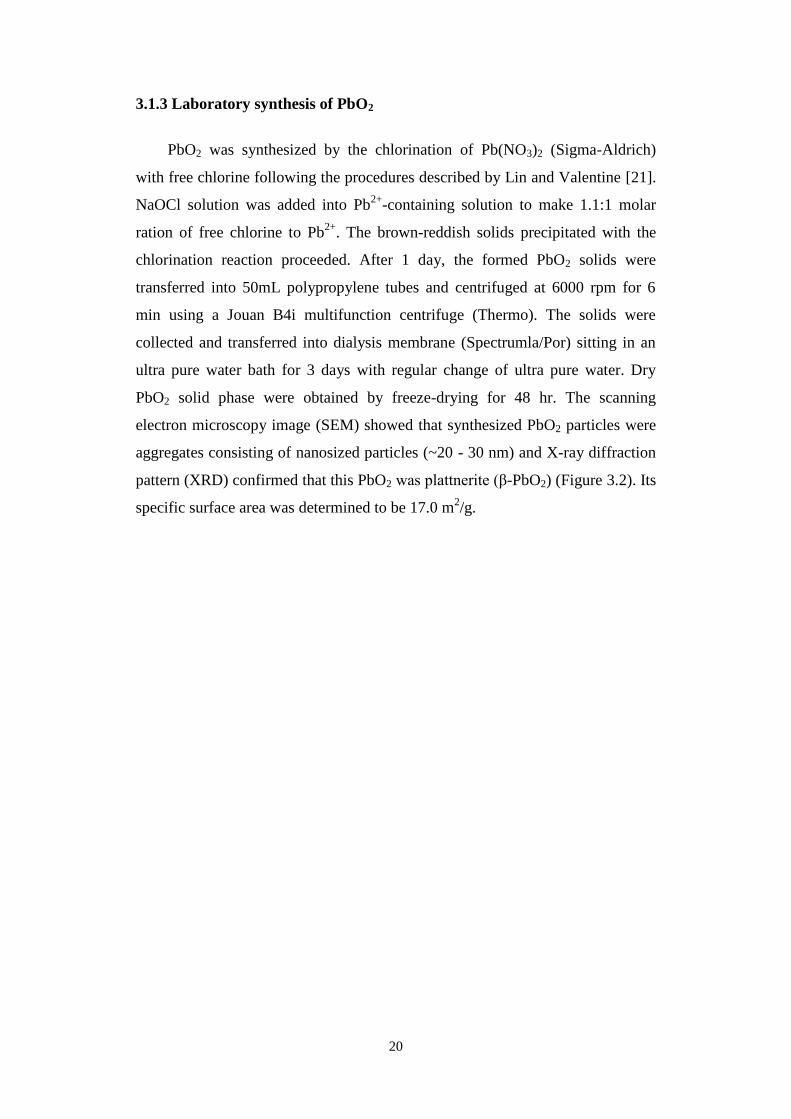
3.1.3 Laboratory synthesis of PbO2
PbO2 was synthesized by the chlorination of Pb(NO3)2 (Sigma-Aldrich)
with free chlorine following the procedures described by Lin and Valentine [21].
NaOCl solution was added into Pb2+
-containing solution to make 1.1:1 molar
ration of free chlorine to Pb2+
. The brown-reddish solids precipitated with the
chlorination reaction proceeded. After 1 day, the formed PbO2 solids were
transferred into 50mL polypropylene tubes and centrifuged at 6000 rpm for 6
min using a Jouan B4i multifunction centrifuge (Thermo). The solids were
collected and transferred into dialysis membrane (Spectrumla/Por) sitting in an
ultra pure water bath for 3 days with regular change of ultra pure water. Dry
PbO2 solid phase were obtained by freeze-drying for 48 hr. The scanning
electron microscopy image (SEM) showed that synthesized PbO2 particles were
aggregates consisting of nanosized particles (~20 - 30 nm) and X-ray diffraction
pattern (XRD) confirmed that this PbO2 was plattnerite (β-PbO2) (Figure 3.2). Its
specific surface area was determined to be 17.0 m2/g.

21
Figure 3.2 SEM image and XRD pattern of the synthesized PbO2 particles.
0
50
100
150
Inte
nsity
XRD pattern of the synthesized PbO2
5 15 25 35 45 55 65 75
2ɵ˚
Standard pattern of plattnerite

22
3.2 Iodometric method development
The iodometric method for detecting PbO2 was first developed using
synthetic solutions without free chlorine. Secondly, we developed a procedure to
measure PbO2 in chlorinated samples. A model solution with a total carbonate
concentration (CT) of 4 mM and a pH of 8.0 was prepared for both conditions.
Experiments were conducted at 25 oC using either a 50 mL (PbO2 < 0.2 mg/L) or
1 L (PbO2 > 0.2 mg/L) glass beaker. The solution was mixed using a magnetic
stir bar at 200 rpm.
In the absence of free chlorine, the effects of pH (pH 2.0, 3.0 and 4.0) and
iodide concentration (KI = 0.05 - 4.0 g/L or 3 - 24 mM) on the rate of complete
PbO2 reduction were examined. After a pre-determined amount of PbO2 was
spiked, the solution was acidified by 1 M HCl to the desired pH, followed by
addition of KI. An aliquot (3 mL for 50 mL experimental solution and 15 mL for
1 L experimental solution) was sampled from the solution periodically and
measured for its UV absorbance at 351 nm to determine the I3- concentration.
Since UV absorbance measurement was non-destructive, the sample was
returned to the reactor after each analysis to maintain a constant solution volume
throughout the experiment. The measurement was conducted for up to 20 min or
until a plateau value was reached. In separate control experiments without KI
addition, the spiked PbO2 did not contribute significantly to UV351. It was found
that 20 mg/L of PbO2, the highest concentration employed in this study, only
caused an absorbance of 0.006 cm-1
at 351 nm. This absorbance eventually faded,
due to the reductive dissolution of PbO2 following the addition of KI. The
optimal solution pH and KI concentration were determined and used for
subsequent method development in the presence of free chlorine.
The same model solution spiked with different concentrations of free
chlorine was then employed. At neutral to slightly alkaline pH values, free
chlorine can quickly oxidize iodide to form I3- in the presence of the highly
excess of iodide [24], while the oxidation of iodide by PbO2 is relatively slow
[20]. To account for the presence of free chlorine, KI was added first to react
with free chlorine for approximately 10 sec at ambient pH (pH 8.0). After
UV351 was recorded, the solution was quickly acidified to the optimal acidic pH

23
determined from the disinfectant-free condition. UV351 was continuously
recorded for up to 20 min or until a plateau was reached. PbO2 concentrations
ranging from 0.01 to 20 mg/L were employed to test PbO2 recovery.
I3-
formation in the absence and presence of free chlorine over times is
shown in Figure 3.3. The plateau value of I3-, which is indicative of the complete
reaction, was used to determine the concentration and recovery of PbO2 based on
the 1:1 stoichiometry between PbO2 and I3-.

24
Figure 3.3 Graphical illustrations for the concept of the two-stage iodometric
method by showing I3- formation as a function of time (a) in the absence of free
chlorine and (b) in the presence of free chlorine. In (b), the time zero (t0) refers to
the point when the pH adjustment is made, i.e., 10 sec after KI addition. For the
cases where free chlorine was present, the difference between the plateau I3- and
the initial I3- caused by free chlorine (the value at t0) was used to determine the
PbO2 concentration.
I3- formed due to free chlorine
(measured before acidification)
I 3- c
on
ce
ntr
atio
n
Time
(b) In the presence of free chlorine
(a) In the absence of free chlorine
I3- formed due to PbO2
0
I3- formed due to PbO2
0

25
In chloraminated water, the complete oxidation of iodide by
monochloramine cannot be achieved at neutral to slightly alkaline pH [24]. Thus,
it was anticipated that the proposed method may induce a positive interference
for PbO2 detection in the presence of monochloramine. Preliminary experiments
confirmed that the reaction between monochloramine and iodide could not be
completed in our experimental solution, shown in Table 3.1. The determination
of PbO2 in chloraminated solution was therefore not further investigated.
However, an alternative was proposed later for PbO2 detection in chloraminated
water.
Table 3.1 UV351 measurements and corresponding concentrations for free
chlorine and monochloramine in the presence of excess iodide at pH 8.0 and pH
2.0. The results suggest that complete quenching of free chlorine by iodide can
be achieved at pH 8.0 as shown by the consistency of UV351 at pH 8.0 and 2.0.
For monochloramine, complete quenching by iodide cannot be achieved at pH
8.0. At pH 2.0, the measured UV351 were about 15% more than those measured
at pH 8.0.
Free chlorine Monochloramine
pH=8 pH=2 pH=8 pH=2
UV351
Free chlorine
(mg/L as Cl2) UV351
Free chlorine
(mg/L as Cl2) UV351
NH2Cl
(mg/L as Cl2) UV351
NH2Cl
(mg/L as Cl2)
0.171 0.48 0.171 0.48 0.168 0.47 0.193 0.54
0.167 0.46 0.165 0.46 0.168 0.47 0.195 0.54
0.272 0.76 0.272 0.76 0.238 0.66 0.277 0.77
0.262 0.73 0.263 0.73 0.232 0.65 0.273 0.76
0.491 1.37 0.487 1.36 0.511 1.42 0.584 1.63
0.487 1.36 0.486 1.35 0.509 1.42 0.591 1.65
1.027 2.86 1.027 2.86 1.229 3.42 1.417 3.95
1.018 2.83 1.016 2.83 1.226 3.41 1.409 3.92
1.610 4.48 1.614 4.49 1.431 3.98 1.658 4.62
1.591 4.43 1.593 4.44 1.425 3.97 1.643 4.57
To test the applicability of the proposed method for PbO2 quantification in
chlorinated drinking water, water collected from a local water treatment plant
was used in spike experiments. Because the water treatment plant utilizes
monochloramine for secondary disinfection, water was collected before
chloramination. The water characteristics were as follows: pH = 6.4, TOC = 1.3
mg/L, alkalinity = 28 mg/L as CaCO3, and Ca2+
= 38 mg/L as CaCO3.
Chlorination and pH adjustment were performed in our laboratory to reconstitute

26
the water with 1.6 mg/L as Cl2 free chlorine and a final pH of 8.0. No visible
particle was found in the water.
3.3 lead measurement and recovery tests
A new procedure that integrates membrane separation, iodometric PbO2
measurement, strong acid digestion and ICP-MS is proposed for the accurate
determination of total lead concentration and the differentiation of soluble Pb2+
,
particulate Pb(II) carbonate and PbO2 in drinking water samples. The step-by-
step procedure is shown in Figure 3.4. After the collection of water samples, a
0.2 mm pore size disk membrane filter (Whatman) is used to separate soluble
and particulate lead. Soluble lead was determined by ICP-MS using filtrate (step
(A)). Lead particles collected by the membrane filter are washed into a glass
beaker containing 100 mL ultrapure water. Wang et al. showed that the 0.2 mm
pore size membrane can effectively retain aggregates of nano-sized PbO2
particles [30]. Preliminary spike experiments showed 88 - 91% recoveries for
spiked PbO2 (0.24 - 1.13 mg Pb/L) using the 0.2 mm pore size membrane. It is
expected that the iodometric determination of PbO2 (step (B)) can dissolve PbO2
to produce soluble Pb2+
. Strong acid digestion is then performed to dissolve all
remaining particulates if any, followed by ICP-MS measurement for total
particulate Pb (step C). Then, the sample was used It was found in preliminary
experiments that I3- formed from the oxidation of iodide by PbO2 can interfere
with the ICP-MS measurement due to unidentified reasons. Since I3-
can
decompose to I- and I2, it is removed from the solution via hot plate heating to
promote the decomposition and evaporation of I2 until a colorless solution is
obtained before ICP-MS measurement.

27
Figure 3.4 Proposed procedures for the determination of different lead species
and total lead concentration.
Water sample containing Pb2+
,
particulate Pb(II) carbonate and PbO2
Filtered by 0.2 µm pore
size membrane
Filtrate acidified to pH < 2
with HNO3
Particles retained by the 0.2 µm pore
size membrane
Soluble Pb2+
measured by ICP-MS
(A) Iodometric method for PbO2 measurement
(B)
Total particulate Pb measured by ICP-MS
(Sum of particulate Pb(II) and PbO2)
(C)
5% nitric acid digestion of the whole sample at
85 oC until the solution turns colorless
Soluble Pb2+
= (A) Total particulate Pb = (C)
PbO2 = (B) Particulate Pb(II) carbonate = (C) – (B)
Total lead = Soluble Pb + Total particulate Pb
= (A) + (C)

28
Tap water collected from our laboratory was used in the recovery tests. It
was reconstituted to contain 1.5 mg/Lof free chlorine as Cl2 to simulate the
typical disinfectant concentration in a chlorinated system. The characteristics of
the reconstituted tap water are as follow: pH = 7.3, free chlorine = 1.5 mg/Las
Cl2, TOC = 0.9 mg/L, alkalinity = 13 mg/Las CaCO3, and Ca2+
= 16 mg/L as
CaCO3. The recovery tests were conducted using spiked Pb2+
, spiked PbCO3 and
in situ formed or spiked PbO2. In situ formed PbO2 was used to simulate water
samples containing low concentrations of PbO2 (0.018 - 0.076 mg Pb/L), while
spiked PbO2 was used to simulate high PbO2 conditions (0.089 - 1.316 mg Pb/L).
The solution compositions for these two conditions are shown in Table 5.1 and
Table 5.2, respectively. For most recovery tests, two samples were prepared such
that one was used for the proposed procedure and the other was used for the
USEPA method to allow head-to-head comparisons. For all samples used for the
USEPA method, 5% nitric acid digestion was employed.
For the in situ formed PbO2 tests (low PbO2 concentrations), initially spiked
Pb2+
(0.030 - 0.420 mg Pb/L) was allowed to react with free chlorine to form
PbO2 at 25 °C for 7 days in 300 mL gas-tight polyethylene vessels. These vessels
were sealed without headspace, covered by aluminum foil to prevent light-
induced free chlorine decay and placed on a shaker rotating at 200 rpm. After 7
days, PbCO3 (0.017 - 0.835 mg Pb/L) was added to make the solution contain
Pb2+
, particulate Pb(II) carbonate and PbO2. In addition to reacting with free
chlorine to form PbO2, the initially spiked Pb2+
may precipitate to form Pb(II)
carbonate solids if the Pb2+
concentration exceeded their solubility limits. This
was taken into account for the data interpretation. For the spiked PbO2 tests (high
PbO2 concentrations), commercially available PbO2 was used and experiments
were conducted using a 100 mL glass beaker. All solutions were analyzed
immediately after the spike of Pb2+
, PbCO3 and PbO2.
To examine whether the USEPA method can be improved in the total lead
measurement for PbO2-containing samples via the addition of iodide, additional
experiments were conducted by dosing 4 g/L of KI before acid digestion to
dissolve PbO2. The samples were heated to become colorless prior to ICP-MS
measurement.

29
3.4 PbO2 formation experiments
The formation of PbO2 from the chlorination of hydrocerussite and cerussite
can be expressed by Eq. (1.1) and (1.2), respectively.
The effects of Pb(II) solid loading (71 - 571 mg/L or 92 - 736 µM of
hydrocerussite and 71 - 429 mg/L or 266 - 1605 µM of cerussite), initial free
chlorine concentration (1.1 - 4.2 mg/L as Cl2 or 15.4 - 59.6 µM), pH value (6.0 -
9.0) and DIC (1 - 8 mM) on the kinetics of PbO2 formation were investigated.
All experiments were conducted using 70 mL gas-tight polyethylene vessels
at 25oC for 24 hr. These vessels were sealed without head space and covered by
aluminum foil to prevent the light-induced free chlorine decay. These vessels
were placed on a shaker rotating at 200 rpm to ensure a complete mixing during
the course of the experiment. One vessel was sacrificed each time for the
measurements of PbO2 concentration and free chlorine residual. The variation of
pH value before and after each experiment was found to be within 0.2 pH unit.
The initial PbO2 formation rate was determined using the initial slope of PbO2
formation vs. time curve, typically using the first 3-4 data points that showed the
linear relationship with a coefficient of correlation greater than 0.90.
The formed PbO2 was measured following our developed iodometric
method with slight modifications [50]. The lead particles (containing both Pb(II)
and PbO2 particles) were collected by a 0.2 µm pore size disk membrane filter
(Whatman) and washed with 1 mM nitric acid solution. The particles were then
transferred to a beaker containing 70 mL of ultra-pure water. A desired amount
of KI (0.1 - 1.0 g/L) was added and the pH value was adjusted to 2.0 by 1 N HCl
to allow the oxidation of I- by PbO2 according to the Eq. (2.2). I3
- concentration
was measured after 10 min using the solution passing through a 0.2 µm pore size
PTFE syringe filter (Titan) to quantify the PbO2 concentration based on the 1:1
stoichiometry. Pb(II) solids were rejected by the filter and did not interfere with
PbO2 measurement in the above procedures. Preliminary spike experiments
conducted in the presence of 571 mg/L cerussite or hydrocerussite, the highest
Pb(II) solid loading employed in this study, showed 89 - 109 % recoveries for
0.01-11.9 mg/L (0.04 - 49.8 µM) of spiked PbO2 (Figure 3.5).

30
Figure 3.5 Plot showing the relationship between the spiked and determined
PbO2 concentration in the presence of 571 mg/L of cerussite or hydrocerussite.
Inset shows the data for PbO2 < 0.5 mg/L (2.0 µM).
0
10
20
30
40
50
0 10 20 30 40 50
Dete
rmin
ed
Pb
O2 (
µM
)
Added PbO2 (µM)
KI = 0.1 mg/L, cerussite = 571 mg/LKI = 0.5 mg/L, cerussite = 571 mg/LKI= 1.0 mg/L, cerussite = 571 mg/LKI = 0.1 mg/L, hydrocerussite = 571 mg/LKI= 1.0 mg/L, hydrocerussite = 571 mg/L1:1 line for 100% recovery
0.0
0.1
0.2
0.3
0.4
0.5
0.0 0.1 0.2 0.3 0.4 0.5

31
Since Pb(II) carbonate solids were loaded at the beginning of the experiment and
only surface Pb(II) sites were subjected to oxidation, the unit of “mg/L” was
used for Pb(II) solid loading to allow the easy calculation of surface area if no
further indication. PbO2 was formed during the course of the experiment and was
measured using the iodometric method. Based on how it was formed and
measured, the unit of “µM” was used for PbO2 concentration. The use of molar
concentration for PbO2 also facilitated the determination of rate equations for
PbO2 formation.
The residual free chlorine was measured using a separate sample directly
passing through a 0.2 µm pore size PTFE syringe filter (Titan). To account for
the natural decay of free chlorine, blank samples without the addition of Pb(II)
solids were prepared. The free chlorine consumed due to the oxidation of Pb(II)
solids was determined as the difference in free chlorine loss between the blank
and the sample containing Pb(II) solids.
3.5 PbO2 reduction experiments in the presence of NH2Cl and Br-
The experiments were conducted using various concentrations of NH2Cl
(1.0 - 3.4 mg/L as Cl2 or 12.9 - 48.3 µM) and bromide (0 - 2.0 mg/L or 0 - 25.0
µM) with the solution pH value varying from 6.0 to 8.0 to investigate their
impacts on Pb(II) release from PbO2 caused by the Br--catalyzed NH2Cl
decomposition. The PbO2 loading employed was 10 mg/L.
All experiments were conducted using 70 mL gas-tight polyethylene
vessels at 25oC. After filling with the experimental solution buffered by 4 mM
DIC, the vessels were sealed without head space and covered by aluminum foil
to prevent the decay of NH2Cl induced by light. These vessels were placed on an
orbital shaker rotating at 200 rpm during the course of the experiment. One
vessel was used each time for the determination of total Pb(II) and residual
NH2Cl concentrations for a total period of 92 hr. The total Pb(II) concentration
(soluble + particulate) was measured using unfiltered sample to capture Pb2+
as
well as Pb(II) carbonate solids that could potentially precipitate in the
experiment [21]. The residual NH2Cl concentration was determined using the
sample passing through a syringe filter equipped with a 0.2 µm pore size PTFE

32
membrane (Titan).
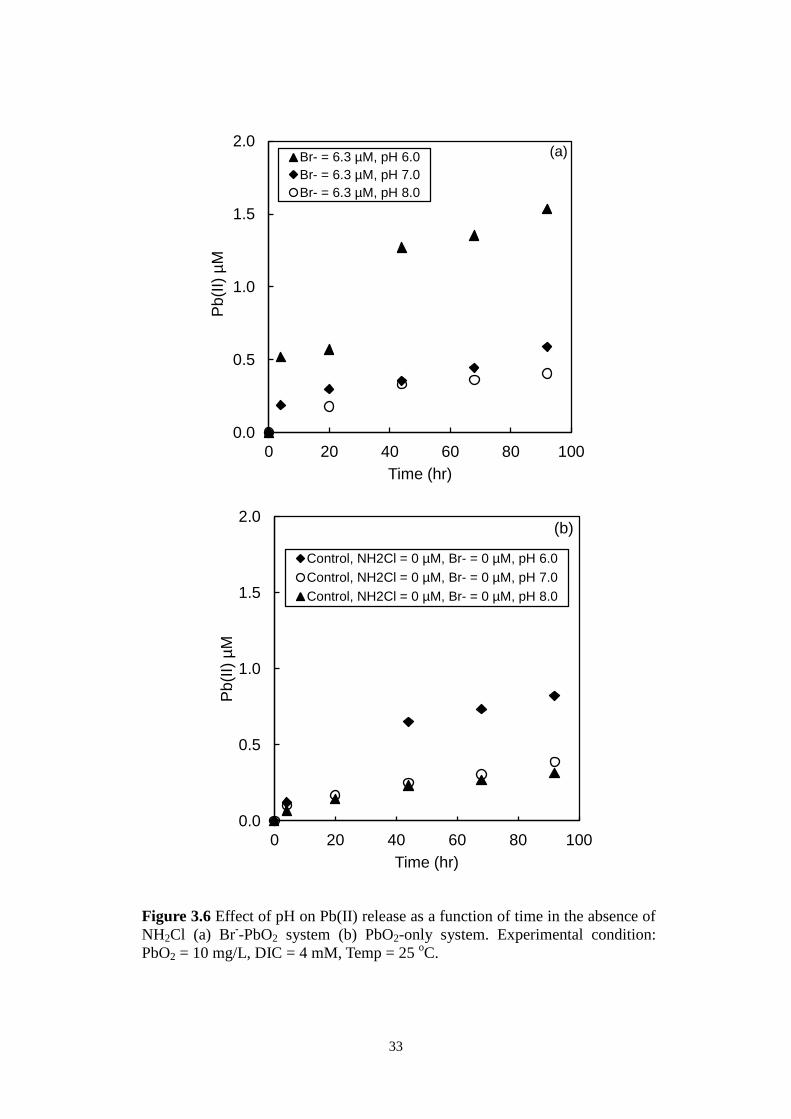
To account for the water-induced PbO2 reduction [21], control experiments
using samples containing only PbO2 and water were conducted. In addition,
experiments using solutions containing Br- but no NH2Cl were also performed as
Br- was reported to be able to reduce PbO2 in acidic conditions [44]. Preliminary
NH2Cl-free experiments showed that Br- did not induce significant PbO2
reduction in neutral and alkaline pH values but additional Pb(II) release was
observed at pH 6.0 when compared to water-only conditions (Figure 3.6). This
additional Pb(II) release should be taken into consideration when investigating
PbO2 reduction caused by Br--catalyzed NH2Cl decomposition. Duplicate
experiments were conducted in selected conditions. The modeling of NH2Cl
decomposition and Pb(II) formation was conducted using MATLAB (Version
7.11.0.584 (R2010b)).
33
Figure 3.6 Effect of pH on Pb(II) release as a function of time in the absence of
NH2Cl (a) Br--PbO2 system (b) PbO2-only system. Experimental condition:
PbO2 = 10 mg/L, DIC = 4 mM, Temp = 25 oC.
0.0
0.5
1.0
1.5
2.0
0 20 40 60 80 100
Pb
(II)
µM
Time (hr)
(a) Br- = 6.3 µM, pH 6.0
Br- = 6.3 µM, pH 7.0
Br- = 6.3 µM, pH 8.0
0.0
0.5
1.0
1.5
2.0
0 20 40 60 80 100
Pb
(II)
µM
Time (hr)
(b)
Control, NH2Cl = 0 µM, Br- = 0 µM, pH 6.0
Control, NH2Cl = 0 µM, Br- = 0 µM, pH 7.0
Control, NH2Cl = 0 µM, Br- = 0 µM, pH 8.0
34
3.6 Analytical methods
HOCl and NH2Cl concentration were measured using the iodometric
method according to the standard method. The concentration of I3- was measured
via a Shimadzu UV-1800 spectrometer using 1 cm or 10 cm cuvette with a molar
absorption coefficient of 23325 M-1
cm-1
at 351 nm [21]. PbO2 concentration was
determined using our developed iodometric method [50]. The mass of spiked
PbCO3 and PbO2 were measured using a microbalance (XP26, Mettler Toledo)
with an accuracy of 0.001 mg. Pb concentration in digested sample was
measured using ICP-MS (ELAN 6100, PerkinElmer). Total Pb(II) concentration
in PbO2 reduction experiments was measured using the anodic stripping
voltammetry (Metrohm VA 797 computrace) with 0.1 M of acetate (pH 4.0) as
the background electrolyte. The standard addition technique was employed. As
the solution was acidified to pH 4.0, this method could capture all Pb(II) species
including soluble Pb2+
ion and Pb(II) carbonate solids that may potentially
precipitate in the experimental solutions [21]. The presence of PbO2 did not
cause interference in this method [21, 44]. TOC was measured via a TOC
analyzer (TOC-VCSH, Shimadzu). The mass of spiked PbCO3 and PbO2
particles were measured using a microbalance (XP26, Mettler Toledo) with an
accuracy of 0.001 mg. Images acquired by a JEOL 6700F field emission
scanning electron microscopy (FE-SEM) were used to investigate the
morphological features of lead carbonate particles before and after chlorination.
The X-ray diffraction (XRD) pattern was acquired by a Siemens XRD D5005.
The specific surface area of PbO2 was measured by the seven-point N2-BET
using a NOVA 4200e surface area analyzer. The pre-calibrated pH meter (F-51,
Horiba) was used to measure solution pH.
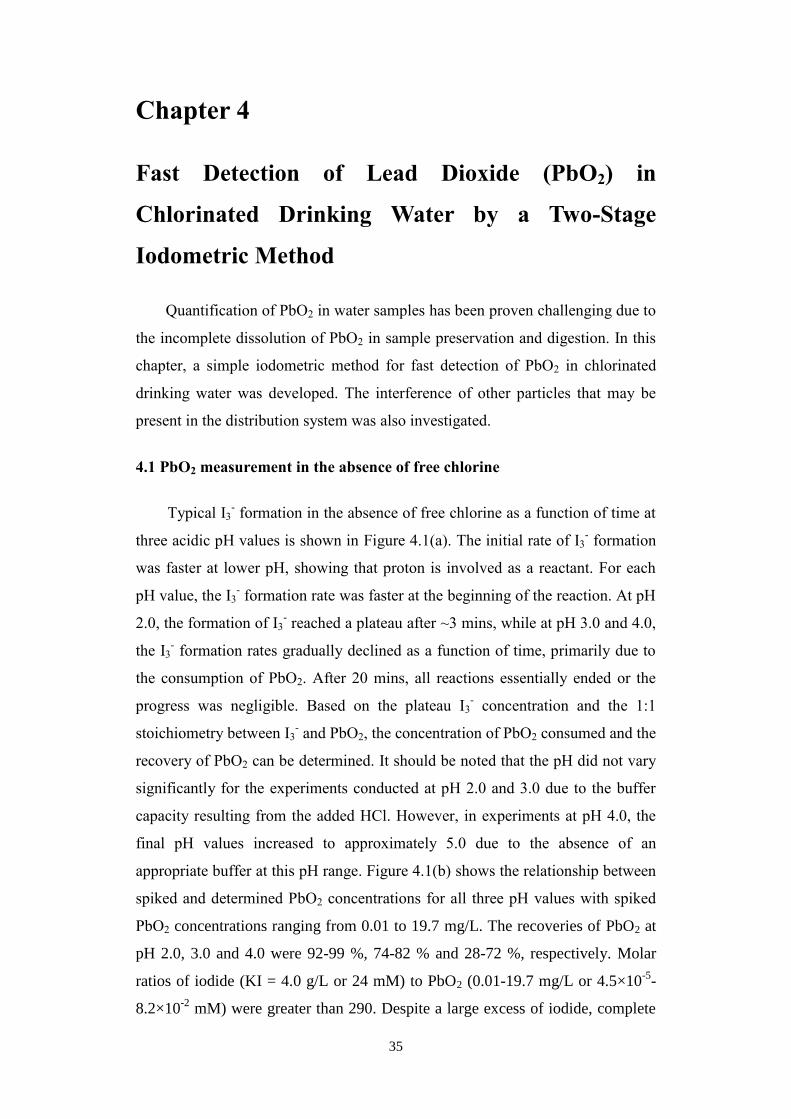
35
Chapter 4
Fast Detection of Lead Dioxide (PbO2) in
Chlorinated Drinking Water by a Two-Stage
Iodometric Method
Quantification of PbO2 in water samples has been proven challenging due to
the incomplete dissolution of PbO2 in sample preservation and digestion. In this
chapter, a simple iodometric method for fast detection of PbO2 in chlorinated
drinking water was developed. The interference of other particles that may be
present in the distribution system was also investigated.
4.1 PbO2 measurement in the absence of free chlorine
Typical I3- formation in the absence of free chlorine as a function of time at
three acidic pH values is shown in Figure 4.1(a). The initial rate of I3- formation
was faster at lower pH, showing that proton is involved as a reactant. For each
pH value, the I3- formation rate was faster at the beginning of the reaction. At pH
2.0, the formation of I3- reached a plateau after ~3 mins, while at pH 3.0 and 4.0,
the I3- formation rates gradually declined as a function of time, primarily due to
the consumption of PbO2. After 20 mins, all reactions essentially ended or the
progress was negligible. Based on the plateau I3- concentration and the 1:1
stoichiometry between I3- and PbO2, the concentration of PbO2 consumed and the
recovery of PbO2 can be determined. It should be noted that the pH did not vary
significantly for the experiments conducted at pH 2.0 and 3.0 due to the buffer
capacity resulting from the added HCl. However, in experiments at pH 4.0, the
final pH values increased to approximately 5.0 due to the absence of an
appropriate buffer at this pH range. Figure 4.1(b) shows the relationship between
spiked and determined PbO2 concentrations for all three pH values with spiked
PbO2 concentrations ranging from 0.01 to 19.7 mg/L. The recoveries of PbO2 at
pH 2.0, 3.0 and 4.0 were 92-99 %, 74-82 % and 28-72 %, respectively. Molar
ratios of iodide (KI = 4.0 g/L or 24 mM) to PbO2 (0.01-19.7 mg/L or 4.5×10⁻⁵
-
8.2×10⁻²
mM) were greater than 290. Despite a large excess of iodide, complete

36
reduction of PbO2 was not observed in experiments conducted at an initial pH of
3.0 and 4.0, especially when PbO2 was > 5 mg/L. Only tests with an initial pH of
2.0 showed promising recoveries meeting the suggested requirement of 85–115 %
for heavy metal measurement using the AAS or ICP-MS [24].

37
Figure 4.1 Plots illustrating the effects of pH on PbO2 measurement in the
absence of free chlorine, including (a) typical I3- formation as a function of time
and (b) relationship between spiked and determined PbO2 concentration. KI =
4.0 g/L (24 mM), Temp = 25 oC. Before acidification, the solution pH was 8.0
and DIC = 4 mM. Inset shows the data for PbO2 < 0.5 mg/L. For those with
PbO2 concentration less than 0.2 mg/L, a 10-cm cuvette was used to measure
UV351.
0
10
20
30
40
0 5 10 15 20
I 3- (μ
M)
Time (min)
pH 2.0, PbO2=10 mg/L
pH 3.0, PbO2=10 mg/L
pH 4.0, PbO2=10 mg/L
0
5
10
15
20
0 5 10 15 20
Dete
rmin
ed
Pb
O2 (
mg/L
)
Added PbO2 (mg/L)
pH 2.0pH 3.0pH 4.01:1 for 100% recovery
(a)
(b)
0
0.1
0.2
0.3
0.4
0.5
0 0.1 0.2 0.3 0.4 0.5

38
In selected experiments, recoveries of PbO2 were also determined using the ICP-
MS, following the USEPA digestion procedures utilizing 5% HNO3 and a
digestion temperature of 85 oC [50]. After 2 hr digestion, only 1-4 % of PbO2
were recovered as shown in Table 4.1.
Table 4.1 Recovery of PbO2 using the USEPA digestion method: 5% HNO3 and
Temp = 85oC. Digestion period was 2 hr.
Spiked PbO2
(mg/L)
Pb2+
measured by ICP-MS after digestion
(mg/L)
Recovery
(%)
0.5 0.019 4
1 0.034 4
3 0.042 2
5 0.059 1
10 0.164 2
Different amounts of KI were used to explore the effect of iodide
concentration on the recovery of PbO2 at pH 2.0. The relationship between added
and determined PbO2 concentrations in the presence of 0.5-4.0 g/L (3-24 mM) of
KI is shown in Figure 4.2. Other than the recovery reported above for KI = 4.0
g/L, the recoveries for 2.0, 1.0 and 0.5 g/L KI were 91-97 %, 86-93 % and 69-
94 %, respectively. For each KI concentration, the higher recoveries were
obtained at lower spiked PbO2 concentrations. Compared to the benchmark
recovery of 85-115 %, our results suggest that a KI concentration greater than
1.0 g/L (6 mM) can be used to measure 0.01-20 mg/L PbO2 at pH 2.0 in the
absence of free chlorine.
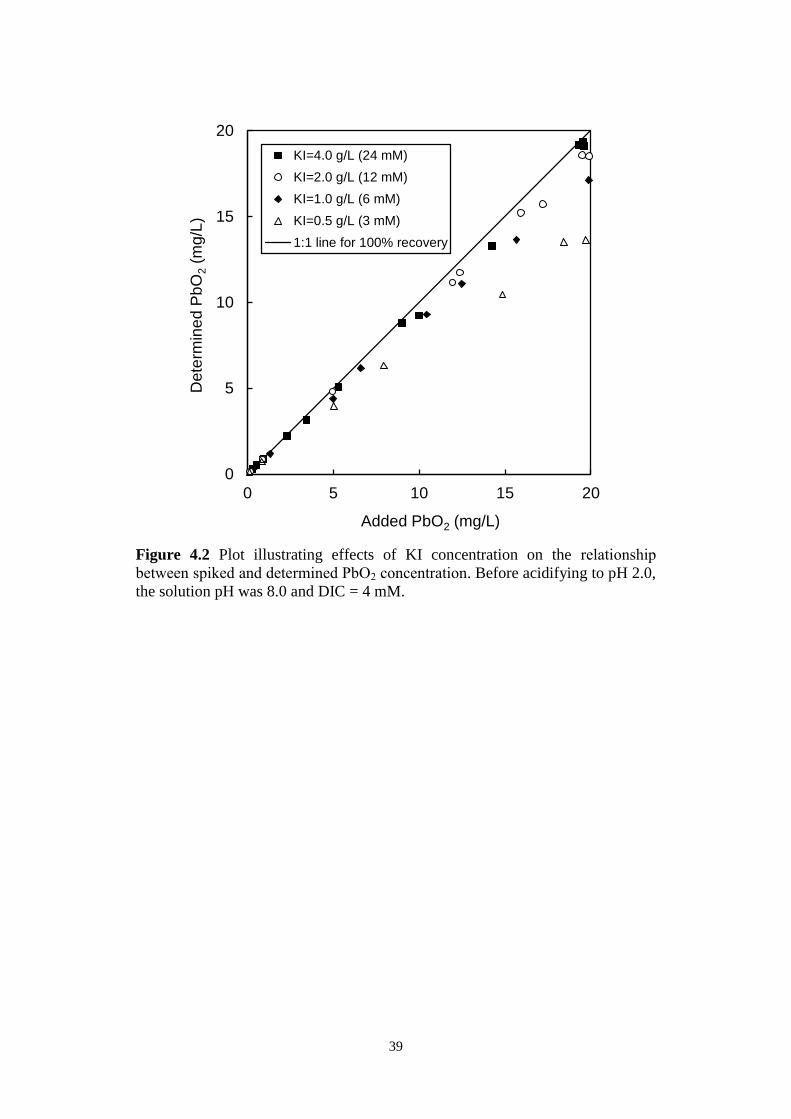
39
Figure 4.2 Plot illustrating effects of KI concentration on the relationship
between spiked and determined PbO2 concentration. Before acidifying to pH 2.0,
the solution pH was 8.0 and DIC = 4 mM.
0
5
10
15
20
0 5 10 15 20
Dete
rmin
ed
Pb
O2 (
mg/L
)
Added PbO2 (mg/L)
KI=4.0 g/L (24 mM)
KI=2.0 g/L (12 mM)
KI=1.0 g/L (6 mM)
KI=0.5 g/L (3 mM)
1:1 line for 100% recovery

40
4.2 PbO2 measurement in the presence of free chlorine
In chlorinated water, free chlorine can react with iodide to form I3- in the
presence of highly excess of iodide, which is the basis for its measurement using
iodometric and amperometric titration[24]. However, this reaction can cause
interference for PbO2 quantification using the proposed method. The oxidation of
iodide by free chlorine is fast and can be completed in seconds at neutral to
slightly alkaline pH [24], in which the oxidation of iodide by PbO2 is
insignificant [20]. Thus, using a two-stage pH adjustment, involving (i) allowing
iodide oxidation by free chlorine at neutral to slightly alkaline pH to quench free
chlorine and (ii) acidifying the sample to accelerate the iodide oxidation by PbO2,
the measurement of PbO2 concentration in chlorinated water sample may be
possible. Figure 3.3 (a) shows the typical I3- formation in the presence of
different free chlorine concentrations using the two-stage pH adjustment. In the
procedures, 4.0 g/L KI (24 mM) was first added to react with free chlorine at pH
8.0 for 10 sec, followed by acidification of the solution to pH 2.0 using 1 M HCl.
The high KI concentration was used to ensure a large excess of iodide for PbO2
reduction after its consumption by free chlorine. Time zero (t0) represented the
point at which pH was adjusted to 2.0 (i.e., 10 sec after KI addition). The
observed I3- formation was in accordance with that shown in Figure 3.3 (b). The
concentration of PbO2 was therefore determined from the difference between the
plateau I3- concentration and that at t0.
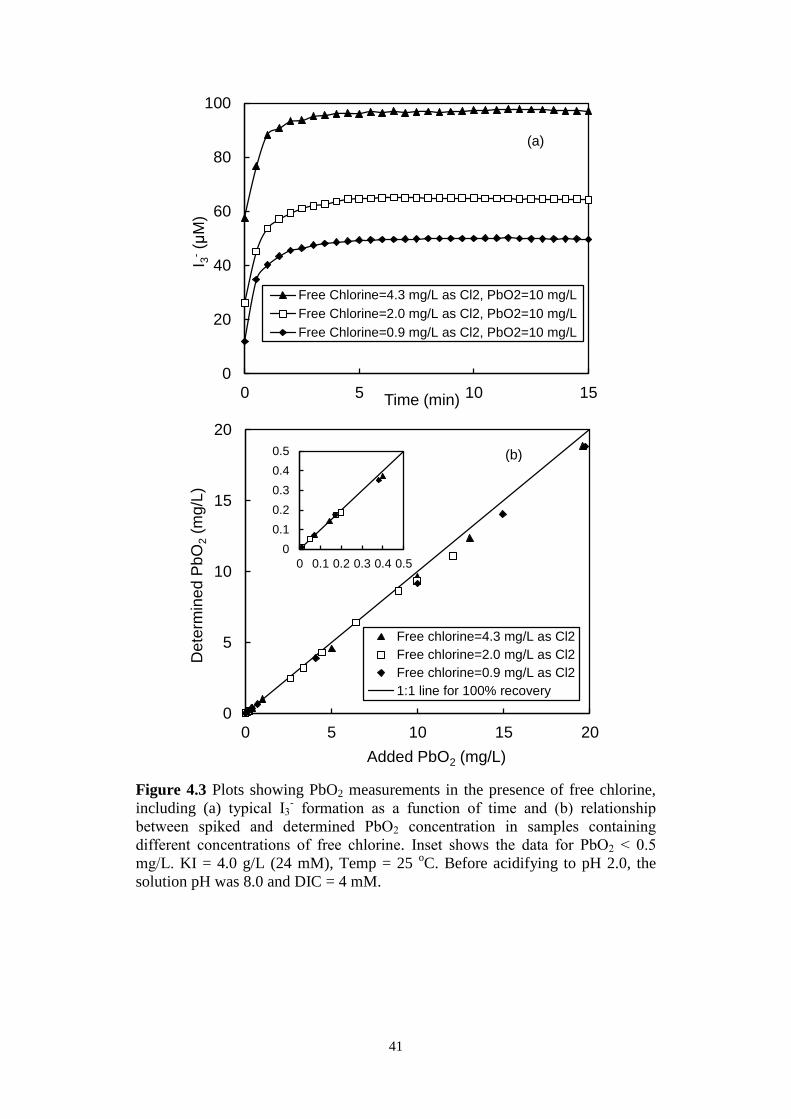
41
Figure 4.3 Plots showing PbO2 measurements in the presence of free chlorine,
including (a) typical I3- formation as a function of time and (b) relationship
between spiked and determined PbO2 concentration in samples containing
different concentrations of free chlorine. Inset shows the data for PbO2 < 0.5
mg/L. KI = 4.0 g/L (24 mM), Temp = 25 oC. Before acidifying to pH 2.0, the
solution pH was 8.0 and DIC = 4 mM.
0
20
40
60
80
100
0 5 10 15
I 3- (μ
M)
Time (min)
Free Chlorine=4.3 mg/L as Cl2, PbO2=10 mg/L
Free Chlorine=2.0 mg/L as Cl2, PbO2=10 mg/L
Free Chlorine=0.9 mg/L as Cl2, PbO2=10 mg/L
0
5
10
15
20
0 5 10 15 20
De
term
ine
d P
bO
2 (
mg/L
)
Added PbO2 (mg/L)
Free chlorine=4.3 mg/L as Cl2
Free chlorine=2.0 mg/L as Cl2
Free chlorine=0.9 mg/L as Cl2
1:1 line for 100% recovery
(a)
(b)
0
0.1
0.2
0.3
0.4
0.5
0 0.1 0.2 0.3 0.4 0.5

42
The relationship between the spiked and determined PbO2 concentration in the
presence of different free chlorine concentrations is illustrated in Figure 4.3(b).
Recoveries of PbO2 in the presence of free chlorine ranged between 92 and 103
%. The lowest PbO2 concentration used was 0.01 mg/L. It should be noted that
free chlorine concentrations determined from the I3- at 10 sec after the addition
of KI were 92-99 % of the added concentrations, confirming the fast and
complete reaction between free chlorine and iodide. Furthermore, separate
control experiments conducted in the absence of free chlorine showed that no
more than 1.5 % of the spiked PbO2 was reduced by iodide in 30 sec at pH 7.0
and 8.0. The results indicate that the proposed method is suitable for PbO2
quantification in chlorinated water typically found in the distribution system.
4.3 Interference of PbCO3 particles
Pb(II) particles may coexist with PbO2 in the distribution system and cause
interference with the UV-vis absorbance measurement. To explore this effect,
PbO2 was measured in samples containing 50 mg/L PbCO3 particles, both in the
absence and presence of 2.0 mg/L as Cl2 free chlorine. The possible interference
associated with PbCO3 particles may be caused by two types of interactions. First,
I3- formed from the oxidation of I
- by PbO2 can be absorbed on the surface of
PbCO3 particles resulting in an underestimation of the formed I3- concentration
used to calculate PbO2 concentration. Secondly, the UV351 absorbance could be
overestimated due to suspending PbCO3 particles, especially in samples having
low PbO2 concentrations. As shown in Figure 4.4, our results indicate that the
presence of 50 mg/L of PbCO3 does not cause significant interference, both in
the absence and presence of free chlorine. The recoveries of PbO2 ranged from
92 to 109 %, which is comparable to those obtained in the absence of PbCO3.

43
Figure 4.4 Plot showing effects of PbCO3 particle on the relationship between
spiked and determined PbO2 concentration in the absence and presence of free
chlorine. PbCO3 = 50 mg/L, KI = 4.0 g/L (24 mM). Before acidifying to pH 2.0,
the solution pH was 8.0 and DIC = 4 mM, Temp = 25 oC.
In control experiments where KI was absent, the absorbance at 351 nm of
the 50 mg/L PbCO3 solution was 0.003 cm-1
. This absorbance can result in
equivalent 0.03 mg/L PbO2 interference. Thus, the low detection limit (0.01
mg/L PbO2) reported earlier was not achievable here. However, 50 mg/L PbCO3
can be considered as the upper bound concentration of Pb(II) particles that may
be present in water samples collected from the distribution system. When less
PbCO3 is present, smaller interference can be expected.
0
5
10
15
20
0 5 10 15 20
Dete
rmin
ed
Pb
O2 (m
g/L
)
Added PbO2 (mg/L)
Free Chlorine=2.0 mg/L as Cl2
Free Chlorine=0 mg/L as Cl2
1:1 line for 100% recovery
PbCO3 = 50 mg/L

44
4.4 Interference of Fe2O3 and MnO2 particles
The presence of other high oxidation state metal oxides including Fe(III)
and Mn(IV) particles, may similarly cause interference of the proposed method
by competing with PbO2 for the oxidation of iodide [52-55]. To quantify this
interference, we measured the oxidation of iodide when Fe2O3 and MnO2 were
present individually and in a mixture with PbO2 at equal mass concentrations. No
disinfectant was added in order to provide a direct comparison of their abilities
for iodide oxidation. For the individual oxide experiments, the formation of I3- as
a function of time in the presence of different concentrations of PbO2, MnO2 and
Fe2O3 is shown in Figure 4.5. By comparing the I3- concentrations formed at 3
min as at this time complete reduction of PbO2 by iodide was achieved, the I3-
concentrations resulting from the oxidation of iodide by Fe2O3 and MnO2 were 1
- 4 % and 9 - 24 %, respectively, of those by PbO2 based on the same solid mass
concentration. These results suggest that Fe2O3 may not significantly interfere
with the proposed method, while significant interference could be introduced by
MnO2.

45
Figure 4.5 Formation of I3- as a function of time resulting from the oxidation of
iodide by (a) PbO2 (b) MnO2 (3) Fe2O3. KI = 4 g/L, pH = 2.0. Note the different
scales in y-axis.
0
10
20
30
40
50
0 5 10 15
I 3- (µ
M)
Time (min)
(a)
PbO2 = 9.5 mg/L
PbO2 = 5.0 mg/L
PbO2 = 2.1 mg/L
PbO2 = 1.2 mg/L
PbO2 = 0.5 mg/L
0
5
10
15
20
0 5 10 15
I 3- (µ
M)
Time (min)
(b)
MnO2 = 10.0 mg/L
MnO2 = 4.9 mg/L
MnO2 = 2.1 mg/L
MnO2 = 0.9 mg/L
MnO2 = 0.5 mg/L
0.0
0.2
0.4
0.6
0.8
1.0
1.2
0 5 10 15
I 3- (µ
M)
Time (min)
(c)
Fe2O3 = 10.0 mg/L
Fe2O3 = 5.0 mg/L
Fe2O3 = 3.0 mg/L
Fe2O3 = 1.0 mg/L
Fe2O3 = 0.5 mg/L
46
For the mixture experiments, the formation of I3- as a function of time is
presented in Figure 4.6. Data from experiments containing only PbO2 are also
shown for comparison. Again, by comparing the 3 min data, it was found that the
I3- formed in PbO2/Fe2O3 mixtures were 99-108 % of those obtained from PbO2-
only experiments. For PbO2/MnO2 mixtures, a range of 109-130% was observed.
These results are consistent with single oxide experiments and the formation of
I3- seems to be additive, probably due to the large excess of iodide.
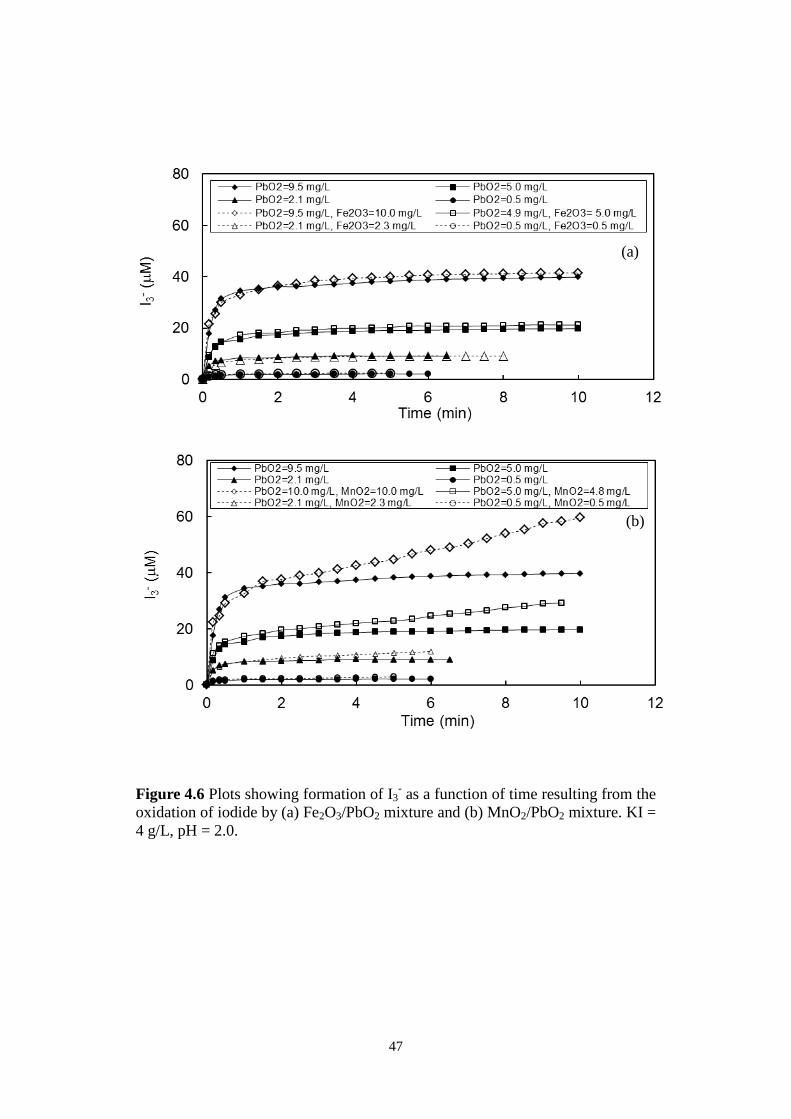
47
Figure 4.6 Plots showing formation of I3- as a function of time resulting from the
oxidation of iodide by (a) Fe2O3/PbO2 mixture and (b) MnO2/PbO2 mixture. KI =
4 g/L, pH = 2.0.
(b)
(a)

48
4.5 PbO2 measurement in chlorinated drinking water
The applicability of the proposed two-stage iodometric method for PbO2
quantification in chlorinated drinking water was tested using real water collected
from a local water treatment plant with spiked PbO2 particles. Figure 4.7 shows
the relationship between spiked and determined PbO2 concentrations. The
recoveries of PbO2 ranged from 90-111 %, suggesting the proposed method is
suitable for determining PbO2 in a complex water matrix. The presence of
common constituents in drinking water including NOM, calcium ion, and
inorganic carbon did not interfere with the method.
Figure 4.7 Plot showing the relationship between spiked and determined PbO2
concentration in real drinking water samples. Inset shows the data for PbO2 < 0.5
mg/L.
0
5
10
15
20
0 5 10 15 20
Dete
rmin
ed
Pb
O2 (
mg/L
)
Added PbO2 (mg/L)
1:1 for 100% recovery
0
0.1
0.2
0.3
0.4
0.5
0 0.1 0.2 0.3 0.4 0.5

49
Chapter 5
Iodide-assisted Total Lead Measurement and
Determination of Different Lead Fractions in
Drinking Water Samples
In the presence of high concentration of PbO2, the USEPA method was not
able to fully recover the total lead due to incomplete dissolution of PbO2
particles during strong acid digestion. In addition, it is not possible to determine
the contribution of each lead species to total lead concentration. In this chapter, a
new procedure that integrates membrane separation, iodometric PbO2
measurement, strong acid digestion and ICP-MS measurement was proposed and
evaluated for accurate measurement of total lead and possible quantification of
different lead species including soluble Pb2+
, particulate Pb(II) carbonate and
PbO2 in drinking water samples.
5.1 Recovery tests for chlorinated drinking water with low PbO2
concentrations
The relationships between spiked and determined total lead concentrations
using the proposed procedure and the USEPA method are shown in Figure 5.1.
The total lead consisted of soluble Pb2+
, particulate Pb(II) carbonate and in-situ
formed PbO2. The recoveries obtained from the proposed procedure and the
USEPA method were 93 - 112 % and 86 - 103 % respectively (Table 5.1),
indicating that both methods met the bench-mark recovery of 85 - 115 % for
heavy metal measurement [24, 50].

50
Figure 5.1 Relationship between spiked and determined total lead concentration
for low PbO2-containing samples using (a) the proposed procedure and (b) the
USEPA method.
0.0
0.5
1.0
1.5
0.0 0.5 1.0 1.5
Dete
rmin
ed
to
tal P
b (
mg/L
)
Spiked total Pb (mg/L)
(a) Proposed method
1:1 line for perfect agreement
0.0
0.5
1.0
1.5
0.0 0.5 1.0 1.5
Dete
rmin
ed
to
tal P
b (
mg/L
)
Spiked total Pb (mg/L)
(b) USEPA method
1:1 line for perfect agreement

51
Table 5.1 Spiked Pb concentrations in the form of Pb2+
and PbCO3 and
determined Pb concentrations in the form of Pb2+
, Pb(II) carbonate and PbO2
using the proposed procedure and USEPA method for recovery tests in low PbO2
conditions. Experimental condition: pH = 7.3, initial free chlorine = 1.5 mg/L as
Cl2, Temp = 25˚C. Recovery of total lead is shown in the parentheses.
No. Spiked Pb (mg Pb/L) Determined Pb (mg Pb/L)
Pb2+
PbCO3 Total Pb Pb2+
Pb(II) carbonate PbO2 Total Pb
Pb determined using the proposed method
1 0.030 0.065 0.095 0.008 0.062 0.020 0.090 (95 %)
2 0.030 0.388 0.448 0.006 0.382 0.023 0.411 (98 %)
3 0.030 0.752 0.782 0.008 0.768 0.018 0.795 (102 %)
4 0.130 0.019 0.149 0.095 0.020 0.028 0.143 (100 %)
5 0.130 0.067 0.197 0.066 0.074 0.044 0.183 (93 %)
6 0.130 0.411 0.541 0.066 0.407 0.043 0.516 (95 %)
7 0.130 0.835 0.965 0.063 0.970 0.044 1.077 (112 %)
8 0.380 0.375 0.755 0.320 0.431 0.070 0.822 (109 %)
9 0.380 0.773 1.153 0.320 0.745 0.076 1.141 (99 %)
10 0.420 0.017 0.437 0.341 0.020 0.062 0.423 (97 %)
11 0.420 0.083 0.503 0.357 0.075 0.064 0.496 (99 %)
Pb determined using the USEPA method
12 0.030 0.062 0.092 NA NA NA 0.082 (89 %)
13 0.030 0.380 0.410 NA NA NA 0.422 (103 %)
14 0.030 0.752 0.782 NA NA NA 0.747 (96 %)
15 0.130 0.016 0.146 NA NA NA 0.131 (90 %)
16 0.130 0.393 0.523 NA NA NA 0.450 (86 %)
17 0.130 0.778 0.908 NA NA NA 0.887 (98 %)
18 0.380 0.403 0.783 NA NA NA 0.779 (100 %)
19 0.380 0.793 1.173 NA NA NA 1.188 (101 %)
20 0.380 0.020 0.400 NA NA NA 0.352 (88 %)
21 0.380 0.067 0.447 NA NA NA 0.418 (94 %)

52
The concentrations of Pb as in Pb2+
, particulate Pb(II) carbonate and PbO2
could also be determined using our proposed procedure as shown in Table 5.1.
The measured Pb concentration in the form of PbO2 resulting from the
chlorination of Pb2+
ranged from 0.018 to 0.076 mg Pb/L, indicating that 18 - 77
% of spiked Pb2+
was oxidized by free chlorine to form PbO2 and the
transformation percentage decreased with the increasing spiked Pb2+
concentration. The formation of PbO2 was kinetically controlled as free chlorine
did not completely dissipate at the end of the experiments. It has been reported
that the transformation of particulate Pb(II) to PbO2 in chlorinated solution is
reversal if the residual free chlorine cannot be maintained[4]. The measured Pb
concentration in the form of Pb2+
ranged from 0.006 to 0.357 mg/L and that in
form of particulate Pb(II) carbonate ranged from 0.020 - 0.970 mg Pb/L.
Solubility calculations using MINEQL+ (version 4.6) were performed in which
all Pb(II) solids embedded in the software database were considered. The
calculations indicated that the solubility products of PbCO3 and Pb3(OH)2(CO3)2
were exceeded in solutions used in tests No. 4 - 11 and 15 - 21 shown in Table
4.1. It appeared that the precipitation of PbCO3 and Pb3(OH)2(CO3)2, however,
did not occur appreciably in the testing solutions based on our measurements.
Oxidation of post-spiked PbCO3 to form PbO2 via chlorination and the
dissolution of PbCO3 were negligible due to the slow kinetics of these reactions
and the immediate filtration after the spike of PbCO3 [4].
In the USEPA method, all lead solids are assumed to dissolve during the 5
% nitric acid digestion. The good recoveries obtained for total lead using the
USEPA method suggested that 5 % nitric acid digestion was able to dissolve
almost all lead particles present in our experimental solutions, including the
small amount of PbO2 that were formed in-situ. Thus, recovery tests using
solutions with higher PbO2 concentrations must be carried out to examine
whether the proposed procedure and the USEPA method can capture all
particulate lead, particularly high PbO2 concentration in such conditions.
5.2 Recovery tests for chlorinated drinking water with high PbO2
concentrations
In addition to soluble Pb2+
and PbCO3, PbO2 was spiked in chlorinated tap

53
water to simulate drinking water containing high PbO2 concentrations. Since
measurements were conducted immediately after the spike, the transformation of
lead species including the oxidation of Pb(II) species by free chlorine,
dissolution of PbCO3 and precipitation of Pb2+
were assumed to be insignificant.
The relationships between the added and determined total lead concentrations
using the proposed procedure and the USEPA method are shown in Figure 5.2.
The recoveries for total lead obtained using the proposed procedure ranged from
91-111 %, while those obtained using the USEPA method ranged from 44-80 %
(Table 5.2). As visible reddish particles were still present after the 5 % nitric acid
digestion, it was believed that the low recoveries for the USEPA method were
due to the incomplete dissolution of PbO2 particles.

54
Figure 5.2 Relationship between spiked and determined total lead concentration
for high PbO2-containing samples using (a) the proposed procedure and (b) the
USEPA method.
0.0
0.5
1.0
1.5
2.0
2.5
3.0
0.0 0.5 1.0 1.5 2.0 2.5 3.0
Dete
rmin
ed
to
tal P
b (
mg/L
)
Spiked total Pb (mg/L)
(a) Proposed method
1:1 line for perfect agreement
0.0
0.5
1.0
1.5
2.0
2.5
3.0
0.0 0.5 1.0 1.5 2.0 2.5 3.0
Dete
rmin
ed
to
tal P
b (
mg/L
)
Spiked total Pb (mg/L)
(b) USEPA method
1:1 line for perfect agreement

55
Table 5.2 Spiked and determined Pb concentrations in the form of Pb2+
, PbCO3
and PbO2 using the proposed method and USEPA method for recovery tests in
high PbO2 conditions. Experimental condition: pH = 7.3, initial free chlorine =
1.5 mg/L as Cl2, Temp = 25˚C. The values in parentheses are the recoveries of
each lead fraction.
No.
Spiked Pb (mg Pb/L) Determined Pb (mg Pb/L)
Pb2+
PbCO3 PbO2 Total Pb Pb2+
Pb(II)
carbonate PbO2 Total Pb
Pb determined using the proposed method
1 0.010 0.155 0.251 0.417 0.011 (105 %) 0.223 (144 %) 0.213 (85 %) 0.447 (107 %)
2 0.010 0.388 0.494 0.892 0.011 (109 %) 0.446 (115 %) 0.470 (95 %) 0.927 (104 %)
3 0.010 0.457 0.217 0.684 0.009 (90 %) 0.554 (121 %) 0.195 (90 %) 0.759 (111 %)
4 0.010 0.147 0.537 0.694 0.010 (100 %) 0.125 (85 %) 0.497 (93 %) 0.632 (91 %)
5 0.010 0.473 1.152 1.635 0.010 (94 %) 0.418 (88 %) 1.056 (92 %) 1.484 (91 %)
6 0.010 0.915 0.450 1.375 0.009 (90 %) 1.004 (110 %) 0.435 (97 %) 1.449 (105 %)
7 0.010 0.077 0.089 0.176 0.011 (110%) 0.079 (103 %) 0.080 (90 %) 0.169 (96 %)
8 0.010 0.326 0.398 0.734 0.010 (95 %) 0.345 (106 %) 0.382 (96 %) 0.737 (100 %)
9 0.010 0.225 0.598 0.833 0.011 (96 %) 0.248 (110 %) 0.621(104 %) 0.880 (106 %)
10 0.010 0.465 0.606 1.081 0.010 (100 %) 0.508 (109 %) 0.572 (94 %) 1.090 (101 %)
11 0.010 0.651 0.650 1.311 0.011 (104 %) 0.653 (100 %) 0.577 (89 %) 1.240 (95 %)
12 0.010 0.388 0.338 0.736 0.011 (106 %) 0.387 (100 %) 0.299 (89 %) 0.696 (95 %)
13 0.010 1.171 1.316 2.497 0.010 (97 %) 1.038 (89 %) 1.243 (94 %) 2.290 (92 %)
Pb determined using the USEPA method
14 0.010 0.034 0.084 0.128 NA NA NA 0.056 (44 %)
15 0.010 0.178 0.191 0.379 NA NA NA 0.272 (72 %)
16 0.010 0.388 0.528 0.926 NA NA NA 0.428 (46 %)
17 0.010 0.209 0.494 0.713 NA NA NA 0.350 (49 %)
18 0.010 0.403 0.892 1.305 NA NA NA 0.750 (57 %)
19 0.010 0.240 0.572 0.822 NA NA NA 0.538 (65 %)
20 0.010 0.465 0.606 1.081 NA NA NA 0.750 (69 %)
21 0.010 0.698 0.728 1.435 NA NA NA 1.053 (73 %)
22 0.010 0.380 0.745 1.135 NA NA NA 0.834 (74 %)
23 0.010 1.163 1.334 2.507 NA NA NA 1.913 (76 %)
24 0.010 0.481 0.320 0.811 NA NA NA 0.578 (71 %)
25 0.010 0.892 0.476 1.378 NA NA NA 1.100 (80 %)
26 0.010 0.620 1.006 1.636 NA NA NA 0.967 (60 %)
27 0.010 0.079 0.081 0.170 NA NA NA 0.119 (70 %)

56
The determined concentrations and recoveries for soluble Pb2+
, particulate
Pb(II) carbonate and PbO2 using the proposed procedure are also shown in Table
5.2. The recoveries of Pb in the form of soluble Pb2+
and PbO2 were 90-110 %
and 85-104 %, respectively. Our results suggested that the iodometric
determination of PbO2 in the proposed procedure can recover most of the spiked
PbO2. For particulate Pb(II) carbonate, two out of twelve tests did not meet the
85-115 % benchmark recovery. One possible reason for this could be that small
amounts of PbO2 particles did not completely dissolve during the iodometric step
in these tests, which were later determined as particulate Pb(II) based on our
procedure. Nevertheless, the recovery of total particulate lead (particulate Pb(II)
+ PbO2) ranged from 91-111 %, demonstrating the capability of the proposed
procedure to capture particulate lead.
5.3 Total lead measurement using iodide-assisted USEPA method
The proposed method may provide accurate measurement of total lead and
relevant information on the speciation of lead, particularly the presence of PbO2
in the sample. This can aid in the identification of lead contamination cause, the
assessment of lead bioavailability and the development of proper lead control
strategies. Under current regulations, lead in drinking water is regulated as total
lead [51]. The membrane separation and the differentiation of lead fractions in
the proposed method, therefore, may not be required. To meet this regulatory
need, we tested whether the recovery of total lead using the USEPA method for
high PbO2-containing samples can be improved by simply adding KI before the
strong acid digestion. Prior to ICP-MS, I3- formed from the oxidation of iodide
by PbO2 was removed by heating until a colorless solution was obtained. The
same solution composition employed in the previous section was used. The
relationships between the spiked and measured total lead concentrations are
shown in Figure 5.3. Recoveries for total lead determined by the modified
USEPA method ranged from 85-114 %, increased from 44-80 % obtained by the
original USEPA method (Figure 5.2(b)). Our results suggested that the addition
of KI before strong acid digestion can improve the USEPA method for total lead
measurement, particularly in samples containing high concentrations of PbO2.

57
Figure 5.3 Relationship between spiked and determined total lead concentration
for high PbO2-containing samples using the iodide-assisted USEPA method.
0.0
0.5
1.0
1.5
2.0
2.5
3.0
0.0 0.5 1.0 1.5 2.0 2.5 3.0
Dete
rmin
ed
to
tal P
b (
mg/L
)
Spiked total Pb (mg/L)
Iodide-assisted USEPA method
1:1 line for perfect agreement
58
Chapter 6
Determination of PbO2 Formation Kinetics from
the Chlorination of Pb(II) Carbonate Solids via
Direct PbO2 Measurement
In this chapter, the iodometric method described in Chapter IV for PbO2
measurement was employed to determine its formation kinetics from the
chlorination of cerussite (PbCO3) and hydrocerussite (Pb3(CO3)2(OH)2). The
effects of Pb(II) solid loading, free chlorine concentration, DIC and pH value on
the formation kinetics in environmentally relevant conditions were investigated.
The rate equations for PbO2 formation were determined and the stoichiometry of
free chlorine consumption and PbO2 formation was examined.

59
6.1 Influence of Pb(II) solid loading
The formation of PbO2 from the chlorination of different loadings of
hydrocerussite and cerussite as a function of time is shown in Figure 6.1.
Figure 6.1 PbO2 formation as a function of time at different Pb(II) solid loadings.
(a) hydrocerussite (b) cerussite. Initial free chlorine = 58.5 µM, DIC = 4 mM, pH
7.0, Temp = 25 oC.
For both Pb(II) solids, the amount of PbO2 formed increased fast initially and the
rates gradually decreased as the reaction proceeded. For the same Pb(II) solid
0
2
4
6
8
10
0.0 0.2 0.4 0.6 0.8 1.0
Pb
O2 c
on
ce
ntr
ation
(µ
M)
Time (day)
(a) Hydrocerussite = 571 mg/L
Hydrocerussite = 286 mg/L
Hydrocerussite = 143 mg/L
Hydrocerussite = 71 mg/L
0
2
4
6
8
10
0.0 0.2 0.4 0.6 0.8 1.0
Pb
O2 c
on
ce
ntr
ation
(µ
M)
Time (day)
(b) Cerussite = 429 mg/L
Cerussite = 286 mg/L
Cerussite = 143 mg/L
Cerussite = 71 mg/L

60
loading, the PbO2 formed from the chlorination of hydrocerussite was higher
than that of cerussite. For example, at a Pb(II) solid loading of 286 mg/L (or in
molar concentration: hydrocerussite = 369 M and cerussite = 1070 M), the
chlorination of hydrocerussite resulted in the formation of 5.4 µM PbO2 after 24
hr, which was about 2.4 times higher than that of cerussite (2.2 µM),
representing the conversion rates of Pb(II) to Pb(IV) of 1.5 and 0.2 % for
hydrocerussite and cerussite, respectively. This may partially result from the
higher specific surface area of hydrocerussite (6.2 m2/g) than cerussite (0.8 m
2/g).
The consumption of free chlorine which can be used as an indirect indication of
PbO2 formation was also found to be faster during the chlorination of
hydrocerussite than that of cerussite and has also been reported previously [56].
The relationships between Pb(II) solid loading and the initial PbO2 formation
rate are shown in Figure 6.2. Linear relationships were found for both Pb(II)
solids suggesting that the rate of PbO2 formation is proportional to Pb(II) solid
loading or available surface area (SA).

61
Figure 6.2 Effect of Pb(II) solid loading on the initial PbO2 formation rate.
Initial free chlorine = 58.5 µM, pH 7.0, DIC = 4 mM, Temp = 25 oC.
6.2 Influence of initial free chlorine concentration
The effect of initial free chlorine concentration on the initial PbO2
formation rate derived from the PbO2 formation vs. time curves is shown in
Figure 6.3. For both hydrocerussite and cerussite, the formation rates increased
linearly with the increasing initial free chlorine concentration. Based on the least-
square regression, the formation rates were first-order with respect to the initial
free chlorine concentration for both Pb(II) solids. The higher rate of PbO2
formation at the higher free chlorine concentration was also previously observed
in the chlorination of massicot (PbO) in the presence of DIC [57].
y = 0.134x R² = 0.912
y = 0.012x R² = 0.994
0
20
40
60
80
100
120
0 200 400 600
Initia
l P
bO
2 f
ora
mtio
n r
ate
(µ
M·d
ay
-1)
Pb(II) solids (mg/L)
HydrocerussiteCerussite

62
Figure 6.3 Effect of initial free chlorine concentration on the initial PbO2
formation rate. Pb(II) solids = 286 mg/L, DIC = 4 mM, pH 7.0, Temp = 25 o
C.
6.3 Influence of DIC
The formation of PbO2 was found to increase with the decreasing DIC for
both Pb(II) solids. Similar observation was reported by Liu and Korshin [56].
Carbonate is one of the products formed in the chlorination of Pb(II) solids (Eq.
(1.1) and (1.2)). However, the effect of DIC on PbO2 formation is not likely
resulting from the reverse reactions (i.e., dissolution of PbO2) as PbO2 does not
exist initially. It is hypothesized that this inhibitory effect of DIC on PbO2
formation can be attributed to the formation of carbonate-lead surface complexes
that protect the surface Pb(II) sites from the oxidation [56] and that the rate of
PbO2 formation is proportional to the free surface Pb(II) concentration.
Considering the pH values (pH 6.0-9.0) employed in this study, ≡
PbHCO30 and ≡PbCO3
- should be the two predominant surface complexes
formed. Their formation can be described by the following equation:
]}[HCOPb{
}PbHCO{β PbHCOHCOPb
3
0
3
1
0
3
β
31
(6.1)
y = 0.94x R² = 0.997
y = 0.24x R² = 0.976
0
20
40
60
80
0 20 40 60 80
Initia
l P
bO
2 fo
ram
tio
n r
ate
(µ
M·d
ay
-1)
Initial free chlorine (µM)
Hydrocerussite
Cerussite

63
]}[COPb{
}PbCO{β PbCOCOPb
-2
3
3
23
β-2
32
(6.2)
where ≡ denotes surface species, denotes surface site concentration, [ ] denotes
aqueous concentration, and andare the apparent stability constants for the
respective surface complex. The “+1” charge of surface Pb(II) site is a result of
its coordination in the mineral lattice and hydration/relaxation in the aqueous
phase [58]. It should be noted that the values of andcan be different for
hydrocerussite and cerussite due to the differences in their surface structure.
Based on Eq. (6.1) and (6.2), the free surface Pb(II) concentration can be
expressed as Eq. (6.3):
(6.3) CαβCαβ1
}Pb(II){}Pb{
T22T11
tot
where }Pb(II){ tot represents the total surface Pb(II) concentration which is a
constant at a fixed Pb(II) solid loading, CT represents DIC and α1 and α2 are the
fractions of HCO3- and CO3
2- in DIC [33].
Since the rate of PbO2 formation is assumed to be proportional to the free
surface Pb(II) concentration, and can be determined from the values that
result in the best linear correlation between the initial PbO2 formation rate and
the free surface Pb(II) site concentration or 1/(1+11CT+22CT) via trial and
error. The stability constants of the analogous aqueous complexes, i.e., Pb2+
+
HCO3- ↔ PbHCO3
+, = 10
2.90 and Pb
2+ + CO3
2- ↔ PbCO3
0, = 10
7.24 [59],
were used as the starting values for β1 and β2 [58]. Figure 6.4 shows the plot with
the best linear correlation between the initial PbO2 formation rate and
1/(1+11CT+22CT). The values of β1 and β2 were determined to be 102.2
and
106.4
for hydrocerussite and 102.0
and 106.0
for cerussite, respectively. These
values were very close to the corresponding aqueous complexes shown above. It
should be noted that comparable stability constants for analogous aqueous and
surface complexes have been reported for other carbonate minerals [58].

64
Figure 6.4 Best linear relationships between the initial PbO2 formation rate and
1/(1+11CT+22CT). Pb(II) solids = 286 mg/L, initial free chlorine = 59.6 µM,
pH 7.0, Temp = 25 o
C. The four data points were obtained at DIC = 1, 2, 4 and 8
mM. At pH 7.0, α1 = 8.2×10⁻¹
and α2 = 3.8×10⁻⁴
. For hydrocerussite, β1 = 102.2
and β2 = 106.4
; for cerussite, β1 = 102.0
and β2 = 106.0
.
y = 270x R² = 0.957
y = 34x R² = 0.916
0
50
100
150
0.0 0.2 0.4 0.6 0.8 1.0
Initia
l P
bO
2 fo
rma
tio
n r
ate
(µ
M·d
ay
-1)
1/(1+β1α1CT+β2α2CT)
Hydrocerussite
Cerussite

65
6.4 Influence of pH Value
For both Pb(II) solids, it was found that the rate of PbO2 formation
increased with the increasing pH value. The influence of pH value on the
formation of PbO2 should be considered in two ways: (i) it decides the
concentration of OH- which is a reactant in the reaction as described in Eq. (1.1)
and (1.2) and (ii) it regulates the carbonate speciation which affects the
formation of carbonate-lead surface complexes. The latter can be determined by
DIC, pH value and 1/2 obtained previously. To evaluate the sole influence of
[OH-], the rates of PbO2 formation obtained need to be corrected for the impact
resulting from carbonate-lead surface complexes as shown in Figure 6.5, where
the initial PbO2 formation rate divided by 1/(1+11CT+22CT) is plotted
against [OH-]. It was found that excellent linear correlations existed between the
corrected PbO2 formation rate and [OH-] for both Pb(II) solids, indicating a first-
order dependence on [OH-].

66
Figure 6.5 Effect of [OH-] on the initial PbO2 formation rate corrected by
dividing 1/(1+11CT+22CT). Pb(II) solids = 286 mg/L, initial free chlorine =
59.6 µM, DIC = 4 mM, Temp = 25 oC. The data points were obtained at pH 6, 7,
8 and 9. r represents the initial PbO2 formation rate. The inset shows the data for
[OH-] ≤ 0.1 µM.
6.5 Determination of rate equations
Based on the results presented above, the rate equation for the formation of
PbO2 from thechlorination of Pb(II) solids in carbonate-buffered solution can be
generally expressed:
(6.4) ][OH[HOCl]CαβCαβ1
(SA)kr ba
T22T11
obs
where r represents the rate of PbO2 formation (µM∙day-1
), obsk represents the
observed rate constant (m-2
∙µM-1
∙day-1
), and a and b are apparent reaction
orders with respect to [HOCl] and [OH-] (µM), respectively. The unit of CT
y = 3668x R² = 0.999
y = 618x R² = 0.998
0.0E+00
1.0E+04
2.0E+04
3.0E+04
4.0E+04
0 2 4 6 8 10
(1+
β1α
1C
T+
β2α
2C
T)×
r (µ
M∙d
ay
-1)
[OH-] (µM)
Hydrocerussite
Cerussite
0
200
400
0.00 0.05 0.10

67
or DIC is M. The rate of PbO2 formation is first-order with respect to the
available Pb(II) solid surface area, [HOCl] and [OH-], respectively (Figure
6.2, 6.3 and 6.5). Combining all regression results and the inhibitory effect of
DIC, the following rate equations can be derived:
Hydrocerussite:
][HOCl][OHCα01Cα011
(SA))105.4(r
T2
4.6
T1
2.2
2
(6.5)
Cerussite:
][HOCl][OHCα01Cα011
(SA))103.4(r
T2
0.6
T1
0.2
2
(6.6)
The rate constants for both Pb(II) solids are similar, suggesting that the
difference in PbO2 formation rate between hydrocerussite and cerussite observed
in our experiments was primarily caused by the differences in surface area and
the apparent stability constants for carbonate-lead surface complexes (β1 and β2).
Figure 6.6 shows the relationships between the experimentally determined initial
rates and those calculated using Eq. (6.5) and (6.6). Good correlations were
observed indicating that the rate equations provide satisfactory expressions for
the rate of PbO2 formation in the chlorination of hydrocerussite and cerussite.

68
Figure 6.6 Relationship between the experimentally measured initial PbO2
formation rates and the calculated initial rates for the chlorination of (a)
hydrocerussite (n = 12) (b) cerussite (n = 13).
0
50
100
150
200
0 50 100 150 200
Calc
ula
ted
initia
l re
actio
n r
ate
(µ
M·d
ay
-1)
Measured initial reaction rate (µM·day-1)
(a)
Hydrocerussite:experimental data
1:1 line for perfect agreement
0
10
20
30
40
0 10 20 30 40
Calc
ula
ted
initia
l re
actio
n r
ate
(µ
M·d
ay
-1)
Measured initial reaction rate (µM·day-1)
(b)
Cerussite: experimental data
1:1 line for perfect agreement

69
6.6 Stoichiometry of free chlorine consumption and PbO2 formation
In general, the formation of PbO2 was accompanied by the gradual
consumption of free chlorine. It should be noted that we did not observed the
two-stage free chlorine decay profile described by Liu and Korshin [56],
probably due to the lower but more practical free chlorine concentration and a
shorter chlorination period employed in our study. The adsorption of free
chlorine on the surface of PbO2, if any, was not significant due to the relative low
concentrations of formed PbO2 (< 10 µM).
Figure 6.7 shows the relationship between the amount of PbO2 formed and
the amount of free chlorine consumed. Linear correlations were found for both
Pb(II) solids. The slopes of the linear correlations with a 95 % confidence level
were 1.02(±0.03) and 1.03(±0.05) for hydrocerussite and cerussite, respectively,
which corresponded well to the 1:1 stoichiometry between free chlorine
consumption and PbO2 formation suggested by Eq. (1.1) and (1.2).

70
Figure 6.7 Plots of PbO2 formation vs. free chlorine consumption in all
experimental conditions. (a) hydrocerussite (n=81) (b) cerussite (n=91).
y = 1.02(±0.03)x - 0.02 R² = 0.979
0
2
4
6
8
10
0 2 4 6 8 10
Pb
O2 f
orm
atio
n (
µM
)
Free chlorine consumption (µM)
(a)
Experimental data95% confience levelLeast-square linear regression
y = 1.03(±0.05)x - 0.05 R² = 0.999
0
1
2
3
4
5
0 1 2 3 4 5
Pb
O2 f
orm
atio
n (
µM
)
Free chlorine consumption (µM)
(b)
Experimental data95% confidence levelLeast-square linear regression

71
6.7 SEM observations
A color change from white to dark red was observed for the chlorination for
both hydrocerussite and cerussite. Due to the limited amount of PbO2 formed,
XRD was not able to index the mineralogy of PbO2 (data not shown). SEM
images showing the morphological transformation in the chlorination process are
presented in Figure 6.8. Prior to chlorination, hydrocerussite and cerussite
exhibited a platy and rod structure, respectively (Figure 6.8 (a) and (b)). After 24
hr chlorination with 59.6 µM free chlorine, PbO2 nano-crystal aggregates were
observed on both Pb(II) solids (Figure 6.8 (c) and (d)). More PbO2 was found on
hydrocerussite, which was consistent with the results obtained from the direct
PbO2 measurements and the extent of color change (Figure 6.9). It should be
noted that the coexistence of hydrocerussite, cerussite and PbO2 in the
chlorination of hydrocerussite reported by Liu and Korshin [56] was not
observed here, suggesting that the transformation of hydrocerussite to cerussite
may not be a prerequisite for PbO2 formation. OH- is one of the reactants in the
chlorination reactions (Eq. (1.1) and (1.2)). The local low pH induced by the
consumption of OH- when sufficient PbO2 was formed may be responsible for
this non-oxidative transformation. To examine this possibility, we conducted an
additional hydrocerussite chlorination experiment with 90.0 M free chlorine for
48 hr, a condition that could result in more PbO2 formation. The SEM image is
shown in Figure 6.8 (e). In addition to hydrocerussite and greater amount of
PbO2, large rod shape cerussite crystals were found. This observation is
consistent with our postulation that the transformation of hydrocerusstie to
cerussite could be attributed to the local low pH resulting from sufficient PbO2
formation.

72
Figure 6.8 SEM images of lead particles before and after chlorination. (a)
hydrocerussite before chlorination (b) cerussite before chlorination (c)
hydrocerussite after 24 hr chlorination (d) cerussite after 24 hr chlorination (e)
hydrocerussite after 48 hr chlorination. Chlorination condition: Pb(II) solids =
428 mg/L, DIC = 1 mM, pH 9.0, Temp = 25 oC, initial free chlorine = 59.6 µM
for (c) and (d), and 90.0 µM for (e), respectively.

73
Figure 6.9 Photographic images of color changes of particulate samples before
and after chlorination: (a) hydrocerussite before chlorination, (b) cerussite before
chlorination, (c) hydrocerussite after 24 hr chlorination, and (d) cerussite after 24
hr chlorination. Pb(II) solids = 428 mg/L, initial free chlorine = 59.6 µM, DIC
= 1 mM, pH 9.0, Temp = 25 oC.

74
Chapter 7
Elevated Pb(II) Release from the Reduction of
Pb(IV) Corrosion Product (PbO2) Induced by
Bromide-catalyzed Monochloramine
Decomposition
In this chapter, whether Br--catalyzed NH2Cl decomposition could further
enhance lead release from PbO2 was investigated. Experiments were designed to
determine whether the factors accelerating the rate of Br--catalyzed NH2Cl
decomposition can synchronically accelerate the release of Pb(II) from PbO2.
The relationship between the amount of Pb(II) released and the amount of NH2Cl
decomposed in the presence and absence of Br- was also determined to compare
the reactivity of the intermediates formed from different decomposition
pathways towards the reduction of PbO2. Finally, the modeling of lead release
from PbO2 in this system was attempted.
7.1 Synergistic influences of Br- and NH2Cl concentration on the reduction
of PbO2
The general influences of NH2Cl and Br- on the decomposition of NH2Cl
and the corresponding release of Pb(II) from PbO2 are shown in Figure 7.1. The
addition of PbO2 slightly accelerated the rate of NH2Cl decomposition and the
addition of Br- accelerated the decomposition rate to a greater extent due to its
catalytic effects. The greatest rate of NH2Cl decomposition was observed in the
presence of both PbO2 and Br- (Figure 1(a)). In the absence of NH2Cl, Br
- did not
accelerate the reduction of PbO2 if compared to the control experiment with
water only at pH 7.0. NH2Cl, on the other hand, promoted the release of Pb(II)
from PbO2 (Figure 7.1 (b)). These findings were consistent with previous studies
showing that the reduction of PbO2 by Br- did not proceed appreciably at neutral
to alkaline pH values [44] and that the decomposition of NH2Cl could lead to the
reduction of PbO2 [21]. When Br- and NH2Cl were present simultaneously, a

75
higher rate of Pb(II) release was observed. For example, after 92 hr the Pb(II)
released from PbO2 in the presence of 6.3 µM Br- and 26.8 µM NH2Cl was 4.16
µM. When present individually, the identical concentrations of Br- and NH2Cl
only caused 0.59 and 2.56 µM of Pb(II) release, respectively.

76
Figure 7.1 Synergistic influences of Br- and NH2Cl on Pb(II) release from PbO2
and NH2Cl decomposition (a) NH2Cl decomposition as a function of time (b)
Pb(II) release from 10 mg/L PbO2 as a function of time. Experimental condition:
DIC = 4 mM, pH 7.0, Temp = 25 oC. Solid lines represent modeling results.
0
5
10
15
20
25
30
0 20 40 60 80 100
NH
2C
l (µ
M)
Time (hr)
(a)
Br- = 0 µM, PbO2 = 0 mg/L
Br- = 0 µM, PbO2 = 10 mg/L
Br- = 6.3 µM, PbO2 = 0 mg/L
Br- = 6.3 µM, PbO2 = 10 mg/L
0
1
2
3
4
5
0 20 40 60 80 100
Pb
(II)
(µ
M)
Time (hr)
(b) Br- = 6.3 µM, NH2Cl = 26.8 µM
Br- = 0 µM, NH2Cl = 28.0 µM
Br- = 6.3 µM, NH2Cl = 0 µM
Br- = 0 µM, NH2Cl = 0 µM

77
7.2 Influence of pH value
The decomposition of NH2Cl and release of Pb(II) from PbO2 as a function
of time in Br--containing NH2Cl solutions at pH 6.0-8.0 are shown in Figure 7.2.
The rates of both NH2Cl decomposition (Figure 7.2 (a)) and Pb(II) release
(Figure 7.2 (b)) increased with the decreasing pH value. The enhanced Pb(II)
release from PbO2 at the lower pH value can be attributed to the accelerated Br--
catalyzed NH2Cl decomposition. The rate of Br--catalyzed NH2Cl decomposition
is controlled by the formation of NH3Cl+ and its subsequent oxidation by Br
- [27-
29]. The formation of NH3Cl+ was enhanced at the lower pH value and resulted
in the faster decomposition of NH2Cl as shown in Figure 7.2 (a). The concurrent
dependence of Br--catalyzed NH2Cl decomposition and Pb(II) release from PbO2
on pH value was consistent with our hypothesis that the Br--catalyzed NH2Cl
decomposition can generate a higher concentration of the reactive intermediate
that is capable of reducing PbO2. In the absence of NH2Cl, Br- itself with a
concentration of 6.3 μM did not cause significant PbO2 reduction at neutral to
alkaline pH values. At pH 6.0, the same concentration of Br- induced additional
0.40-0.72 μM of Pb(II) release at different reaction periods when compared to
Br--free conditions. These additional Pb(II) releases, however, only accounted
for about 10 % of total Pb(II) release induced by the Br--catalyzed NH2Cl
decomposition (Figure 7.2 (b)), showing that Br-_
catalyzed NH2Cl
decomposition significantly promoted PbO2 reduction at this slightly acidic pH
value.

78
Figure 7.2 Influence of pH on the Pb(II) release from PbO2 and Br--catalyzed
NH2Cl decomposition as a function of time. (a) NH2Cl decomposition (b) Pb(II)
release. Experimental condition: PbO2 = 10 mg/L, NH2Cl = ~28.0 µM, Br- = 6.3
µM, DIC = 4 mM, Temp = 25 oC. Solid lines represent modeling results.
0
10
20
30
0 20 40 60 80 100
NH
2C
l (µ
M)
Time (hr)
(a)
pH 8.0
pH 7.0
pH 6.0
0
2
4
6
8
10
0 20 40 60 80 100
Pb
(II)
(µ
M)
Time (hr)
(b) pH 6.0
pH 7.0
pH 8.0

79
7.3 Influence of Br- concentration
The decomposition of NH2Cl and the release of Pb(II) from PbO2 as a
function of time in NH2Cl solutions containing 1.3 to 25.0 μM of Br- are shown
in Figure 7.3. Results from the control experiment without Br- are also shown for
comparison purposes. It was found that the rate of NH2Cl decomposition (Figure
7.3(a)) and the rate of Pb(II) release from PbO2 (Figure 7.3(b)) increased with
the increasing Br- concentration. The kinetics of Br
--catalyzed NH2Cl
decomposition has been previously reported to follow a first-order dependence
on Br- concentration [26], which was also observed in our data. Our observation
suggested that Br- indirectly enhanced the release of Pb(II) from PbO2 via the
catalyzed NH2Cl decomposition.

80
Figure 7.3 Influence of Br
- concentration on Pb(II) release from PbO2 and Br
--
NH2Cl decomposition as a function of time. (a) NH2Cl decomposition (b) Pb(II)
release. Experimental condition: PbO2= 10 mg/L, NH2Cl = ~28.0 µM, DIC = 4
mM, pH 7.0, Temp = 25 o
C. Solid lines represent modeling results.
0
5
10
15
20
25
30
0 20 40 60 80 100
NH
2C
l(µ
M)
Time (hr)
(a) Control, Br- = 0 µMBr- = 1.3 µMBr- = 6.3 uMBr- = 12.5 µMBr- = 25.0 µM
0
2
4
6
8
10
0 20 40 60 80 100
Pb
(II)
(µ
M)
Time (hr)
(b) Br- = 25.0 µM
Br- =12.5 µM
Br- = 6.3 µM
Br- = 1.3 µM
Control, Br- = 0 µM

81
7.4 Influence of initial NH2Cl concentration
The decomposition of NH2Cl and the release of Pb(II) from PbO2 and as a
function of time in Br--containing NH2Cl solutions with different initial NH2Cl
concentration are shown in Figure 7.4. The rates of NH2Cl decomposition
(Figure 7.4(a)) and Pb(II) release from PbO2 (Figure 7.4(b)) increased with the
increasing initial NH2Cl concentration. In the control experiment without NH2Cl,
6.3 µM Br- only caused 0.59 µM Pb(II) release from PbO2 after 92 hr, which was
only 23 % of the Pb(II) released in the presence of 12.9 μM NH2Cl, the lowest
concentration used in our experiments. Our results indicated that the release of
Pb(II) from PbO2 was primarily attributed to the NH2Cl decomposition, in which
the kinetics was dependent on the initial NH2Cl concentration and could be
significantly promoted by Br-.
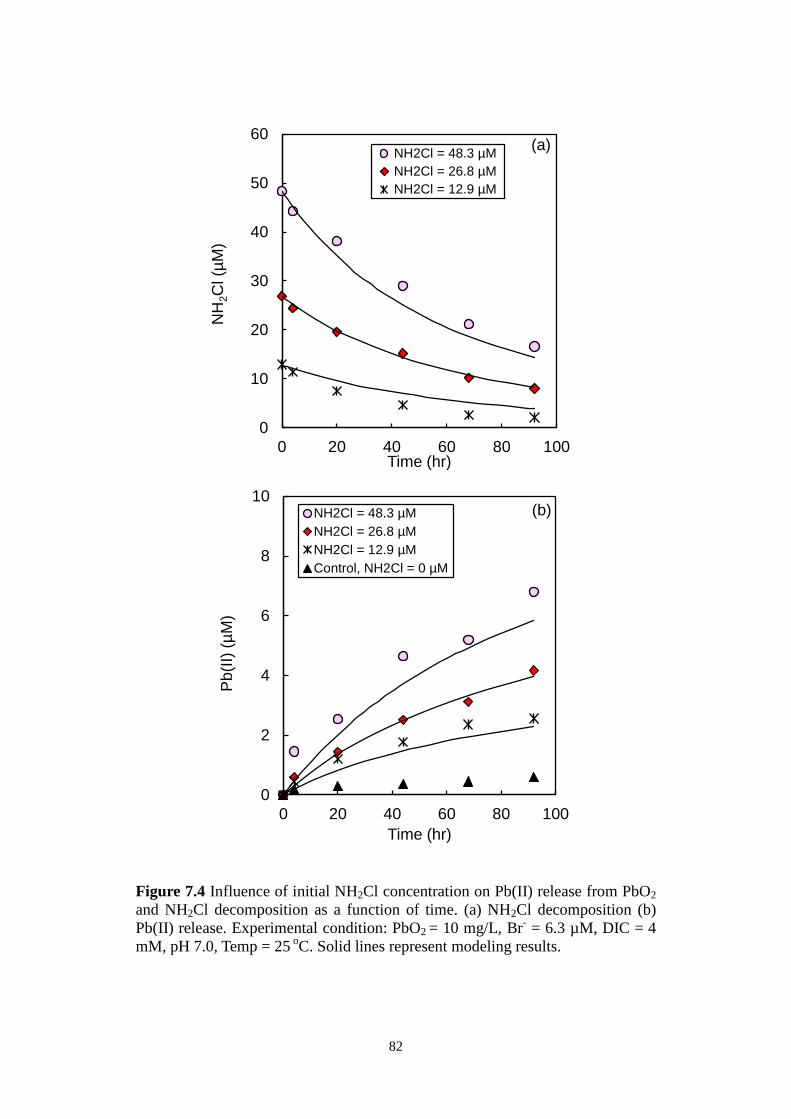
82
Figure 7.4 Influence of initial NH2Cl concentration on Pb(II) release from PbO2
and NH2Cl decomposition as a function of time. (a) NH2Cl decomposition (b)
Pb(II) release. Experimental condition: PbO2 = 10 mg/L, Br- = 6.3 µM, DIC = 4
mM, pH 7.0, Temp = 25 o
C. Solid lines represent modeling results.
0
10
20
30
40
50
60
0 20 40 60 80 100
NH
2C
l (µ
M)
Time (hr)
(a) NH2Cl = 48.3 µM
NH2Cl = 26.8 µM
NH2Cl = 12.9 µM
0
2
4
6
8
10
0 20 40 60 80 100
Pb
(II)
(µ
M)
Time (hr)
(b) NH2Cl = 48.3 µM
NH2Cl = 26.8 µM
NH2Cl = 12.9 µM
Control, NH2Cl = 0 µM

83
7.5 Relationship between NH2Cl decomposition and Pb(II) release
The relationship between the amount of NH2Cl decomposed and the
amount of Pb(II) released from PbO2 is presented in Figure 7.5, where all
experimental data including those from NH2Cl auto-decomposition (Figure 7.6
and 7.7) and those from Br--catalyzed NH2Cl decomposition (Figure 7.2 - 7.4)
are shown. Linear relationships were observed for both Br--free and Br
--
containing conditions suggesting that the release of Pb(II) from PbO2 is
controlled by the decomposition of NH2Cl, most likely via unidentified
intermediates formed during the decomposition [21]. The slopes of the linear
regressions with a 95% confidence level in the presence and absence of Br- were
0.237(±0.030) and 0.255(±0.021), respectively. There was no statistically
significant difference between the two slopes suggesting that the unidentified
intermediates generated from NH2Cl auto-decomposition and Br--catalyzed
NH2Cl decomposition may be identical or at least possess similar reactivity
toward the reduction of PbO2. The slope obtained from the regression of all data
was 0.241(±0.021), suggesting that the decomposition of 1 μM of NH2Cl would
cause approximately 0.241 μM of Pb(II) release from 10 mg/L of the PbO2 used
in this study.

84
Figure 7.5 Summary plot of NH2Cl decomposition vs. Pb(II) formation in all
experiment conditions.
0
2
4
6
8
0 5 10 15 20 25 30 35
Pb
(II)
fo
rma
tio
n (
µM
)
∆NH2Cl (µM)
With Br-Without Br-least-square linear regression without Br-Least-square linear regression for all dataleast-square linear regression with Br-95% confidence level for all data
Without Br-:
y = 0.255(±0.021)x+0.014 R
2 = 0.942
Overall: y = 0.241(±0.021)x+0.075 R
2 = 0.896
With Br-:
y = 0.237(±0.030)x+0.091 R
2 = 0.868

85
Figure 7.6 Effect of pH on the Pb(II) release from PbO2 and NH2Cl
decomposition as a function of time in the absence of Br-. (a) NH2Cl
decomposition, (b) Pb(II) release. Experimental condition: PbO2 = 10 mg/L,
NH2Cl = ~28.0 µM, DIC = 4 mM, pH 7.0, Temp = 25 oC. Solid lines represent
modeling results.
0
5
10
15
20
25
30
0 20 40 60 80 100
NH
2C
l (µ
M)
Time (hr)
(a)
pH = 8.0
pH = 7.0
pH = 6.0
0
2
4
6
8
10
0 20 40 60 80 100
Pb
(II)
(µ
M)
Time (hr)
(b) pH = 6.0
pH = 7.0
pH = 8.0

86
Figure 7.7 Effect of initial NH2Cl concentration on the Pb(II) release from PbO2
and NH2Cl decomposition as a function of time in the absence of Br-. (a) NH2Cl
decomposition, (a) Pb(II) release. Experimental condition: PbO2 = 10 mg/L, DIC
= 4 mM, pH 7.0, Temp = 25 oC. Solid lines represent modeling results.
0
10
20
30
40
50
60
0 20 40 60 80 100
NH
2C
l(µ
M)
Time (hr)
(a) NH2Cl = 54.4 µM
NH2Cl = 28.0 µM
NH2Cl = 13.8 µM
0
2
4
6
8
10
0 20 40 60 80 100
Pb
(II)
µM
Time (hr)
(b)
NH2Cl = 54.4 µM
NH2Cl = 28.0 µM
NH2Cl = 13.8 µM

87
7.6 Modeling of Pb(II) release
The release of Pb(II) from PbO2 in NH2Cl solutions either in the absence or
presence of Br- could be attributed to the reaction between the unidentified
intermediates during NH2Cl decomposition and PbO2. We assume that both
NH2Cl decomposition pathways produced the same unidentified intermediate (I*)
that can reduce PbO2 based on our observation (Figure 7.5). In NH2Cl auto-
decomposition, I* is formed from the reaction between NHCl2 and H2O and can
further react with NHCl2 and NH2Cl to accelerate NH2Cl decomposition
(reactions 7, 8 and 9 in Table 2.1). In the presence of Br-, we assume that I* is
formed from the reaction between NHBrCl and H2O (analogical to NHCl2 and
H2O) and can further react with NHBrCl and NH2Cl with the same rate constants
as their auto-decomposition counterparts as below:
NHBrCl + H2O → I* + Br
- k = 4.0 × 10
5 M
-1h
-1 (7.1)
I* + NHBrCl→ HOBr + products k = 1.0 × 10
8 M
-1h
-1 (7.2)
I* + NH2Cl → Products k = 3.0 × 10
7 M
-1h
-1 (7.3)
Conceptually, the consumption of intermediates (I*) due to the PbO2
reduction reactions could decrease the rate of NH2Cl decomposition. However,
our results showed that the rate of NH2Cl decomposition in PbO2-containing
solution were slightly higher (~10%) than those without PbO2 (Figure 7.1),
suggesting that a secondary intermediates (denoted as I*m)) could be formed from
PbO2 reduction and it could also react with NHCl2, NHBrCl and NH2Cl
(reactions 2, 3 and 4 in Table 7.1) with slightly higher rate constants than those
with I*.

88
Table 7.1 Proposed reactions for the formation of Pb(II) and reactions of
secondary intermediate I*.
Proposed reactions for the formation of Pb(II) and reactions of
secondary intermediate Im*
1. I*
+ PbO2 → Pb2+
+ Im* k1 = 1.3 × 10
5 m
-2·h
-1
2. Im* + NHCl2 → HOCl + Products k2 = 2.0 × 10
8 M
-1·h
-1
3. Im* + NHBrCl → HOBr + Products k3 = 2.0 × 10
8 M
-1·h
-1
4. Im* + NH2Cl → Products k4 = 5.0 × 10
7 M
-1·h
-1
Im* denotes the secondary intermediate formed from the reaction of
PbO2 with I*.
Reduction of PbO2 is a surface reaction and its rate should be proportional to
the available surface area (23, 25). Thus, the rate of Pb(II) released from PbO2
(reaction 1 in Table 7.1) can be expressed as the following:
r = kPbO2 (SA) ([I*]) (7.4)
where r denotes the rate of PbO2 released (M∙h-1
), kPbO2 denotes the apparent rate
constant (m-2
∙h-1
). (SA) denotes the surface area of PbO2 (m2). [I
*] denotes the
concentration of the intermediate formed from the NH2Cl auto- and Br--catalyzed
decomposition (reaction 7 in Table 2.1 and Eq. (7.1)).
The rate constants of reactions linked to PbO2 reduction (reactions 1-4 in
Table 7.1) were determined by the least-square linear regression of experimental
data. The modeling of NH2Cl decomposition and Pb(II) formation considering
both auto-decomposition and Br--catalyzed NH2Cl decompositions are shown in
Figure 7.2-7.4. It should be noted that the dependences of rate constants and
equilibrium constants on temperature were also considered when available [26].
k2 (rate constant for reaction 2 in Table 2.1) and kBr (rate constant for reaction 2
in Table 2.1) were found to significantly affect the rate of NH2Cl auto-
decomposition and Br--catalyzed NH2Cl decomposition and their values were
calibrated by the data obtained from control experiments and determined to be
6.8 × 10⁻²
h-1
and 1.6 × 10⁸ M
-1h
-1 which were comparable to those listed in Table
2.1 and 2.2, respectively. Based on the least-square regression, apparent rate
constant (kPbO2) in Eq. (7.4) was determined to be 1.3 × 10⁵ m
-2∙h
-1. In general,
the model provided good simulations of our experimental data, except NH2Cl
decomposition at pH 6.0 was overestimated and Pb(II) release at the same pH

89
value was underestimated. These discrepancies may be attributed to that the
NH2Cl decomposition model was established under neutral to alkaline conditions
and may not be directly applicable to pH 6.0 and that the release of Pb(II)
resulting from Br--induced PbO2 reduction at this pH value was not taken into
consideration in the modeling.

90
Chapter 8
Conclusions and Recommendations
This thesis investigated PbO2 detection, formation and stability relevant to
drinking water conditions. The findings are summarized in the conclusions and
recommendations for the future study are presented below.
8.1 Conclusions
The conclusions of the research present in this thesis are summarized in the
following:
(1) PbO2 detection
The two-stage iodometric method presented can be used to determine PbO2
in water samples, either in the absence or presence of free chlorine. With the
optimized KI dose (4 g/L or 24 mM) and pH (pH 2.0), this method can detect
0.01 to 20 mg/L of PbO2 within 10 min. Based on these preliminary experimental
findings, the proposed method may be useful for a variety of field and laboratory
applications. For example, it is noted that there is no extensive survey of PbO2
occurrence in the distribution system. A simple device with similar features to
that of the portable chlorine analyzer may be developed based on our findings for
in-situ testing of PbO2. In laboratory investigations, the formation of PbO2 from
the chlorination of Pb(II) solid phases or Pb2+
has been an important subject.
However, the rate of PbO2 formation cannot be directly quantified due to the lack
of a suitable method allowing quick PbO2 measurement. The developed method
may overcome previous shortcomings and make the quantification possible. It is
important to note that the proposed method is not applicable to chloraminated
water, due to the incomplete reaction between iodide and monochloramine at
neutral to slightly alkaline pH values. However, this may be resolved by
appropriate filtration of the chloraminated water followed by the quantification
of captured PbO2 particles using the procedures developed for disinfect-free
solutions. Membrane filter with a pore size of 20-30 nm is recommended as
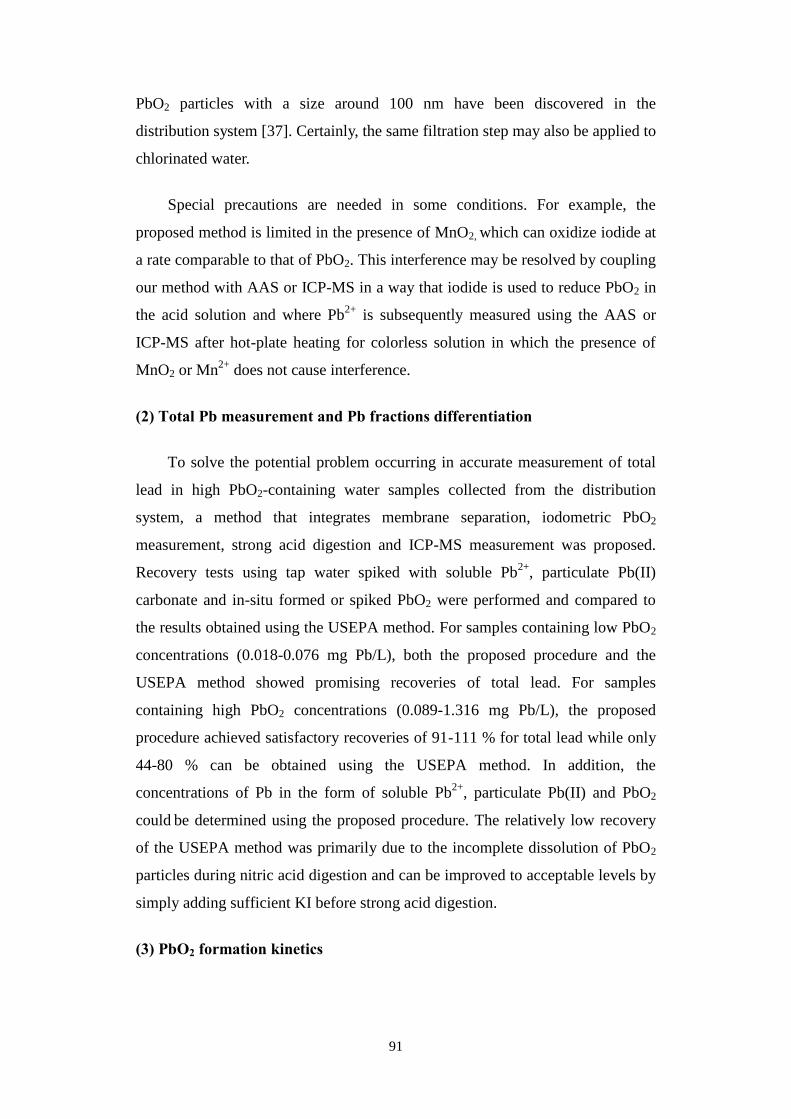
91
PbO2 particles with a size around 100 nm have been discovered in the
distribution system [37]. Certainly, the same filtration step may also be applied to
chlorinated water.
Special precautions are needed in some conditions. For example, the
proposed method is limited in the presence of MnO2, which can oxidize iodide at
a rate comparable to that of PbO2. This interference may be resolved by coupling
our method with AAS or ICP-MS in a way that iodide is used to reduce PbO2 in
the acid solution and where Pb2+
is subsequently measured using the AAS or
ICP-MS after hot-plate heating for colorless solution in which the presence of
MnO2 or Mn2+
does not cause interference.
(2) Total Pb measurement and Pb fractions differentiation
To solve the potential problem occurring in accurate measurement of total
lead in high PbO2-containing water samples collected from the distribution
system, a method that integrates membrane separation, iodometric PbO2
measurement, strong acid digestion and ICP-MS measurement was proposed.
Recovery tests using tap water spiked with soluble Pb2+
, particulate Pb(II)
carbonate and in-situ formed or spiked PbO2 were performed and compared to
the results obtained using the USEPA method. For samples containing low PbO2
concentrations (0.018-0.076 mg Pb/L), both the proposed procedure and the
USEPA method showed promising recoveries of total lead. For samples
containing high PbO2 concentrations (0.089-1.316 mg Pb/L), the proposed
procedure achieved satisfactory recoveries of 91-111 % for total lead while only
44-80 % can be obtained using the USEPA method. In addition, the
concentrations of Pb in the form of soluble Pb2+
, particulate Pb(II) and PbO2
could be determined using the proposed procedure. The relatively low recovery
of the USEPA method was primarily due to the incomplete dissolution of PbO2
particles during nitric acid digestion and can be improved to acceptable levels by
simply adding sufficient KI before strong acid digestion.
(3) PbO2 formation kinetics

92
When a sufficient oxidation potential is maintained, PbO2 is considered as
an excellent sink to control plumbosolvency in the distribution system. The
kinetics of PbO2 formation from the chlorination of Pb(II) solids presented in
this study elucidates the influences of different water parameters (Pb(II) solid
loading, free chlorine concentration, DIC and pH) on the rate of PbO2 formation
and allows the prediction of PbO2 formation under environmentally relevant
conditions, at least in a short period of chlorination. An extensive study is
warranted to investigate the applicability of the kinetics for the long-term PbO2
formation.
The inhibition of PbO2 formation by DIC can be successfully explained by
the formation of lead-carbonate surface complexes that protect surface Pb(II)
from oxidation. It is anticipated that the same mechanism may be extended to
other ions.
(4) Elevated Pb(II) release from PbO2 reduction induced by Br--catalyzed
NH2Cl decomposition
Br--catalyzed NH2Cl decomposition was demonstrated to be able to cause
elevated Pb(II) release from PbO2 and the rate was enhanced by the lower pH
value, higher initial Br- and NH2Cl concentrations. The intermediate causing the
reduction of PbO2 could be identical in NH2Cl auto-decomposition and Br--
catalyzed NH2Cl decomposition. For distribution systems with historically
installed lead-containing plumbing materials, precaution on lead contamination
should be taken if considering switching disinfectant from free chlorine to
NH2Cl, particularly those in arid and coastal regions with high bromide
concentrations in their source waters. Systems using RO-desalinated seawater
which may contain Br- up to 0.6 mg/L may also pose potential risk of lead
release, although the risk could be reduced after mixing with conventionally
treated water.
93
8.2 Recommendations
The results presented in this thesis could aid to accurate measurement of
PbO2 and total lead and better understanding of PbO2 formation kinetics in the
distribution system. Elevated lead release from PbO2 induced by Br-catalyzed
NH2Cl decomposition was also demonstrated. Future studies needed to improve
our understanding in this field are described below.
(1) The interference of other foreign particles excluded in our study in
iodometric method
In the developed iodometric method, I3- formed from the oxidation of I
- by
PbO2 was quantified using UV-vis spectrometer to determine the PbO2
concentration based on 1:1 stoichiometry between the PbO2 consumption and I3-
formation. Foreign particles (e.g., flaking Pb detached from plumping materials
during water flushing or metal oxide (e.g., CuO) may exist in the PbO2-contained
water. They may result in high turbidity and thereby interfere with UV-vis
absorbance measurement. Further investigation on the detection of PbO2 in
particle-contained water using iodometric method is needed.
(2) The recovery of total lead in water using proposed method
Particulate Pb(II) carbonate and Pb(IV) solids are the major corrosion
products in the drinking water distribution system where LCPMs are used. Other
particulate Pb, such as pure Pb, PbO, Pb3O4, Pb3(PO4)2 may exist in the corrosion
scale and enter drinking water via physical detachment. The influence of these
particulate Pb on the PbO2 quantification using the proposed iodometric method
and accurate differentiation of these particulate Pb species should be further
investigated.
(3) The effect of orthophosphate on the PbO2 formation kinetics
Our experiments showed that PbO2 can be formed from the chlorination of
Pb(II) corrosion products. It has been reported that PbO2 does not occur in some
distribution systems where orthophosphate is used as the corrosion inhibitor and
the formation of lead phosphate minerals can be the major reason to inhibit PbO2

94
formation. Considering the strong complexing ability of orthophosphate, the
formation of a “film” of lead phosphate surface complexes may result in the
same inhibition without a passivation layer of lead phosphate minerals. The
detailed mechanism of inhibition effect of orthophosphate on PbO2 formation
should be investigated in the future.
(4) Identification of the intermediate responsible for PbO2 reduction in Br-
-catalyzed NH2Cl decomposition
The unidentified intermediate formed from the Br--catalyzed NH2Cl
decomposition was believed to cause PbO2 reduction. Identification of this
intermediate should be explored to fully elucidate the detailed pathway leading
to PbO2 reduction.

95
REFERENCES
1. Gregory, R., Lead: a source of contamination of tap water. In: Corrosion
and relateted aspects of materials for potable water supplies. In Proceedings of
the society of chemical industry, The institute of materials: London, 1993.
2. Hayes, C., Aergeerts, R., Barrott, L., Becker, A., Benoliel, M. J.,
Croll, B, Edwards, M., Gari, D., Hoekstra, E., Jung, M., Postawa, A.,
Ruebel, A., Russell, L., Schock, M.R., Skubala, N., Witszak, S., Tielemans, M.,
and Zabochnicka-Swiatek, M. , Best practice guide on the control of lead in
drinking water. IWA Publishing: London, 2001.
3. Schock, M. R., In Distribution systems as reservoirs and reactors for
inorganic contaminants (Chapter 6). In 21 st Century, Distribtuion System Water
Quality Challenges, AWWA, Denver, Colorado, 2005.
4. Lytle, D. A.; Schock, M. R., Formation of Pb(IV) oxides in chlorinated
water. J. Am. Water Works Assoc. 2005, 97, 102-114.
5. Liu, H. Z.; Korshin, G. V.; Ferguson, J. F., Interactions of Pb(II)/Pb(IV)
solid phases with chlorine and their effects on lead release. Environ. Sci. Technol.
2009, 43, (9), 3278-3284.
6. Liu, H. Z.; Korshin, G. V.; Ferguson, J. F., Investigation of the kinetics
and mechanisms of the oxidation of cerussite and hydrocerussite by chlorine.
Environ. Sci. Technol. 2008, 42, (9), 3241-3247.
7. Lytle, D. A.; White, C.; Nadagouda, M. N.; Worrall, A., Crystal and
morphological phase transformation of Pb(II) to Pb(IV) in chlorinated water. J.
Hazard. Mater. 2009, 165, (1-3), 1234-1238.
8. Schock, M. R.; Wagner, I.; Oliphant, R. J., Corrosion and solubility of
lead in drinking water In internal corrosion of water distribution systems. AWWA
Research Foundation and AWWA: Denver, CO. 1996.
9. Schock, M. R.; Harmon, S. M.; Swertfeger, J.; Lohmann, R. In
Tetravalent lead: a hitherto unrecognized control of tap water lead
contamination, Proceedings of the AWWA Water Quality Technology
Conference, Nashville, TN, 2001; Nashville, TN, 2001.
10. Renner, R., Plumbing the depths of D.C.’s drinking water crisis. Environ.
Sci. Technol. 2004, 38, (12), 224A-227A.
11. Edwards, M.; Dudi, A., Role of chlorine and chloramine in corrosion of

96
lead-bearing plumbing materials. J. Am. Water Works Assoc. 2004, 96, (10), 69-
81.
12. Triantafyllidou, S.; Edwards, M., Critical evaluation of the NSF 61
section 9 test water for lead. J. Am. Water Works Assoc. 2007, 99, (9), 133-
143+12.
13. Schock, M. R., Gardels, M. C. , Plumbosolvency reduction by high pH
and low carbonate solubility relationships. J. Am. Water Works Assoc. 1983, 75,
(2), 87-91.
14. Schock, M. R., Understanding corrosion control strategies for lead. J. Am.
Water Works Assoc. 1989, 81, (7), 88-100.
15. Davidson, C. M., Peters, N. J., Britton, A., Brady, L., Gardiner, P. H. E.
and Lewis, B. D., Surface analysis and depth profiling of corrosion products
formed in lead pipes used to supply low alkalinity drinking water. Water Sci.
Technol. 2004, 49, (2), 49-54.
16. USEPA, Maximum contamination level goals and national primary
drinking water regulations for lead and copper. Final rule. Fed.Regist. 1991, 56,
26460-26564.
17. Edwards, M.; Triantafyllidou, S.; Best, D., Elevated blood lead in young
children due to lead-contaminated drinking water: Washington, DC, 2001−2004.
Environ. Sci. Technol. 2009, 43, (5), 1618-1623.
18. Renner, R., Out of plumb: when water treatment causes lead
contamination. Environ. Health Perspect. 2009, 117, (12), A542-A547.
19. Elfland, C.; Scardina, P.; Edwards, M., Lead-contaminated water from
brass plumbing devices in new buildings. J. Am. Water Works Assoc. 2010, 102,
(11), 66-76.
20. Lin, Y. P.; Washburn, M. P.; Valentine, R. L., Reduction of lead oxide
(PbO2) by iodide and formation of iodoform in the PbO2/I-/NOM system.
Environ. Sci. Technol. 2008, 42, 2919-2924.
21. Lin, Y. P.; Valentine, R. L., Release of Pb(II) from monochloramine-
mediated reduction of lead oxide (PbO2). Environ. Sci. Technol. 2008, 42, (24),
9137-9143.
22. Bichsel, Y.; Von Gunten, U., Determination of iodide and iodate by ion
chromatography with postcolumn reaction and UV/visible detection. Anal. Chem.
1999, 71, (1), 34-38.

97
23. Lin, Y. P.; Valentine, R. L., Reduction of lead oxide (PbO2) and release
of Pb(II) in mixtures of natural organic matter, free chlorine and
monochloramine. Environ. Sci. Technol. 2009, 43, (10), 3872-3877.
24. American Public Health Association; American Water Works
Association; Water Environment Federation, Standard methods for the
examination of water and wastewater. Washington D.C., 2005.
25. Triantafyllidou, S.; Parks, J.; Edwards, M., Lead particles in potable
water. J. Am. Water Works Assoc. 2007, 99, (6), 107-117.
26. Valentine, R. L.; Jafvert, C. T.; Vikesland, P. J., Chloramine
decomposition in distribution system and model waters. AWWA Reserch
Foundation: Denver, Co, 1998.
27. Vikesland, P. J.; Ozekin, K.; Valentine, R. L., Monochloramine decay in
model and distribution system waters. Water Res. 2001, 35, (7), 1766-1776.
28. Trofe, T. W.; Inman, G. W.; Johnson, J. D., Kinetics of monochloramine
decomposition in the presence of bromide. Environ. Sci. Technol. 1980, 14, (5),
544-549.
29. Bousher, A.; Brimblecombe, P.; Midgley, D., Kinetics of reactions in
solutions containing monochloramine and bromide. Water Res. 1989, 23, (8),
1049-1058.
30. Wang, Y.; Xie, Y.; Li, W.; Wang, Z.; Giammar, D. E., Formation of
lead(IV) oxides from lead(II) compounds. Environ. Sci. Technol. 2010, 44, (23),
8950-8956.
31. Lin, Y. P.; Valentine, R. L., The release of lead from the reduction of
lead oxide (PbO2) by natural organic matter. Environ. Sci. Technol. 2008, 42, (3),
760-765.
32. Xie, Y.; Wang, Y.; Singhal, V.; Giammar, D. E., Effects of pH and
carbonate concentration on dissolution rates of the lead corrosion product PbO2.
Environ. Sci. Technol. 2010, 44, (3), 1093-1099.
33. Stumm, W.; Morgan, J. J., Aquatic chemistry, 3rd ed. Wiley Interscience:
New York, 1996.
34. Hiemstra, T.; Rahnemaie, R.; van Riemsdijk, W. H., Surface
complexation of carbonate on goethite: IR spectroscopy, structure and charge
distribution. J. Colloid Interface Sci. 2004, 278, (2), 282-290.
35. Garisto, N. C.; Garisto, F., The dissolution of UO2: A thermodynamic
98
approach. Nucl. Chem. Waste. Man 1986, 6, (3–4), 203-211.
36. Shi, Z.; Stone, A. T., PbO2(s, Plattnerite) reductive dissolution by natural
organic matter: reductant and inhibitory subfractions. Environ. Sci. Technol.
2009, 43, (10), 3604-3611.
37. Dryer, D. J.; Korshin, G. V., Investigation of the reduction of lead
dioxide by natural organic matter. Environ. Sci. Technol. 2007, 41, (15), 5510-
5514.
38. Sander, A.; Berghult, B.; Ahlberg, E.; Broo, A. E.; Johansson, E. L.;
Hedberg, T., Iron corrosion in drinking water distribution systems—surface
complexation aspects. Corros. Sci. 1997, 39, (1), 77-93.
39. McNeill, L. S.; Edwards, M., Iron pipe corrosion in distribution systems.
J. Am. Water Works Assoc. 2001, 93, (7), 88-100.
40. Shi, Z.; Stone, A. T., PbO2(s, Plattnerite) reductive dissolution by
aqueous manganous and ferrous ions. Environ. Sci. Technol. 2009, 43, (10),
3596-3603.
41. Heller-Grossman, L.; Manka, J.; Limoni-Relis, B.; Rebhun, M.,
Formation and distribution of haloacetic acids, THM and TOX in chlorination of
bromide-rich lake water. Water Res. 1993, 27, (8), 1323-1331.
42. Chang, E. E.; Lin, Y. P.; Chiang, P. C., Effects of bromide on the
formation of THMs and HAAs. Chemosphere 2001, 43, (8), 1029-1034.
43. Agus, E.; Voutchkov, N.; Sedlak, D. L., Disinfection by-products and
their potential impact on the quality of water produced by desalination systems:
A literature review. Desalination 2009, 237, (1-3), 214-237.
44. Lin, Y. P.; Valentine, R. L., Reductive dissolution of lead dioxide (PbO2)
in acidic bromide solution. Environ. Sci. Technol. 2010, 44, (10), 3895-3900.
45. Jafvert, C. T.; Valentine, R. L., Reaction scheme for the chlorination of
ammoniacal water. Environ. Sci. Technol. 1992, 26, (3), 577-786.
46. Ozekin, K.; Valentine, R. L.; Vikesland, P. J., Modeling the
decomposition of disinfecting residuals of chloramine. In Water Disinfection and
Natural Organic Matter: Characterization and Control, 1996.
47. Vikesland, P. J.; Valentine, R. L., Reaction pathways involved in the
reduction of monochloramine by ferrous iron. Environ. Sci. Technol. 2000, 34,
(1), 83-90.
48. Amy, G.; Siddiqui, M.; Zhai, W.; Debroux, J.; Odem, W. Survay of

99
bromide in drinking water and impacts on DBP formation. AWWARF and
AWWA: Denver, CO., 1994.
49. Galal-Gorchev, H.; Morris, J. C., Formation and stability of bromamide,
bromimide, and nitrogen tribromide in aqueous solution. Inorg. Chem. 1965, 4,
(6), 899-905.
50. Zhang, Y.; Zhang, Y. Y.; Lin, Y. P., Fast detection of lead dioxide (PbO2)
in chlorinated drinking water by a two-stage iodometric method. Environ. Sci.
Technol. 2010, 44, (4), 1347-1352.
51. USEPA, Method 200.8: determination of trace element in waters and
wastes by ICP-MS. . In Revision 5.4., Environmental Monitoring Systems
Laboratory, Office of research and Development, USEPA: Cincinnati, Ohio,
1994.
52. Murray, J. W.; Balistrieri, L. S.; Paul, B., The oxidation state of
manganese in marine sediments and ferromanganese nodules. Geochim.
Cosmochim. Acta 1984, 48, (6), 1237-1247.
53. Ali, S. P.; Blesa, M. A.; Morando, P. J.; Regazzoni, A. E., Reductive
dissolution of hematite in acidic iodide solutions. Langmuir 1996, 12, (20),
4934-4939.
54. Fox, P. M.; Davis, J. A.; Luther, G. W., The kinetics of iodide oxidation
by the manganese oxide mineral birnessite. Geochim. Cosmochim. Acta 2009, 73,
(10), 2850-2861.
55. Allard, S.; von Gunten, U.; Sahli, E.; Nicolau, R.; Gallard, H., Oxidation
of iodide and iodine on birnessite (delta-MnO2) in the pH range 4-8. Water Res.
2009, 43, (14), 3417-3426.
56. Liu, H. Z.; Korshin, G. V., Investigation of the kinetics and mechanisms
of the oxidation of cerussite and hdyrocerussite by chlorine. Environ. Sci.
Technol. 2008, 42, (9), 3241-3247.
57. Wang, Y.; Xie, Y.; Li, W.; Wang, Z.; Giammar, D. E., Formation of
lead(IV) oxides from lead(II) compounds. Environ. Sci. Technol. 2010, 44, (23),
8950-8956.
58. Van Cappellen, P.; Charlet, L.; Stumm, W.; Wersin, P., A surface
complexation model of the carbonate mineral-aqueous solution interface.
Geochim. Cosmochim. Acta 1993, 57, (15), 3505-3518.
59. Parkhurst, D. L.; Appelo, C. A. J., PHREEQC Interactive. Vesion

100
2.12.4.590. In U S Geological Survey: 2005.