detecting buried firearms using multiple geophysical technologies
TRANSCRIPT

The author(s) shown below used Federal funds provided by the U.S. Department of Justice and prepared the following final report: Document Title: Detecting Buried Firearms Using Multiple
Geophysical Technologies Author: John J. Schultz Document No.: 227935
Date Received: August 2009 Award Number: 2007-DN-BX-K304 This report has not been published by the U.S. Department of Justice. To provide better customer service, NCJRS has made this Federally-funded grant final report available electronically in addition to traditional paper copies.
Opinions or points of view expressed are those
of the author(s) and do not necessarily reflect the official position or policies of the U.S.
Department of Justice.

NIJ Final Report
Detecting Buried Firearms Using Multiple Geophysical Technologies
(2007-DN-BX-K304)
PI: John J. Schultz
January 26, 2009
This document is a research report submitted to the U.S. Department of Justice. This report has not been published by the Department. Opinions or points of view expressed are those of the author(s)
and do not necessarily reflect the official position or policies of the U.S. Department of Justice.
ABSTRACT
Geophysical technologies are non-destructive remote sensing tools that are routinely used
as part of the multidisciplinary protocol in death investigations to search for buried bodies and
forensic evidence. The purpose of a forensic geophysical survey is to detect a buried object (e.g.,
clandestine grave or buried body) that is recognized as an anomaly, or an area of contrasting
properties in the soil. The most useful method for determining the applicability of using
geophysical tools to detect buried evidence is to set up a controlled research site to monitor and
detect the specific items in question. For example, controlled geophysical research has been very
important in demonstrating how ground penetrating radar (GPR) can be used to locate buried
bodies from forensic contexts (Davenport, 2001a; Mellett, 1992; Nobes, 2000; Reynolds, 1997;
Schultz, 2007).
The objective of this research project was to improve standard geophysical detection
methods used to search for street-level firearms, commonly involved in crimes, that have been
buried for the purposes of concealing or discarding them. This project entailed burying 32
metallic objects including 16 different firearms that represent various weapon types (revolver,
derringer, shotgun, semi-automatic rifle, and pistol), 10 miscellaneous weapons (blunt and sharp
edged items) and six pieces of scrap metal. Then the weapons were tested at depths of 5cm
increments using five different geophysical technologies: GPR with 500- and 800-MHz
antennae, an all-metal detector, advanced digital metal detector with a standard and large size
search coil, a ground conductivity meter, and a magnetic locator. This research served to address
how the type of firearm and the metallic materials that comprise the weapons affect detection.
Ultimately, this project provides guidelines for buried weapons searches.
- 2
This document is a research report submitted to the U.S. Department of Justice. This report has not been published by the Department. Opinions or points of view expressed are those of the author(s)
and do not necessarily reflect the official position or policies of the U.S. Department of Justice.

TABLE OF CONTENTS
Abstract 2
Table of Contents 3
Chapter 1: Purpose, goals, and objectives 5
Chapter 2: Literature Review 7
Chapter 3: Research Design & Methods 10
• Research Site 10 • Forensic Targets 11 • Burial Protocol 12 • Quality Control 18 • Geophysical Tools Tested 20
Chapter 4: Magnetic Locator 21
• Magnetic Locator Theory 21 • Data Collection Parameters 23 • Results 24
o Firearms 24 o Miscellaneous Weapons 25 o Scrap Metals 26 o Control Holes 27
Chapter 5: All-Metal Detector 31
• All-Metal Detector Theory 31 • Data Collection Parameters 32 • Results 33
o Firearms 33 o Miscellaneous Weapons 34 o Scrap Metals 35 o Control Holes 36
Chapter 6: Advanced Metal Detector 40
• Advanced Metal Detector Theory 40 • Data Collection Parameters 42 • Results 44
o Simple Detection: Firearms 44
- 3
This document is a research report submitted to the U.S. Department of Justice. This report has not been published by the Department. Opinions or points of view expressed are those of the author(s)
and do not necessarily reflect the official position or policies of the U.S. Department of Justice.

o Simple Detection: Miscellaneous Weapons 45 o Simple Detection: Scrap Metals 46 o Comparison of Medium and Large Search Coils 49 o Quickstart Ferrous Content/Conductivity Readings 52 o Advanced Learn Feature 55 o Control Holes 57
Chapter 7: Conductivity Meter 58
• Conductivity Meter Theory 58 • Data Collection Parameters & Processing 59 • Results 65
o Firearms 65 o Miscellaneous Weapons 66 o Scrap Metals 67 o Control Hole 68
Chapter 8: GPR 77
• GPR Theory 77 • Data Collection Parameters & Processing 79 • Results 82
Chapter 9: Discussion, Guidelines, & Conclusions 90
• Discussion 90 • Search Guidelines 102
o Guidelines for Choosing a Geophysical Tool 102 o Guideline Prior to the Search 104 o Guidelines During the Search 105
• Conclusions 106
Chapter10: References 107
Appendices 111
• A: Conductivity Maps 111 • B: GPR Imagery 172
- 4
This document is a research report submitted to the U.S. Department of Justice. This report has not been published by the Department. Opinions or points of view expressed are those of the author(s)
and do not necessarily reflect the official position or policies of the U.S. Department of Justice.

CHAPTER 1: PURPOSE, GOALS, & OBJECTIVES
By using the information provided by this research an investigator can perform a buried
weapons search in a more reliable and timely manner. Law enforcement personnel generally use
a generic metal detector, with or without limited discrimination technology, to search for a
buried weapon used in a crime. All too often, personnel using the detector have very little
training with metal detectors, and the geophysical survey results in an abundance of false hits
that need to be intrusively checked by digging. Most investigators that have been involved in
these types of searches would confirm that a considerable amount of time is required to check all
of the geophysical hits and would welcome research that improves general search guidelines.
Also, considering that the advanced metal detectors and magnetic locators that will be used for
this research are reasonably priced, geophysical research that focuses on the application of these
affordable tools in locating buried firearms would be beneficial to law enforcement. In
particular, this research has generated search guidelines that are specific to the weapon, and/or
the metallic materials that comprise the weapon, and the type of geophysical tool that should be
used for a search.
The purpose of this research project was to improve standard geophysical detection
methods used to search for street-level firearms, commonly used in crimes, which have been
buried for the purpose of concealing or discarding them. It is important to note that this research
was expanded from the original proposal to include 10 miscellaneous weapons (blunt and sharp
force items) and six scrap metals for a total of 32 items that were tested.
- 5
This document is a research report submitted to the U.S. Department of Justice. This report has not been published by the Department. Opinions or points of view expressed are those of the author(s)
and do not necessarily reflect the official position or policies of the U.S. Department of Justice.

The goals and objectives of this project included the following:
• Determine the applicability of using multiple geophysical technologies to search for
buried street-level weapons.
• Determine which firearms and/or metallic materials can be detected by geophysical
instruments and whether specific instruments are better at detecting specific weapons due
to the materials that comprise each weapon.
• Determine the maximum depth that different buried firearms can be located.
• Provide basic guidelines for forensic investigators using geophysical technologies so they
will be better prepared to search for buried firearms.
• Provide guidelines for forensic investigators that are aimed at locating different types of
weapons using a specific geophysical tool or multiple geophysical tools.
- 6
This document is a research report submitted to the U.S. Department of Justice. This report has not been published by the Department. Opinions or points of view expressed are those of the author(s)
and do not necessarily reflect the official position or policies of the U.S. Department of Justice.

CHAPTER 2: LITERATURE REVIEW
Forensic geoscience (the study and application of earth materials to legal investigations)
is a burgeoning field that has the potential to significantly assist criminal investigations (Murray,
2004; Murray and Tedrow, 1975; Pye and Croft, 2004; Ruffell and McKinley, 2005). In
particular, the application of geophysics can greatly assist forensic investigations through the use
of geophysical technologies. Geophysical technologies are non-destructive remote sensing tools
that are becoming routinely used as part of the multidisciplinary protocol in death investigations
to search for buried bodies and forensic evidence. The purpose of a geophysical survey is to
detect a buried object that is recognized as an anomaly, or an area of contrasting properties in the
soil. In forensic contexts, geophysical methods are generally used to locate small anomalies near
the ground surface that are produced by graves, weapons, and other buried evidence comprised
of, or buried with, metallic materials. Geophysical surveys are not only important to locate
clandestine graves and weapons, they are also important to clear suspected areas so that searches
may be directed elsewhere.
One of the most useful methods for gaining experience in performing geophysical
surveys for buried evidence or features is to set up a controlled research site to monitor and
detect the specific items in question for some length of time. Since operator experience is a
major limiting factor when using geophysical technologies, controlled studies not only provide
operators with experience in a known setting that is invaluable when they perform real-life
searches, they also provide operators with the knowledge of the limitations and applicability of
different geophysical tools for varying situations. Proponents of using geophysical surveys for
archaeological contexts have stressed the importance of controlled research to develop
- 7
This document is a research report submitted to the U.S. Department of Justice. This report has not been published by the Department. Opinions or points of view expressed are those of the author(s)
and do not necessarily reflect the official position or policies of the U.S. Department of Justice.

techniques and approaches that increase the effectiveness of geophysical surveys (Isaacson et al.,
1999; Schurr, 1997). This has resulted in the construction of controlled archaeological test sites
to provide training and research in archaeogeophysics (e.g., Isaacson et al., 1999).
More specifically, controlled forensic geophysical studies have been very important
in determining the utility of ground-penetrating radar (GPR) for body searches in various soils
and in providing GPR operators with experience in a known setting (Davenport et al., 1990;
France et al., 1992; France et al., 1997; Freeland et al., 2003; Schultz, 2003; Schultz et al., 2006).
Controlled GPR studies have generally used buried pig cadavers as proxies for human bodies to
distinguish the type of geophysical response that is produced over time by a decomposing buried
body in varying soil conditions and depths. As a result of this past controlled research, GPR is
now being used to successfully locate clandestine burials of homicide victims in different soil
conditions (Davenport, 2001a; Mellett, 1992; Nobes, 2000; Reynolds, 1997; Schultz, 2007).
Another tool that may show promise for forensic contexts is a conductivity meter.
Conductivity is a tool often used for mapping archaeological sites such as 5000-year-old shaft
tombs in Jordan and Greek settlements dating from the Roman and Early Byzantine periods
(Rowlands and Sarris, 2007; Wynn, 1986). Although conductivity has shown potential on
archaeological sites, this technique remains mostly untested in forensic settings. Only one case
study is presented in the academic literature describing the use of an older conductivity meter in
conjunction with GPR to detect a grave (Ruffell and McKinley, 2005; Nobes, 2000). In recent
years, conductivity meters such as the Geonics EM-38 models have been greatly reduced in size
to allow for uses in different fields. This new design is ideal for forensic scenes where the
anomalies created by clandestine burials and buried forensic evidence tend to be shallower than
anomalies seen in archaeology. The smaller conductivity meters are more sensitive to - 8
This document is a research report submitted to the U.S. Department of Justice. This report has not been published by the Department. Opinions or points of view expressed are those of the author(s)
and do not necessarily reflect the official position or policies of the U.S. Department of Justice.

conductivity changes at shallow depths, thus maximizing the chances to uncover buried evidence
on forensic scenes (Davenport, 2001a).
The geophysical tool most often used by crime scene personnel to search for weapons
tossed into fields (Goddard, 1977) and spent projectiles and casings that are generally located on
the ground surface or directly under the ground surface is a metal detector. Metal detectors are
generally used to locate small objects at shallow depths and large objects at deeper depths
(Garrett, 1998; Nelson, 2004). While numerous sources identify geophysical technologies as
appropriate tools that can be used to search for buried firearms, bullets and casings, and items
comprised of metallic material (Clark, 1990; Connor and Scott, 1998; Davenport, 2001a;
Davenport, 2001b; Dupras et al., 2006; Gaffney and Gater, 2003; Garrett, 1998; Goddard, 1977;
Hunter and Cox, 2005; Killam, 2004; Nickell and Fischer, 1999; Nielson, 2003; Scott and Fox,
1987; Sonderman, 2001), there have been no controlled geophysical studies reported in the
academic literature that focus on the application of locating buried firearms and weapons using
these technologies. Unfortunately, only a few references (Murray and Tedrow, 1975; Nielsen,
2003; Schonstedt Instrument Company, 1998) briefly discuss locating weapons using a metal
detector or magnetic locator by suggesting that handguns may be located down to a maximum
depth of a foot or so beneath the ground surface. However, no consideration is given to the
weapons type, the size, or the metallic materials of handguns. Considering that all-metal
detectors, advanced metal detectors, and magnetic locators are reasonably priced, research that
focuses on the application of locating buried firearms using these types of technologies would be
beneficial to law enforcement because a number of these tools should be within the means of
their budgets.
- 9
This document is a research report submitted to the U.S. Department of Justice. This report has not been published by the Department. Opinions or points of view expressed are those of the author(s)
and do not necessarily reflect the official position or policies of the U.S. Department of Justice.
CHAPTER 3: RESEARCH DESIGN & METHODS
Research Site
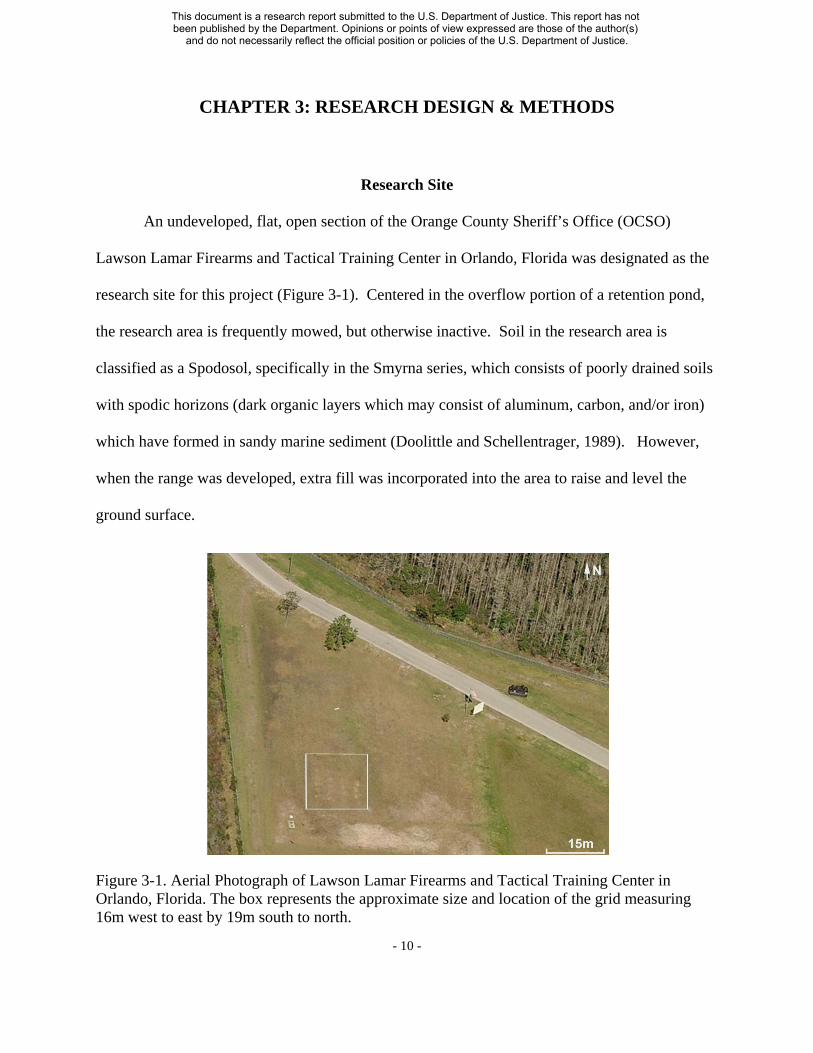
An undeveloped, flat, open section of the Orange County Sheriff’s Office (OCSO)
Lawson Lamar Firearms and Tactical Training Center in Orlando, Florida was designated as the
research site for this project (Figure 3-1). Centered in the overflow portion of a retention pond,
the research area is frequently mowed, but otherwise inactive. Soil in the research area is
classified as a Spodosol, specifically in the Smyrna series, which consists of poorly drained soils
with spodic horizons (dark organic layers which may consist of aluminum, carbon, and/or iron)
which have formed in sandy marine sediment (Doolittle and Schellentrager, 1989). However,
when the range was developed, extra fill was incorporated into the area to raise and level the
ground surface.
Figure 3-1. Aerial Photograph of Lawson Lamar Firearms and Tactical Training Center in Orlando, Florida. The box represents the approximate size and location of the grid measuring 16m west to east by 19m south to north.
- 10
This document is a research report submitted to the U.S. Department of Justice. This report has not been published by the Department. Opinions or points of view expressed are those of the author(s)
and do not necessarily reflect the official position or policies of the U.S. Department of Justice.
A 16m (west to east) by 19m (south to north) grid was constructed (Figures 3-1 and 3-2)
for this research project. The research grid contained a total of 32 buried metallic objects and
one control hole (consisting of only backfill) (Figure 3-2). Two control holes (consisting of only
backfill) were also located outside the grid. Six rows each contained five buried items, while
row G contained two buried items and one control hole. Rows A and B contained only buried
firearms, rows C and D contained both firearms and scrap metal, rows E and F contained only
blunt or edged weapons, and the final row G was added to incorporate two additional firearms
and a control hole.
Forensic Targets
Included in this research were 16 firearms, ten miscellaneous weapons (blunt or sharp
edged), and six pieces of assorted scrap metals (Tables 3-1 to 3-3 and Figures 3-3 to 3-6). A
collection of firearms most commonly associated with street-level crime in Central Florida was
provided for this research by the Orange County Sheriff’s Office (OCSO), and consisted of a
derringer, eight pistols, four revolvers, two shotguns, and a rifle (Table 3-1 and Figure 3-3 to 3
4). The firearms selected represent a variety of metallic compositions, finishes, and lengths. The
majority of the firearm frame compositions consist of steel, with several utilizing other metals or
materials, such as zinc, aluminum, or polymer.
In order to gain access to the weapons for research, all protocols outlined by the OCSO’s
security procedures, including the decommissioning of the firearms, were followed. Firearms
were decommissioned by removing or filing firing pins and blocking the firing pin channel and
barrel with JB Weld® cold weld compound. Of note is G11, the Glock 9mm; due to the minimal
- 11
This document is a research report submitted to the U.S. Department of Justice. This report has not been published by the Department. Opinions or points of view expressed are those of the author(s)
and do not necessarily reflect the official position or policies of the U.S. Department of Justice.

amount of metal in the polymer frame, the firing pin was removed and welded into the grip, and
both the firing pin channel and barrel were blocked.
A variety of blunt (mallet, hammer, prybar, baton, brass knuckles) and edged (machete,
sword, Buck knife, Philip’s head screwdriver, scissors) weapons which have been recovered
from OCSO crime scenes were also included, and primarily consisted of steel (Table 3-2 and
Figure 3-5). The scrap metals included pieces of copper, aluminum, and iron (including rebar),
representing trash metals which are frequently encountered during weapons searches (Table 3-3
and Figure 3-6).
Burial Protocol
The maximum depth of detection was determined for all items using each of the
geophysical tools except for the GPR unit. Data collection started at a depth of 20-25cm. Once
data collection was completed for each depth, the items and control hole were dug 5cm deeper
for each re-burial and the weapons were placed on their flat side (Figure 3-7). Plastic stakes and
pin flags with plastic shafts were placed in the loose soil of each hole to mark the location of the
items and control hole. When time permitted, intervals of approximately one to two weeks from
burial to data collection allowed for soil compaction.
- 12
This document is a research report submitted to the U.S. Department of Justice. This report has not been published by the Department. Opinions or points of view expressed are those of the author(s)
and do not necessarily reflect the official position or policies of the U.S. Department of Justice.

Figure 3-2. Map of research area containing a total of thirty-two buried metallic objects and one control hole.
- 13
This document is a research report submitted to the U.S. Department of Justice. This report has not been published by the Department. Opinions or points of view expressed are those of the author(s)
and do not necessarily reflect the official position or policies of the U.S. Department of Justice.

Table 3-1. Detailed information for the firearm sample. Grid
Location Firearm Type/Ammunition Metal/Composition Special Finish
Length (mm)
Unloaded Weight
( ) A1 Davis Derringer
D9 Derringer/
9mm Steel Chrome-plated 119 12.8
A2 Raven Arms MP-25 Pistol/.25 Zinc Alloy/Steel Chrome-
plated 123 14.4
A3 Hi-Point Model C Pistol/9mm Steel/Polymer Blued 178 35
A4 Smith & Wesson 5906 Pistol/9mm Stainless Steel 190 38.3
A5 Glock Model 19 Pistol/9mm Polymer Frame/ Steel Slide and
Firing Pin Blued/Tenifer 187 20.6
B1 North American
Arms Mini-Magnum
Revolver/.22 Magnum Stainless Steel 130 6.4
B2 Jennings Bryco 59 Pistol/9mm
Zinc Alloy/ Steel Magazine
M M M i
Satin Nickel-plated 170 33.6
B3 Smith & Wesson Model 686
Revolver/.357 Magnum Stainless Steel 235 37
B4 Lorcin L380 Pistol/.380 Aluminum Frame, Magazine, Slide/Steel
Blued 171 30.4
B5 Colt Commander Pistol/.45 ACP Steel Blued 196 27
C1 Smith & Wesson Model 37
Revolver/.38 Special Steel Nickel-plated 167 25
C2 RG Industries RG23
Revolver/ .22 Long rifle
Aluminum Frame/ Steel Barrel and
Cylinder Blued 148 14.4
C5 Norinco AK
Hunter, Wooden Stock
Rifle/7.62 Steel/ Polymer Blued 1067
125.5 Includes Wooden
Stock
D5 Mossberg Model 500A, Pistol Grip
Shotgun/ 12 Gauge
Steel/ Polymer Blued 711 96
G1 Remington
870,Front Folding Knoxx COPstock
Shotgun/ 12 Gauge Steel Parkerized 762 116
(estimate)
G2 Ruger P89 Pistol/ 9mm Aluminum/Stainless Steel
Terhune Anticorro 203 32
- 14
This document is a research report submitted to the U.S. Department of Justice. This report has not been published by the Department. Opinions or points of view expressed are those of the author(s)
and do not necessarily reflect the official position or policies of the U.S. Department of Justice.

Table 3- 2. Miscellaneous weapons
Grid Location Type Metal/Composition Length (mm)
E1 Scissors Steel 200
E2 Buck Knife Stainless Steel 222
E3 Prybar Steel 322
E4 Mallet Steel/fiberglass handle
384 Includes handle
E5 Machete Steel 682
F1 Baton Steel 257
F2 Philip’s Head Screwdriver Steel 262
F3 Brass Knuckles Brass (Copper and Zinc) 116
F4 Claw Hammer Steel 350
F5 Sword Steel/Brass Hilt? 810
Table 3-3. Scrap Metals
Grid Location Type Metal/
Composition Length (mm)
C3 Aluminum Edging Aluminum 530 C4 Solid Iron Pipe Iron 480 D1 Hollow Copper Tube Copper 685 D2 Rusty Iron Pipe Iron 570 D3 Solid Aluminum Pipe Aluminum 477 D4 Thin Rebar Iron 665
- 15
This document is a research report submitted to the U.S. Department of Justice. This report has not been published by the Department. Opinions or points of view expressed are those of the author(s)
and do not necessarily reflect the official position or policies of the U.S. Department of Justice.

Figure 3-3. Thirteen of the decommissioned firearms utilized in the project represented a derringer, revolvers, and pistols.
Figure 3-4. The other three decommissioned firearms utilized in the project represented two shotguns and a rifle.
- 16
This document is a research report submitted to the U.S. Department of Justice. This report has not been published by the Department. Opinions or points of view expressed are those of the author(s)
and do not necessarily reflect the official position or policies of the U.S. Department of Justice.

Figure 3-5. Ten blunt and edged weapons utilized for the project (items not scaled to size)
Figure 3-6. Six pieces of assorted scrap metals utilized for the project
- 17
This document is a research report submitted to the U.S. Department of Justice. This report has not been published by the Department. Opinions or points of view expressed are those of the author(s)
and do not necessarily reflect the official position or policies of the U.S. Department of Justice.

Figure 3-7. Example of how a firearm (pistol) was placed back in hole after deepening the hole.
Quality Control
During the summer of 2008, due to considerable storms and the rainy season in the
Central Florida area, the field site was periodically flooded and the ground was excessively
saturated with water. Through our quality control, we realized that the results were affected by
the amount of water present in the ground. Therefore, much of the data collection was redone
once the field site had dried. Quality control for the conductivity meter consisted of processing
the data for each depth prior to data collection for the following depth to ensure there were no
spurious results due to the ground being saturated by water. If any issues were noted, data
collection was redone.
In order to maintain quality control for the magnetic locator, the all-metal detector, and
the advanced metal detector, we instituted a number of safeguards. Ground water saturation and
foreign metallic debris that were added to the site had to be addressed. Due to the fact that the
research site is a live firearms range, we learned that our site would periodically become littered
- 18
This document is a research report submitted to the U.S. Department of Justice. This report has not been published by the Department. Opinions or points of view expressed are those of the author(s)
and do not necessarily reflect the official position or policies of the U.S. Department of Justice.

with foreign bullet debris due to training. As a result, we re-tested the entire sample individually
using the magnetic locator, the all-metal detector, and the advanced metal detector during the dry
period in holes devoid of any foreign metallic debris by continually digging up and reburying the
weapons until the maximum depth of detection was determined. Each item was tested at least
once or twice to confirm the results. Collecting data without allowing two weeks for soil
compaction was not a problem because it was determined early on that the loose soil did not
produce false anomalies.
Data were collected directly over the buried metallic targets using the magnetic locator,
the all-metal detector, and the advanced metal detector. A probe was used to verify the exact
target location that was marked by a plastic stake. By knowing the exact spot where the target
was located, it was possible to confirm that the readings were due to the buried target and not the
result of foreign metallic material in the soil outside the hole. When assessments were made as
to whether the target was detected, two additional project members provided inter-observer
confirmation of the author’s results. Also, surveying over each buried target with the magnetic
locator, the all-metal detector, and the advanced metal detector was conducted in both
north/south and east/west direction.
- 19
This document is a research report submitted to the U.S. Department of Justice. This report has not been published by the Department. Opinions or points of view expressed are those of the author(s)
and do not necessarily reflect the official position or policies of the U.S. Department of Justice.
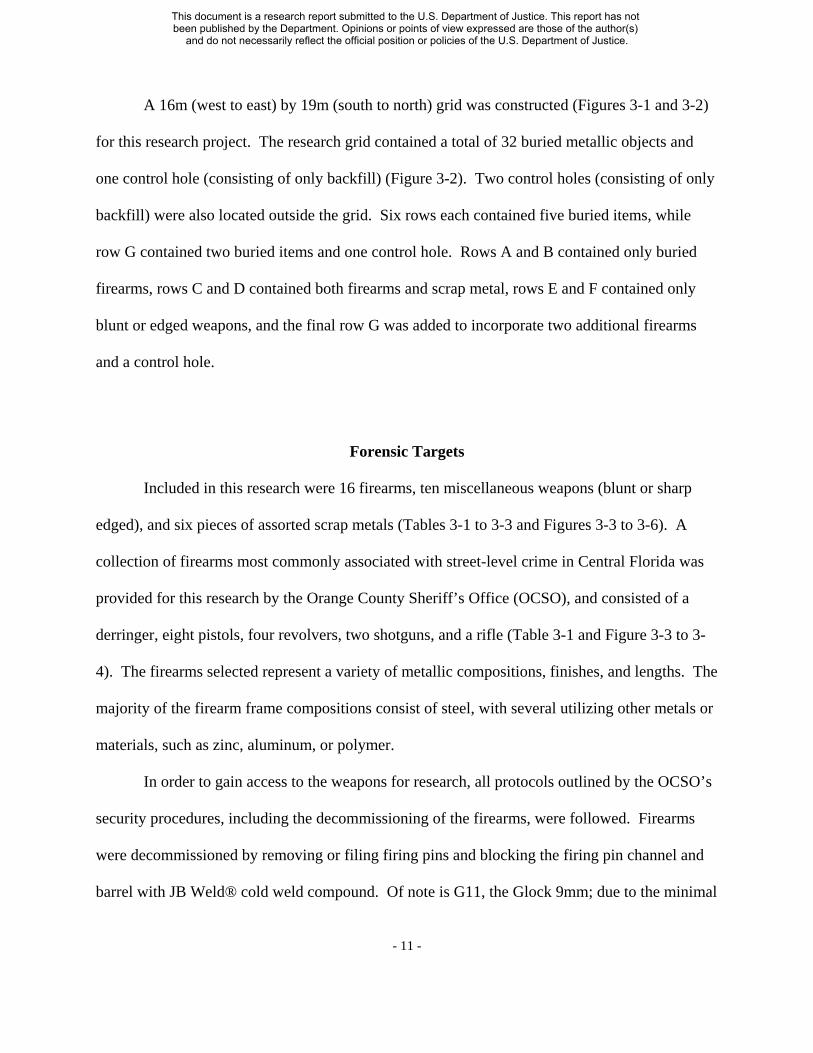
Geophysical Tools Tested
The geophysical tools used for this research have the ability to detect metallic objects and
provide consistent readings, allowing for dependable results which should be replicable during
actual forensic search scenarios. Chosen due to their use in archaeology and forensics, and their
accessibility and efficiency, many law enforcement agencies will find a number of these tools
(metal detectors and magnetic locators) easy to purchase, relatively inexpensive, and easy to use.
Five different geophysical instruments were tested that represent the most common types of
geophysical tools used to search for buried evidence comprised of metal:
• magnetic locator
• all-metal detector with 11 inch (27.9cm) search coil
• advanced digital metal detector with 10.5 inch (26.7cm) search coil an additional
aftermarket 15 inch (38.1cm) search coil
• ground conductivity meter
• cart mounted GPR unit with 500-MHz and 800-MHz antennae
- 20
This document is a research report submitted to the U.S. Department of Justice. This report has not been published by the Department. Opinions or points of view expressed are those of the author(s)
and do not necessarily reflect the official position or policies of the U.S. Department of Justice.

CHAPTER 4: MAGNETIC LOCATOR
Magnetic Locator Theory
Magnetic locators utilize sensors (one or two, depending upon model) to measure local
variations in the earth’s magnetic field and to detect ferromagnetic objects (Davenport, 2001;
Dupras et al., 2006; Hunter and Cox, 2005; Schonstedt Instrument Company, 1998). The use of
magnetic profiling requires basic familiarity with the locator but is relatively easy to learn, and
the devices themselves are some of the more inexpensive geophysical tools (Davenport, 2001;
Hunter and Cox, 2005).
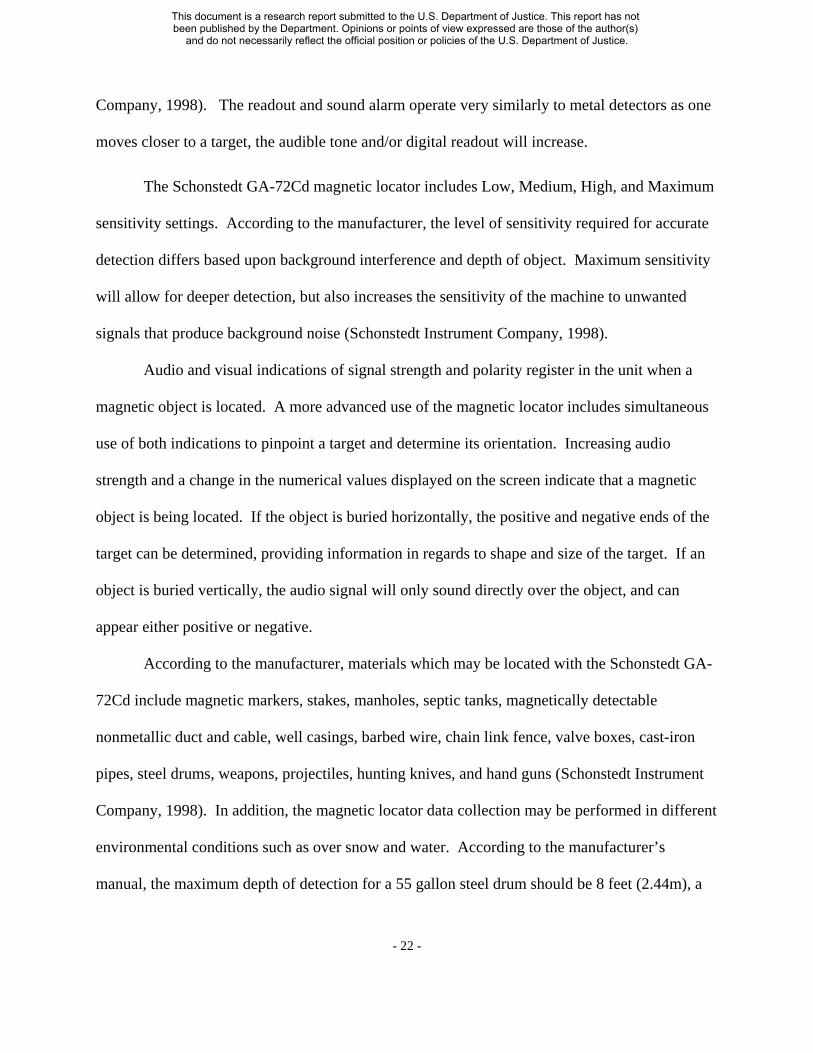
The magnetic locator that was used for this research project is manufactured by
Schonstedt Instrument Company (model #: GA-72Cd) (Figure 4-1) and is essentially a simple
magnetometer configured as a magnetic gradiometer (two sensors instead of one). The two
sensors are spaced roughly 14 inches (35.6cm) apart and respond to the differences in the
magnetic field around the locator. Magnetic locators are generally designed as a walking staff
consisting of a long shaft and a small control box at the top end (Figure 4-1). The shaft, which is
swept from side to side in front of the operator, contains two sensors that respond to changes in
magnetic fields created by buried ferromagnetic objects. The magnetic locator is designed to
detect the magnetic field of ferromagnetic materials such as iron and steel, while ignoring non
metallic materials such as gold, silver, copper, brass, and aluminum (Schonstedt Instrument
Company, 1998). In addition, the manufacturer asserts that this equipment can aid explosive
ordnance-disposal technicians and law enforcement officers during area search operations for
improvised explosive devices, buried ordnance, and covered weapons (Schonstedt Instrument
- 21
This document is a research report submitted to the U.S. Department of Justice. This report has not been published by the Department. Opinions or points of view expressed are those of the author(s)
and do not necessarily reflect the official position or policies of the U.S. Department of Justice.
Company, 1998). The readout and sound alarm operate very similarly to metal detectors as one
moves closer to a target, the audible tone and/or digital readout will increase.
The Schonstedt GA-72Cd magnetic locator includes Low, Medium, High, and Maximum
sensitivity settings. According to the manufacturer, the level of sensitivity required for accurate
detection differs based upon background interference and depth of object. Maximum sensitivity
will allow for deeper detection, but also increases the sensitivity of the machine to unwanted
signals that produce background noise (Schonstedt Instrument Company, 1998).
Audio and visual indications of signal strength and polarity register in the unit when a
magnetic object is located. A more advanced use of the magnetic locator includes simultaneous
use of both indications to pinpoint a target and determine its orientation. Increasing audio
strength and a change in the numerical values displayed on the screen indicate that a magnetic
object is being located. If the object is buried horizontally, the positive and negative ends of the
target can be determined, providing information in regards to shape and size of the target. If an
object is buried vertically, the audio signal will only sound directly over the object, and can
appear either positive or negative.
According to the manufacturer, materials which may be located with the Schonstedt GA
72Cd include magnetic markers, stakes, manholes, septic tanks, magnetically detectable
nonmetallic duct and cable, well casings, barbed wire, chain link fence, valve boxes, cast-iron
pipes, steel drums, weapons, projectiles, hunting knives, and hand guns (Schonstedt Instrument
Company, 1998). In addition, the magnetic locator data collection may be performed in different
environmental conditions such as over snow and water. According to the manufacturer’s
manual, the maximum depth of detection for a 55 gallon steel drum should be 8 feet (2.44m), a
- 22
This document is a research report submitted to the U.S. Department of Justice. This report has not been published by the Department. Opinions or points of view expressed are those of the author(s)
and do not necessarily reflect the official position or policies of the U.S. Department of Justice.

hunting knife should be 16 inches (40.64cm), and a discarded handgun should be 12 inches
(30.48cm) (Schonstedt Instrument Company, 1998).
Data Collection Parameters
The GA-72Cd magnetic locator was used very much like a metal detector in that it was
slowly waived in front of the operator, pointing at the ground. When the audio and visual
readings became stronger, an object was located by running the locator in an “x” type fashion
over the area. The point of strongest readings was therefore the buried magnetic object. The
Low sensitivity setting did not adequately detect the targets, and the Maximum setting reflected
too much background interference. The Medium and High settings provided the best balance
between audible target responses and constant background noise. Data was then collected as one
of three detection categories: no, slight and strong. Slight detection readings meant that a minor
change in the normal hum was audible but would not have been discernable during real-world
searches involving areas that are littered with trash metals and/or have a high mineral content as
there may be extensive background noise or other distractions.
- 23
This document is a research report submitted to the U.S. Department of Justice. This report has not been published by the Department. Opinions or points of view expressed are those of the author(s)
and do not necessarily reflect the official position or policies of the U.S. Department of Justice.
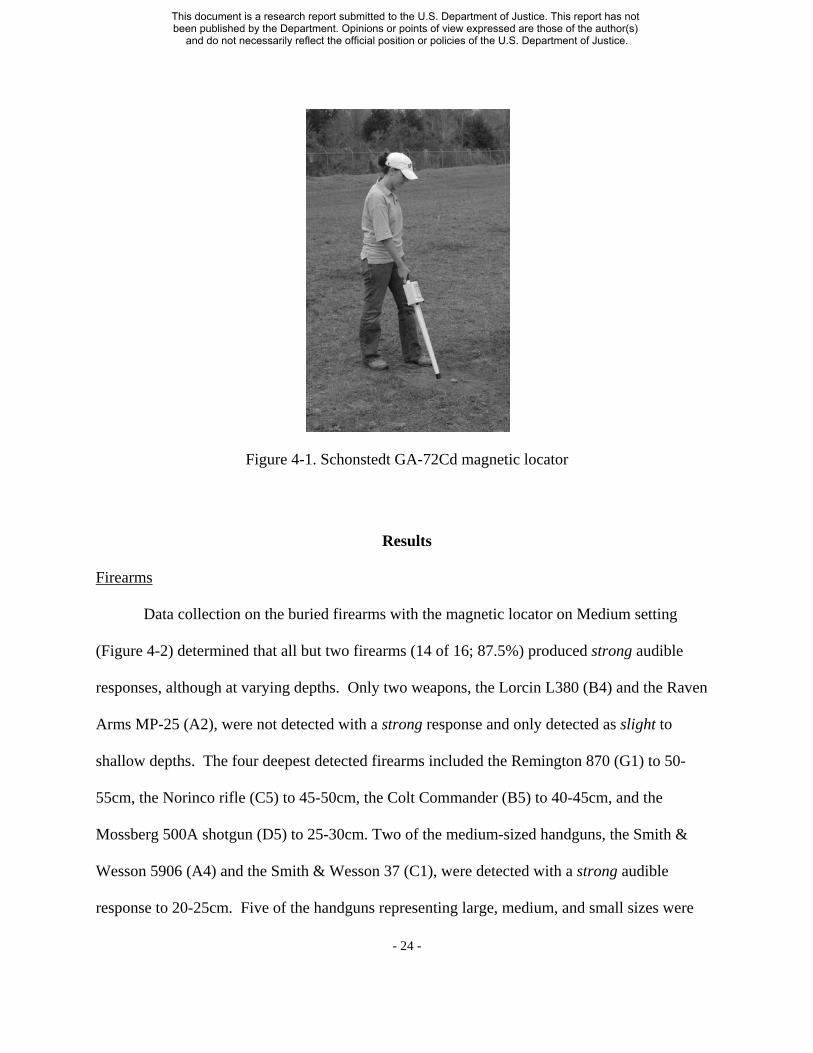
Figure 4-1. Schonstedt GA-72Cd magnetic locator
Results
Firearms
Data collection on the buried firearms with the magnetic locator on Medium setting
(Figure 4-2) determined that all but two firearms (14 of 16; 87.5%) produced strong audible
responses, although at varying depths. Only two weapons, the Lorcin L380 (B4) and the Raven
Arms MP-25 (A2), were not detected with a strong response and only detected as slight to
shallow depths. The four deepest detected firearms included the Remington 870 (G1) to 50
55cm, the Norinco rifle (C5) to 45-50cm, the Colt Commander (B5) to 40-45cm, and the
Mossberg 500A shotgun (D5) to 25-30cm. Two of the medium-sized handguns, the Smith &
Wesson 5906 (A4) and the Smith & Wesson 37 (C1), were detected with a strong audible
response to 20-25cm. Five of the handguns representing large, medium, and small sizes were
- 24
This document is a research report submitted to the U.S. Department of Justice. This report has not been published by the Department. Opinions or points of view expressed are those of the author(s)
and do not necessarily reflect the official position or policies of the U.S. Department of Justice.

detected with a strong response to 15-20cm and include the Smith & Wesson Model 686 (B3),
Ruger P89 (G2), Glock Model 19 (A5), Hi-Point Model C (A3), and the North American Arms
Mini-Revolver (B1). The Jennings Bryco 59 (B2) was detected to 10-15cm. The smallest
handgun, the Davis Derringer (A1), was only detected with a strong response to 5-10cm, while
the RG Industries RG23 (C2) was only detected to 0-5cm.
When data was collected with the magnetic locator on High setting (Figure 4-3), all 16
firearms produced strong audible responses, although at varying depths. The two largest
firearms, the Norinco AK rifle (C5) and the Remington 870 (G1) shotgun, produced strong
responses to 70-75cm. The Mossberg 500A (D5) shotgun and the large Colt Commander (B5)
were detected to 55-60cm, while the second largest handgun, the Ruger P89 (G2) was detected to
40-45cm, and the Smith & Wesson 5906 (A4), a larger handgun, was detected to 35-40cm. The
largest handgun and three medium-sized handguns produced a strong response down to 30
35cm: the Smith & Wesson Model 686 (B3), the Glock 19 (A5), the Jennings Bryco 59 (B2), and
the Smith & Wesson Model 37 (C1). Two medium-to-small handguns, the Hi-Point Model C
(A3) and the North American Arms Mini-Revolver (B1) were detected to 25-30cm, while the
smallest handgun, the Davis Derringer (A1), was detected to 20-25cm. The RG Industries RG
23 (C2) was only detected to 10-15cm. Finally, the Lorcin L380 (B4) and the Raven Arms MP
25 (A2) were only detected down to 5-10cm.
Miscellaneous Weapons
Data collection on the buried miscellaneous weapons with the magnetic locator on
Medium setting showed that nine out of ten miscellaneous weapons (90%) produced strong
audible responses (Figure 4-4). Only the brass knuckles (F3) did not produce any audible
- 25
This document is a research report submitted to the U.S. Department of Justice. This report has not been published by the Department. Opinions or points of view expressed are those of the author(s)
and do not necessarily reflect the official position or policies of the U.S. Department of Justice.

response once buried and only produced a slight audible response pre-burial. The most strongly
detected weapon was the Philip’s head screwdriver (F2) which produced a strong response to 70
75cm. Two weapons, the claw hammer (F4) and the scissors (E1), were also deeply detected
with strong responses down to 60-65cm, while the buck knife (E2) was detected with a strong
response to 25-30cm. The sword (F5), the mallet (E4), the prybar (E3), and the baton (F1)
produced strong responses to 15-20cm. Finally, the machete (E5) was only detected with a
strong audible response down to a depth of 0-5cm.
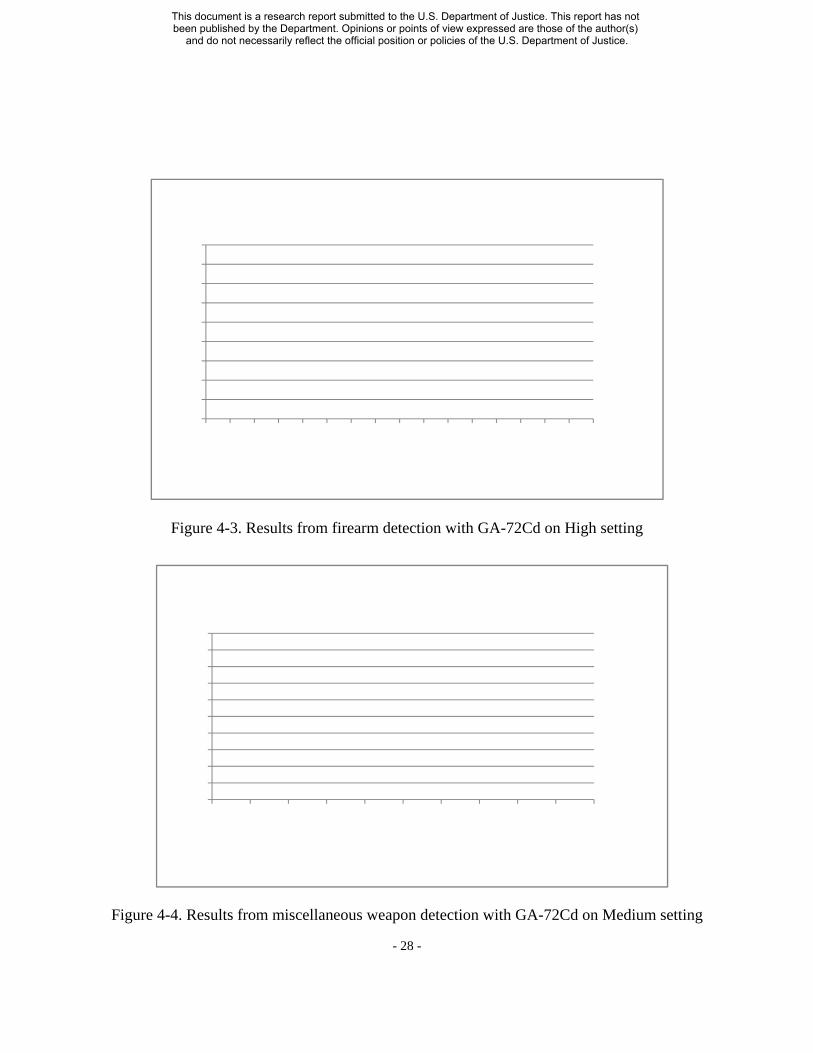
When data collection with the magnetic locator was used with the High setting (Figure 4
5), the Philip’s head screwdriver (F2) was the deepest detected item with a strong response down
to 80-85cm. The claw hammer (F4) and the scissors (E1) were also deeply detected with strong
audible responses to 60-65cm. The sword (F5) was detected to 40-45cm, the Buck knife (E2)
was detected to 35-40cm, and three targets produced strong responses to 25-30cm: the machete
(E5), the prybar (E3), and the baton (F1). Finally, the mallet (E4) produced a strong response
only to 20-25cm, while the brass knuckles (F3) only detected down to 0-5cm.
Scrap Metals
Data collection on the scrap metals with the magnetic locator on Medium setting (Figure
4-6) showed that only three of the scrap metal targets (50%), the rebar (D4), the solid iron pipe
(C4), and the rusty iron pipe (D2) produced strong audible responses prior to burial; the hollow
copper tube (D1), the aluminum edging (C3), and the solid aluminum pipe (D3) did not produce
any audible responses prior to burial. Once buried, the rusty iron pipe (D2) produced a strong
audible response to 55-60cm, the solid iron pipe (C4) produced a strong response to 40-45cm,
and the rebar (D4) produced a strong response down to a depth of 5-20cm. - 26
This document is a research report submitted to the U.S. Department of Justice. This report has not been published by the Department. Opinions or points of view expressed are those of the author(s)
and do not necessarily reflect the official position or policies of the U.S. Department of Justice.

0102030405060708090
Dep
thof
Detection
(cm)
Buried Firearms (Longest to Shortest)
Firearm Detection withMagnetic Locator on Medium Setting
SLIGHT
STRONG
When data collection was used with the magnetic locator on the High setting (Figure 4-7)
the rebar (D4), the rusty iron pipe (D2), and the solid iron pipe (C4) were still the only scrap
metals detected with strong audible responses down to depths of 65-70cm , 55-60cm, and 25
30cm, respectively.
Control Holes
It is important to note that a number of control holes (one inside the grid (G3) and two
outside the grid) were tested during data collection. The disturbed soil of the control holes did
not produce any audible response for the various depths when tested with the magnetic locator.
Figure 4-2. Results from firearm detection with GA-72Cd on Medium setting
- 27
This document is a research report submitted to the U.S. Department of Justice. This report has not been published by the Department. Opinions or points of view expressed are those of the author(s)
and do not necessarily reflect the official position or policies of the U.S. Department of Justice.
0
10
20
30
40
50
60
70
80
90
Dep
thof
Detection
(cm)
Buried Firearms (Longest to Shortest)
Firearm Detection withMagnetic Locator on High Setting
SLIGHTSTRONG
0102030405060708090100
Dep
thof
Detection
(cm)
Buried MiscellaneousWeapons (Longest to Shortest)
Miscellaneous Weapon Detection withMagnetic Locator on Medium Setting
SLIGHTSTRONG
Figure 4-3. Results from firearm detection with GA-72Cd on High setting
Figure 4-4. Results from miscellaneous weapon detection with GA-72Cd on Medium setting
- 28
This document is a research report submitted to the U.S. Department of Justice. This report has not been published by the Department. Opinions or points of view expressed are those of the author(s)
and do not necessarily reflect the official position or policies of the U.S. Department of Justice.
0102030405060708090
Dep
thof
Detection
(cm)
Buried Scrap Metals (Longest to Shortest)
Scrap Metal Detection withMagnetic Locator on Medium Setting
SLIGHT
STRONG
0102030405060708090
100
Dep
thof
Detection
(cm)
Buried MiscellaneousWeapons (Longest to Shortest)
Miscellaneous Weapon Detection withMagnetic Locator on High Setting
SLIGHT
STRONG
Figure 4-5. Results from miscellaneous weapon detection with GA-72Cd on High setting
Figure 4-6. Results from scrap metal detection with GA-72Cd on Medium setting
- 29
This document is a research report submitted to the U.S. Department of Justice. This report has not been published by the Department. Opinions or points of view expressed are those of the author(s)
and do not necessarily reflect the official position or policies of the U.S. Department of Justice.

0102030405060708090
Dep
thof
Detection
(cm)
Buried Scrap Metals (Longest to Shortest)
Scrap Metal Detection withMagnetic Locator on High Setting
SLIGHTSTRONG
Figure 4-7. Results from miscellaneous weapon detection with GA-72Cd on High setting
- 30
This document is a research report submitted to the U.S. Department of Justice. This report has not been published by the Department. Opinions or points of view expressed are those of the author(s)
and do not necessarily reflect the official position or policies of the U.S. Department of Justice.

CHAPTER 5: ALL-METAL DETECTOR
All-Metal Detector Theory
Metal detectors are electromagnetic devices that operate on the same principle as
electromagnetic surveying equipment. The antenna head, or search coil, contains a transmitter
and a receiver. An electromagnetic field is transmitted into the ground in the immediate vicinity
of the search coil and penetrates the material surrounding the coil including soil, sand, rock,
wood, brick, stone, masonry, water, concrete, vegetable, some mineral sources, and air. The
field enters conductive objects producing tiny eddy currents across the surface of these objects
that create a secondary field circulating and flowing outward into the surrounding soil. The
secondary field is then detected by the receiver in the antenna head (Connor and Scott, 1998;
Dupras et al., 2006; Garrett, 1998; Nielson, 2003; Nelson, 2004).
The metal detector used for this research project is a Fisher M-97, an affordable, rugged,
and simple to use all-metal detector which utilizes a waterproof 11 inch (27.9cm) Double-D
search coil to identify metallic objects with both visual and audio responses (Figure 5-1).
According to the manufacturer, the Fisher M-97 is designed to search for buried or paved-over
valves, boxes, manhole covers, or any other concealed metallic object, and can be used over
concrete and asphalt. Detected metals include iron, aluminum, brass, and lead. The M-97
features high sensitivity, ground effect rejection of wet ground foliage, pavement, or mineralized
ground, and auto-tune for stabilizing ground interference. The M-97 consists of 10 ground
balancing levels, a Normal sensitivity setting, and a High sensitivity setting, allowing the user to
customize the detector to the soil conditions (Fisher Research Laboratory, n.d.). The ground
balancing levels of the M-97 are used to compensate for the search area’s mineral content. The
- 31
This document is a research report submitted to the U.S. Department of Justice. This report has not been published by the Department. Opinions or points of view expressed are those of the author(s)
and do not necessarily reflect the official position or policies of the U.S. Department of Justice.

manufacturer’s recommendations include first selecting ground balancing level 5, and the
Normal sensitivity setting (Fisher Research Laboratory, n.d.). Generally, these settings do not
require much ground balancing adjustment, and provide a “turn on and go” mode. Tuning the
machine higher or lower depends upon ground conditions; the machine is tuned when there is no
change in the audible hum when the detector is lifted 12-18 inches off of the ground. High
setting is recommended for increasing the mineral sensitivity and depth of detection (Fisher
Research Laboratory, n.d.). Retuning the machine once High is chosen allows the detector to
correctly rebalance itself to the ground conditions.
Data Collection Parameters
The M-97 all-metal detector was initially used in the manufacturer’s recommended “turn
on and go” (Normal sensitivity, level 5) setting as the research area did not require much
balancing. Swinging the detector side-to-side and low and even to the ground, the sound of the
detector’s hum increased and the readings on the display meter changed when a metallic object
was encountered. Detection was categorized into no, slight, and strong and was performed on
Normal and High settings on all targets. It is important to note that slight detection readings
meant that a slight change in the detector’s hum was audible. However, the slight audible
response may not be discernable during real-world searches involving areas that are littered with
trash metals and/or have a high mineral content because there may be extensive background
noise.
- 32
This document is a research report submitted to the U.S. Department of Justice. This report has not been published by the Department. Opinions or points of view expressed are those of the author(s)
and do not necessarily reflect the official position or policies of the U.S. Department of Justice.

Figure 5-1. Fisher M-97 basic all-metal detector with 11 inch (27.9cm) coil
Results
Firearms
All 16 firearms produced strong audible responses using the all-metal detector on Normal
setting, although at varying depths (Figure 5-2). The deepest detected firearm was Remington
shotgun 870 (G1) down to a depth of 30-35cm with a strong response. Next, the Norinco AK
rifle (C5), the Mossberg 500A shotgun (D5), and the Colt Commander (B5) produced strong
responses down to 25-30cm. Three of the largest handguns, the Smith & Wesson 686 (B3), the
Ruger P89 (G2), and the Smith & Wesson 5906 (A4) produced strong responses to 20-25cm.
Seven medium-to-small handguns (the Glock Model 19 (A5), the Hi-Point Model C (A3), the
Lorcin L380 (B4), the Jennings Bryco 59 (B2), the Smith & Wesson Model 37 (C1), the RG
Industries RG23 (C2), and the Raven Arms MP25 (A2)) produced strong responses to 15-20cm.
- 33
This document is a research report submitted to the U.S. Department of Justice. This report has not been published by the Department. Opinions or points of view expressed are those of the author(s)
and do not necessarily reflect the official position or policies of the U.S. Department of Justice.

Finally, two of the three smallest handguns, the North American Arms Mini-Revolver (B1) and
the Davis Derringer (A1), produced strong responses to a depth of only 10-15cm.
When data collection on the buried firearms with the all-metal detector was collected
using High setting, all 16 firearms produced strong audible responses to deeper depths (Figure 5
3). The deepest detected was the Remington 870 (G1) to 50-55cm, followed by the Norinco AK
rifle (C5) to 45-50cm, and the Mossberg 500A (D5) to a maximum depth of 40-45cm. Six large-
to-medium handguns (the Smith & Wesson 686 (B3), the Ruger P89 (G2), the Colt Commander
(B5), the Smith & Wesson 5906 (A4), the Hi-Point Model C (A3), and the Jennings Bryco 59
(B2)) were detected to a depth of 35-40cm. Four medium-to-small handguns (Lorcin L380 (B4),
the Smith & Wesson Model 37 (C1), the RG Industries RG23 (C2), and the Glock Model 19
(A5)) were detected to 30-35cm, while three firearms (the North American Arms Mini-Revolver
(B1), the Raven Arms MP25 (A2), and the Davis Derringer (A1)) were detected at the shallowest
depth of 25-30cm.
Miscellaneous Weapons
When using Normal setting with the all-metal detector, all 10 miscellaneous weapons
produced a strong audible response (Figure 5-4). The claw hammer (F4) was detected at the
deepest depth down to 25-30cm, while four weapons (the sword (F5), the machete (E5), the
mallet (E4), and the baton (F1)) representing large, medium, and small targets were produced
audible response down to 20-25cm. The prybar (E3) was detected to 15-20cm, while the Buck
knife (E2), the scissors (E1), and the brass knuckles (F3) down a depth of 10-15cm. Finally, the
Philip’s head screwdriver (F2) was the shallowest detected at 5-10cm.
- 34
This document is a research report submitted to the U.S. Department of Justice. This report has not been published by the Department. Opinions or points of view expressed are those of the author(s)
and do not necessarily reflect the official position or policies of the U.S. Department of Justice.

A strong audible response was produced for all 10 buried miscellaneous weapons with
the all-metal detector on High setting, although at varying depths (Figure 5-5). The claw
hammer (F4) produced a strong response down to a maximum depth of 40-45cm. Three
miscellaneous weapons, representing large targets, produced strong responses to 35-40cm: the
sword (F5), the machete (E5), and the mallet (E4). The prybar (E3) and the baton (F1) produced
a strong response to 30-35cm, while the Buck knife (E2), the scissors (E1), and the brass
knuckles (F3) all produced strong responses to 25-30cm. Finally, the Philip’s head screwdriver
(F2) produced a strong audible response down to a maximum depth of 15-20cm.
Scrap Metals
Data collection on the buried scrap metals with the all-metal detector on Normal setting
indicated that all six scrap metals produced strong responses, although at varying depths (Figure
5-6). Two scrap metal targets produced strong responses down to 25-30cm: the rusty iron pipe
(D2), and the solid iron pipe (C4). The rebar (D4) and the aluminum edging (C3) produced
strong audible responses to 15-20cm. Finally, two scrap metal targets, the hollow copper tube
(D1) and solid aluminum pipe (C4), produced strong responses to a depth of 10-15cm.
When all-metal detector was used on High setting, all six scrap metals produced strong
audible responses at deeper depths (Figure 5-6). The rusty iron pipe (D2) and the solid iron pipe
(C4) were detected to 40-45cm, while the rebar (D4) and the aluminum edging (C3) were
detected to a depth of 30-35cm. Finally, the hollow copper tube (D1) produced a strong
response to 25-30cm, while the solid aluminum pipe (C4) produced a strong audible response
down to a maximum depth of 20-25cm.
- 35
This document is a research report submitted to the U.S. Department of Justice. This report has not been published by the Department. Opinions or points of view expressed are those of the author(s)
and do not necessarily reflect the official position or policies of the U.S. Department of Justice.

0102030405060708090
Dep
thof
Detection
(cm)
Buried Firearms (Longest to Shortest)
Firearm Detection withAll‐metal Detector on Normal Setting
SLIGHT
STRONG
Control Holes
It is important to note that a number of control holes (one inside the grid (G3) two outside
the grid) were tested during data collection. The disturbed soil of the control holes did not
produce any audible responses for the various depths when tested with the all-metal detector.
Figure 5-2. Results from firearm detection with M-97 on Normal setting
- 36
This document is a research report submitted to the U.S. Department of Justice. This report has not been published by the Department. Opinions or points of view expressed are those of the author(s)
and do not necessarily reflect the official position or policies of the U.S. Department of Justice.
0102030405060708090
Dep
thof
Detection
(cm)
Buried MiscellaneousWeapons (Longest to Shortest)
Miscellaneous Weapon Detection withAll‐metal Detector on Normal Setting
SLIGHTSTRONG
0102030405060708090
Dep
thof
Detection
(cm)
Buried Firearms (Longest to Shortest)
Firearm Detection withAll‐metal Detector on High Setting
SLIGHTSTRONG
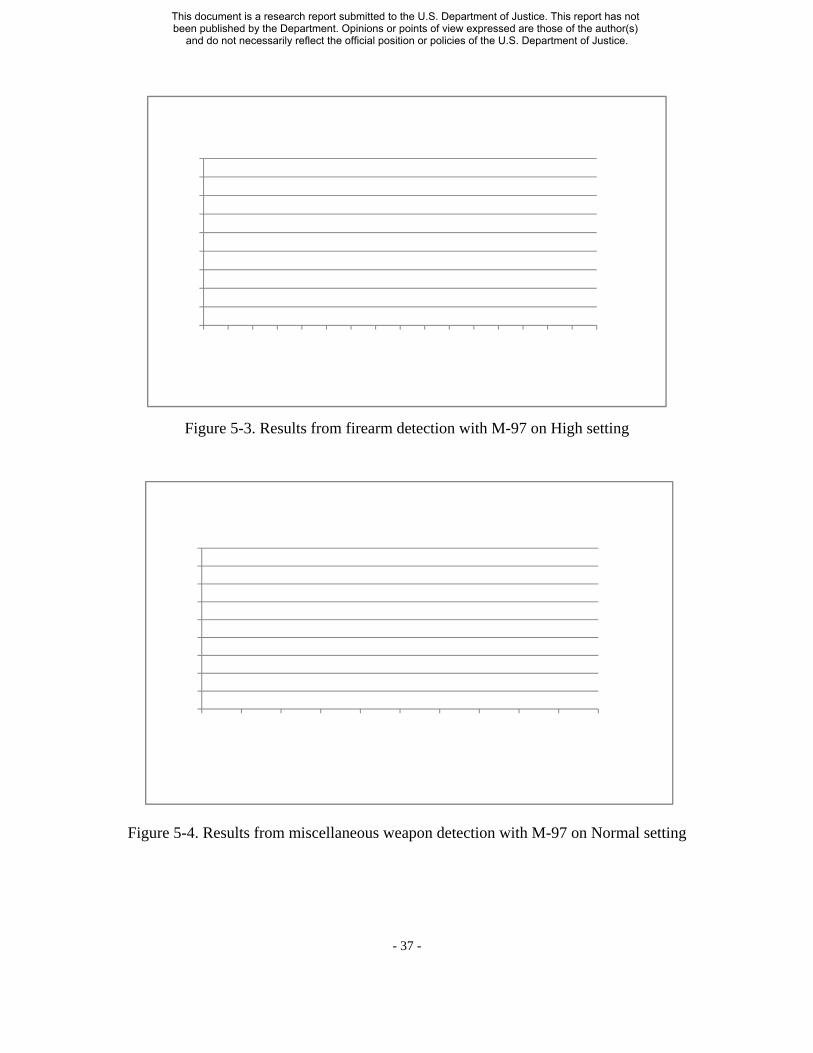
Figure 5-3. Results from firearm detection with M-97 on High setting
Figure 5-4. Results from miscellaneous weapon detection with M-97 on Normal setting
- 37
This document is a research report submitted to the U.S. Department of Justice. This report has not been published by the Department. Opinions or points of view expressed are those of the author(s)
and do not necessarily reflect the official position or policies of the U.S. Department of Justice.

0102030405060708090
Dep
thof
Detection
(cm)
Buried Scrap Metals (Longest to Shortest)
Scrap Metal Detection withAll‐metal Detector on Normal Setting
SLIGHTSTRONG
0102030405060708090
Dep
thof
Detection
(cm)
Buried MiscellaneousWeapons (Longest to Shortest)
Miscellaneous Weapon Detection withAll‐metal Detector on High Setting
SLIGHTSTRONG
Figure 5-5. Results from miscellaneous weapon detection with M-97 on High setting
Figure 5-6. Results from scrap metal detection with M-97 on Normal setting
- 38
This document is a research report submitted to the U.S. Department of Justice. This report has not been published by the Department. Opinions or points of view expressed are those of the author(s)
and do not necessarily reflect the official position or policies of the U.S. Department of Justice.

0102030405060708090
Dep
thof
Detection
(cm)
Buried Scrap Metals (Longest to Shortest)
Scrap Metal Detection withAll‐metal Detector on High Setting
SLIGHTSTRONG
Figure 5-7. Results from scrap metal detection with M-97 on High setting
- 39
This document is a research report submitted to the U.S. Department of Justice. This report has not been published by the Department. Opinions or points of view expressed are those of the author(s)
and do not necessarily reflect the official position or policies of the U.S. Department of Justice.

CHAPTER 6: ADVANCED DIGITAL METAL DETECTOR
Advanced Metal Detector Theory
The advanced metal detector that was used for this project is a second generation Minelab
Explorer II™ with a waterproof 10.5 inch (26.7cm) medium sized Double-D (DD) search coil.
A second search coil, a larger 15 inch (38.1cm) Coiltek DD manufacturer-specific after-market
coil, was utilized on the detector (Figure 6-1). The larger after-market search coil was
incorporated to determine if an increase in depth of detection over the standard coil would be
noted. Larger search coils are generally better for increased depth of penetration for detecting
larger objects. Conversely, smaller coils are better suited for detecting smaller objects at
shallower depths.
Improving upon the single and dual frequency Broad Band Spectrum (BBS) technology
of previous metal detectors, the Minelab Explorer IITM is a digital metal detector with Full Band
Spectrum (FBS) technology, which automatically transmits 28 frequencies simultaneously from
1.5 to 100 kHz. Advanced target discrimination (SMARTFIND™ 2-dimensional discrimination)
improves upon previous detectors by detecting specific objects once their unique metallic
signature is determined. In Advanced mode, a “Learn” function allows signature ranges to be
determined for targets and/or metal components and loaded into the machine for easy
discrimination upon searching (Minelab Electronics Pty Ltd, n.d.).
The advantages of the FBS technology are increased depth detection, accurate target
identification at greater depths, improved detection of desired targets among iron trash, greater
recognition of ground mineralization, enhanced searching on salt-water beaches, consistent
sensitivity over a wide range of targets, less interference from electromagnetic sources, advanced
- 40
This document is a research report submitted to the U.S. Department of Justice. This report has not been published by the Department. Opinions or points of view expressed are those of the author(s)
and do not necessarily reflect the official position or policies of the U.S. Department of Justice.

digital filtering to eliminate the influence of ground signals, and more accurate identification of
target characteristics such as size (Minelab Electronics Pty Ltd, n.d.).
The advanced detector locates metallic objects, alerting the operator with both visual and
audio responses. The Explorer II is held and maneuvered as any other metal detector, low and
even to the ground in a swaying motion. When an object is located, the pitch of the detector’s
hum increases, with highly conductive objects emitting high-pitched sounds and low-pitched
tones being emitted by less conductive, more ferrous, objects. Large targets or targets close to
the ground surface emit louder signals. The Explorer II has two detection modes: Quickstart and
Advanced.
The Explorer II was initially used in the manufacturer’s recommended “turn on and go”
(Quickstart) setting to provide information regarding basic detection of the targets. Quickstart
uses factory presets for Discrimination (non-ferrous coin-type targets) and Iron Mask (-6, non
ferrous metals). The Quickstart Digital display screen shows numerical values when a metallic
object is encountered indicating the ferrous content and conductivity with values ranging from 0
31; a value of 0 represents the lowest ferrous content or conductivity, and the highest ferrous
content or conductivity is represented by a value of 31. For example, a reading of 0-24 would be
mean a ferrous content (always first) of 0 and a conductivity value of 24.
The Explorer II was also used in advanced mode for target discrimination. The advanced
mode allows for the specification of custom targets, enabling the user to edit and save target
profiles in order to recognize those objects and reject others. Discrimination is the ability of a
metal detector to identify a desired metallic target while eliminating unwanted signals from false
metallic targets. Advanced Mode was used for customization of a number of “signatures” for a
carefully selected sample of firearms.
- 41
This document is a research report submitted to the U.S. Department of Justice. This report has not been published by the Department. Opinions or points of view expressed are those of the author(s)
and do not necessarily reflect the official position or policies of the U.S. Department of Justice.

Data Collection Parameters
Three types of data collection parameters were incorporated using the Explorer II: 1)
simple detection of the targets, 2) ferrous content and conductivity readings using the Quickstart
method, and 3) signature metallic composition patterns using the Advanced Learn feature to test
if all targets could be recognized against specific targets of known metallic compositions. First,
it was determined whether the buried forensic target was detected at specific depths using both
coils. Second, the ferrous content and conductivity values were recorded using the standard coil.
Third, the Advanced Learn feature was utilized with the standard coil pre-burial to program the
signature patterns of a selection of six targets representing the firearm sample in order to test if
each target would be detected by a specific metallic composition.
Factory presets of the Quickstart mode allowed for detection at multiple depths. Once
detection was established, the conductivity and ferrous content values were recorded to
determine if any metallic composition patterns could be established. Although, originally
planning on collecting multiple passes on each target to replicate the signatures, the operators
were advised by the manufacturer that the detector should be passed over each target only two to
three times as more than two to three passes might skew the readings by detecting individual
metallic signatures as opposed to the metallic composition of the target as a whole.
A selection of targets was programmed into the Learn feature to determine if the
discrimination feature of the advanced detector is more useful than a basic all-metal detector at
detecting the variety of objects included in this project. Based upon metallic composition, a
selection of six firearms was programmed into the Learn feature following manufacturer
instructions. Examples of stainless steel, aluminum/stainless steel, aluminum/synthetic, basic
steel, and tenifered steel compositions were included. A large stainless steel handgun was
- 42
This document is a research report submitted to the U.S. Department of Justice. This report has not been published by the Department. Opinions or points of view expressed are those of the author(s)
and do not necessarily reflect the official position or policies of the U.S. Department of Justice.

included as well as a smaller handgun to test the contribution of size in signature readings. As
data collection using the preset signatures can only be conducted using one programmed
signature at a time, the detector was set to each saved signature one at time (S1-S6, sequentially)
and therefore passed over the individual buried items a total of six times, one time with each
signature.
• S1-Smith & Wesson 686
• S2- North American Arms Mini-Magnum
• S3-Raven Arms MP-25
• S4-Ruger P89
• S5-Mossberg 500A
• S6-Glock Model 19
- 43
This document is a research report submitted to the U.S. Department of Justice. This report has not been published by the Department. Opinions or points of view expressed are those of the author(s)
and do not necessarily reflect the official position or policies of the U.S. Department of Justice.

Figure 6-1. Minelab Explorer II™ with (a) medium 10.5 inch (26.7cm) coil, and (b) 15 inch (38.1cm) Coiltek search coil
Results
Simple Detection: Firearms
Data collection on the buried firearms using the advanced metal detector with the
medium coil indicated that 14 of 16 firearms (87.5%) were detected, although to varying depths
(Figure 6-2). The Colt Commander (B5), the Smith & Wesson 5906 (A4), and the Jennings
Bryco 59 (B2) were the three firearms detected to the deepest depth at 45-50cm. Four firearms,
ranging in size from a shotgun to the smallest handgun, were detected down to 40-45cm and
- 44
This document is a research report submitted to the U.S. Department of Justice. This report has not been published by the Department. Opinions or points of view expressed are those of the author(s)
and do not necessarily reflect the official position or policies of the U.S. Department of Justice.

included the Remington 870 (G1), the Smith & Wesson 686 (B3), the RG Industries RG23 (C2),
and the Davis Derringer D9 (A1). Five firearms, ranging from the largest shotgun to the second
smallest handgun, were detected down to a maximum depth of 35-40cm that included the the
Mossberg 500A (D5), the Ruger P89 (G2), the Hi-Point Model C (A3), the Lorcin L380 (B4),
and the Raven Arms MP25 (A2). The Smith & Wesson Model 37 (C1) was detected down to
30-35cm. The Norinco AK rifle (C5) was detected the shallowest, down to a maximum depth of
only 20-25cm. Finally, the North American Arms Mini-Magnum (B1) was not detected once
buried and the Glock Model 19 (A5) was not detected at all, including pre-burial.
Data collection on the buried firearms using the advanced metal detector with the large
coil also indicated that 14 of 16 firearms (87.5%) were detected (Figure 6-3). Several firearms
were detected deeper with the large coil, while one was detected deeper with the medium coil
(Table 6-1).
Simple Detection: Miscellaneous Weapons
Eight of the 10 miscellaneous weapons (80%) were detected to varying depths (Figure 6
4) using the advanced metal detector with the medium coil. The claw hammer (F4), was
detected down to the deepest depth at 55-60cm, while the second longest weapon, the machete
(E5), was detected down to the next deepest depth at 40-45cm. The two smallest weapons, the
scissors (E1) and the brass knuckles (F3), were detected next down to 35-40cm. The longest
miscellaneous weapon, the sword (F5), and third longest weapon, the mallet (E4), were detected
down to 30-35cm. The prybar (E3) and the Buck knife (E2) were detected down to 25-30cm.
Finally, the Philip’s head screwdriver (F2) and the baton (F1) were not detected at all once
buried. When the large coil was used, eight of the 10 miscellaneous weapons (80%) were still - 45
This document is a research report submitted to the U.S. Department of Justice. This report has not been published by the Department. Opinions or points of view expressed are those of the author(s)
and do not necessarily reflect the official position or policies of the U.S. Department of Justice.

0102030405060708090
Dep
thof
Detection
(cm)
Buried Firearms (Longest to Shortest)
Firearm Detection withAdvanced Metal Detector (Medium Coil)
detected with more than half of the items were detected at the same depth as the medium coil
(Figure 6-5).
Simple Detection: Scrap Metals
Three of the six scrap metals (50%) were detected using the advanced metal detector with
the medium coil shows (Figure 6-6). The aluminum edging (C3) was detected down to 40-45cm,
followed by the solid aluminum pipe (D3) at 30-35cm, and longest piece of scrap metal, the
hollow copper tube (D1), was detected to 25-30cm. The rebar (D4), rusty iron pipe (D2), and
solid iron pipe (C4) were not detected at all, even pre-burial. When the large coil was used, only
the hollow copper tube (D1) was detected deeper at 30-35cm (Figure 6-7).
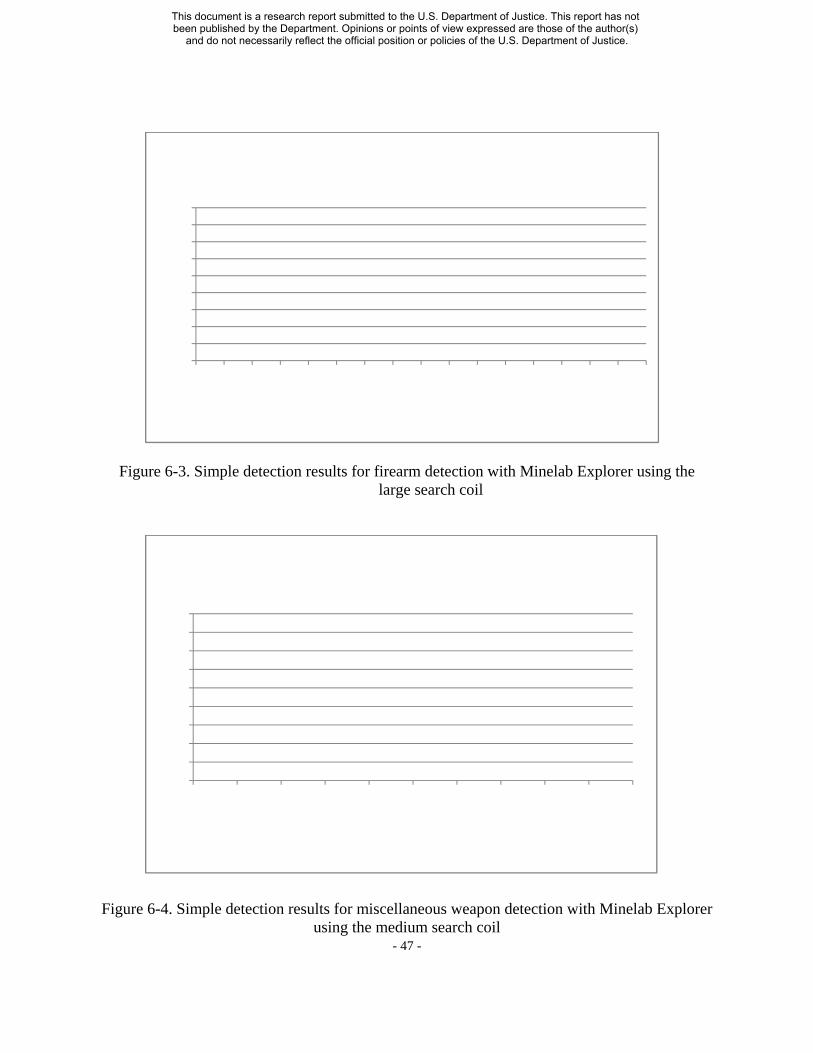
Figure 6-2. Simple detection results for firearm detection with Minelab Explorer using the medium search coil
- 46
This document is a research report submitted to the U.S. Department of Justice. This report has not been published by the Department. Opinions or points of view expressed are those of the author(s)
and do not necessarily reflect the official position or policies of the U.S. Department of Justice.
0102030405060708090
Dep
thof
Detection
(cm)
Buried Firearms (Longest to Shortest)
Firearm Detection withAdvanced Metal Detector (Large Coil)
0102030405060708090
Dep
thof
Detection
(cm)
Buried MiscellaneousWeapons (Longest to Shortest)
Miscellaneous Weapon Detection withAdvanced Metal Detector (Medium Coil)
Figure 6-3. Simple detection results for firearm detection with Minelab Explorer using the large search coil
Figure 6-4. Simple detection results for miscellaneous weapon detection with Minelab Explorer using the medium search coil
- 47
This document is a research report submitted to the U.S. Department of Justice. This report has not been published by the Department. Opinions or points of view expressed are those of the author(s)
and do not necessarily reflect the official position or policies of the U.S. Department of Justice.

0102030405060708090
Dep
thof
Detection
(cm)
Buried MiscellaneousWeapons (Longest to Shortest)
Miscellaneous Weapon Detection withAdvanced Metal Detector (Large Coil)
0102030405060708090
Dep
thof
Detection
(cm)
Buried Scrap Metals (Longest to Shortest)
Scrap Metal Detection withAdvanced Metal Detector (Medium
Coil)
Figure 6-5. Simple detection results for miscellaneous weapon detection with Minelab Explorer using the large search coil
Figure 6-6. Simple detection results for scrap metal detection with Minelab Explorer using medium search coil
- 48
This document is a research report submitted to the U.S. Department of Justice. This report has not been published by the Department. Opinions or points of view expressed are those of the author(s)
and do not necessarily reflect the official position or policies of the U.S. Department of Justice.

0102030405060708090
Dep
thof
Detection
(cm)
Buried Scrap Metals (Longest to Shortest)
Scrap Metal Detection withAdvanced Metal Detector (Large Coil)
Figure 6-7. Simple detection results for scrap metal detection with Minelab Explorer using the large search coil
Comparison of Medium and Large Search Coils
With both advanced metal detector coils, 25 out of 32 weapons were detected (78%).
Out of the 25 weapons detected, fourteen were firearms, three were scrap metals, and eight were
miscellaneous weapons. Also, of the 25 detected weapons, two were best detected by the
medium coil, seven were best detected by the large coil, and sixteen were equally detected by
both coils (Figures 6-8 to 6-10).
Within the firearm sample, only the Davis Derringer D9 (A1) was detected the deepest
with the medium coil. Five firearms were detected deeper with the large coil: the Norinco AK
Hunter (C5), the Remington 870 (G1), the Mossberg Model 500A (D5), the Ruger P89 (G2), and
the RG Industries RG23 (C2). The remaining eight detected firearms were all detected down to
- 49
This document is a research report submitted to the U.S. Department of Justice. This report has not been published by the Department. Opinions or points of view expressed are those of the author(s)
and do not necessarily reflect the official position or policies of the U.S. Department of Justice.

the same maximum depth with both coils: the Smith & Wesson Model 686 (B3), the Colt
Commander (B5), the Smith & Wesson 5906 (A4), the Hi-Point Model C (A3), the Lorcin L380
(B4), the Jennings Bryco 59 (B2), and the Smith & Wesson Model 37 (C1), and the Raven Arms
MP25 (A2). The North American Arms (B1) and the Glock Model 19 (A5) were not detected
using either coil (Figure 6-8). Overall, the larger firearms were detected the deepest with the
large search coil (Figure 6-8). Both coils had similar results with the medium-sized targets, and
the medium coil was better suited for the smallest targets.
Out of the ten miscellaneous weapons comprising the sample only the claw hammer (F4)
was best detected using the medium coil (Figure 6-9). Conversely, only two miscellaneous
weapons (the mallet (E4) and the prybar (E3)) were detected deeper using the larger coil, while
five miscellaneous weapons were detected down to the same maximum depth with both coils: the
sword (F5), the machete (E5), the Buck knife (E2), the scissors (E1), and the brass knuckles
(F3). The Philip’s head screwdriver (F2) and baton (F1) were not detected once buried with
either coil.
Out of the six scrap metals, only three weapons (the hollow copper tube (D1), the
aluminum edging (C3), and the solid aluminum pipe (D3)) were detected with both coils. One
piece of scrap metal, the hollow copper tube (D1), was best detected by the large coil, while the
other two, the aluminum edging (C3), and the solid aluminum pipe (D3) were detected down to
the same maximum depth using both coils.
- 50
This document is a research report submitted to the U.S. Department of Justice. This report has not been published by the Department. Opinions or points of view expressed are those of the author(s)
and do not necessarily reflect the official position or policies of the U.S. Department of Justice.

0102030405060708090
Dep
thof
Detection
(cm)
Buried Firearms (Longest to Shortest)
Comparison of Coils for Firearms withAdvanced Metal Detector
MediumCoilLargeCoil
102030405060708090
Dep
thof
Detection
(cm)
Buried MiscellaneousWeapons (Longest to Shortest)
Comparison for Coils forMiscellaneous Weapon withAdvanced Metal Detector
MediumCoilLargeCoil
Figure 6-8. Comparison of maximum depth of detection of firearms using the advanced metal detector with medium and large coils.
Figure 6-9. Comparison of maximum depth of detection of miscellaneous weapons using the advanced metal detector with medium and large coils.
- 51
This document is a research report submitted to the U.S. Department of Justice. This report has not been published by the Department. Opinions or points of view expressed are those of the author(s)
and do not necessarily reflect the official position or policies of the U.S. Department of Justice.

0102030405060708090
Dep
thof
Detection
(cm)
Buried Scrap Metal (Longest to Shortest)
Comparison of Coils for Scrap Metalswith Advanced Metal Detector
MediumCoilLarge Coil
Figure 6-10. Comparison of maximum depth of detection of scrap metals using the advanced metal detector with medium and large coils.
Quickstart Ferrous Content/Conductivity Readings
As advised by the manufacturer, data were collected in three passes over each target so as
to ensure proper detection of the metallic target as a whole, rather than as the individual metallic
components that comprise the metallic items. Since both ferrous content and conductivity
readings provided values ranging from 0-31, three categories were assigned: Low (0-10),
Medium (11-20), and High (21-31). Five patterns were noticed while analyzing the data
collected on the buried firearms, scrap metal, and miscellaneous weapons using the advanced
metal detector with the Medium Coil (Tables 6-1 thru 6-3): Low/Medium, Low/High,
Medium/Low, Medium/High, and Variable.
- 52
This document is a research report submitted to the U.S. Department of Justice. This report has not been published by the Department. Opinions or points of view expressed are those of the author(s)
and do not necessarily reflect the official position or policies of the U.S. Department of Justice.

The Norinco AK rifle (C5) was the only target that produced a Low/Medium pattern.
The Low/High was the most frequent pattern, consisting of a total of sixteen targets, including
eleven firearms (the Davis Derringer (A1), the Raven Arms MP25 (A2), the Hi-Point Model C
(A3), the North American Arms Mini-Magnum (B1), the Jennings Bryco 59 (B2), the Lorcin
L380 (B4), the Colt Commander (B5), the Smith & Wesson Model 37 (C1), the RG Industries
RG23 (C2),the Mossberg 500A (D5), and the Ruger P89 (G2)), three miscellaneous weapons
(the Buck knife (E2), the brass knuckles (F3), and the claw hammer (F4)), and two scrap metals
(the aluminum edging (C3) and the hollow copper tube (D1)). The Smith & Wesson 5906 (A4)
was the only target that produced the Medium/Low pattern. Finally, two targets, the Remington
870 (G1) and the mallet (E4), produced the Medium/High pattern.
The Variable pattern was noticed in only six of the 32 tested targets, and was defined as
instances in which the pre-burial pattern was different than the pattern observed once the target
was buried (the Smith & Wesson 686 (B3), the scissors (E1), the prybar (E3), and the machete
(E5), the sword (F5), and the solid aluminum pipe (D3)).
As so many targets of differing metallic compositions fell into each pattern, especially the
Low/High pattern, it would therefore be problematic to use this technique during real-world
forensic searches in order to distinguish a suspected target as a firearm, scrap metal, or
miscellaneous weapon.
- 53
This document is a research report submitted to the U.S. Department of Justice. This report has not been published by the Department. Opinions or points of view expressed are those of the author(s)
and do not necessarily reflect the official position or policies of the U.S. Department of Justice.
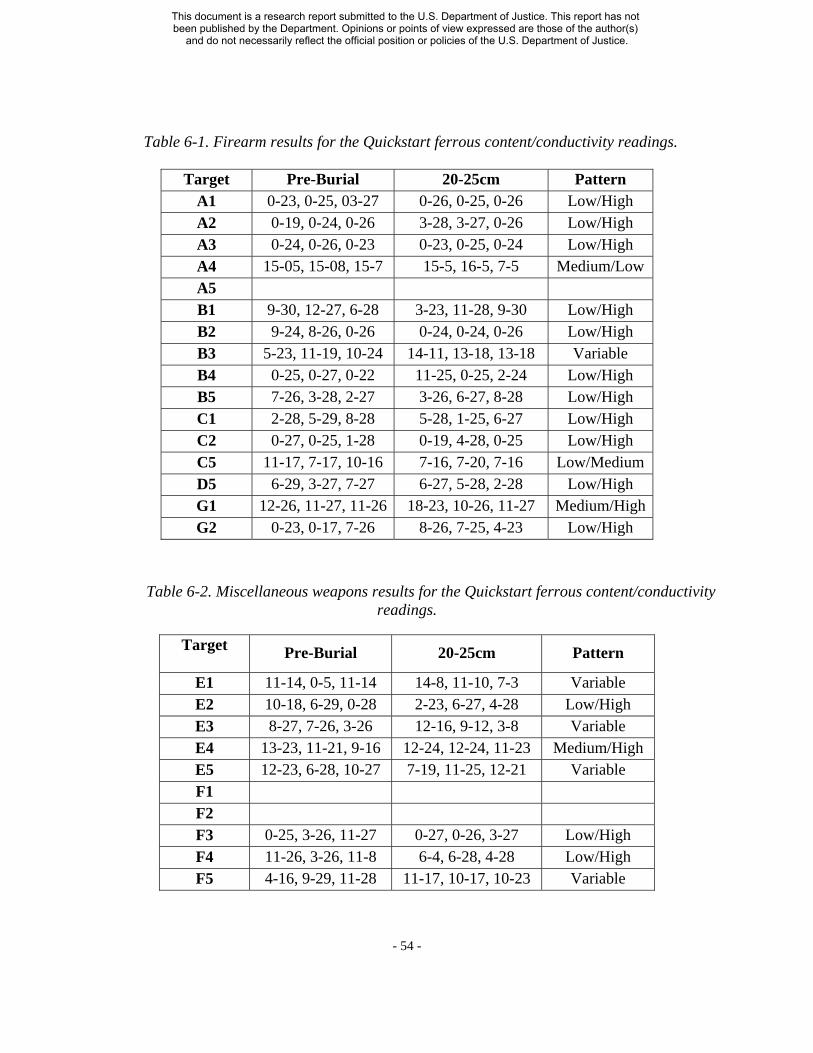
Table 6-1. Firearm results for the Quickstart ferrous content/conductivity readings.
Target Pre-Burial 20-25cm Pattern A1 0-23, 0-25, 03-27 0-26, 0-25, 0-26 Low/High A2 0-19, 0-24, 0-26 3-28, 3-27, 0-26 Low/High A3 0-24, 0-26, 0-23 0-23, 0-25, 0-24 Low/High A4 15-05, 15-08, 15-7 15-5, 16-5, 7-5 Medium/Low A5 B1 9-30, 12-27, 6-28 3-23, 11-28, 9-30 Low/High B2 9-24, 8-26, 0-26 0-24, 0-24, 0-26 Low/High B3 5-23, 11-19, 10-24 14-11, 13-18, 13-18 Variable B4 0-25, 0-27, 0-22 11-25, 0-25, 2-24 Low/High B5 7-26, 3-28, 2-27 3-26, 6-27, 8-28 Low/High C1 2-28, 5-29, 8-28 5-28, 1-25, 6-27 Low/High C2 0-27, 0-25, 1-28 0-19, 4-28, 0-25 Low/High C5 11-17, 7-17, 10-16 7-16, 7-20, 7-16 Low/Medium D5 6-29, 3-27, 7-27 6-27, 5-28, 2-28 Low/High G1 12-26, 11-27, 11-26 18-23, 10-26, 11-27 Medium/High G2 0-23, 0-17, 7-26 8-26, 7-25, 4-23 Low/High
Table 6-2. Miscellaneous weapons results for the Quickstart ferrous content/conductivity readings.
Target Pre-Burial 20-25cm Pattern
E1 11-14, 0-5, 11-14 14-8, 11-10, 7-3 Variable E2 10-18, 6-29, 0-28 2-23, 6-27, 4-28 Low/High E3 8-27, 7-26, 3-26 12-16, 9-12, 3-8 Variable E4 13-23, 11-21, 9-16 12-24, 12-24, 11-23 Medium/High E5 12-23, 6-28, 10-27 7-19, 11-25, 12-21 Variable F1 F2 F3 0-25, 3-26, 11-27 0-27, 0-26, 3-27 Low/High F4 11-26, 3-26, 11-8 6-4, 6-28, 4-28 Low/High F5 4-16, 9-29, 11-28 11-17, 10-17, 10-23 Variable
- 54
This document is a research report submitted to the U.S. Department of Justice. This report has not been published by the Department. Opinions or points of view expressed are those of the author(s)
and do not necessarily reflect the official position or policies of the U.S. Department of Justice.
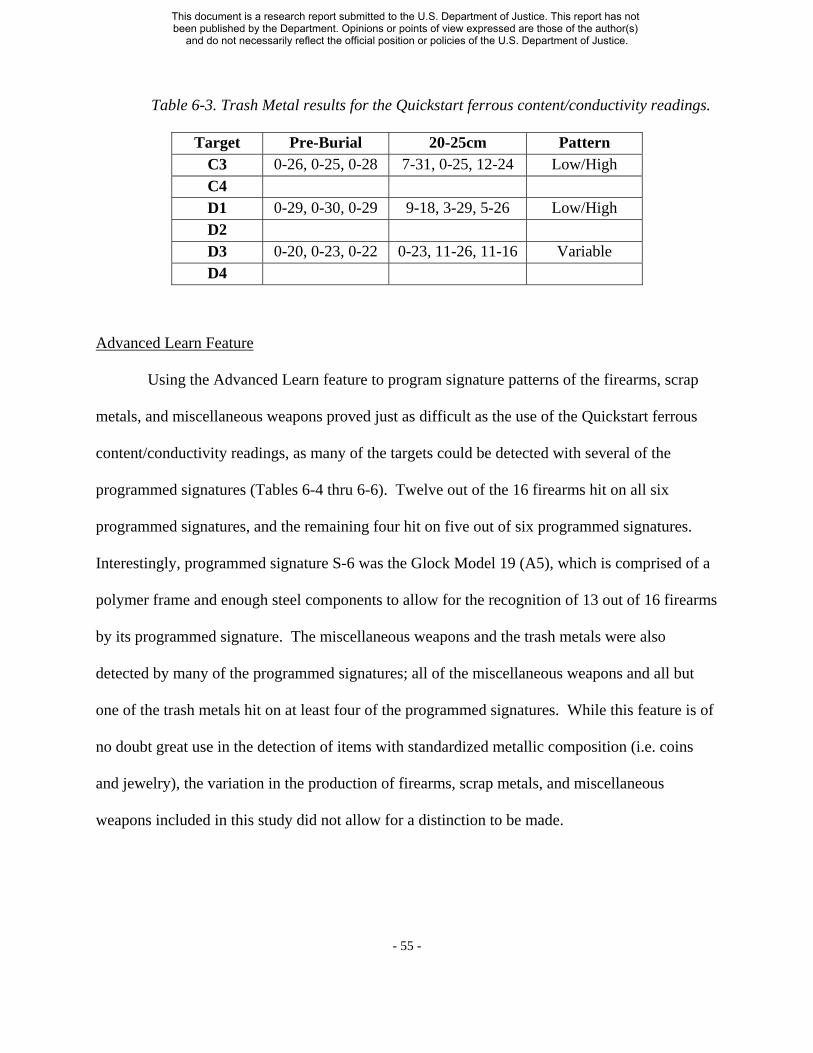
Table 6-3. Trash Metal results for the Quickstart ferrous content/conductivity readings.
Target Pre-Burial 20-25cm Pattern C3 0-26, 0-25, 0-28 7-31, 0-25, 12-24 Low/High C4 D1 0-29, 0-30, 0-29 9-18, 3-29, 5-26 Low/High D2 D3 0-20, 0-23, 0-22 0-23, 11-26, 11-16 Variable D4
Advanced Learn Feature
Using the Advanced Learn feature to program signature patterns of the firearms, scrap
metals, and miscellaneous weapons proved just as difficult as the use of the Quickstart ferrous
content/conductivity readings, as many of the targets could be detected with several of the
programmed signatures (Tables 6-4 thru 6-6). Twelve out of the 16 firearms hit on all six
programmed signatures, and the remaining four hit on five out of six programmed signatures.
Interestingly, programmed signature S-6 was the Glock Model 19 (A5), which is comprised of a
polymer frame and enough steel components to allow for the recognition of 13 out of 16 firearms
by its programmed signature. The miscellaneous weapons and the trash metals were also
detected by many of the programmed signatures; all of the miscellaneous weapons and all but
one of the trash metals hit on at least four of the programmed signatures. While this feature is of
no doubt great use in the detection of items with standardized metallic composition (i.e. coins
and jewelry), the variation in the production of firearms, scrap metals, and miscellaneous
weapons included in this study did not allow for a distinction to be made.
- 55
This document is a research report submitted to the U.S. Department of Justice. This report has not been published by the Department. Opinions or points of view expressed are those of the author(s)
and do not necessarily reflect the official position or policies of the U.S. Department of Justice.

Table 6-4. Firearm results for the Learn feature indicating which forensic targets were detected, marked by the ‘x’ when the advanced detector was set to a saved signature (S1 to S6).
Target S1 S2 S3 S4 S5 S6 A1 x x x x x x A2 x x x x x A3 x x x x x x A4 x x x x x x A5 x x x x x B1 x x x x x x B2 x x x x x x B3 x x x x x x B4 x x x x x B5 x x x x x x C1 x x x x x x C2 x x x x x x C5 x x x x x D5 x x x x x x G1 x x x x x x G2 x x x x x x
Table 6-5. Miscellaneous weapon results for the Learn feature indicating which forensic targets were detected, marked by the ‘x’, when the advanced detector was set to a saved signature (S1 to
S6).
Target S1 S2 S3 S4 S5 S6 E1 x x x x x x E2 x x x x x x E3 x x x x x E4 x x x x E5 x x x x x x F1 x x x x x x F2 x x x x x F3 x x x x F4 x x x x x x F5 x x x x x
- 56
This document is a research report submitted to the U.S. Department of Justice. This report has not been published by the Department. Opinions or points of view expressed are those of the author(s)
and do not necessarily reflect the official position or policies of the U.S. Department of Justice.

Table 6-6. Trash metal results for the Learn feature indicating which forensic targets were detected, marked by the ‘x’, when the advanced detector was set to a saved signature (S1 to S6).
Target S1 S2 S3 S4 S5 S6 C3 x x x x C4 x x x x x D1 x D2 x x x x x D3 x x x x D4 x x x x x
Control Holes
It is important to note that a number of control holes (one inside the grid (G3) and two
outside the grid) were tested during data collection. The disturbed soil of the control holes did
not produce any responses for the various depths when tested with the advanced metal detector.
- 57
This document is a research report submitted to the U.S. Department of Justice. This report has not been published by the Department. Opinions or points of view expressed are those of the author(s)
and do not necessarily reflect the official position or policies of the U.S. Department of Justice.
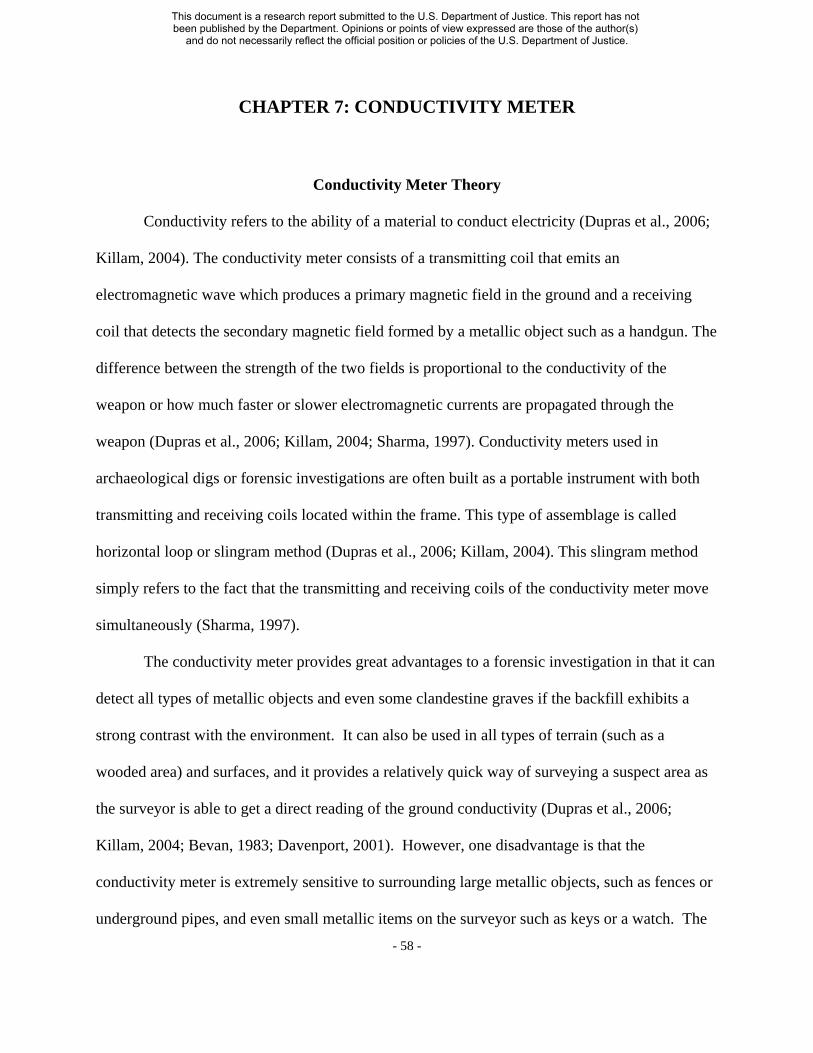
CHAPTER 7: CONDUCTIVITY METER
Conductivity Meter Theory
Conductivity refers to the ability of a material to conduct electricity (Dupras et al., 2006;
Killam, 2004). The conductivity meter consists of a transmitting coil that emits an
electromagnetic wave which produces a primary magnetic field in the ground and a receiving
coil that detects the secondary magnetic field formed by a metallic object such as a handgun. The
difference between the strength of the two fields is proportional to the conductivity of the
weapon or how much faster or slower electromagnetic currents are propagated through the
weapon (Dupras et al., 2006; Killam, 2004; Sharma, 1997). Conductivity meters used in
archaeological digs or forensic investigations are often built as a portable instrument with both
transmitting and receiving coils located within the frame. This type of assemblage is called
horizontal loop or slingram method (Dupras et al., 2006; Killam, 2004). This slingram method
simply refers to the fact that the transmitting and receiving coils of the conductivity meter move
simultaneously (Sharma, 1997).
The conductivity meter provides great advantages to a forensic investigation in that it can
detect all types of metallic objects and even some clandestine graves if the backfill exhibits a
strong contrast with the environment. It can also be used in all types of terrain (such as a
wooded area) and surfaces, and it provides a relatively quick way of surveying a suspect area as
the surveyor is able to get a direct reading of the ground conductivity (Dupras et al., 2006;
Killam, 2004; Bevan, 1983; Davenport, 2001). However, one disadvantage is that the
conductivity meter is extremely sensitive to surrounding large metallic objects, such as fences or
underground pipes, and even small metallic items on the surveyor such as keys or a watch. The
- 58
This document is a research report submitted to the U.S. Department of Justice. This report has not been published by the Department. Opinions or points of view expressed are those of the author(s)
and do not necessarily reflect the official position or policies of the U.S. Department of Justice.

conductivity meter is also a very expensive piece of equipment that might not be readily
available to law enforcement agencies. Finally, the conductivity meter is a complex geophysical
tool that requires training before it can be properly operated, unlike more common geophysical
technologies such as magnetic locators and metal detectors (Dupras et al., 2006; Killam, 2004).
The conductivity meter used for this research project is a Geonics Limited EM-38RT
(Figure 7-1) that measures 1.06m long with a 1m intercoil spacing. Conductivity is measured in
one of two ways with this instrument: through an automatic mode that takes readings every
second or through a manual mode in which readings are taken by pressing a button at specific
locations. Conductivity measurements can also be taken in one of two dipoles or orientations.
The vertical dipole (when the instrument is held vertically) is best for detecting differences in
conductivity at greater depths while the horizontal dipole (when the instrument is held
horizontally) is better suited for conductivity differences near the surface (Reynolds, 2002). The
conductivity meter measures ground conductivity using millisiemens per meter (mS/m). There is
a direct relationship between conductivity and mS/m; a better conductor will result in a greater
value in mS/m (Killam, 2004). However, if the conductivity meter is in close proximity of a
very conductive object, the readings can reach negative values. These negative values are caused
by the geometry between the metallic objects and the transmitting and receiving coils (Ward,
1990).
Data Collection Parameters and Processing
Prior to each data collection event, the conductivity meter was calibrated to the soil of the
research area in order to accurately detect the anomalies within the grid. Data collection was
performed using the conductivity meter on its vertical dipole as it is indicated by the
- 59
This document is a research report submitted to the U.S. Department of Justice. This report has not been published by the Department. Opinions or points of view expressed are those of the author(s)
and do not necessarily reflect the official position or policies of the U.S. Department of Justice.

manufacturer’s instructions that the vertical dipole is recommended for depths over 40 cm
(Geonics Limited, 2006; Clay, 2005). Data were collected over the research area using a 15m
(west to east) by 19m (south to north) grid along transects parallel to the 19m axis of the grid
(Figure 7-2). All of the data collection was performed by starting at the southern end and
traveling north along each of the grid transects (Figure 7-2). Transects were spaced every 25cm
and data were recorded along grid transects every 25cm using the manual data collection mode
to insure their precision at specific locations along grid transects. While the manufacturer
recommends that transects be separated by half the length of the instrument (50cm in the case of
the meter-long EM-38 conductivity meter) transects were separated by only 25cm to ensure
detection of the smaller targets (Geonics Limited, 2006; Killiam, 2004; Clay, 2005).
Transects for one depth were all collected during the same day to avoid moisture
variations in the soil that could have affected the conductivity readings. A full survey of the grid
using 25cm transects typically lasted around three hours, including time for preparation of the
grid and calibration of the instrument. Measurements were recorded with an Allegro CX Field
Computer connected to the conductivity meter (Figure 7-1) using the data acquisition program
EM38pro from Geonics Limited. Data files were then transferred from the field computer to a
desktop computer for processing using the Geonics Limited software DAT38W. All of the data
from each transect was then combined to create an X, Y, and Z file that was converted into a
number of different maps. The conductivity measurements represent the Z values that were
plotted on the map. The mapping software used for this project was Surfer, Version 8 from
Golden Software.
The conductivity data were plotted using contour maps that represent a plan view of the
grid data and the software interpolates the spaces between the grid transects. The contour map is
- 60
This document is a research report submitted to the U.S. Department of Justice. This report has not been published by the Department. Opinions or points of view expressed are those of the author(s)
and do not necessarily reflect the official position or policies of the U.S. Department of Justice.

a 2-D map using X and Y coordinates, and the contour lines represent points of equal Z value, Z
being the conductivity measurement of the targets in question. The contour map also shows the
relative slope of the surface through the proximity of the contour lines. Therefore, two close
lines will represent a greater slope than two distant lines and indicate a more conductive object.
Contour maps are relatively simple given their two-dimensional aspect, but color schemes are
used to accurately display the relationship between the different areas on the map. The default
program intervals for the spacing between each contour were used with each contour line
representing a difference of 0.5 mS/m. The only drawback of the contour map is that it is a
composite picture of the ground conductivity and therefore does not provide precise depth
information as ground-penetrating radar.
Two contour maps were created for each depth: one consisting of transects every 25cm
(Figure 7-2) a second consisting of transects every 50cm (Figure 7-3). Contour maps showing
the conductivity readings when using 50cm transects were created from the readings obtained in
the 25cm transects survey by only plotting every other transect. Overlay maps were also created
for each depth to determine which anomalies were produced by weapons and which ones were
produced naturally by the soil. In addition, a weapon was classified as being detected if an
anomaly was present at the location of the burial marker and the strength of the anomaly
contained at least two continuous circular or semi-circular contour lines. The anomalies
produced by the detected weapon were classified as either a strong or slight anomaly based on
the number of circular or semi-circular contour lines present. The presence of four or more
continuous contour lines indicated a strong anomaly and was considered a definite hit, while two
or three contour lines were considered a slight or weak anomaly and a probable hit. The
difference between definite and probable hits has direct consequences on forensic searches.
- 61
This document is a research report submitted to the U.S. Department of Justice. This report has not been published by the Department. Opinions or points of view expressed are those of the author(s)
and do not necessarily reflect the official position or policies of the U.S. Department of Justice.

Areas where definite hits are detected will be the first areas to be investigated during a search
followed by the probable hits if the strong anomalies did not reveal any weapon. Data analysis
included determining whether each firearm, miscellaneous metal, and blunt and sharp force
weapon was detected at each depth when using transect interval spacing of 25cm and 50cm
transects .
Figure 7-1. Data collection using the Geonics Limited EM-38RT conductivity meter in the vertical dipole along a grid line at the research site.
- 62
This document is a research report submitted to the U.S. Department of Justice. This report has not been published by the Department. Opinions or points of view expressed are those of the author(s)
and do not necessarily reflect the official position or policies of the U.S. Department of Justice.

Figure 7-2. Data collected and mapped along grid transects every 25cm
- 63
This document is a research report submitted to the U.S. Department of Justice. This report has not been published by the Department. Opinions or points of view expressed are those of the author(s)
and do not necessarily reflect the official position or policies of the U.S. Department of Justice.

Figure 7-3. Data mapped along grid transects every 50cm
- 64
This document is a research report submitted to the U.S. Department of Justice. This report has not been published by the Department. Opinions or points of view expressed are those of the author(s)
and do not necessarily reflect the official position or policies of the U.S. Department of Justice.

Results
The data collection started at a depth of 45-50cm with the conductivity meter
because data collection had already been ongoing with a number of the other geophysical tools
by the time the conductivity meter was included. The delay of the conductivity meter was due to
purchasing the equipment through the grant and then training with the equipment before it was
included with the data collection. The metallic weapons were reburied 5cm deeper following
each data set and once all objects were undetected, the weapons were reburied at the shallow
depths that had already been done prior to the purchase of the conductivity meter. The
conductivity data for each data collection depth is presented as a Surfer topographic conductivity
map with either 25cm or 50 cm transects, and then a second map of each is provided with an
overlay of the location of the weapons (Figures 7-4 to 7-7; see appendix A for the additional
conductivity maps).
Firearms
Data analysis of the conductivity readings using 25cm transects showed that all 16
firearms were detected with strong anomalies to a depth of at least 25-30cm (Figure 7-8). The
deepest detected weapon was the Smith & Wesson 5906 (A4) down to 65-70cm, followed by the
Remington 870 (G1), the Norinko AK (C5), and the Smith & Wesson Model 686 (B3) at 60
65cm. The Ruger P89 (G2) and the Mossberg Model 500A (D5) were both detected down to 55
60cm, while the Glock Model 19 (A5) was detected down to 50-55cm. The Colt Commander
(B5) was detected down to 45-50cm. Thus, half of the firearms were still strongly detected at a
depth of a half-meter by the conductivity meter (Figure 7-8). Interestingly, the eight firearms
- 65
This document is a research report submitted to the U.S. Department of Justice. This report has not been published by the Department. Opinions or points of view expressed are those of the author(s)
and do not necessarily reflect the official position or policies of the U.S. Department of Justice.

that were detected were also the eight largest, which confirms the effect of size on the depth of
detection by the conductivity meter. The Smith & Wesson Model 37 (C1) was detected down to
40-45cm, followed by the Hi-Point Model C (A3), the North American Arms Mini-Magnum
(B1), and the Jennings Bryco 59 (B2) down to 35-40cm. The Raven Arms MP-25 (A2) and the
RG Industries RG23 (C2) were detected down to 30-35cm and finally, the Davis Derringer (A1)
and the Lorcin L380 (B4) were detected down to 25-30cm.
When comparing the 50cm transect data to the 25cm transect data, there are a number of
differences in maximum depth of detection for strong anomalies produced by firearms (Figure 7
9). Five firearms were detected 5cm shallower when analyzed with 50cm transect contour maps
compared to 25cm transect maps: the Colt Commander (B5), the Lorcin L380 (B4), the Jennings
Bryco 59 (B2), the North American Arms Mini-Magnum (B1), and the Davis Derringer (A5).
Two firearms were detected 10cm shallower when analyzed with 50cm transect contour maps
compared to 25cm transect maps: the Smith & Wesson 686 (B3) and the Smith & Wesson 5906
(A4). Finally, two firearms, the Ruger P89 (G2) and the Glock Model 19 (A5) were detected
15cm shallower when analyzed with 50cm transect contour maps compared to 25cm transect
maps.
Miscellaneous Weapons
Data analysis of the conductivity readings using 25cm transects showed that all 10
miscellaneous weapons were detected with strong anomalies down to depth of at least 15-20cm
(Figure 7-10). The machete (E5) was the deepest weapon detected, down to 55-60cm. The
prybar (E3), the mallet (E4) and the claw hammer (F4) were all detected down to 45-50cm, while
the sword (F5) and the baton (F1) were detected down to 40-45cm. The Buck knife (E2) and the
- 66
This document is a research report submitted to the U.S. Department of Justice. This report has not been published by the Department. Opinions or points of view expressed are those of the author(s)
and do not necessarily reflect the official position or policies of the U.S. Department of Justice.

scissors (E1) were detected down to 30-35cm and 35-40cm, respectively. Finally, the Phillip’s
head screwdriver (F2) was detected down to 20-25cm followed by the brass knuckles (F3) down
to 15-20cm.
When comparing the 50cm transect data to the 25cm transect data, there are a few
differences in maximum depth of detection for strong anomalies produced by miscellaneous
weapons (Figure 7-11). The mallet (E4) was detected 5cm deeper when analyzed with 50cm
transect contour maps compared to 25cm transect maps. The prybar (E3) was detected 5cm
shallower when analyzed with 50cm transect contour maps compared to 25cm transect maps.
Finally, the brass knuckles (F3) were not detected using the 50cm transects data.
Scrap Metals
Data analysis of the conductivity readings using 25cm transects showed that all six scrap
metals were detected with strong anomalies down to a depth of at least 25-30cm (Figure 7-12).
The rusty iron pipe (D2) and the solid iron pipe (C4) were both detected the deepest down to a
depth of 45-50cm. The rebar (D4) was detected down to 40-45cm, while the hollow copper pipe
(D1), the aluminum edging (C3), and the solid aluminum pipe (D3) were all detected the
shallowest a depth of 25-30cm.
Data collection with the conductivity meter using 50cm transects indicated identical
depth detection results for the six scrap metals compared to those obtained using 25cm transects.
- 67
This document is a research report submitted to the U.S. Department of Justice. This report has not been published by the Department. Opinions or points of view expressed are those of the author(s)
and do not necessarily reflect the official position or policies of the U.S. Department of Justice.

Control Hole
It is important to note that a control hole located within the survey grid was tested during
data collection. The one control hole within the grid (G3) never produced any anomalies when
using the conductivity meter (Figures 7-4 to 7-7 and Figures A1 to A60).
- 68
This document is a research report submitted to the U.S. Department of Justice. This report has not been published by the Department. Opinions or points of view expressed are those of the author(s)
and do not necessarily reflect the official position or policies of the U.S. Department of Justice.

Figure 7-4. Conductivity map for weapons buried between 50-55cm and mapped using 25cm transects
- 69
This document is a research report submitted to the U.S. Department of Justice. This report has not been published by the Department. Opinions or points of view expressed are those of the author(s)
and do not necessarily reflect the official position or policies of the U.S. Department of Justice.

Figure 7-5. Conductivity map for weapons buried between 50-55cm and mapped using 50cm transects
- 70
This document is a research report submitted to the U.S. Department of Justice. This report has not been published by the Department. Opinions or points of view expressed are those of the author(s)
and do not necessarily reflect the official position or policies of the U.S. Department of Justice.

Figure 7-6. Research grid overlay with conductivity map for weapons buried between 50-55cm and mapped using 25cm transects
- 71
This document is a research report submitted to the U.S. Department of Justice. This report has not been published by the Department. Opinions or points of view expressed are those of the author(s)
and do not necessarily reflect the official position or policies of the U.S. Department of Justice.
Figure 7-7. Research grid overlay with conductivity map for weapons buried between 50-55cm and mapped using 50cm transects
- 72
This document is a research report submitted to the U.S. Department of Justice. This report has not been published by the Department. Opinions or points of view expressed are those of the author(s)
and do not necessarily reflect the official position or policies of the U.S. Department of Justice.

0
10
20
30
40
50
60
70
80
90Dep
thof
Detection
(cm)
Buried Firearms (Longest to Shortest)
Firearm Detection with 25cm Transects
SlightStrong
0
10
20
30
40
50
60
70
80
90
Dep
thof
Detection
(cm)
Buried Firearms (Longest to Shortest)
Firearm Detection with 50cm Transects
Slight
Strong
Figure 7-8. Summary of results for firearm detection with 25cm transects.
Figure 7-9. Summary of results for firearm detection with 50cm transects.
- 73
This document is a research report submitted to the U.S. Department of Justice. This report has not been published by the Department. Opinions or points of view expressed are those of the author(s)
and do not necessarily reflect the official position or policies of the U.S. Department of Justice.
0
10
20
30
40
50
60
70
80
Dep
thof
Detection
(cm)
Buried MiscellaneousWeapons (Longest to Shortest)
Miscellaneous Weapon Detection with 25cmTransects
SlightStrong
Figure 7-10. Summary of results for miscellaneous weapon detection with 25cm transects.
- 74
This document is a research report submitted to the U.S. Department of Justice. This report has not been published by the Department. Opinions or points of view expressed are those of the author(s)
and do not necessarily reflect the official position or policies of the U.S. Department of Justice.
0
10
20
30
40
50
60
70
80Dep
thof
Detection
(cm)
Buried MiscellaneousWeapons (Longest to Shortest)
Miscellaneous Weapon Detection with 50cmTransects
SlightStrong
0
10
20
30
40
50
60
70
80
HollowCopper
Rebar Rusty Iron AlumninumEdging
Solid Iron SolidAlumninum
Dep
thof
Detection
(cm)
Buried Scrap Metals (Longest to Shortest)
Scrap Metal Detection with 25cm Transects
SlightStrong
Figure 7-11. Summary of results for miscellaneous weapon detection with 50cm transects.
Figure 7-12. Summary of results for scrap metal detection with 25cm transects.
- 75
This document is a research report submitted to the U.S. Department of Justice. This report has not been published by the Department. Opinions or points of view expressed are those of the author(s)
and do not necessarily reflect the official position or policies of the U.S. Department of Justice.
0
10
20
30
40
50
60
70
80
HollowCopper
Rebar Rusty Iron AlumninumEdging
Solid Iron SolidAlumninum
Dep
thof
Detection
(cm)
Buried Scrap Metals (Longest to Shortest)
Scrap Metal Detection with 50cm Transects
SlightStrong
Figure 7-13. Summary of results for scrap metal detection with 50cm transects.
- 76
This document is a research report submitted to the U.S. Department of Justice. This report has not been published by the Department. Opinions or points of view expressed are those of the author(s)
and do not necessarily reflect the official position or policies of the U.S. Department of Justice.

CHAPTER 8: GPR
GPR Theory
Ground-penetrating radar is an electromagnetic tool that emits continuous
electromagnetic pulses of short duration which propagate from the transmitting unit in the
antenna downward into the ground. With the placement of the antenna on the ground, the signal
penetrates into the subsurface, and will be reflected, refracted, and scattered as it encounters
materials of contrasting electrical properties that include differing soil features, voids, moisture,
and metallic differences. The receiving portion of the antenna records the returning signal and
sends it back to the control unit along a different line located within the cable. The control unit
formats the reflected signal for immediate display on a video monitor. The data can also be
downloaded to an external computer for processing and analysis. One of the great advantages of
the GPR is that it provides great resolution because the data is displayed on the monitor for
immediate assessment in the field. However, there are a number of drawbacks to using GPR.
The equipment is very expensive compared to metal detectors, specialized training is required to
operate the equipment, the data may require processing, and the data requires interpretation from
an experienced technician. Furthermore, GPR works best with optimal soil and site conditions
such as dry, sandy soils and clear and flat site conditions.
The GPR system that was used for this project is a MALA RAMAC X3M with 800- and
500-MHz antennae that were integrated into a cart and pushed over the survey area. The unit
consisted of a control unit mounted to the top of the antenna, a monitor with a hard drive for data
storage, and a survey wheel which is integrated into the cart. Depth of investigation and vertical
resolution are two important considerations when choosing the appropriate antenna. A decrease - 77
This document is a research report submitted to the U.S. Department of Justice. This report has not been published by the Department. Opinions or points of view expressed are those of the author(s)
and do not necessarily reflect the official position or policies of the U.S. Department of Justice.
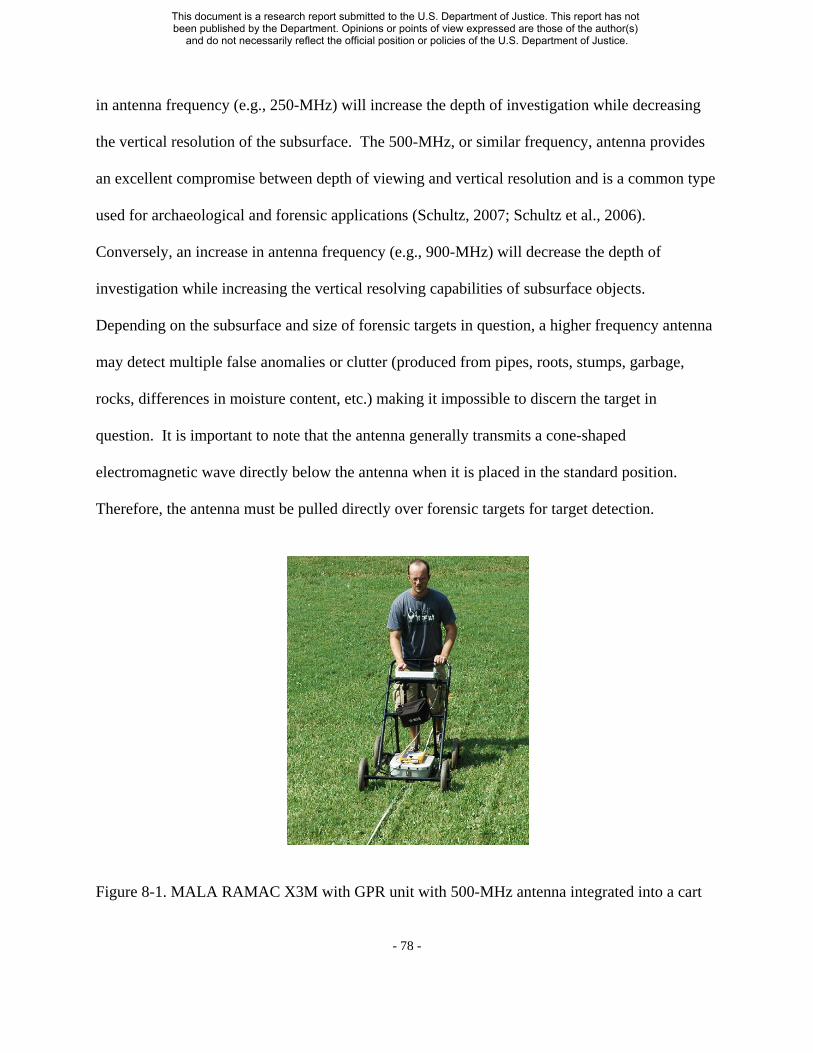
in antenna frequency (e.g., 250-MHz) will increase the depth of investigation while decreasing
the vertical resolution of the subsurface. The 500-MHz, or similar frequency, antenna provides
an excellent compromise between depth of viewing and vertical resolution and is a common type
used for archaeological and forensic applications (Schultz, 2007; Schultz et al., 2006).
Conversely, an increase in antenna frequency (e.g., 900-MHz) will decrease the depth of
investigation while increasing the vertical resolving capabilities of subsurface objects.
Depending on the subsurface and size of forensic targets in question, a higher frequency antenna
may detect multiple false anomalies or clutter (produced from pipes, roots, stumps, garbage,
rocks, differences in moisture content, etc.) making it impossible to discern the target in
question. It is important to note that the antenna generally transmits a cone-shaped
electromagnetic wave directly below the antenna when it is placed in the standard position.
Therefore, the antenna must be pulled directly over forensic targets for target detection.
Figure 8-1. MALA RAMAC X3M with GPR unit with 500-MHz antenna integrated into a cart
- 78
This document is a research report submitted to the U.S. Department of Justice. This report has not been published by the Department. Opinions or points of view expressed are those of the author(s)
and do not necessarily reflect the official position or policies of the U.S. Department of Justice.

Data Collection Parameters and Processing
Data were collected over the research area using a 15m (west to east) by 19m (south to
north) grid along gridlines oriented along the 19m axis of the grid (Figure 8-2). All of the data
collection was performed along the same direction starting at the southern end of the grid and
traveling north (Figure 8-2). It is usually good practice to collect all transects in the same
direction rather than alternating directions. Next, gridline transects were spaced every 10cm to
ensure detection of small weapons. Transects for each depth were all collected during the same
day to avoid significant variations in the soil, such as the moisture level, that could have affected
the quality of the GPR readings. Next, gridline transects were taken directly over the five rows
of buried items. Rows 1 and 2 consisted of seven buried items, row 3 consisted of six buried
items and a control hole, and rows 4 and 5 consisted of six buried items (Figure 8-3).
Finally, the last component of this research consisted of processing and presenting the
GPR data. Initially, GPR-SLICE was used for the data processing. However, data processing
issues with small subsurface anomaly identification resulted in using REFLEXW, version 4.5,
GPR software. The first step was to process the data using a variety of steps. The next step was
to create radargrams or transects of the five rows. Third, all of the transects (radargrams) were
welded together to create a 3-D cube. The first presentation of GPR data is to generate 2-D time
slices, or Z-slices, that are planview representations of the grid data at different depths. The
different colors represent different amplitudes. An option is provided to change the colorform to
utilize a variety of colors that best highlight the targets in question. Fourth, fence diagrams were
created from the 3-D model that incorporated a Z-slice and a Y-slice (radargram).
- 79
This document is a research report submitted to the U.S. Department of Justice. This report has not been published by the Department. Opinions or points of view expressed are those of the author(s)
and do not necessarily reflect the official position or policies of the U.S. Department of Justice.

Figure 8-2. Grid line transects collected every 10cm
- 80
This document is a research report submitted to the U.S. Department of Justice. This report has not been published by the Department. Opinions or points of view expressed are those of the author(s)
and do not necessarily reflect the official position or policies of the U.S. Department of Justice.

Figure 8-3. Five gridline transects collected directly over each forensic target with row 1 designated as the most western row and row 5 as the most eastern row
- 81
This document is a research report submitted to the U.S. Department of Justice. This report has not been published by the Department. Opinions or points of view expressed are those of the author(s)
and do not necessarily reflect the official position or policies of the U.S. Department of Justice.
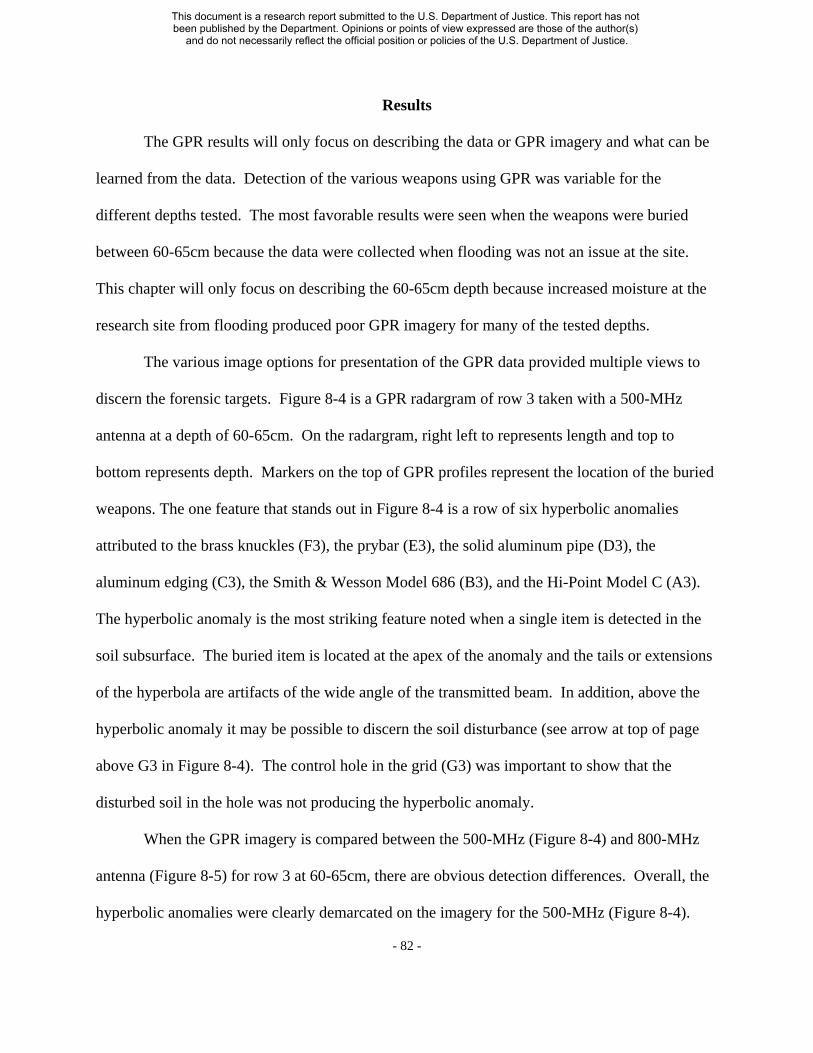
Results
The GPR results will only focus on describing the data or GPR imagery and what can be
learned from the data. Detection of the various weapons using GPR was variable for the
different depths tested. The most favorable results were seen when the weapons were buried
between 60-65cm because the data were collected when flooding was not an issue at the site.
This chapter will only focus on describing the 60-65cm depth because increased moisture at the
research site from flooding produced poor GPR imagery for many of the tested depths.
The various image options for presentation of the GPR data provided multiple views to
discern the forensic targets. Figure 8-4 is a GPR radargram of row 3 taken with a 500-MHz
antenna at a depth of 60-65cm. On the radargram, right left to represents length and top to
bottom represents depth. Markers on the top of GPR profiles represent the location of the buried
weapons. The one feature that stands out in Figure 8-4 is a row of six hyperbolic anomalies
attributed to the brass knuckles (F3), the prybar (E3), the solid aluminum pipe (D3), the
aluminum edging (C3), the Smith & Wesson Model 686 (B3), and the Hi-Point Model C (A3).
The hyperbolic anomaly is the most striking feature noted when a single item is detected in the
soil subsurface. The buried item is located at the apex of the anomaly and the tails or extensions
of the hyperbola are artifacts of the wide angle of the transmitted beam. In addition, above the
hyperbolic anomaly it may be possible to discern the soil disturbance (see arrow at top of page
above G3 in Figure 8-4). The control hole in the grid (G3) was important to show that the
disturbed soil in the hole was not producing the hyperbolic anomaly.
When the GPR imagery is compared between the 500-MHz (Figure 8-4) and 800-MHz
antenna (Figure 8-5) for row 3 at 60-65cm, there are obvious detection differences. Overall, the
hyperbolic anomalies were clearly demarcated on the imagery for the 500-MHz (Figure 8-4).
- 82
This document is a research report submitted to the U.S. Department of Justice. This report has not been published by the Department. Opinions or points of view expressed are those of the author(s)
and do not necessarily reflect the official position or policies of the U.S. Department of Justice.

Refer to Appendix B for the 800- MHz and 500-MHz radargrams of the rows 1 to 5 that were
collected when the targets were buried at 60-65cm. Conversely, the hyperbolic anomalies were
poorly demarcated on the imagery for the 800-MHz (Figure 8-5).
With the incorporation of the Z-slices from the 3-D model, additional data were provided.
Two Z-slices were found to be useful for analysis. The first Z-slice was a cut through the 3-D
model near the ground surface. The second Z-slice was a deeper cut through the 3-D model at
the depth of hyperbolic anomalies. The top Z-slice of the 500-MHz data (Figure 8-6A) clearly
detected the disturbed soil of the top portion of all holes that were dug within the grid including
the control hole (G3). When comparing the Z-slices of the 500-MHz data (Figure 8-6A) with
those of the 800-MHz data (Figure 8-7A) there was much better demarcation of the disturbed
soil of the burial holes with the 500-MHz data. Overall, there was poor detection of the burial
holes using the 800-MHz data compared to the 500-MHz data. Furthermore, when the deeper
500 MHz Z-slice (Figure 8-6B) was compared to the corresponding Z-slice of the 800-MHz data
(Figure 8-7B), the 500-MHz data once again provided increased demarcation of the weapons.
For example, all of the buried weapons were detected on the deeper Z-slice. The circles and
linear lines most likely represent the hyperbolic anomalies produced by the buried weapons.
Conversely, there were no weapons detected when viewing the Z-slice for the 800-MHz (Figure
8-7B).
The next and most comprehensive level of GPR data analysis is to construct a fence
diagram, which is a composite image of a Z-slice and a Y-slice. The fence diagram was useful to
show how the detected soil disturbance on the top Z-slice corresponded with the hyperbolic
anomaly of the radargram. For example, Figure 8-8 is a fence diagram of row 5 using the 500
MHz antenna. The particular Y-slice through the 3-D model shows four hyperbolic anomalies
- 83
This document is a research report submitted to the U.S. Department of Justice. This report has not been published by the Department. Opinions or points of view expressed are those of the author(s)
and do not necessarily reflect the official position or policies of the U.S. Department of Justice.

from a number of large firearms and weapons (F5, E5, D5 and C5). The Y-slice is oriented
through the Z-slice to show how the four hyperbolic anomalies were located directly below the
disturbed soil.
Figure 8-4. GPR radargram using 500-MHz antenna of row 3 taken at a depth of 60-65cm showing hyperbolic anomalies attributed to the brass knuckles (F3), the prybar (E3), the solid aluminum pipe (D3), aluminum edging (C3), Smith & Wesson Model 686 (B3), and the Hi-Point Model C (A3). Note the control hole (G3) without a hyperbolic anomaly.
Figure 8-5. GPR radargram using 800-MHz antenna of row 3 taken at a depth of 60-65cm showing hyperbolic anomalies attributed to the brass knuckles (F3), the prybar (E3), the solid aluminum pipe (D3), aluminum edging (C3), Smith & Wesson Model 686 (B3), and the Hi-Point Model C (A3). Note the control hole (G3) without a hyperbolic anomaly.
- 84
This document is a research report submitted to the U.S. Department of Justice. This report has not been published by the Department. Opinions or points of view expressed are those of the author(s)
and do not necessarily reflect the official position or policies of the U.S. Department of Justice.

Figure 8-6A. GPR Z-slice using 500-MHz antenna when the weapons were buried at a depth of 60-65cm showing soil disturbances of the holes near the ground surface.
- 85
This document is a research report submitted to the U.S. Department of Justice. This report has not been published by the Department. Opinions or points of view expressed are those of the author(s)
and do not necessarily reflect the official position or policies of the U.S. Department of Justice.
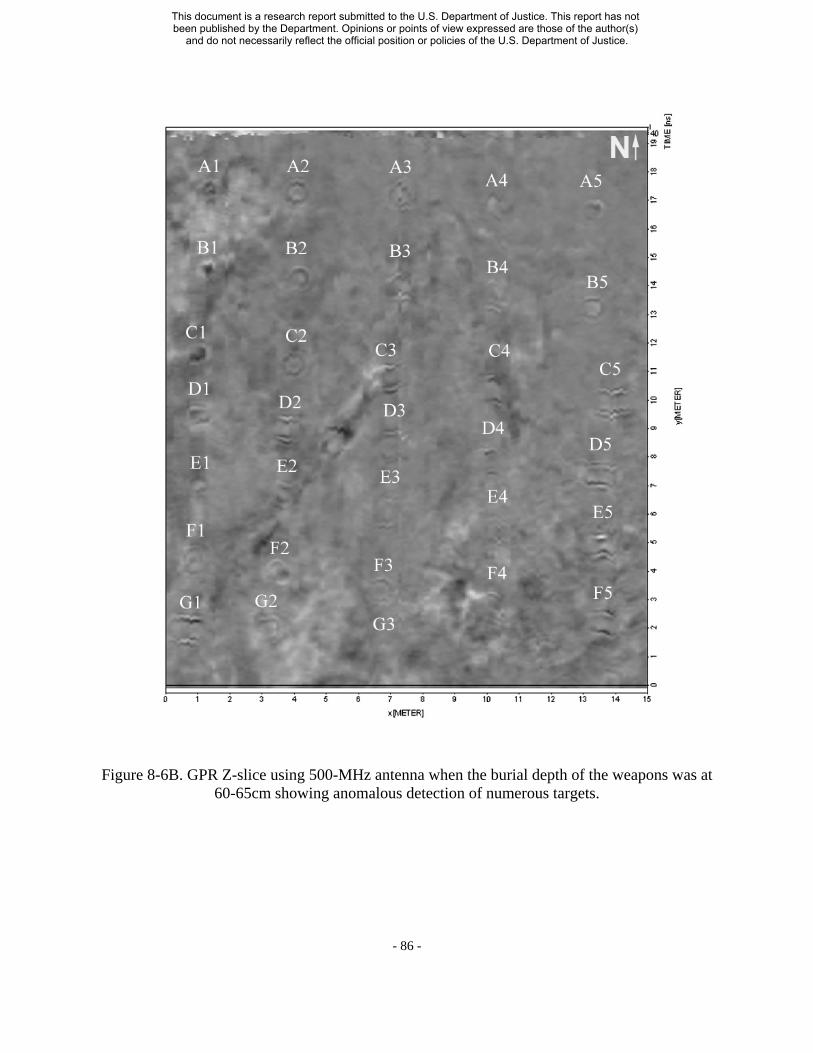
Figure 8-6B. GPR Z-slice using 500-MHz antenna when the burial depth of the weapons was at 60-65cm showing anomalous detection of numerous targets.
- 86
This document is a research report submitted to the U.S. Department of Justice. This report has not been published by the Department. Opinions or points of view expressed are those of the author(s)
and do not necessarily reflect the official position or policies of the U.S. Department of Justice.

Figure 8-7A. GPR Z-slice using 800-MHz antenna taken when the weapons were buried at a depth of 60-65cm showing a number of soil disturbances for the holes near the ground surface.
- 87
This document is a research report submitted to the U.S. Department of Justice. This report has not been published by the Department. Opinions or points of view expressed are those of the author(s)
and do not necessarily reflect the official position or policies of the U.S. Department of Justice.
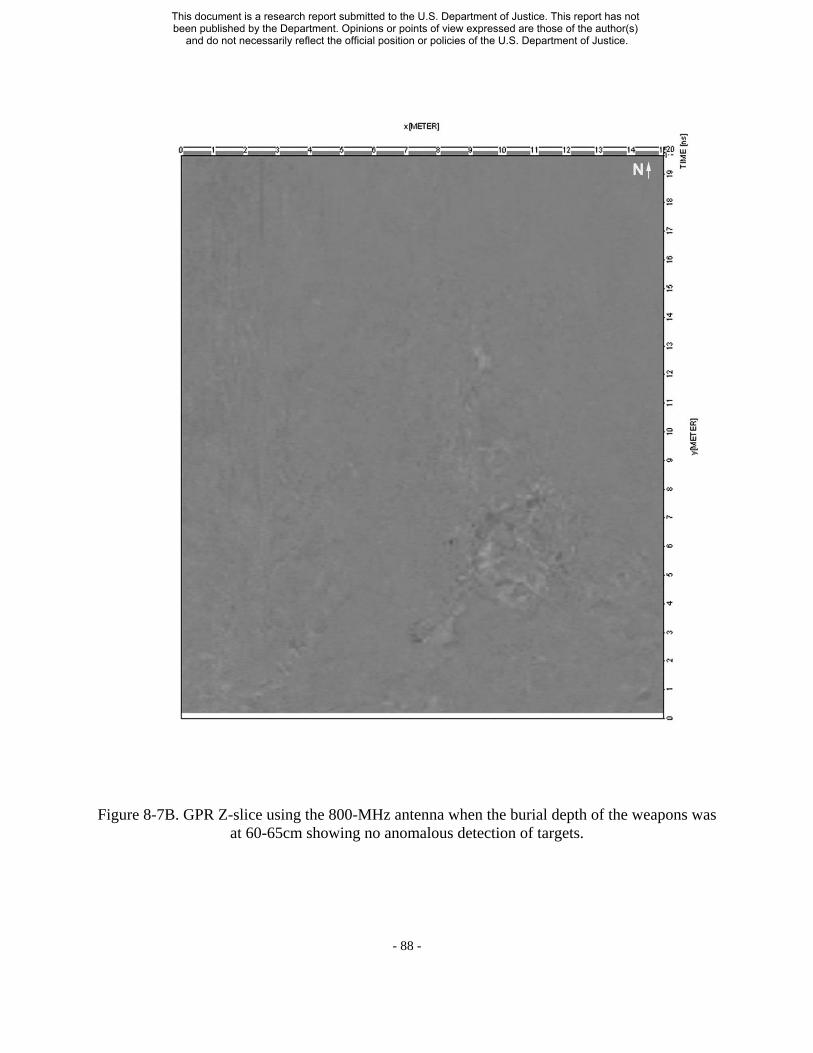
Figure 8-7B. GPR Z-slice using the 800-MHz antenna when the burial depth of the weapons was at 60-65cm showing no anomalous detection of targets.
- 88
This document is a research report submitted to the U.S. Department of Justice. This report has not been published by the Department. Opinions or points of view expressed are those of the author(s)
and do not necessarily reflect the official position or policies of the U.S. Department of Justice.

Figure 8-8. Fence diagram of row 5 using the 500-MHz antenna that was collected when the weapons were buried at a depth of 60-65cm
- 89
This document is a research report submitted to the U.S. Department of Justice. This report has not been published by the Department. Opinions or points of view expressed are those of the author(s)
and do not necessarily reflect the official position or policies of the U.S. Department of Justice.

CHAPTER 9: DISCUSSION, SEARCH GUIDELINES, & CONCLUSIONS
Discussion
The first issue to consider when performing a search for a buried weapon is which
geophysical tool should be used. First, the geophysical equipment can be separated into two
groups: the easy to operate and less expensive equipment (metal detectors and magnetic locator)
and the more expensive units (conductivity meter and GPR) that require operator training and
experience. Both the magnetic locator and the all-metal detector proved to be easy to use with
little training, and would therefore be suitable for law enforcement officials and forensic
investigators with little or no prior experience with geophysical technologies. Most questions
that arose concerning operation could generally be answered using the owner’s manuals and in
field adjustments were easy to perform. The advanced metal detector proved to require more
training than the all-metal detector, due in part to the discrimination function, but the results
demonstrated that the discrimination capability was not useful because the majority of firearms
and miscellaneous weapons were composed in part or completely of steel. Therefore, it was not
possible to accurately distinguish one steel object from another based on the discrimination
feature of the advanced metal detector.
Discussed below are only those results that generated an audible response of strong, as it
is the most easily discernable response. Slight audible responses take more in-depth operator
experience to tune one’s ear to. Tables 9-1 to 9-6 summarize and compare the results for the all-
metal detector using both settings, the magnetic locator using both settings, the advanced metal
detector using both coils, and the conductivity meter using 25cm transects. For each metallic
object, the geophysical instrument offering the best depth of detection was bolded. The GPR
- 90
This document is a research report submitted to the U.S. Department of Justice. This report has not been published by the Department. Opinions or points of view expressed are those of the author(s)
and do not necessarily reflect the official position or policies of the U.S. Department of Justice.

results were not included in these tables because maximum depth of detection of the forensic
targets was not determined using the GPR.
Several aspects of the forensic targets were seen to affect detection: depth, metal
composition, and size. It is important to note that a number of control holes (two outside the grid
and one inside the grid) were tested during data collection. The disturbed soil of the control
holes did not produce any audible responses for the various depths when tested with the
magnetic locator, all-metal detector, and advanced metal detector.
In terms of detection, all of the firearms including the Glock Model 19 contained enough
metal to be detected with the all-metal detector down to a depth of at least 10-15cm using the
Normal/Medium setting (Table 9-1) and only considering audible responses classified as strong.
When examining the effect of depth on the detection of forensic targets, there were several
patterns which became apparent. While the metal composition of the items was not a factor for
detection using the all-metal detector, there was a depth detection limit at 30-35cm for all of the
items tested including the firearms, miscellaneous weapons, and the scrap metals using the
Normal/Medium setting (Tables 9-1 to 9-3). In contrast, while the magnetic locator was able to
detect five firearms at a greater depth than the all-metal detector using the Normal/Medium
setting, four were detected at the same depth, and seven were detected at a shallower depth or not
detected at all (Table 9-1). Overall, the magnetic locator performed better at detecting the larger
firearms at deeper depths, while the all-metal detector performed better at detecting smaller
firearms. Once High settings were incorporated, the array of firearms detected was roughly the
same between the two tools; however, the magnetic locator was still able to detect the larger
targets at greater depths (Table 9-4). For example, four firearms were detected at depths greater
than 50cm with the magnetic locator compared to only one with the all-metal detector.
- 91
This document is a research report submitted to the U.S. Department of Justice. This report has not been published by the Department. Opinions or points of view expressed are those of the author(s)
and do not necessarily reflect the official position or policies of the U.S. Department of Justice.

Furthermore, while no miscellaneous weapons or scrap metals were detected at a depth greater
than 45cm using the all-metal detector, three miscellaneous weapons and one scrap metal were
detected deeper than 45cm using the magnetic locator using the Normal/Medium setting (Tables
9-2 and 9-3). Once again, the magnetic locator appears to have a greater depth of detection for a
number of items using both the Normal/Medium and High settings.
There were a few advantages in using the advanced metal detector. When using either the
standard or large size coil, the advanced metal detector detected the medium to small firearms at
the deepest depths compared to the magnetic locator and the all-metal detector. Also, the three
iron scrap metals (C4, D2, and D4) were not detected using the advanced metal detector because
the factory preset for the Iron Mask is designed not to detect iron objects because they generally
represent trash metals.
One striking result concerning the advanced metal detector with the large coil was the
detection of the smallest firearms. The advanced metal detector had the deepest detection for the
smallest firearms in comparison to the all-metal detector, the magnetic locator, and the
conductivity meter (Tables 9-1 and 9-4). Another issue to consider was whether a larger search
coil should be used to increase depth of detection with a metal detector. Theoretically, the large
search coil from the advanced metal detector should penetrate the ground deeper than the
medium coil and provide better results at greater depths. This research confirmed that the larger
coil provided equal or greater detection depths for a majority (30 out of 32) of the targets in
comparison to the medium coil (Figures 6-8 to 6-10). However, it should be noted that the two
coils actually displayed the same depth of detection for 22 of the 32 weapons (Figures 6-8 to 6
10). There was an advantage detecting the largest weapons at deeper depths using the large coil.
On the other hand, the depths of detection were very similar between the two coils for the
- 92
This document is a research report submitted to the U.S. Department of Justice. This report has not been published by the Department. Opinions or points of view expressed are those of the author(s)
and do not necessarily reflect the official position or policies of the U.S. Department of Justice.

medium and smaller sized weapons. Both coils may therefore be valuable in real-life forensic
searches in which law enforcement is looking for a buried metallic weapon. However, if the
weapon being searched for is large, a large coil may provide the best depths of detection.
Table 9-1: Maximum depth of detection (cm) for firearms comparing the all-metal detector and magnetic locator on Normal/Medium setting, the advanced metal detector with the medium coil, and the conductivty meter using 25cm transects when only audible responses classified as strong are considered.
Firearms All-Metal Detector Magnetic Locator
Advanced Metal Detector
Conductivity Meter
Norinco 25-30 45-50 20-25 55-60 Remington 30-35 50-55 40-45 60-65 Mossberg 25-30 25-30 35-40 60-65 S&W 686 20-25 15-20 40-45 60-65
Ruger 20-25 15-20 35-40 55-60 Colt 25-30 40-45 45-50 45-50
S&W 5906 20-25 20-25 45-50 65-70 Glock 15-20 15-20 No Detection 50-55
Hi-Point 15-20 15-20 35-40 35-40 Lorcin L380 15-20 No Detection 35-40 25-30
Bryco 59 15-20 10-15 45-50 35-40 S&W 37 15-20 20-25 30-35 40-45 RG 23 15-20 0-5 40-45 30-35
NA Arms 10-15 15-20 No Detection 35-40 Raven Arms 15-20 No Detection 35-40 30-35
Derringer 10-15 5-10 40-45 25-30
- 93
This document is a research report submitted to the U.S. Department of Justice. This report has not been published by the Department. Opinions or points of view expressed are those of the author(s)
and do not necessarily reflect the official position or policies of the U.S. Department of Justice.
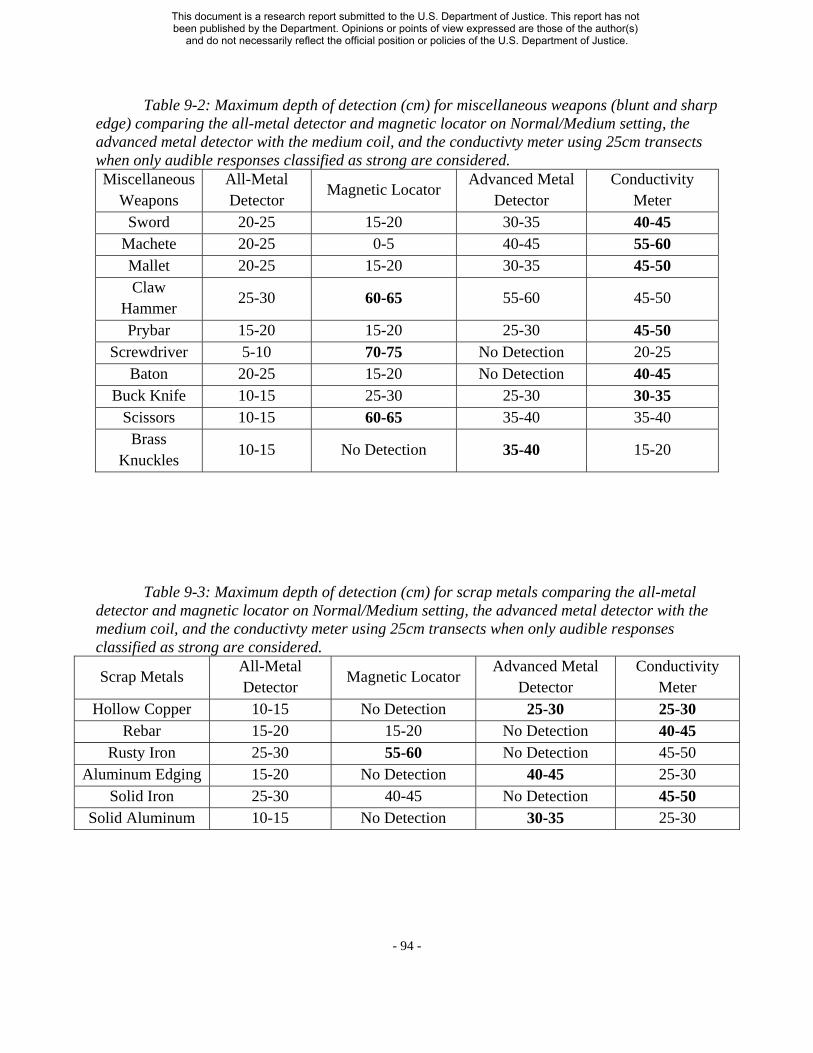
Table 9-2: Maximum depth of detection (cm) for miscellaneous weapons (blunt and sharp edge) comparing the all-metal detector and magnetic locator on Normal/Medium setting, the advanced metal detector with the medium coil, and the conductivty meter using 25cm transects when only audible responses classified as strong are considered. Miscellaneous
Weapons All-Metal Detector
Magnetic Locator Advanced Metal
Detector Conductivity
Meter Sword 20-25 15-20 30-35 40-45
Machete 20-25 0-5 40-45 55-60 Mallet 20-25 15-20 30-35 45-50 Claw
Hammer 25-30 60-65 55-60 45-50
Prybar 15-20 15-20 25-30 45-50 Screwdriver 5-10 70-75 No Detection 20-25
Baton 20-25 15-20 No Detection 40-45 Buck Knife 10-15 25-30 25-30 30-35
Scissors 10-15 60-65 35-40 35-40 Brass
Knuckles 10-15 No Detection 35-40 15-20
Table 9-3: Maximum depth of detection (cm) for scrap metals comparing the all-metal detector and magnetic locator on Normal/Medium setting, the advanced metal detector with the medium coil, and the conductivty meter using 25cm transects when only audible responses classified as strong are considered.
Scrap Metals All-Metal Detector
Magnetic Locator Advanced Metal
Detector Conductivity
Meter Hollow Copper 10-15 No Detection 25-30 25-30
Rebar 15-20 15-20 No Detection 40-45 Rusty Iron 25-30 55-60 No Detection 45-50
Aluminum Edging 15-20 No Detection 40-45 25-30 Solid Iron 25-30 40-45 No Detection 45-50
Solid Aluminum 10-15 No Detection 30-35 25-30
- 94
This document is a research report submitted to the U.S. Department of Justice. This report has not been published by the Department. Opinions or points of view expressed are those of the author(s)
and do not necessarily reflect the official position or policies of the U.S. Department of Justice.
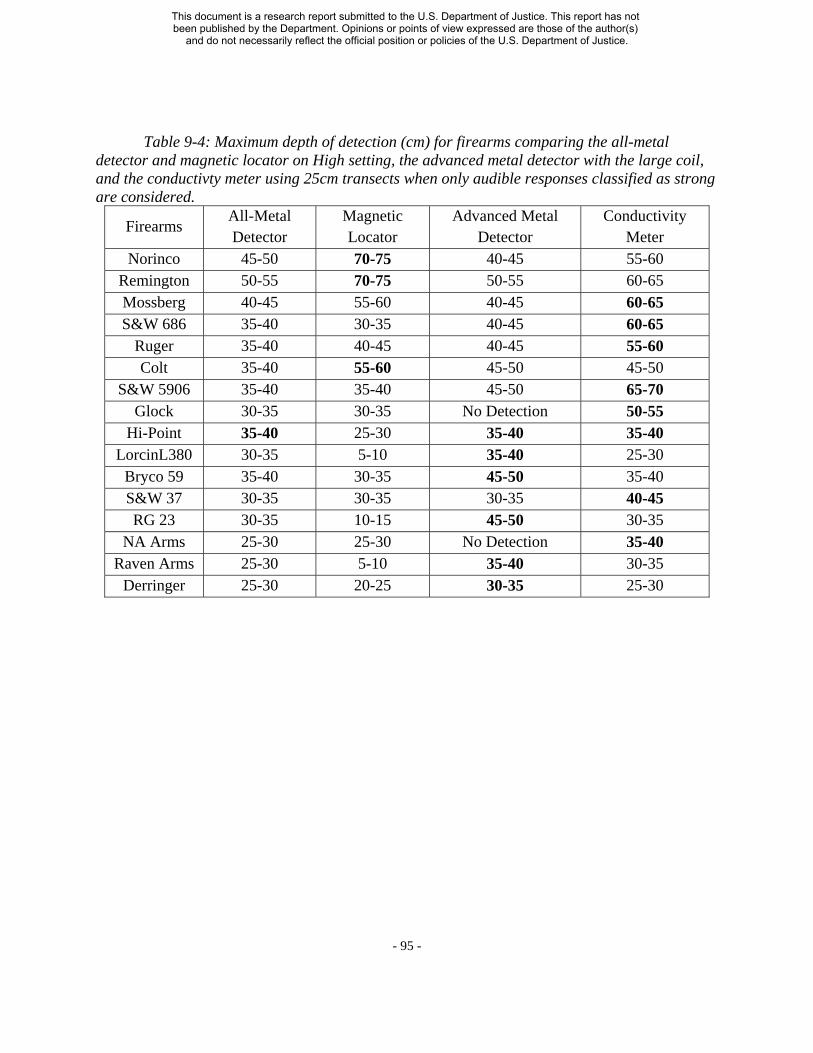
Table 9-4: Maximum depth of detection (cm) for firearms comparing the all-metal detector and magnetic locator on High setting, the advanced metal detector with the large coil, and the conductivty meter using 25cm transects when only audible responses classified as strong are considered.
Firearms All-Metal Detector
Magnetic Locator
Advanced Metal Detector
Conductivity Meter
Norinco 45-50 70-75 40-45 55-60 Remington 50-55 70-75 50-55 60-65 Mossberg 40-45 55-60 40-45 60-65 S&W 686 35-40 30-35 40-45 60-65
Ruger 35-40 40-45 40-45 55-60 Colt 35-40 55-60 45-50 45-50
S&W 5906 35-40 35-40 45-50 65-70 Glock 30-35 30-35 No Detection 50-55
Hi-Point 35-40 25-30 35-40 35-40 LorcinL380 30-35 5-10 35-40 25-30
Bryco 59 35-40 30-35 45-50 35-40 S&W 37 30-35 30-35 30-35 40-45 RG 23 30-35 10-15 45-50 30-35
NA Arms 25-30 25-30 No Detection 35-40 Raven Arms 25-30 5-10 35-40 30-35
Derringer 25-30 20-25 30-35 25-30
- 95
This document is a research report submitted to the U.S. Department of Justice. This report has not been published by the Department. Opinions or points of view expressed are those of the author(s)
and do not necessarily reflect the official position or policies of the U.S. Department of Justice.

Table 9-5: Maximum depth of detection (cm) for miscellaneous weapons (blunt and sharp edge) comparing the all-metal detector and magnetic locator on High setting, the advanced metal detector with the large coil, and the conductivty meter using 25cm transects when only audible responses classified as strong are considered. Miscellaneous
Weapons All-Metal Detector Magnetic Locator
Advanced Metal Detector
Conductivity Meter
Sword 35-40 40-45 30-35 40-45 Machete 35-40 25-30 40-45 55-60 Mallet 35-40 20-25 35-40 45-50 Claw
Hammer 40-45 50-55 50-55 45-50
Prybar 30-35 25-30 40-45 45-50 Screwdriver 15-20 80-85 No Detection 20-25
Baton 30-35 25-30 No Detection 40-45 Buck Knife 25-30 35-40 25-30 30-35
Scissors 25-30 60-65 35-40 35-40 Brass
Knuckles 25-30 No Detection 35-40 15-20
Table 9-6: Maximum depth of detection (cm) for scrap metals comparing the all-metal detector and magnetic locator on High setting, and the advanced metal detector with the large coil, and the conductivty meter using 25cm transects when only audible responses classified as strong are considered. Scrap Metals
All-Metal Detector Magnetic Locator Advanced Metal
Detector Conductivity
Meter Hollow Copper
25-30 No Detection 30-35 25-30
Rebar 30-35 25-30 No Detection 40-45 Rusty Iron 40-45 65-70 No Detection 45-50 Aluminum
Edging 30-35
No Detection 40-45 25-30
Solid Iron 40-45 55-60 No Detection 45-50 Solid
Aluminum 20-25
No Detection 30-35 25-30
- 96
This document is a research report submitted to the U.S. Department of Justice. This report has not been published by the Department. Opinions or points of view expressed are those of the author(s)
and do not necessarily reflect the official position or policies of the U.S. Department of Justice.

As expected, metal composition was an issue using the magnetic locator. The magnetic
locator is designed to detect ferrous metals and ignore non-ferrous metals. The most striking
instances where metal composition was a factor with detection of firearms using the magnetic
locator included the Lorcin L380 (B4) and Raven Arms MP-25 (A2). Both of these weapons
were only detected down to 5-10cm using the High setting. Although these are two of the
smallest weapons, it is not surprising that there was shallow detection based on the metallic
materials comprising the weapons. The Lorcin L380 (B4) is comprised of an aluminum frame
and magazine. The Raven Arms MP-25 (A2) is primarily comprised of a zinc alloy with an
aluminum clip. Zinc is classified as a diamagnetic alloy that weakly repels magnetic fields, and
aluminum objects are not supposed to be detected by the magnetic locator. Conversely, the
Jennings Bryco 59 (B2), which is also comprised of a zinc alloy, was detected much deeper than
the Raven Arms MP-25 (A2) at 30-35cm because the clip is made out of steel. Also, while the
frame for the RG Industries RG23 (C2) is comprised of aluminum, the weapons were detected
deeper than the Lorcin L380 (B4) and the Raven Arms MP-25 (A2) at 30-35cm because the
barrel and cylinder are comprised of steel.
The reduced detection of items comprised of non-ferrous materials is further
demonstrated by a number of other items that were tested. For example, the two pieces of
aluminum scrap metal (C3 and D3) and the hollow copper pipe (D1) were not detected with the
magnetic locator on either the Medium or High settings. Furthermore, the brass knuckles (F3)
were not detected with a strong hit using either the Medium or High settings.
At the request of one of the reviewers of the concept paper, we tested a number of
weapons buried in a plastic PVC pipe. The largest PVC pipe available at the local home
improvement store was 4 inches in diameter. Due to the small diameter of the PVC pipe, only the
- 97
This document is a research report submitted to the U.S. Department of Justice. This report has not been published by the Department. Opinions or points of view expressed are those of the author(s)
and do not necessarily reflect the official position or policies of the U.S. Department of Justice.

smallest handguns were able to fit within the pipe. A firearm was placed in a small section of
PVC pipe and two rubber ends were placed over the open ends of the pipe to ensure that the
weapon would be secured within the pipe when buried. We tested three small handguns (the
Raven arms MP-25 (A2), the North American Arms Mini Magnum (B1), and the RG Industries
RG23 (C2) with the all-metal detector, the magnetic locator, and the advanced metal detector. As
expected, the results of all three geophysical instruments showed that the maximum depths of
detection did not change when the weapons were placed within the buried plastic PVC pipe.
Compared to the all-metal detector, magnetic locator, and the advanced metal detector the
conductivity meter and the GPR are more expensive and require expert training before they can
be operated. The conductivity meter demonstrated good depths of detection and was able to
detect all weapons, unlike the magnetic locator and the advanced metal detector, down to a depth
of at least15-20cm, slightly deeper than the all-metal detector. In addition to being able to detect
all types of metals, the greatest advantage of the conductivity meter is the superior depths of
detection, especially with the larger weapons. Thirteen of the 32 weapons were still detected at a
depth of 45-50cm compared to nine for the magnetic locator on high setting, six for advanced
metal detector with the large coil, and two for the all-metal detector on high setting. The study
showed that the conductivity meter was especially useful in detecting firearms and miscellaneous
weapons. The conductivity meter provided the best depth of detection for half of the 16 firearms
and half of the ten blunt and sharp edged weapons when compared to the all-metal detector and
magnetic locator on High setting and the advanced metal detector with the large coil. Although
the conductivity meter demonstrated good detection of the scrap metals, it only detected one of
the scrap metals deeper than the other geophysical tools (Table 9-6). This is probably due to the
- 98
This document is a research report submitted to the U.S. Department of Justice. This report has not been published by the Department. Opinions or points of view expressed are those of the author(s)
and do not necessarily reflect the official position or policies of the U.S. Department of Justice.

relatively smaller size of these targets and it has already been mentioned that the conductivity
meter is best suited for detection of larger metallic objects.
The transect interval is another variable that needs to be addressed if one is using a
conductivity meter to perform a forensic search. When using the 25cm interval spacing, there
was always at least an equal or a greater number of weapons detected at the same depth
compared to the 50cm intervals. The difference was the greatest at the 50-55cm depth where
five more weapons were detected using 25cm intervals compared to the 50cm intervals. On the
other hand, an equal amount of weapons was detected at depths of 35-40cm, 40-45cm, 65-70cm,
and every depth below 30cm. It is also important to note that the weapons that displayed
different detection patterns from one transect interval to the other were usually the small
weapons. As expected, the results for larger weapons such as the shotguns and the rifle were not
affected as much by changing the transect interval. Overall, the conductivity meter proved to be
a valuable tool for forensic searches, especially when searching for larger metallic objects or
objects that are believed to be buried at greater depths.
Next, it is important consider the utility of the GPR. The research has shown that the
500-MHz antenna was a better option to use than the 800-MHz antenna for weapons searches in
this type of environment. The 800-MHz highlighted too much of the subsurface resulting in
difficulty discerning the actual forensic targets. This research utilized transects spacing of 10cm
which clearly highlighted both the small and large weapons. However, a survey utilizing 10cm
spacing takes a considerable amount of time to perform. The survey performed for this research
project generally took at least 3 hours of field work, not including setting up the grid. For a real
life scenario, it would not be feasible to collect transects with this spacing for a large search area
- 99
This document is a research report submitted to the U.S. Department of Justice. This report has not been published by the Department. Opinions or points of view expressed are those of the author(s)
and do not necessarily reflect the official position or policies of the U.S. Department of Justice.

if the forensic target was a small sized handgun; a magnetic locator or an all-metal detector
would provide better options for small-sized weapons.
The various image options to present the GPR data provided multiple views to discern the
forensic targets. The control hole in the grid (G3) was important to show that the disturbed soil
in the hole was not producing the hyperbolic anomaly. The detection of the various weapons
was discernable when using the radargrams or 2-D time slices as a hyperbolic anomaly that may
contain a soil disturbance directly above the buried object. An advantage of the radargram is that
general depth information is provided which helps investigators know how deep they need to
excavate or invasively test areas of interest. With the incorporation of the Z-slices from the 3-D
model, additional data are provided. For example, the Z-slices near the ground surface detected
the disturbed soil of the holes. Then, in a number of instances, a Z-slice slightly deeper than the
depth of the weapon was able to discern the tails of the hyperbolic anomalies. Furthermore, the
fence diagrams incorporated the visual data by showing that an object (hyperbolic anomaly on
the Y-slice) was buried directly below the soil disturbance on the Z-slice. Another advantage of
the GPR over the rest of the geophysical tools is depth of penetration. There were depth
detection limits to all of the geophysical tools. However, based on the depth of penetration of the
radargrams, the GPR would be able to detect a larger weapon such as a rifle or a shotgun at
depths deeper than a meter with appropriate site conditions (flat ground surface, little brush and
trees, little metal debris, soil conductivity, etc.).
There are a number of advantages for using conductivity over GPR for buried weapons
searches. Conductivity provides a general size of the target based on the size and intensity of the
anomaly. There is less processing of the data needed to produce a conductivity map than to
produce the various GPR imagery views. A conductivity map provides a quick way to produce a
- 100
This document is a research report submitted to the U.S. Department of Justice. This report has not been published by the Department. Opinions or points of view expressed are those of the author(s)
and do not necessarily reflect the official position or policies of the U.S. Department of Justice.
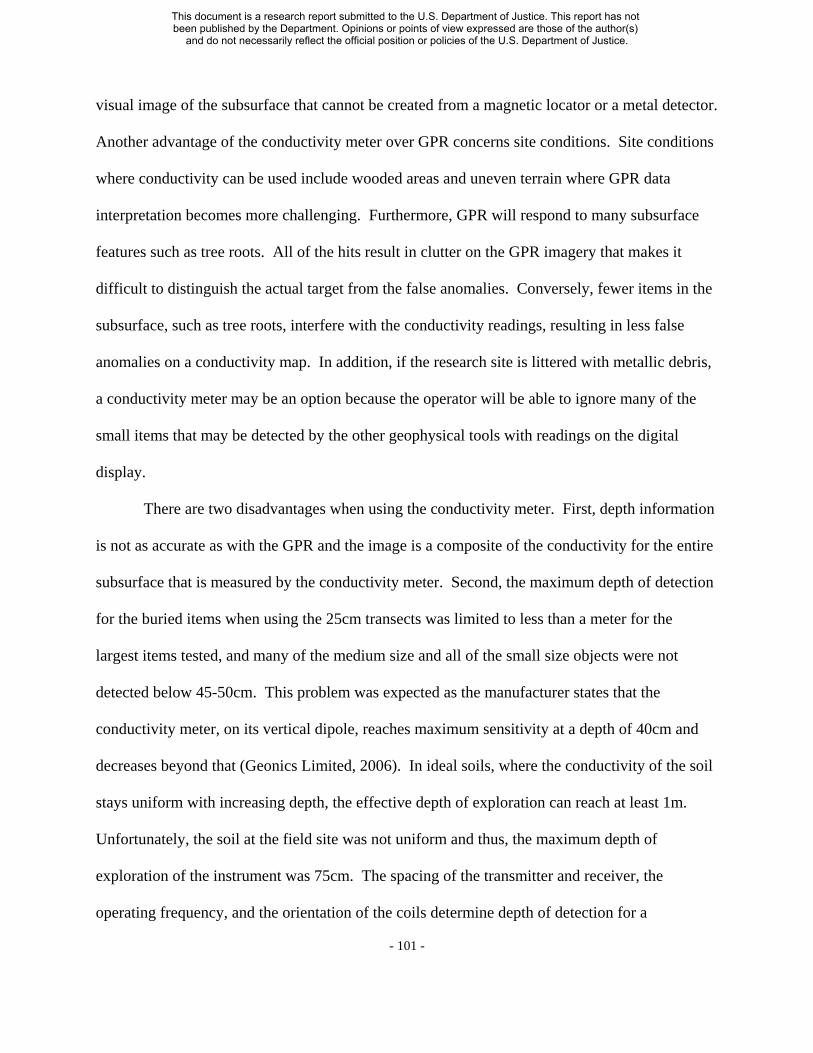
visual image of the subsurface that cannot be created from a magnetic locator or a metal detector.
Another advantage of the conductivity meter over GPR concerns site conditions. Site conditions
where conductivity can be used include wooded areas and uneven terrain where GPR data
interpretation becomes more challenging. Furthermore, GPR will respond to many subsurface
features such as tree roots. All of the hits result in clutter on the GPR imagery that makes it
difficult to distinguish the actual target from the false anomalies. Conversely, fewer items in the
subsurface, such as tree roots, interfere with the conductivity readings, resulting in less false
anomalies on a conductivity map. In addition, if the research site is littered with metallic debris,
a conductivity meter may be an option because the operator will be able to ignore many of the
small items that may be detected by the other geophysical tools with readings on the digital
display.
There are two disadvantages when using the conductivity meter. First, depth information
is not as accurate as with the GPR and the image is a composite of the conductivity for the entire
subsurface that is measured by the conductivity meter. Second, the maximum depth of detection
for the buried items when using the 25cm transects was limited to less than a meter for the
largest items tested, and many of the medium size and all of the small size objects were not
detected below 45-50cm. This problem was expected as the manufacturer states that the
conductivity meter, on its vertical dipole, reaches maximum sensitivity at a depth of 40cm and
decreases beyond that (Geonics Limited, 2006). In ideal soils, where the conductivity of the soil
stays uniform with increasing depth, the effective depth of exploration can reach at least 1m.
Unfortunately, the soil at the field site was not uniform and thus, the maximum depth of
exploration of the instrument was 75cm. The spacing of the transmitter and receiver, the
operating frequency, and the orientation of the coils determine depth of detection for a
- 101
This document is a research report submitted to the U.S. Department of Justice. This report has not been published by the Department. Opinions or points of view expressed are those of the author(s)
and do not necessarily reflect the official position or policies of the U.S. Department of Justice.

conductivity meter. Other longer, more expensive, and less portable conductivity meter units can
provide information on depths greater than those tested. One of the best uses of the EM-38
conductivity meter for forensics is looking for lateral changes in conductivity related to larger
excavations, and not depth of the anomaly, that are associated with clandestine burials. It is also
recommended that both conductivity and inphase, or magnetic susceptibility, readings be
recorded at the same time during the survey. In our case, the research focused on conductivity
readings because the conductivity meter model used in the research did not allow for both
readings to be recorded simultaneously. The EM-38 model that is available from Geonics
Limited records conductivity and inphase simultaneously.
Search Guidelines
Guidelines for Choosing a Geophysical Tool
This research has shown that there are a number of options available when trying to
choose which geophysical tool to use on a forensic search based on the target in question. In
many instances, weapons are at a shallow depth because they have been hastily discarded.
First, materials must be considered. All of the detectors can be used for items made of
steel. However, if the item in question is made of aluminum zinc, copper, or brass the magnetic
locator should not be used. Second, the size of the target must be considered. If the target in
question is a small metallic object buried shallower than 20-25cm, then an all-metal detector or a
magnetic locator should be used. If the item is larger, then all of the detectors can be used.
- 102
This document is a research report submitted to the U.S. Department of Justice. This report has not been published by the Department. Opinions or points of view expressed are those of the author(s)
and do not necessarily reflect the official position or policies of the U.S. Department of Justice.

Third, depth at which the target is buried must be considered. Any of the geophysical
tools can be used for shallow targets buried shallower than 50cm. If the target is buried greater
than 50cm and less than 75cm, the magnetic locator or the conductivity meter are options. For
large objects that may be buried at a depth of at least 1m, GPR or a conductivity meter designed
to detect smaller objects at deeper depths would be options.
Fourth, there are many site conditions to consider. Water-saturated ground conditions
present a problem for all detectors except the magnetic locator when searching for a buried
metallic object. However, a little moisture in the ground can sometimes highlight the
disturbances present in the soil as anomalies. If the target is in a wooded area or if the ground
surface is not flat, GPR may not be the best option, but the conductivity meter can be used along
with the all-metal detector and magnetic locator. If a search is being conducted in a small
backyard, many of the geophysical tools can be considered. However, if there is a large metal
fence or other relatively large metal features (e.g., swingset) in close proximity to the survey
area, the investigator needs to know the location of these features with respect to the instrument
so the effect can be taken into account during the interpretation. The GPR is the primary option
for weapons searches involving buried weapons that may be placed under a cement slab or
blacktop. For example, if a suspected weapon is buried under the cement slab of a house or
garage, a GPR survey can be performed to highlight specific areas for limited invasive testing
through the cement. A conductivity meter can also be used for this type of search. However, if
there is any metal in the concrete, the metal may interfere with the anomaly created by the actual
target.
Fifth, the size of the search area must also be considered when planning the search. If
the search area is very large, such as many acres, a grid search should be used with multiple
- 103
This document is a research report submitted to the U.S. Department of Justice. This report has not been published by the Department. Opinions or points of view expressed are those of the author(s)
and do not necessarily reflect the official position or policies of the U.S. Department of Justice.

operators using either all-metal detectors or magnetic locators. The conductivity meter and GPR
are better suited for smaller search areas because the time-consuming tasks involved with data
collection and data processing are not always conducive to the time constraints involved with a
forensic search.
Guidelines Prior to the Search
Forensic professionals should start the search for a buried weapon by gathering all
possible information regarding the suspected target including size, metal composition, and a
possible burial depth. All forensic personnel involved with using the geophysical search
equipment must be trained prior to using the equipment in the field during an actual search.
Also, if multiple metal detectors are used during a search, all of the detectors must be configured
to the same settings to ensure the consistency of results. If a weapon similar to the weapon in
question is available prior to the search, geophysical testing of the weapon should be performed
prior to the field survey by burying the weapon at 10cm intervals to determine the optimum
instrument settings for that investigation. If enough time has elapsed for the search area to have
changed since the weapon in question was hidden or discarded, aerials of the search area from
the burial period should be sought to help plan the search. It is also important to note that
preparations for the search should focus on either defining a manageable area to search or
dividing up larger search areas and starting with the most likely area first. In addition, if it is
possible to have the underground utilities and pipes marked in the search area prior to the search,
this can help to avoid searching and checking false targets.
- 104
This document is a research report submitted to the U.S. Department of Justice. This report has not been published by the Department. Opinions or points of view expressed are those of the author(s)
and do not necessarily reflect the official position or policies of the U.S. Department of Justice.

Guidelines During the Search
In the field, a grid should be constructed over the search area with transects of 1m. Next,
a basic all-metal detector or magnetic locator should be used to survey the area. While both tools
will detect most trash metals, the magnetic locator should ignore trash metal such as aluminum,
copper and brass. However, if the weapon in question is composed of brass or aluminum, then
an all-metal detector must be used. Also, although it is recommend that the tool be operated on a
High setting, too much interference from cultural objects or buried utilities in the vicinity may
restrict the use of a magnetic locator on the High setting. There should be one operator per
geophysical tool for the entire search, and it is a good idea to have someone assisting the
geophysical operator so they can place flags or markers on the ground to indicate the location of
the hits. The assistant should follow the geophysical operator along the grid transects. The
geophysical operator must swing the geophysical tool so there is overlapping coverage between
adjacent rows or transects for complete coverage of the search area. Once the geophysical
operator has a hit, the operator should discern the size and center of the hit by utilizing an X
pattern with a metal detector or magnetic locator. Once the center and size of the hit is
determined, the assistant should place a flag at the location of all hits with a plastic stake (metal
is not recommended as the detectors will hit on any metal in the search area) and designate the
hit as either slight or strong. If a large-sized hit is noted by the operator, multiple flags can be
placed in the ground delineating the size of the buried target. Once the survey is completed, the
operator needs to prioritize which anomalies to investigate further by excavating. It may be
possible for the operator to first rule out a number of hits based on the context of the site or
buried utilities. Producing a map of the site that indicates all of the features is invaluable at the
data interpretation phase when prioritizing anomalies for investigation.
- 105
This document is a research report submitted to the U.S. Department of Justice. This report has not been published by the Department. Opinions or points of view expressed are those of the author(s)
and do not necessarily reflect the official position or policies of the U.S. Department of Justice.

Conclusions
The controlled setting of this research allowed for consistent testing, providing
dependable results which can be easily replicated by investigators during real-world search
scenarios. A number of issues to consider when choosing which geophysical tool to use include
materials of the target, depth of the target, size of the target, size of the search area, and site
conditions. Clearly, these results show that when law enforcement is searching for a buried
metallic weapon, there are a number of options to choose from. The simplest, easiest, and
quickest options include an all-metal detector and a magnetic locator. When site conditions
allow, the search should incorporate a High setting to reach deeper depths. Even though these
detectors may be advertised as simple to use, training is still a must for all forensic personnel
involved in the search. Finally, when performing a search, a grid should be used in order to
ensure the coverage is adequate.
- 106
This document is a research report submitted to the U.S. Department of Justice. This report has not been published by the Department. Opinions or points of view expressed are those of the author(s)
and do not necessarily reflect the official position or policies of the U.S. Department of Justice.

CHAPTER 10: REFERENCES
Bass WM, Birkby WH. 1978. Exhumation: the method can make the difference. FBI Law Enforcement Bulletin 47:6-11.
Bevan BW. 1983. Electromagnetics for mapping buried earth features. Journal of Field Archaeology 10(1): 47-54.
Brady NC, Weil RR. 2002. The nature and properties of soil. Upper Saddle River: Prentice Hall.
Clark A. 1990. Seeing beneath the soil: prospecting methods in archaeology. London: B.T. Batsford.
Clay RB. 2005. Conductivity survey: A survival manual. Cultural Resource Analysts, Inc.
Connor M, Scott DD. 1998. Metal detector use in archaeology: an introduction. Historical Archaeology 32(4):76-85.
Davenport CG. 2001a. Remote sensing applications in forensic investigations. Historical Archaeology 35:87-100.
Davenport CG. 2001b. Where is it? Searching for buried bodies and hidden evidence. Church Hill: SportWork.
Davenport GC, France DL, Griffin TJ, Swanburg JG, Lindemann JW, Tranunell V, Armbrust CT, Kondrateiff B, Nelson A, Castellano K, and Hopkins D. 1992. A multidisciplinary approach to the detection of clandestine graves. Journal of Forensic Sciences 37(6):1445-1458.
Davenport GC, Griffin TJ, Lindermann JW, Heimmer D. 1990. Geoscientists and law enforcement professionals work together in Colorado. Geotimes 6:13-15.
Doolittle JA, Schellentrager G. 1989. Soil survey of Orange County, FL. United States Department of Agriculture, National Cooperative Soil Survey.
Dupras TL, Schultz JJ, Wheeler SM, Willimas LJ. 2006. Forensic recovery of human remains: archaeological approaches. Boca Raton: CRC Press.
Fisher Research Laboratory. n.d. Fisher m-scope M-97 valve, pedestal, and box locator: operating manual. Los Banos: Fisher Research Laboratory.
France DL, Griffin TJ, Swanburg JG, Lindemann JW, Davenport GC, Trammell V, et al. 1992. A multidisciplinary approach to the detection of clandestine graves. Journal of Forensic Sciences 37:1445-1458.
- 107
This document is a research report submitted to the U.S. Department of Justice. This report has not been published by the Department. Opinions or points of view expressed are those of the author(s)
and do not necessarily reflect the official position or policies of the U.S. Department of Justice.
France DL, Griffin TJ, Swanburg JG, Lindemann JW, Davenport GC, Trammell V, et al. 1997. NecroSearch revisited: further multidisciplinary approaches to the detection of clandestine graves. In: Haglund WD, Sorg MH, editors. Forensic taphonomy: The postmortem fate of human remains. Boca Raton: CRC Press, p 497-509.
Freeland RS, Miller ML, Yoder RE, Koppenjan SK. 2003. Forensic applications of FM-CW and pulse radar. Journal of Environmental & Engineering Geophysics 8:97-103.
Gaffney C, Gater J. 2003. Revealing the buried past: geophysics for archaeologists. Stroud: Tempus Publishing Ltd.
Garrett CL. 1998. Modern metal detectors. Dallas: Ram Publishing.
Geonics Limited. 2006. EM38 ground conductivity meter operating manual. Mississauga, Canada.
Goddard KW. 1977. Crime scene investigation. Reston: Reston Publishing.
Hochrein MJ. 2002. An autopsy of the grave: Recognizing, collecting, and preserving forensic geotaphonomic evidence. In: Haglund WD, Sorg MH, editors. Advances in forensic
taphonomy: Method, theory, and archaeological perspectives. Boca Raton: CRC Press, p 4570.
Hunter J and Cox M. 2005. Forensic archaeology: advances in theory and practice. London: Routledge.
Instanes A, Lønne A, Sandaker K. 2004. Location of avalanche victims with ground-penetrating radar. Applied Geophysics 38:55-61.
Isaacson J, Hollinger RE, Gundrum D, Baird J. 1999. A controlled test site facility in Illinois: training and research in archaeogeophysics. Journal of Field Archaeology 26(2):227-236.
Killam EW. 2004. The detection of human remains, 2nd edition. Springfield, IL: Charles C. Thomas.
Mellett JS. 1992. Location of human remains with ground-penetrating radar. In: Hanninen P, Autio S, editors. Fourth International Conference on Ground Penetrating Radar June 8-13. Rovaniemi, Finland: Geological Survey of Finland, Special Paper 16:359-65.
Minelab Electronics Pty Limited. N.d. Minelab Explorer II, revision 1.0. Torrensville, Australia.
Murray RC. 2004. Evidence from the earth: forensic geology and criminal investigation. Missoula: Mountain Press Publishing.
- 108
This document is a research report submitted to the U.S. Department of Justice. This report has not been published by the Department. Opinions or points of view expressed are those of the author(s)
and do not necessarily reflect the official position or policies of the U.S. Department of Justice.

Murray RC, Tedrow JCF. 1975. Forensic geology: earth sciences and criminal investigation. New Brunswick: Rutgers University Press.
Nelson CV. 2004. Metal detection and classification technologies. Johns Hopkins APL Technical Digest 25(1):62-67.
Nickell J, Fischer JF. 1999. Crime scene methods of forensic detection. Lexington: The University Press of Kentucky.
Nielsen E. 2003. Metal detectors at the crime scene. Law and Order 51(12):78-81.
Nobes DC. 2000. The search for “Yvonne”: a case example of the delineation of a grave using near-surface geophysical methods. J Forensic Sciences 45:715-721.
Pye K, Croft DJ. 2004. Forensic geoscience: principles, techniques, and applications. London: Geological Society Special Publications.
Reynolds JM. 1997. An introduction to applied and environmental geophysics. New York: John Willey and Sons, Inc.
Rowlands A, Sarris A. 2007. Detection of exposed and subsurface archaeological remains using multi-sensor remote sensing. Journal of Archaeological Science 34:795-803.
Ruffell A. 2005. Searching for the IRA “disappeared”: ground-penetrating radar investigation of a churchyard burial site, Northern Ireland. Journal of Forensic Science 50:1430-1435.
Ruffel A, McKinley J. 2005. Forensic geoscience: applications of geology, geomorphology, and geophysics to criminal investigations. Earth-Science Reviews 69:235-247
Schonstedt Instrument Company. 1998. Instruction manual: model GA-72Cd magnetic locator. Kearneysville, WV: Schonstedt Instrument Company.
Schultz JJ. 2003. Detecting buried remains in Florida using ground-penetrating radar [dissertation]. Gainesville (FL): Univ. of Florida.
Schultz JJ, Collins ME, Falsetti AB. 2006. Sequential monitoring of burials containing large pig cadavers using ground penetrating radar. Journal of Forensic Sciences 51:607-616.
Schultz JJ. 2007. Using ground-penetrating radar to locate clandestine graves of homicide victims: forming forensic archaeology partnerships with law enforcement. Homicide Studies 11(11):15-29.
Schultz JJ. 2008. Sequential Monitoring of Burials Containing Small Pig Cadavers Using Ground Penetrating Radar. Journal of Forensic Sciences 53:279-287.
- 109
This document is a research report submitted to the U.S. Department of Justice. This report has not been published by the Department. Opinions or points of view expressed are those of the author(s)
and do not necessarily reflect the official position or policies of the U.S. Department of Justice.

Schurr MR. 1997. Using the concept of the learning curve to increase productivity of geophysical surveys. Archaeological Prospection 4(2):69-83.
Scott DD, Fox RA, Jr. 1987. Archaeological insights into the Custer battle: an assessment of the 1984 field season. Norman: University of Oklahoma Press.
Scott DD, Fox RA, Jr., Connor MA, and Harmon, D. 1989. Archaeological perspectives on the Battle of Little Bighorn. Norman: University of Oklahoma Press.
Sharma PV. 1997. Environmental and engineering geophysics. New York: Cambridge University Press.
Sonderman RC. 2001. Looking for a needle in a haystack: developing closer relationships between law enforcement specialists and archaeology. Historical Archaeology 35(1):70-78.
Ward GH. 1990. Geotechnical and environmental geophysics. Tulsa: Society of Exploration Geophysicists.
Wynn JC. 1986. A review of geophysical methods used in archaeology. Geoarchaeology: An International Journal 1(3):245-257.
- 110
This document is a research report submitted to the U.S. Department of Justice. This report has not been published by the Department. Opinions or points of view expressed are those of the author(s)
and do not necessarily reflect the official position or policies of the U.S. Department of Justice.

APPENDIX A
Conductivity Maps
- 111
This document is a research report submitted to the U.S. Department of Justice. This report has not been published by the Department. Opinions or points of view expressed are those of the author(s)
and do not necessarily reflect the official position or policies of the U.S. Department of Justice.

Figure A-1. Conductivity map with weapons buried between 5-10cm and mapped with 25cm transects.
- 112
This document is a research report submitted to the U.S. Department of Justice. This report has not been published by the Department. Opinions or points of view expressed are those of the author(s)
and do not necessarily reflect the official position or policies of the U.S. Department of Justice.
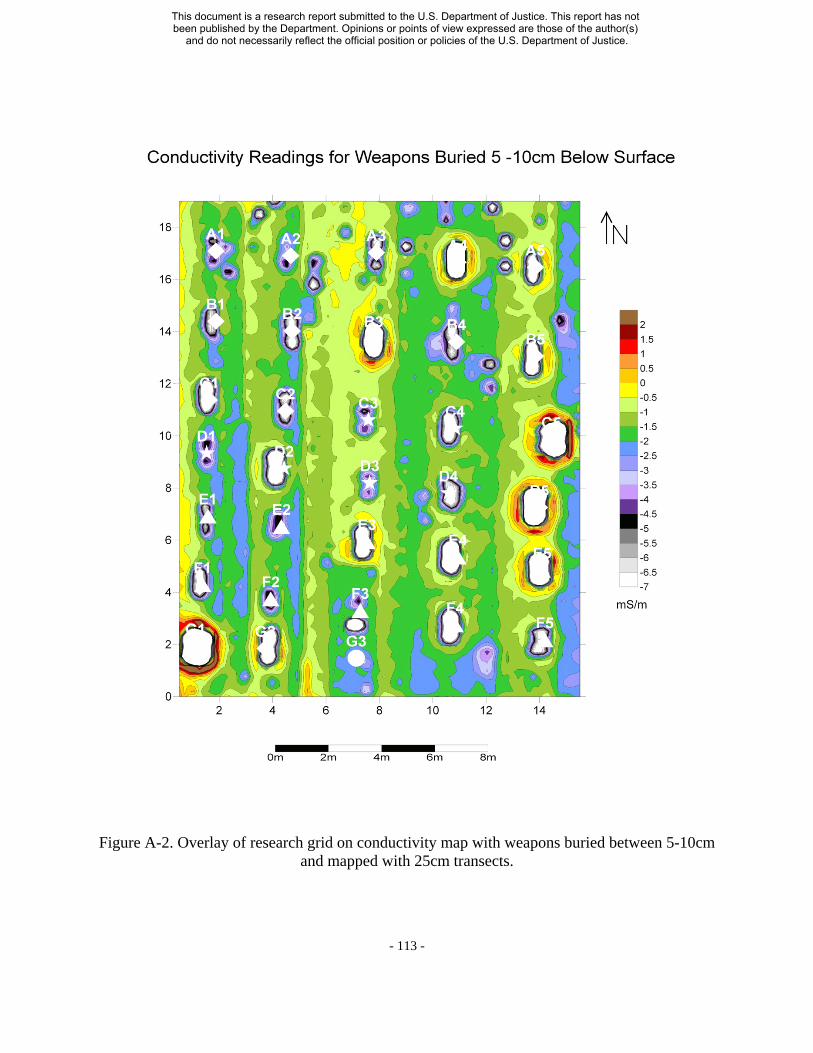
Figure A-2. Overlay of research grid on conductivity map with weapons buried between 5-10cm and mapped with 25cm transects.
- 113
This document is a research report submitted to the U.S. Department of Justice. This report has not been published by the Department. Opinions or points of view expressed are those of the author(s)
and do not necessarily reflect the official position or policies of the U.S. Department of Justice.

Figure A-3. Conductivity map with weapons buried between 5-10cm and mapped with 50cm transects.
- 114
This document is a research report submitted to the U.S. Department of Justice. This report has not been published by the Department. Opinions or points of view expressed are those of the author(s)
and do not necessarily reflect the official position or policies of the U.S. Department of Justice.

Figure A-4. Overlay of research grid on conductivity map with weapons buried between 5-10cm and mapped with 50cm transects.
- 115
This document is a research report submitted to the U.S. Department of Justice. This report has not been published by the Department. Opinions or points of view expressed are those of the author(s)
and do not necessarily reflect the official position or policies of the U.S. Department of Justice.

Figure A-5. Conductivity map with weapons buried between 10-15cm and mapped with 25cm transects.
- 116
This document is a research report submitted to the U.S. Department of Justice. This report has not been published by the Department. Opinions or points of view expressed are those of the author(s)
and do not necessarily reflect the official position or policies of the U.S. Department of Justice.

Figure A-6. Overlay of research grid on conductivity map with weapons buried between 1015cm and mapped with 25cm transects.
- 117
This document is a research report submitted to the U.S. Department of Justice. This report has not been published by the Department. Opinions or points of view expressed are those of the author(s)
and do not necessarily reflect the official position or policies of the U.S. Department of Justice.

Figure A-7. Conductivity map with weapons buried between 10-15cm and mapped with 50cm transects.
- 118
This document is a research report submitted to the U.S. Department of Justice. This report has not been published by the Department. Opinions or points of view expressed are those of the author(s)
and do not necessarily reflect the official position or policies of the U.S. Department of Justice.

Figure A-8. Overlay of research grid on conductivity map with weapons buried between 1015cm and mapped with 50cm transects.
- 119
This document is a research report submitted to the U.S. Department of Justice. This report has not been published by the Department. Opinions or points of view expressed are those of the author(s)
and do not necessarily reflect the official position or policies of the U.S. Department of Justice.
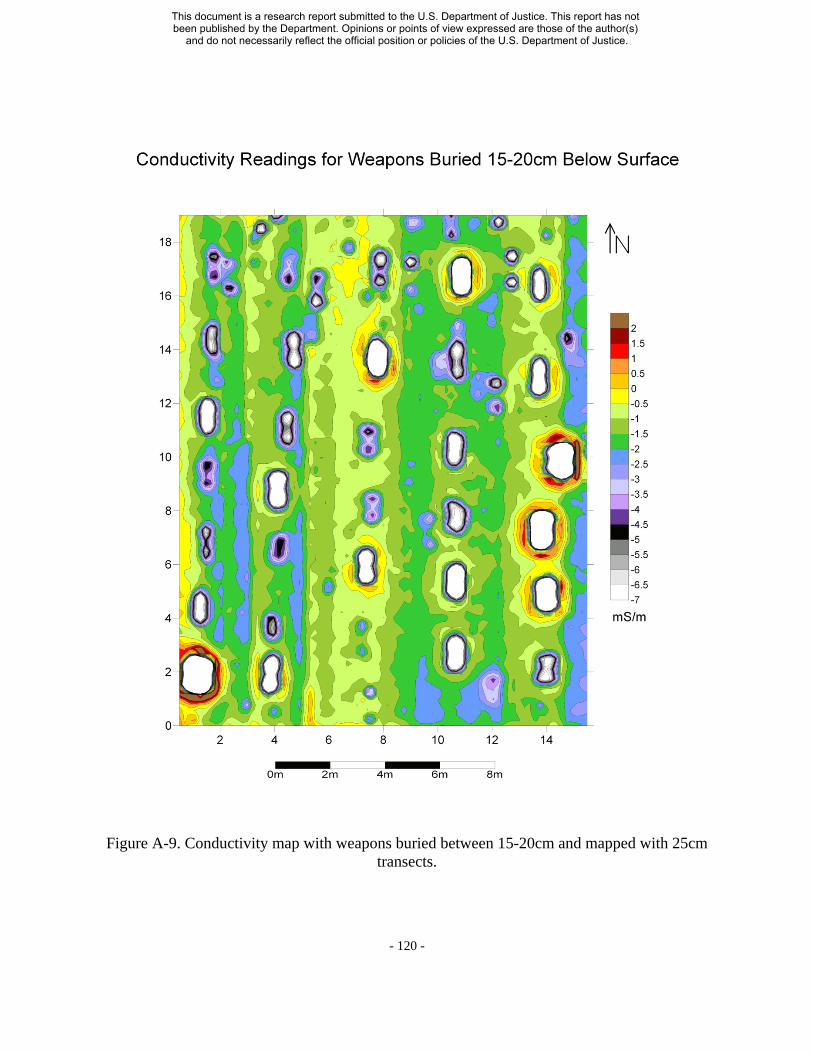
Figure A-9. Conductivity map with weapons buried between 15-20cm and mapped with 25cm transects.
- 120
This document is a research report submitted to the U.S. Department of Justice. This report has not been published by the Department. Opinions or points of view expressed are those of the author(s)
and do not necessarily reflect the official position or policies of the U.S. Department of Justice.

Figure A-10. Overlay of research grid on conductivity map with weapons buried between 1520cm and mapped with 25cm transects.
- 121
This document is a research report submitted to the U.S. Department of Justice. This report has not been published by the Department. Opinions or points of view expressed are those of the author(s)
and do not necessarily reflect the official position or policies of the U.S. Department of Justice.

Figure A-11. Conductivity map with weapons buried between 15-20cm and mapped with 50cm transects.
- 122
This document is a research report submitted to the U.S. Department of Justice. This report has not been published by the Department. Opinions or points of view expressed are those of the author(s)
and do not necessarily reflect the official position or policies of the U.S. Department of Justice.

Figure A-12. Overlay of research grid on conductivity map with weapons buried between 1520cm and mapped with 50cm transects.
- 123
This document is a research report submitted to the U.S. Department of Justice. This report has not been published by the Department. Opinions or points of view expressed are those of the author(s)
and do not necessarily reflect the official position or policies of the U.S. Department of Justice.
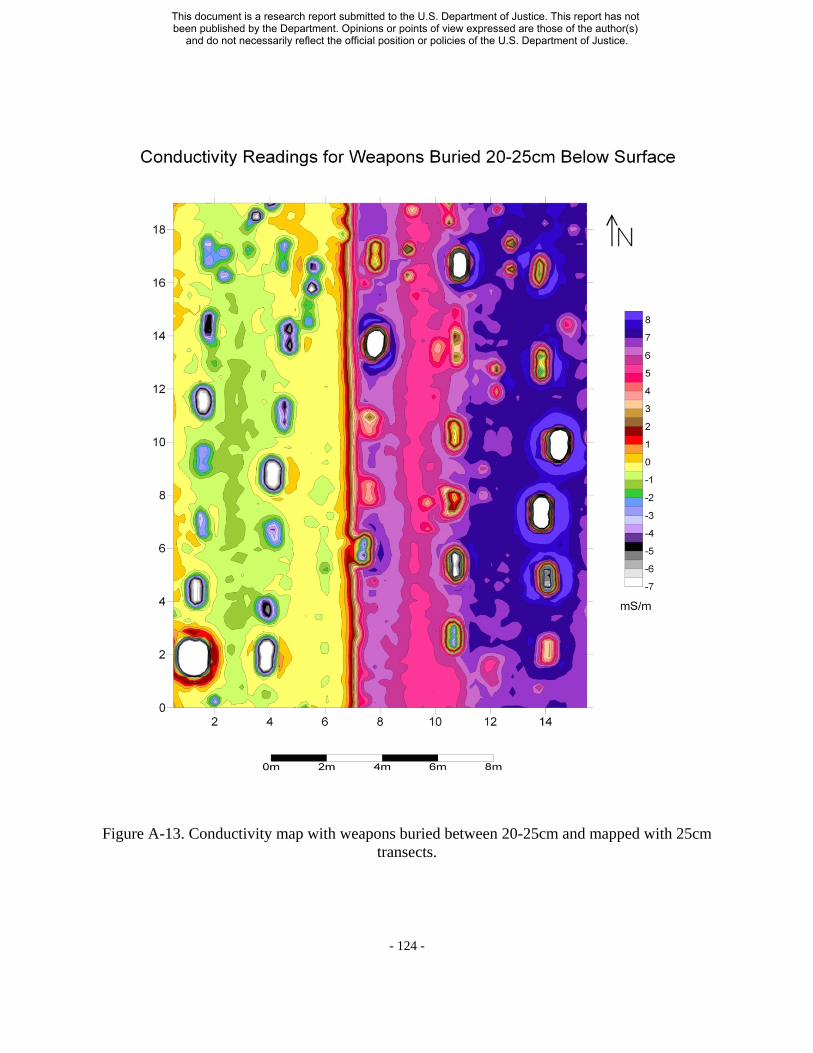
Figure A-13. Conductivity map with weapons buried between 20-25cm and mapped with 25cm transects.
- 124
This document is a research report submitted to the U.S. Department of Justice. This report has not been published by the Department. Opinions or points of view expressed are those of the author(s)
and do not necessarily reflect the official position or policies of the U.S. Department of Justice.

Figure A-14. Overlay of research grid on conductivity map with weapons buried between 2025cm and mapped with 25cm transects.
- 125
This document is a research report submitted to the U.S. Department of Justice. This report has not been published by the Department. Opinions or points of view expressed are those of the author(s)
and do not necessarily reflect the official position or policies of the U.S. Department of Justice.

Figure A-15. Conductivity map with weapons buried between 20-25cm and mapped with 50cm transects.
- 126
This document is a research report submitted to the U.S. Department of Justice. This report has not been published by the Department. Opinions or points of view expressed are those of the author(s)
and do not necessarily reflect the official position or policies of the U.S. Department of Justice.

Figure A-16. Overlay of research grid on conductivity map with weapons buried between 2025cm and mapped with 50cm transects.
- 127
This document is a research report submitted to the U.S. Department of Justice. This report has not been published by the Department. Opinions or points of view expressed are those of the author(s)
and do not necessarily reflect the official position or policies of the U.S. Department of Justice.
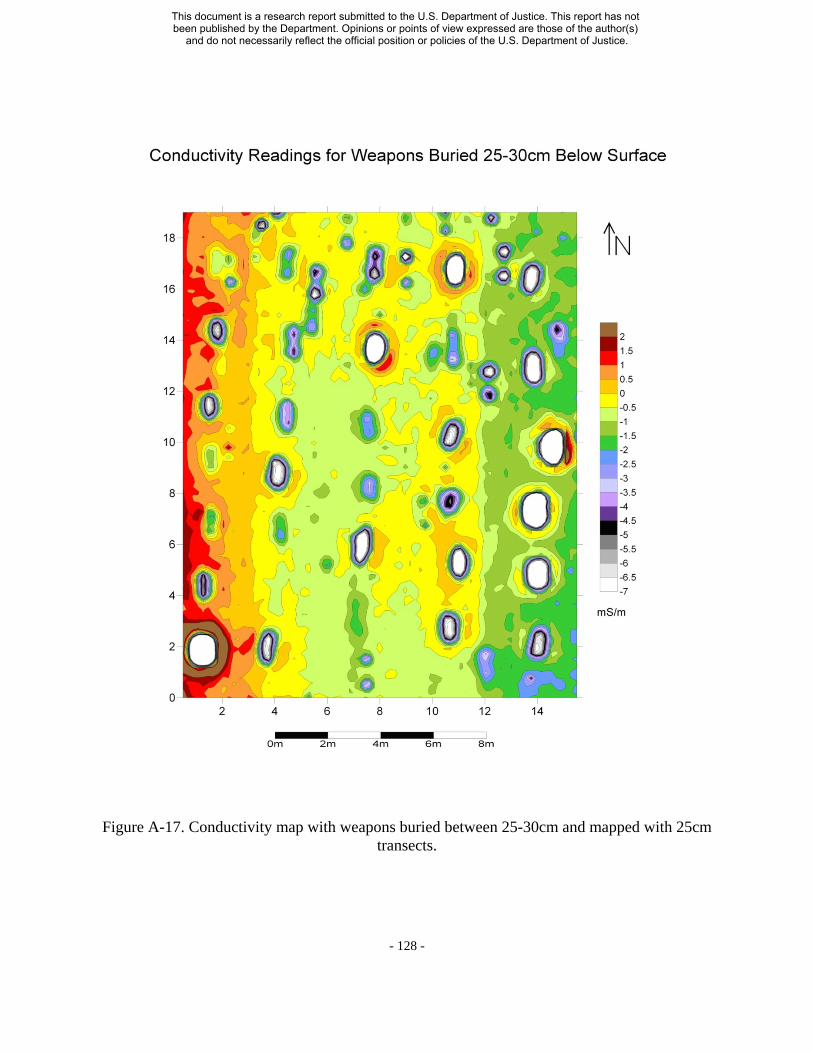
Figure A-17. Conductivity map with weapons buried between 25-30cm and mapped with 25cm transects.
- 128
This document is a research report submitted to the U.S. Department of Justice. This report has not been published by the Department. Opinions or points of view expressed are those of the author(s)
and do not necessarily reflect the official position or policies of the U.S. Department of Justice.

Figure A-18. Overlay of research grid on conductivity map with weapons buried between 2530cm and mapped with 25cm transects.
- 129
This document is a research report submitted to the U.S. Department of Justice. This report has not been published by the Department. Opinions or points of view expressed are those of the author(s)
and do not necessarily reflect the official position or policies of the U.S. Department of Justice.

Figure A-19. Conductivity map with weapons buried between 25-30cm and mapped with 50cm transects.
- 130
This document is a research report submitted to the U.S. Department of Justice. This report has not been published by the Department. Opinions or points of view expressed are those of the author(s)
and do not necessarily reflect the official position or policies of the U.S. Department of Justice.

Figure A-20. Overlay of research grid on conductivity map with weapons buried between 2530cm and mapped with 50cm transects.
- 131
This document is a research report submitted to the U.S. Department of Justice. This report has not been published by the Department. Opinions or points of view expressed are those of the author(s)
and do not necessarily reflect the official position or policies of the U.S. Department of Justice.

Figure A-21. Conductivity map with weapons buried between 30-35cm and mapped with 25cm transects.
- 132
This document is a research report submitted to the U.S. Department of Justice. This report has not been published by the Department. Opinions or points of view expressed are those of the author(s)
and do not necessarily reflect the official position or policies of the U.S. Department of Justice.

Figure A-22. Overlay of research grid on conductivity map with weapons buried between 3035cm and mapped with 25cm transects.
- 133
This document is a research report submitted to the U.S. Department of Justice. This report has not been published by the Department. Opinions or points of view expressed are those of the author(s)
and do not necessarily reflect the official position or policies of the U.S. Department of Justice.
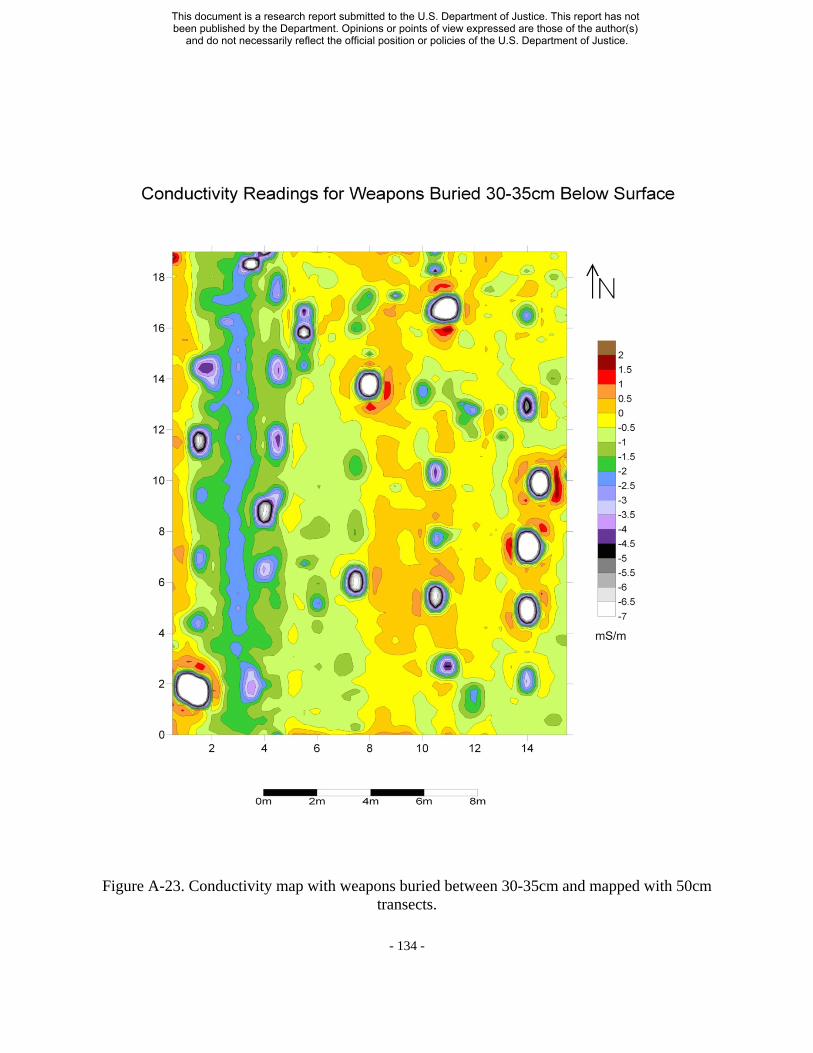
Figure A-23. Conductivity map with weapons buried between 30-35cm and mapped with 50cm transects.
- 134
This document is a research report submitted to the U.S. Department of Justice. This report has not been published by the Department. Opinions or points of view expressed are those of the author(s)
and do not necessarily reflect the official position or policies of the U.S. Department of Justice.
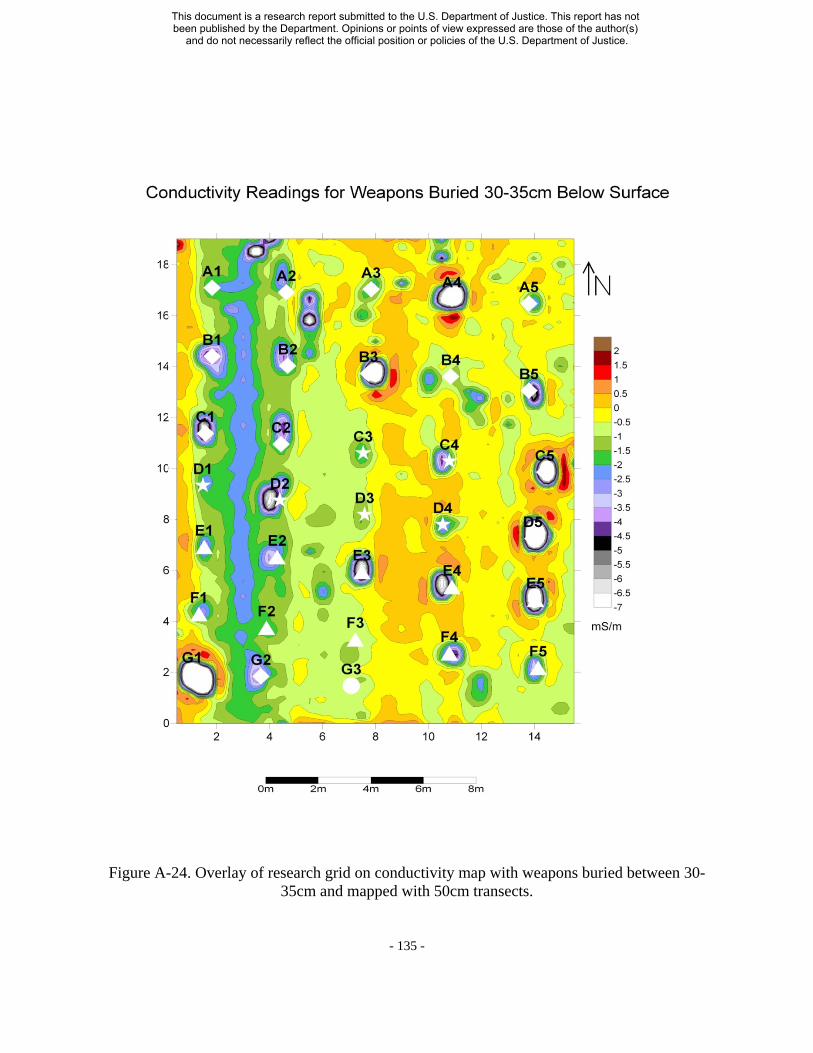
Figure A-24. Overlay of research grid on conductivity map with weapons buried between 3035cm and mapped with 50cm transects.
- 135
This document is a research report submitted to the U.S. Department of Justice. This report has not been published by the Department. Opinions or points of view expressed are those of the author(s)
and do not necessarily reflect the official position or policies of the U.S. Department of Justice.

Figure A-25. Conductivity map with weapons buried between 35-40cm and mapped with 25cm transects.
- 136
This document is a research report submitted to the U.S. Department of Justice. This report has not been published by the Department. Opinions or points of view expressed are those of the author(s)
and do not necessarily reflect the official position or policies of the U.S. Department of Justice.

Figure A-26. Overlay of research grid on conductivity map with weapons buried between 3540cm and mapped with 25cm transects.
- 137
This document is a research report submitted to the U.S. Department of Justice. This report has not been published by the Department. Opinions or points of view expressed are those of the author(s)
and do not necessarily reflect the official position or policies of the U.S. Department of Justice.

Figure A-27. Conductivity map with weapons buried between 35-40cm and mapped with 50cm transects.
- 138
This document is a research report submitted to the U.S. Department of Justice. This report has not been published by the Department. Opinions or points of view expressed are those of the author(s)
and do not necessarily reflect the official position or policies of the U.S. Department of Justice.
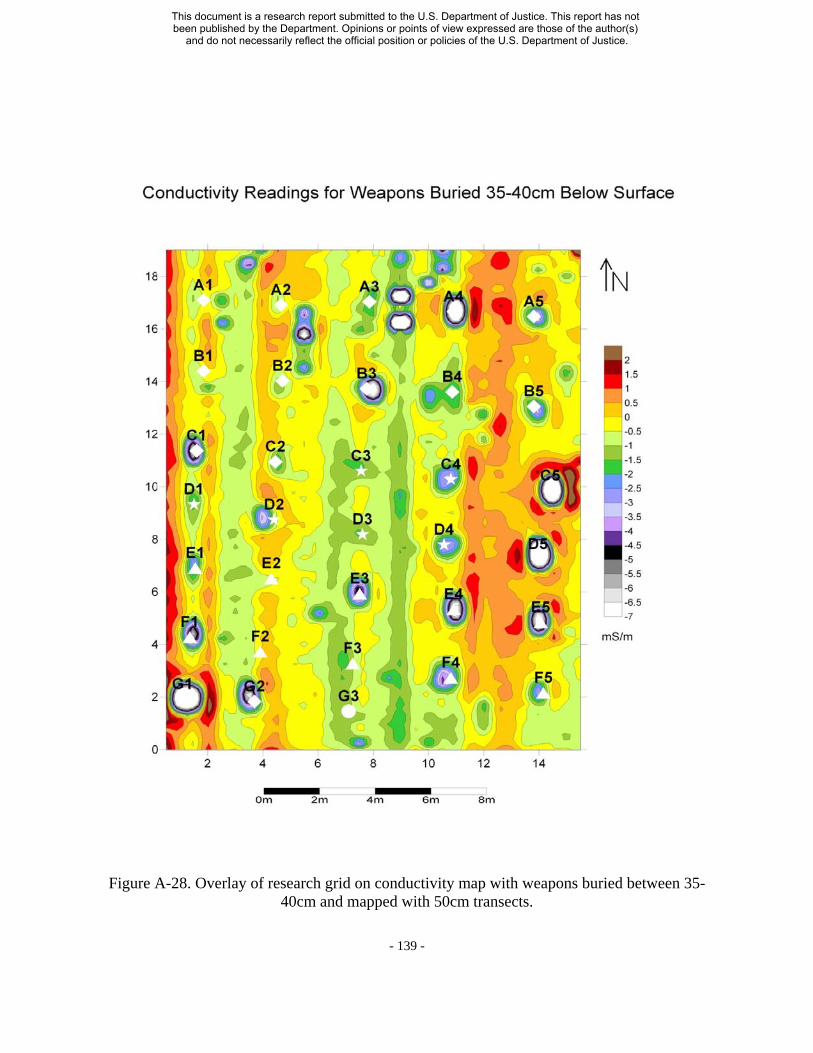
Figure A-28. Overlay of research grid on conductivity map with weapons buried between 3540cm and mapped with 50cm transects.
- 139
This document is a research report submitted to the U.S. Department of Justice. This report has not been published by the Department. Opinions or points of view expressed are those of the author(s)
and do not necessarily reflect the official position or policies of the U.S. Department of Justice.

Figure A-29. Conductivity map with weapons buried between 40-45cm and mapped with 25cm transects.
- 140
This document is a research report submitted to the U.S. Department of Justice. This report has not been published by the Department. Opinions or points of view expressed are those of the author(s)
and do not necessarily reflect the official position or policies of the U.S. Department of Justice.
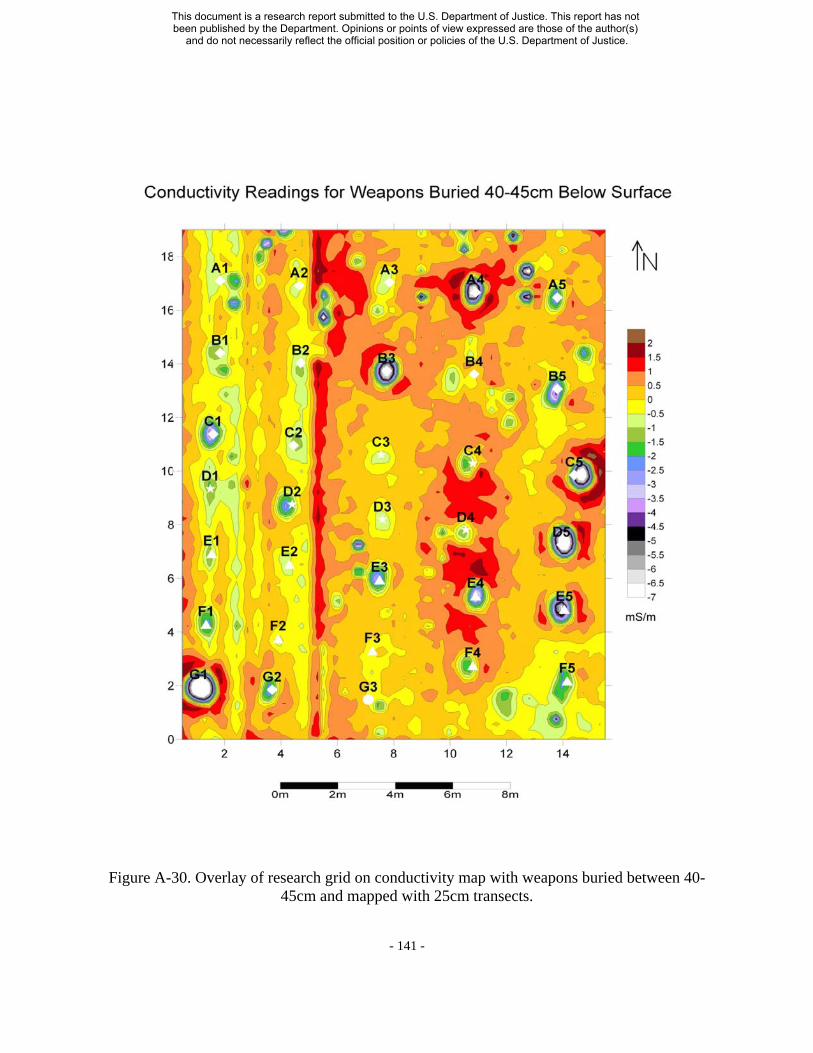
Figure A-30. Overlay of research grid on conductivity map with weapons buried between 4045cm and mapped with 25cm transects.
- 141
This document is a research report submitted to the U.S. Department of Justice. This report has not been published by the Department. Opinions or points of view expressed are those of the author(s)
and do not necessarily reflect the official position or policies of the U.S. Department of Justice.

Figure A-31. Conductivity map with weapons buried between 40-45cm and mapped with 50cm transects.
- 142
This document is a research report submitted to the U.S. Department of Justice. This report has not been published by the Department. Opinions or points of view expressed are those of the author(s)
and do not necessarily reflect the official position or policies of the U.S. Department of Justice.

Figure A-32. Overlay of research grid on conductivity map with weapons buried between 4045cm and mapped with 50cm transects.
- 143
This document is a research report submitted to the U.S. Department of Justice. This report has not been published by the Department. Opinions or points of view expressed are those of the author(s)
and do not necessarily reflect the official position or policies of the U.S. Department of Justice.

Figure A-33. Conductivity map with weapons buried between 45-50cm and mapped with 25cm transects.
- 144
This document is a research report submitted to the U.S. Department of Justice. This report has not been published by the Department. Opinions or points of view expressed are those of the author(s)
and do not necessarily reflect the official position or policies of the U.S. Department of Justice.
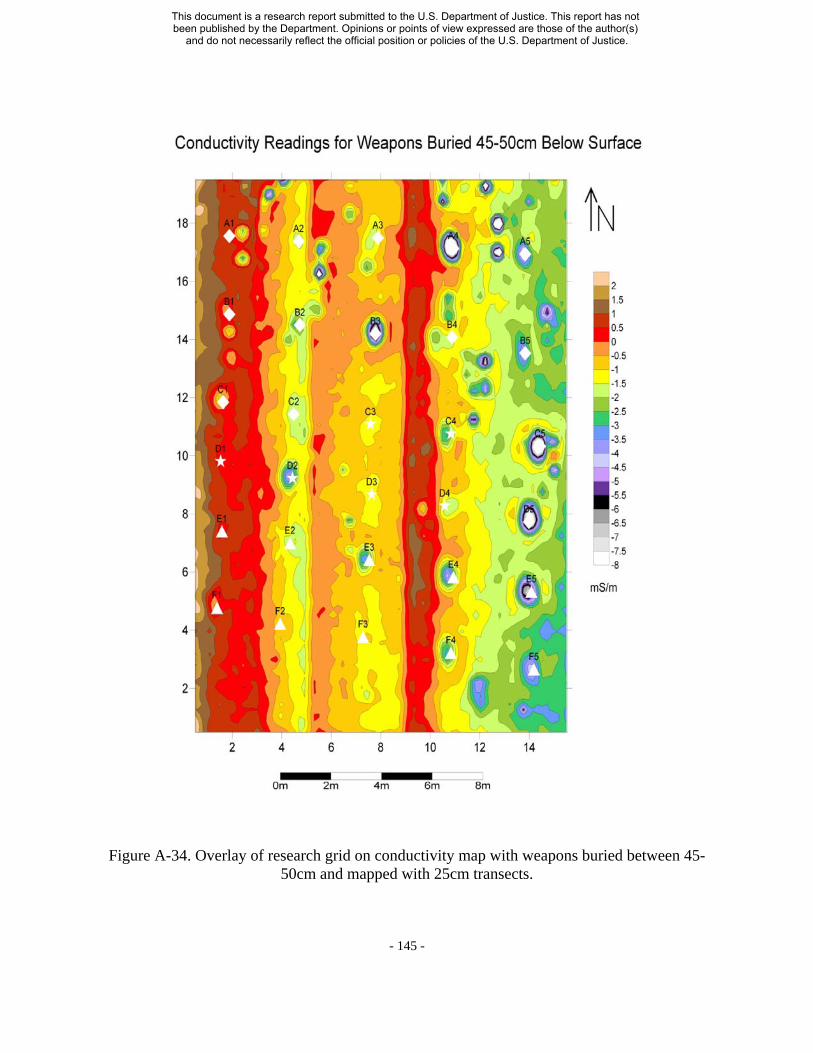
Figure A-34. Overlay of research grid on conductivity map with weapons buried between 4550cm and mapped with 25cm transects.
- 145
This document is a research report submitted to the U.S. Department of Justice. This report has not been published by the Department. Opinions or points of view expressed are those of the author(s)
and do not necessarily reflect the official position or policies of the U.S. Department of Justice.
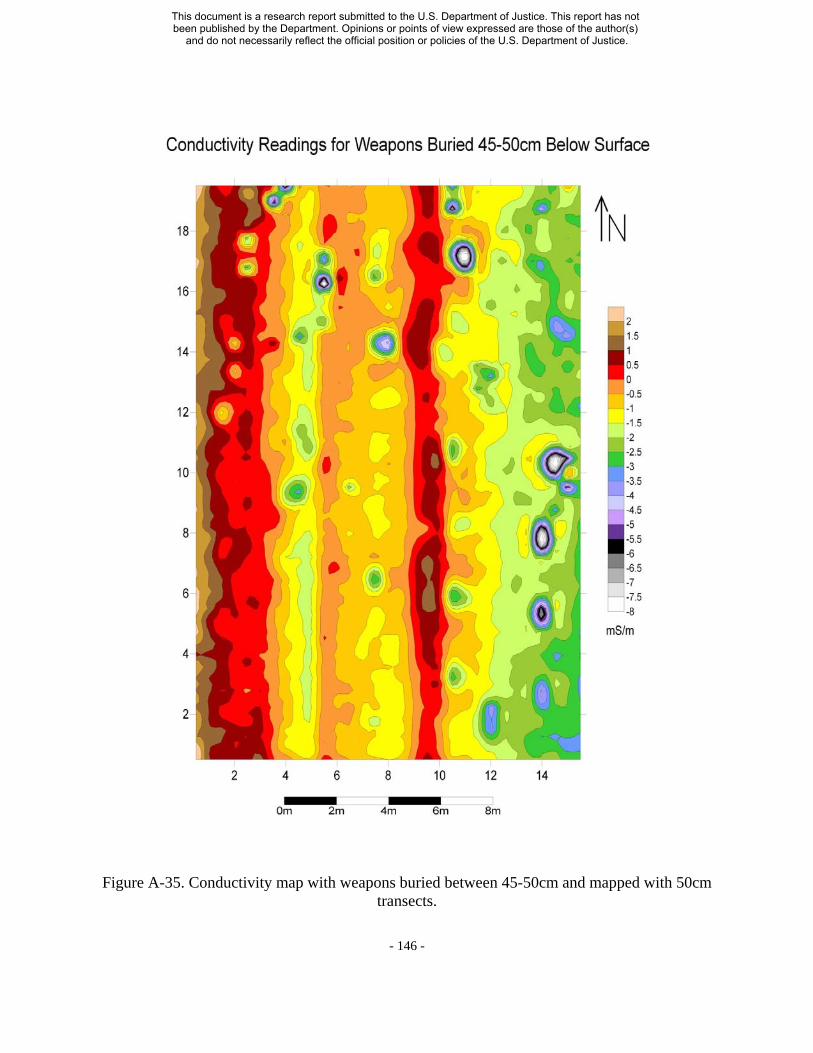
Figure A-35. Conductivity map with weapons buried between 45-50cm and mapped with 50cm transects.
- 146
This document is a research report submitted to the U.S. Department of Justice. This report has not been published by the Department. Opinions or points of view expressed are those of the author(s)
and do not necessarily reflect the official position or policies of the U.S. Department of Justice.

Figure A-36. Overlay of research grid on conductivity map with weapons buried between 4550cm and mapped with 50cm transects.
- 147
This document is a research report submitted to the U.S. Department of Justice. This report has not been published by the Department. Opinions or points of view expressed are those of the author(s)
and do not necessarily reflect the official position or policies of the U.S. Department of Justice.

Figure A-37. Conductivity map with weapons buried between 50-55cm and mapped with 25cm transects.
- 148
This document is a research report submitted to the U.S. Department of Justice. This report has not been published by the Department. Opinions or points of view expressed are those of the author(s)
and do not necessarily reflect the official position or policies of the U.S. Department of Justice.

Figure A-38. Overlay of research grid on conductivity map with weapons buried between 5055cm and mapped with 25cm transects.
- 149
This document is a research report submitted to the U.S. Department of Justice. This report has not been published by the Department. Opinions or points of view expressed are those of the author(s)
and do not necessarily reflect the official position or policies of the U.S. Department of Justice.
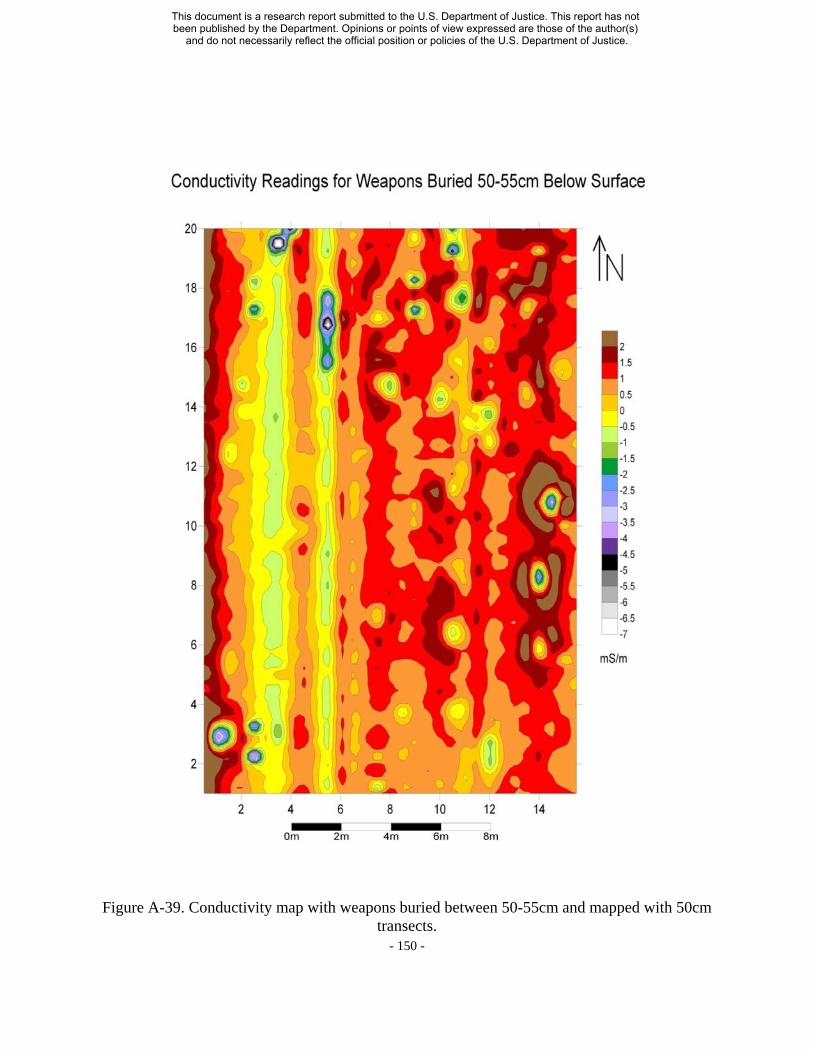
Figure A-39. Conductivity map with weapons buried between 50-55cm and mapped with 50cmtransects.
- 150
This document is a research report submitted to the U.S. Department of Justice. This report has not been published by the Department. Opinions or points of view expressed are those of the author(s)
and do not necessarily reflect the official position or policies of the U.S. Department of Justice.

Figure A-40. Overlay of research grid on conductivity map with weapons buried between 5055cm and mapped with 50cm transects.
- 151
This document is a research report submitted to the U.S. Department of Justice. This report has not been published by the Department. Opinions or points of view expressed are those of the author(s)
and do not necessarily reflect the official position or policies of the U.S. Department of Justice.
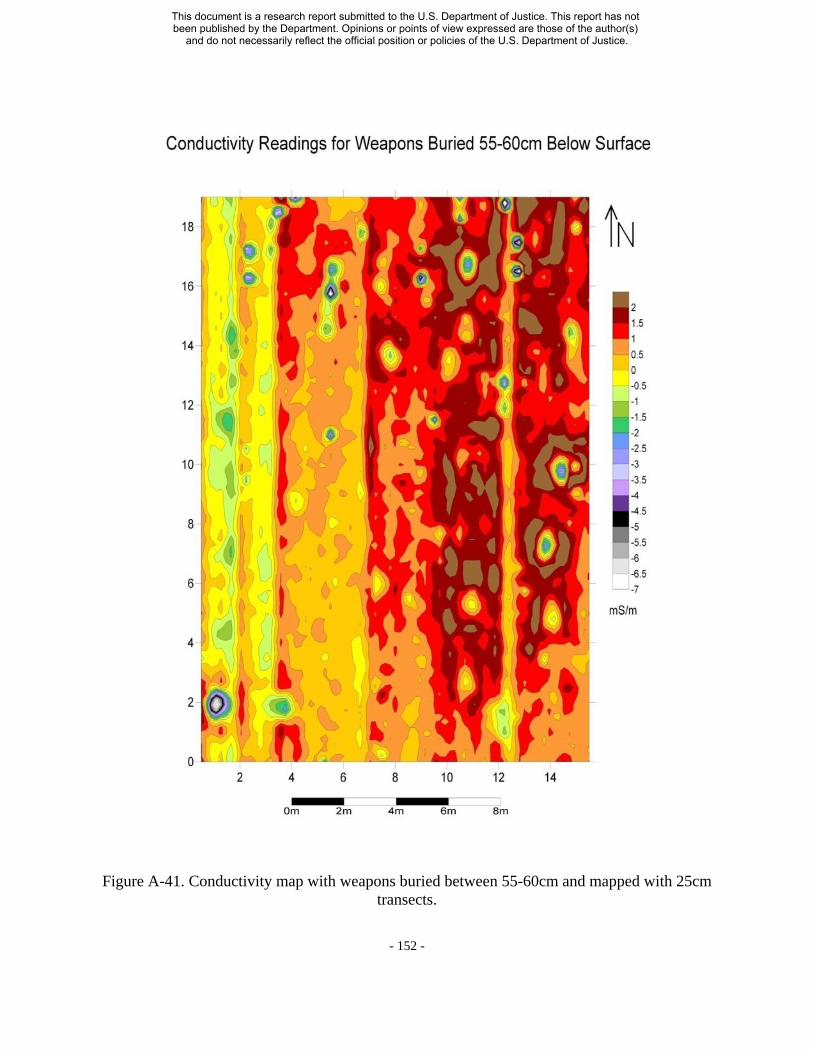
Figure A-41. Conductivity map with weapons buried between 55-60cm and mapped with 25cm transects.
- 152
This document is a research report submitted to the U.S. Department of Justice. This report has not been published by the Department. Opinions or points of view expressed are those of the author(s)
and do not necessarily reflect the official position or policies of the U.S. Department of Justice.

Figure A-42. Overlay of research grid on conductivity map with weapons buried between 5560cm and mapped with 25cm transects.
- 153
This document is a research report submitted to the U.S. Department of Justice. This report has not been published by the Department. Opinions or points of view expressed are those of the author(s)
and do not necessarily reflect the official position or policies of the U.S. Department of Justice.

Figure A-43. Conductivity map with weapons buried between 55-60cm and mapped with 50cmtransects.
- 154
This document is a research report submitted to the U.S. Department of Justice. This report has not been published by the Department. Opinions or points of view expressed are those of the author(s)
and do not necessarily reflect the official position or policies of the U.S. Department of Justice.

Figure A-44. Overlay of research grid on conductivity map with weapons buried between 5560cm and mapped with 50cm transects.
- 155
This document is a research report submitted to the U.S. Department of Justice. This report has not been published by the Department. Opinions or points of view expressed are those of the author(s)
and do not necessarily reflect the official position or policies of the U.S. Department of Justice.

Figure A-45. Conductivity map with weapons buried between 60-65cm and mapped with 25cm transects.
- 156
This document is a research report submitted to the U.S. Department of Justice. This report has not been published by the Department. Opinions or points of view expressed are those of the author(s)
and do not necessarily reflect the official position or policies of the U.S. Department of Justice.

Figure A-46. Overlay of research grid on conductivity map with weapons buried between 6065cm and mapped with 25cm transects.
- 157
This document is a research report submitted to the U.S. Department of Justice. This report has not been published by the Department. Opinions or points of view expressed are those of the author(s)
and do not necessarily reflect the official position or policies of the U.S. Department of Justice.

Figure A-47. Conductivity map with weapons buried between 60-65cm and mapped with 50cm transects.
- 158
This document is a research report submitted to the U.S. Department of Justice. This report has not been published by the Department. Opinions or points of view expressed are those of the author(s)
and do not necessarily reflect the official position or policies of the U.S. Department of Justice.

Figure A-48. Overlay of research grid on conductivity map with weapons buried between 6065cm and mapped with 50cm transects.
- 159
This document is a research report submitted to the U.S. Department of Justice. This report has not been published by the Department. Opinions or points of view expressed are those of the author(s)
and do not necessarily reflect the official position or policies of the U.S. Department of Justice.

Figure A-49. Conductivity map with weapons buried between 65-70cm and mapped with 25cm transects.
- 160
This document is a research report submitted to the U.S. Department of Justice. This report has not been published by the Department. Opinions or points of view expressed are those of the author(s)
and do not necessarily reflect the official position or policies of the U.S. Department of Justice.

Figure A-50. Overlay of research grid on conductivity map with weapons buried between 6570cm and mapped with 25cm transects.
- 161
This document is a research report submitted to the U.S. Department of Justice. This report has not been published by the Department. Opinions or points of view expressed are those of the author(s)
and do not necessarily reflect the official position or policies of the U.S. Department of Justice.

Figure A-51. Conductivity map with weapons buried between 65-70cm and mapped with 50cmtransects.
- 162
This document is a research report submitted to the U.S. Department of Justice. This report has not been published by the Department. Opinions or points of view expressed are those of the author(s)
and do not necessarily reflect the official position or policies of the U.S. Department of Justice.

Figure A-52. Overlay of research grid on conductivity map with weapons buried between 6570cm and mapped with 50cm transects.
- 163
This document is a research report submitted to the U.S. Department of Justice. This report has not been published by the Department. Opinions or points of view expressed are those of the author(s)
and do not necessarily reflect the official position or policies of the U.S. Department of Justice.

Figure A-53. Conductivity map with weapons buried between 70-75cm and mapped with 25cmtransects.
- 164
This document is a research report submitted to the U.S. Department of Justice. This report has not been published by the Department. Opinions or points of view expressed are those of the author(s)
and do not necessarily reflect the official position or policies of the U.S. Department of Justice.

Figure A-54. Overlay of research grid on conductivity map with weapons buried between 7075cm and mapped with 25cm transects.
- 165
This document is a research report submitted to the U.S. Department of Justice. This report has not been published by the Department. Opinions or points of view expressed are those of the author(s)
and do not necessarily reflect the official position or policies of the U.S. Department of Justice.

Figure A-55. Conductivity map with weapons buried between 70-75cm and mapped with 50cm transects.
- 166
This document is a research report submitted to the U.S. Department of Justice. This report has not been published by the Department. Opinions or points of view expressed are those of the author(s)
and do not necessarily reflect the official position or policies of the U.S. Department of Justice.

Figure A-56. Overlay of research grid on conductivity map with weapons buried between 7075cm and mapped with 50cm transects.
- 167
This document is a research report submitted to the U.S. Department of Justice. This report has not been published by the Department. Opinions or points of view expressed are those of the author(s)
and do not necessarily reflect the official position or policies of the U.S. Department of Justice.
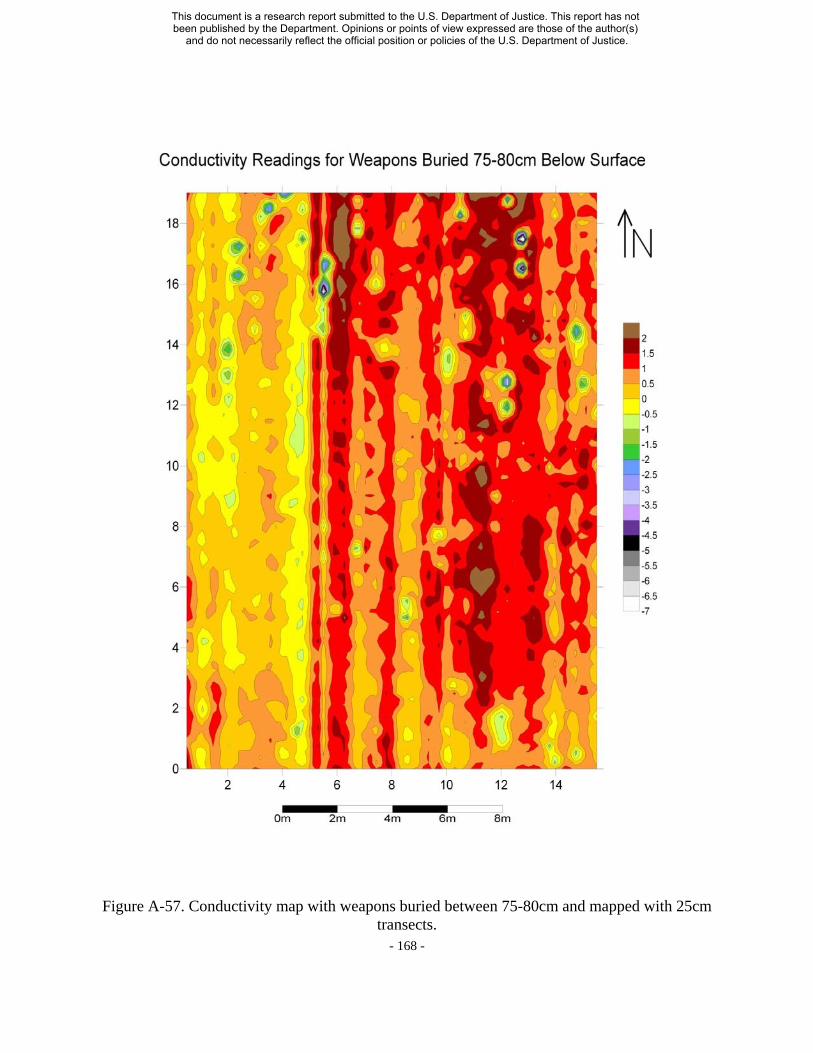
Figure A-57. Conductivity map with weapons buried between 75-80cm and mapped with 25cmtransects.
- 168
This document is a research report submitted to the U.S. Department of Justice. This report has not been published by the Department. Opinions or points of view expressed are those of the author(s)
and do not necessarily reflect the official position or policies of the U.S. Department of Justice.

Figure A-58. Overlay of research grid on conductivity map with weapons buried between 7580cm and mapped with 25cm transects.
- 169
This document is a research report submitted to the U.S. Department of Justice. This report has not been published by the Department. Opinions or points of view expressed are those of the author(s)
and do not necessarily reflect the official position or policies of the U.S. Department of Justice.

Figure A-59. Conductivity map with weapons buried between 75-80cm and mapped with 50cm transects.
- 170
This document is a research report submitted to the U.S. Department of Justice. This report has not been published by the Department. Opinions or points of view expressed are those of the author(s)
and do not necessarily reflect the official position or policies of the U.S. Department of Justice.

Figure A-60. Overlay of research grid on conductivity map with weapons buried between 7580cm and mapped with 50cm transects.
- 171
This document is a research report submitted to the U.S. Department of Justice. This report has not been published by the Department. Opinions or points of view expressed are those of the author(s)
and do not necessarily reflect the official position or policies of the U.S. Department of Justice.

APPENDIX B
GPR Radargrams
- 172
This document is a research report submitted to the U.S. Department of Justice. This report has not been published by the Department. Opinions or points of view expressed are those of the author(s)
and do not necessarily reflect the official position or policies of the U.S. Department of Justice.
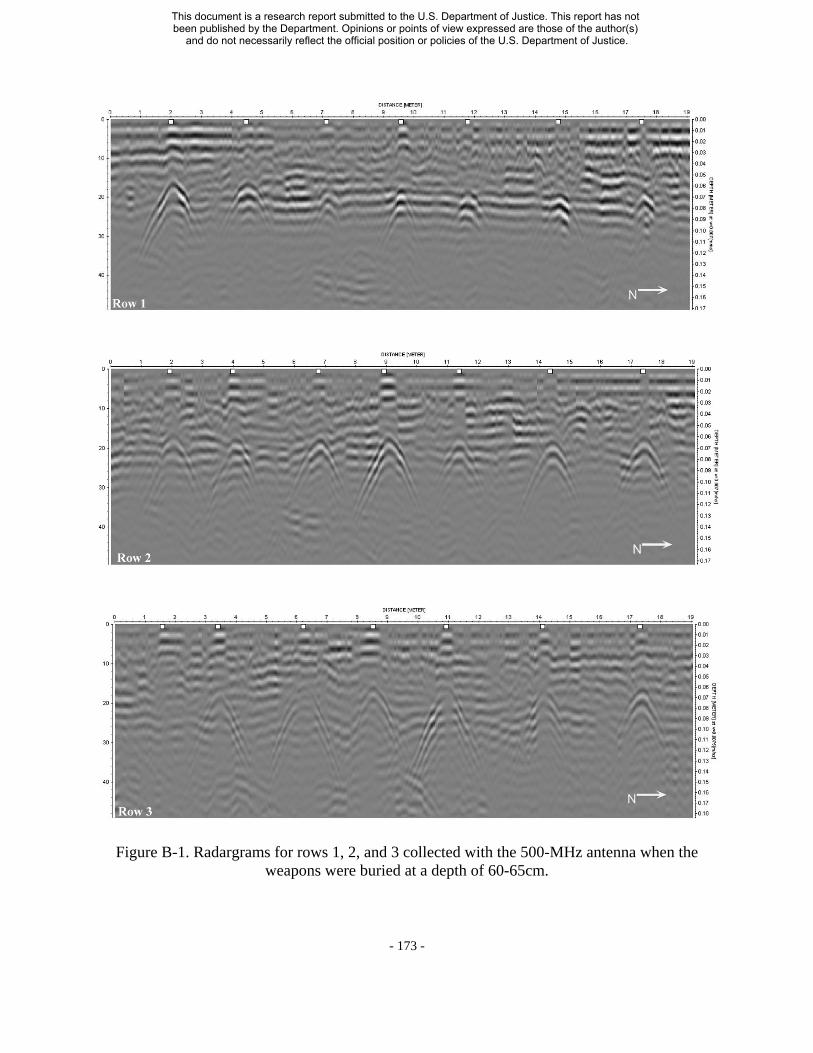
Figure B-1. Radargrams for rows 1, 2, and 3 collected with the 500-MHz antenna when the weapons were buried at a depth of 60-65cm.
- 173
This document is a research report submitted to the U.S. Department of Justice. This report has not been published by the Department. Opinions or points of view expressed are those of the author(s)
and do not necessarily reflect the official position or policies of the U.S. Department of Justice.

Figure B-1 continued. Radargrams for rows 4 and 5 collected with the 500-MHz antenna when the weapons were buried at a depth of 60-65cm.
- 174
This document is a research report submitted to the U.S. Department of Justice. This report has not been published by the Department. Opinions or points of view expressed are those of the author(s)
and do not necessarily reflect the official position or policies of the U.S. Department of Justice.

Figure B-2. Radargrams for rows 1, 2, and 3 collected with the 800-MHz antenna when the weapons were buried at a depth of 60-65cm.
- 175
This document is a research report submitted to the U.S. Department of Justice. This report has not been published by the Department. Opinions or points of view expressed are those of the author(s)
and do not necessarily reflect the official position or policies of the U.S. Department of Justice.

Figure B-2 continued. Radargrams for rows 4 and 5 collected with the 800-MHz antenna when the weapons were buried at a depth of 60-65cm.
- 176
This document is a research report submitted to the U.S. Department of Justice. This report has not been published by the Department. Opinions or points of view expressed are those of the author(s)
and do not necessarily reflect the official position or policies of the U.S. Department of Justice.