detailed measurements in an idealized and practical ... · 1998 international gas research...
TRANSCRIPT

1998 INTERNATIONAL GAS RESEARCH CONFERENCE 461
DETAILED MEASUREMENTS IN AN IDEALIZED AND A PRACTICALNATURAL GAS HOUSEHOLD BOILER
MESURES DETAILLEES DANS UN CHAUDIERE MODELE ET UNECHAUDIERE COMMERCIALE AU GAZ NATUREL
P.F. Miquel, N. Larass and M. PerrinDirection de la Recherche, Gaz de France, France
F. Lasagni and M. BeghiWorgas Bruciatori s.r.l., Italy
S. Hasko and M. FairweatherBG Technology, United Kingdom
G. Hargrave and G. SherwoodUniversity of Loughborough, United Kingdom
H. Levinsky, A.V. Mokhov and H. de VriesN.V. Nederlandse Gasunie, The Netherlands
J.P. Martin, J.C. Rolon, L. Brenez and P. ScouflaireCNRS-EM2C, Ecole Centrale Paris, France
D.I. Shin, G. Peiter, T Dreier and H.R. VolppPCI, University of Heidelberg, Germany
ABSTRACT
The results of an experimental study of the combustion processes in an idealized boiler are presented. Thisexperimental study was part of a project supported by the European Community (Brite-Euram III program)which aimed at developing tools for the design of clean and efficient household boilers. The idealized boilerwas designed with an optically accessible combustion chamber and independent controls of power input,primary and secondary aerations. Combustion processes were investigated by combined measurements oftemperature, velocity, mean species concentrations and radical concentrations using probe sampling andnon-intrusive optical techniques. Measurements were obtained for five different flame cases. Resultsfocused on understanding the pollutant formation mechanisms in these five flames. The work reported hererepresents one of the first comprehensive studies of combustion processes in a practical boiler.
RESUME
Cette publication présente les résultats de l’étude expérimentale des processus de combustion dans unechaudière domestique modèle. Cette étude expérimentale représente l’une des tâches d’un projet co-financé par la Communauté Européenne (programme Brite-Euram III) dont l’objectif est de développerdes outils d’aide à la conception de chaudières domestiques à haut rendement et faible émission depolluants. La chaudière modèle a été conçue avec une chambre de combustion optiquement accessibleet un contrôle indépendant de la puissance et des taux d’aération primaires et secondaires. Lesprocessus de combustion ont été étudiés par mesures combinées de température, de concentrationd’espèces chimiques stables et radicalaires, et de vitesses grace à des sondes de prélèvement et par destechniques optiques. Ces mesures ont été effectuées sur 5 cas-tests différents. Les résultats portentsur la compréhension des mécanismes de formation de polluants dans ces 5 cas-tests. Ces travauxreprésentent l’une des premières études des processus de combustion dans une chaudière domestique.
1998 INTERNATIONAL GAS RESEARCH CONFERENCE462
INTRODUCTION
Laminar premixed combustion has been widely studied by others as a basic combustionresearch problem (1-4). Nevertheless, up to now, few studies were devoted to laminar partiallypremixed flames with natural gas and operating conditions pertaining to practical devices (5,6). Thislack of basic knowledge is restraining the understanding of stabilization and pollutant emissionmechanisms in household boilers. This basic knowledge is required today to meet the increasinglystringent regulations on NOx emissions limits. For instance, although NOx emissions for most of thenatural gas powered household boilers sold in Europe are currently around 120 mg/kWh (7), theEuropean standards are moving towards lower limits, i.e., 50 mg/kWh.
Over the years, burner manufacturers have developed rules of thumb for choosingcombination of design parameters, such as primary fuel-air ratio, port loading, and port spacing, tomeet the approved specifications. However, this approach is a global one, where all measurementsare made at the input and output of the appliance. This often results in unwanted effects such as theincrease in CO emissions or decrease in flame stability which occur as NOx emissions are reduced.Since the formation of pollutants in combustion systems depends upon the details of the combustionprocess itself, insights into these details are required for proper design of the appliance.
In a project supported by the European Community in the framework of the Brite-Euram IIIprogram, detailed measurements in the combustion chamber of an idealized household boiler wereobtained. The objective was to understand, using advanced measurement techniques, how burneroperation affects combustion performance and how this understanding can be used for improvingboilers and burners. It was also to identify and develop measurement tools most adapted to boilerdesign aids. To that effect probe measurements were compared with measurements obtained usingnon-intrusive techniques. Finally, these detailed measurements were also used to provide anaccurate and reliable database for validating numerical models also developed in the framework ofthe project.
The idealized boiler was developed with the same characteristics as that of a commercialboiler but with a simplified 2-dimensional geometry. Global measurements in the exhaust of theboiler were obtained and compared with measurements performed in a commercial boiler. Fivedifferent flame regimes were also selected. For the five regimes temperature, velocity, chemicalspecies concentrations and flame emission measurements were obtained in the combustion chamberof the idealized boiler. Preliminary results are presented.
EXPERIMENTAL SETUP
Idealized Boiler and Operating ConditionsMost commercially available natural gas domestic boilers use laminar partially or totally
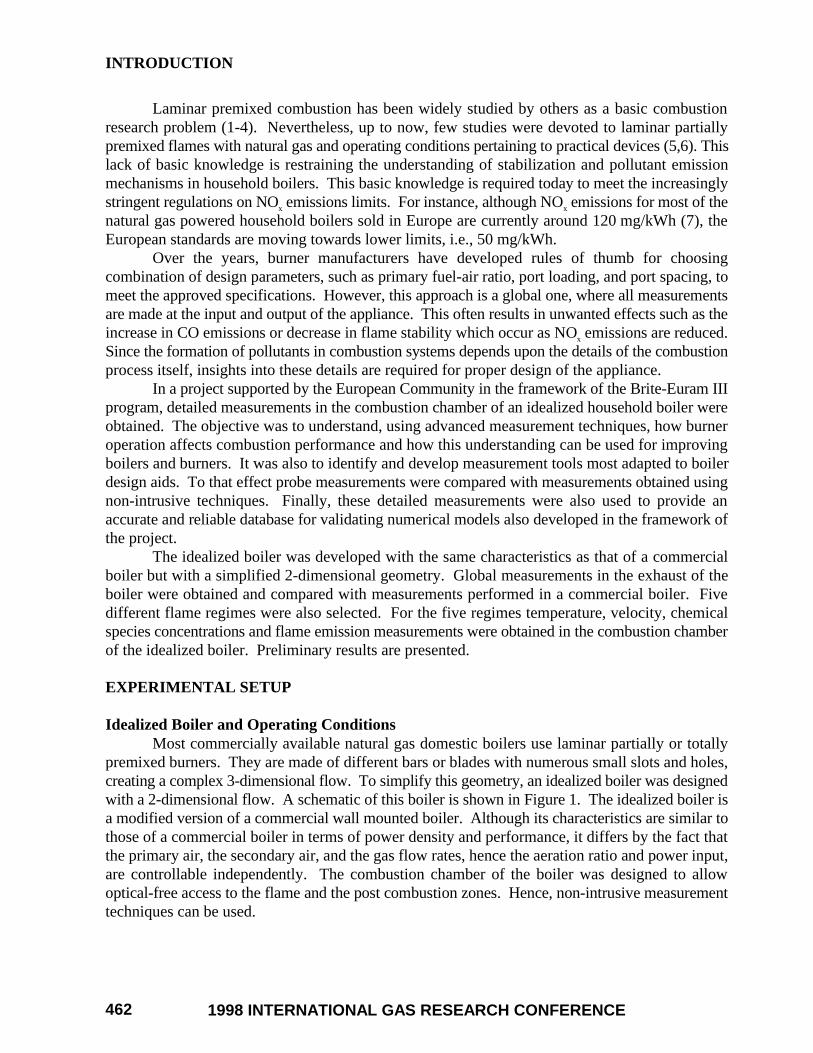
premixed burners. They are made of different bars or blades with numerous small slots and holes,creating a complex 3-dimensional flow. To simplify this geometry, an idealized boiler was designedwith a 2-dimensional flow. A schematic of this boiler is shown in Figure 1. The idealized boiler isa modified version of a commercial wall mounted boiler. Although its characteristics are similar tothose of a commercial boiler in terms of power density and performance, it differs by the fact thatthe primary air, the secondary air, and the gas flow rates, hence the aeration ratio and power input,are controllable independently. The combustion chamber of the boiler was designed to allowoptical-free access to the flame and the post combustion zones. Hence, non-intrusive measurementtechniques can be used.

1998 INTERNATIONAL GAS RESEARCH CONFERENCE 463
In the idealized boiler, thepremixed air/gas mixture enters througha laminarization tank. It is thenintroduced into the combustion chamberthrough 7 identical slots (also called"primary channels"). The primarychannels are filled with a bed of glassbeads, 2 mm in diameter, and severalfine stainless steel grids to ensure alaminar and uniform flow. The cross-section area of the primary channel atthe burner mouth is 150 mm long by3 mm wide. A secondary air stream isintroduced through the 8 correspondinginter-blade channels (called "secondarychannels"). A honeycomb structure anda stainless steel grid placed at thebottom of the boiler’s body also ensuresa uniform and laminar secondary airflow. The primary and secondary airflow rates and the gas flow rates arecontrolled by calibrated mass flowmeters.
The combustion chamber (150 x115 x 150 mm) is protected fromentrainment of surrounding air by 4 glass (Vycor) windows, held in place by 4 stainless steelmounts. A heat exchanger made of copper fins is placed on the top edges of the windows. This heatexchanger was designed to support a maximum load of 11 kW (Gross Calorific Value) withminimum pressure drop and to have an efficiency similar to that of commercial boilers. It wasoperated with an inlet water temperature of 60°C and an outlet water temperature of 65°C for allflame conditions investigated. A chimney is placed on top of the heat exchanger for flue gasesexhaust. The composition of the flue gases was measured with a probe consisting of a copper tubelocated at the top of the chimney.
The combustion chamber is characterized by the X, Y, and Z axis (see Figure 1). The X axisis the horizontal axis which runs across the burner slots. The location at X = 0 mm corresponds tothe center of the central slot. The slots being 16 mm apart, their centers are located at X = -48, -32,-16, 0, +16, +32, and +48 mm. The Y axis is the vertical axis (Y = 0 mm corresponds to the surfaceof the burner slot, and Y = 150 mm corresponds to the bottom of the heat exchanger). Last, the Zaxis is the horizontal axis that runs along the burner slots (Z = 0 mm corresponds to the center of theslot).
In order to study the combustion mechanisms in the idealized boiler, two levels ofmeasurements were performed: global measurements in the flue gases and detailed measurementsin the combustion chamber. The overall measurements consisted of varying the primary aerationratio, the secondary aeration ratio, and the power input independently, and measuring the NOx andCO emissions at the flue gas probe. For the detailed measurements in the combustion chamber, fiveoperating conditions referred to as « test cases » were defined. They are shown in Table 1. In allcases selected, the total aeration ratio was set to 1.4 and the power input was set to 10 kW. Case 1and 2 have the same primary and secondary aeration ratio but a different fuel composition: naturalgas like blend vs. pure methane, respectively. Case 3 uses pure methane with no secondary air (i.e.,
Chimney
Heat Exchanger
Refractory
Vycor
Laminarization
LaminarizationTank
Primary Air
Secondary Air
Honeycomb
Laminarization
Glass
Y
X
Z
Ring
Grid
Beads
Grid
Structure
Windows
TM
Figure 1. Schematic of the idealized boiler.

1998 INTERNATIONAL GAS RESEARCH CONFERENCE464
fully premixed flame). Finally, Case 4 and 5 have the same aeration ratios and fuel composition butdiffer by their flame type: in Case 5 a metal insert is placed inside the primary channel to create aV-shaped flame.
Table 1. Test cases selected as operating conditions for the idealized boiler.Test Case Fuel Composition Fuel GCV
(kWh/m3(n))FlameType
PrimaryAeration
Second.Aeration
CH4 C2H6 C3H8
1 0.9 0.06 0.04 11.04 Bunsen 0.6 0.82 1 0 0 9.87 Bunsen 0.6 0.83 1 0 0 9.87 Bunsen 1.4 04 1 0 0 9.87 Bunsen 1.2 0.25 1 0 0 9.87 V shaped 1.2 0.2
Commercial BoilerThe combustion performances of the idealized boiler were compared with those of a
modified commercial boiler. It was a floor standing boiler with a cast iron combustion chamber,designed for a nominal thermal input of 8.8 kW. Water was produced with a temperature of 70°C.This boiler had partially premixed bar burners with atmospheric injection and free entrainment ofsecondary air, thus creating 3-dimensional flames. This contrasts with the idealized boiler wherethe primary premixing is controllable and the burner slots give 2-dimensional flames. The primaryaeration ratio was varied between 1.12 and 1.45, giving a total aeration ratio between 1.45 and 1.54.The combustion performance of the boiler were investigated in terms of flue gas temperature, totalair factor and NOx, and CO emissions.
Measurement TechniquesDirect visualization of the total UV/visible emission and OH, CH and C2 emissions was
achieved using an ICCD camera (Princeton Instruments) with a spatial resolution of 0.2 mm perpixel, and a camera lens (UV-Nikkor, 105 mm, f 4.5). Interference filters were used in order toselect the emission wavelength from different radicals. The camera was connected to a controller(ST138, Princeton Instruments) for image acquisition and a pulse generator (DG535, StanfordResearch) to synchronize the shutter and the exposure time. The camera was placed along the Zdirection (see Figure 1). The exposure time varied for each flame condition and for each radicalinvestigated. The digitized images were stored on a PC for image processing and analysis.
Fast Fourier Transform Infrared spectroscopy (FTIR) measurements of CO2, H2O, CO andNO and Laser Induced Fluorescence (LIF) spectroscopy measurements of OH, CH, and CN wereperformed in the idealized boiler for the five selected test cases. Due to space limitations, the resultsof these measurements will not be presented in this paper but will be discussed during the postersession of the present symposium.
Mean species (i.e., CO, CO2, O2, CH4, NO and NOx) concentrations were also measured inthe combustion chamber of the idealized boiler using Sonic Nozzle Probe Sampling (SNPS). TheSNPS (Pyro-Controle Chauvin Arnoux, licensed by Gaz de France) uses a suction probe with anouter diameter of 4 mm. A water cooled sonic nozzle is located at the probe tip. This nozzle isdesigned to quench chemical reactions in the sampled gases by fast reduction of temperature (downto about 60°C) and pressure (down to about 100 mbar of absolute pressure). The sampled gases arechanneled through a heated tube maintained at 60°C, to a permeation membrane for water removal.These gases are then sent to a series of analyzers. The volumetric concentrations of CO2 and CO aremeasured by infrared spectroscopy Ultramat 22P, (Siemens), CH4 by infrared spectroscopy (Uras4, Hartmann & Braun), O2 by paramagnetism (Oxymat 5E, Siemens), and NO and NO2 by

1998 INTERNATIONAL GAS RESEARCH CONFERENCE 465
chemiluminescence (Caldos 5G, Hartmann & Braun). Prior to the measurements the analyzers werecalibrated with certified standard mixtures of gases of known composition. Caution should be takenwhen analyzing the NO2 measurements obtained with the probe sampling technique used here. Thesemeasurements are subject to non-trivial measurement errors particularly in flame regions of hightemperature.
Temperatures were measured inside the combustion chamber by Fine Wire CompensatedThermocouples (FWCT) and Coherent Anti-Stokes Raman Spectroscopy (CARS). FWCTmeasurements (8) were made using two types of thermocouples (Pyro-Controle Chauvin Arnoux,licensed by Gaz de France): above Y = 20 mm, Pt-6%Rh/Pt-30%Rh thermocouples (B-type) whichhave a fine wire diameter of 50 µm were used, and below Y = 20 mm, Ir/Ir-40%Rh thermocouples(referred to as Ir type) which have a fine wire diameter of 80 µm were used. Ir type thermocouplescan be used up to 2300 K, whereas B- type thermocouples are limited below 2000 K. Thethermocouples were introduced inside the combustion chamber through a slot machined into theglass windows. The slot allows one to measure temperature along the X or Y direction, at Z = 0 mm.The thermocouples were introduced on the negative side of the X axis. The thermocouples signalwas amplified (x100 to x500) with a low noise preamplifier (Stanford Research, SR-560) anddigitized by a 16 bit resolution ADC board (National Instruments, AT-MIO-16-X). The temperaturegiven by the thermocouple was numerically compensated for radiation losses (8). Thethermocouples were coated with a glassy film of an inert ceramic oxide to eliminate catalyticreactions on the fine wire surface (9,10). The CARS system used an Nd:YAG laser (Continuum
Powerlite 8000) which is injection seeded with a linewidth of 0.05 cm-1 at 532 nm and a maximumoutput pulse energy of 350 mJ. The modeless dye laser (ModeX) was operated with a four-passoscillator configuration and a single amplifier. This resulted in approximately 140 mJ in the two 532nm probe beams and 60 mJ in the dye beam. The beams were focused using a 400 mm focal lengthlens. This generates a control volume of approximately 200 µm in diameter and 800 µm long. Thesignal beam from the CARS control volume was optically filtered, collected by a 60 mm focal lengthlens and focused into an optical fiber. The output from the fiber was focused directly onto the inputslit of the spectrometer (1.5 m SPEX, 2400 gr/mm grating). The spectrometer detector (1750x552CCD device, Princeton Instruments) provided a resolution of 0.003 nm per pixel. At eachmeasurement location 500 CARS spectra were recorded over a period of approximately 90 seconds.
The axial and radial velocity profiles were measured for the five selected test cases byParticle Imaging Velocimetry (PIV) and Laser Doppler Velocimetry (LDV). These measurementswhich, to our knowledge, have never been done in a real size household-like boiler will be presentedduring the poster session of the conference. The space limitations of the current paper does notallow a complete discussion on these measurements.
RESULTS AND DISCUSSION
Overall MeasurementsOverall measurements were performed in the flue gases of the idealized boiler as a function
of primary and secondary aeration ratio, and power input. The objective of these measurements wasto determine the performances of the idealized boiler in terms of NOx and CO emissions and tocompare its behavior with that of commercially available boilers.

1998 INTERNATIONAL GAS RESEARCH CONFERENCE466
Figure 2 shows the NOx concentration measured by probe sampling in the flue gases of theidealized boiler as a function of primary aeration ratio for different secondary aeration ratios. Theconcentrations were obtained when the burner was operated at 10 kW. As one can see, the NOx
concentration decreases sharply when the primary aeration ratio increases. This decrease issomewhat less sharp as the secondary aeration ratio decreases. Note that very low NOx emissions,below 50 mg/kWh) are observed with no secondary aeration, i.e., for fully premixed flames. Leanpremixed flames are known to favor NOx reduction. In these flames, the concentration of C2, CHand CH2 radicals are reduced, hence the attack of N2 molecules by these radicals in the oxidationzones which is the first step for prompt NO formation (Fenimore pathway) is limited. In addition,lean premixed flames have lower temperatures, also resulting in smaller NO formation through thethermal channel (Zeldovich pathway). Figure 3 shows CO concentrations measured in the idealizedboiler as a function of total aeration ratio for different secondary aeration ratios. Total aeration wasselected as the X axis in this case, to stress the weak effect of secondary aeration. As one can seein Figure 3, CO emissions decrease with total aeration ratio. This decrease is almost independent ofsecondary aeration ratio. This shows that in the combustion chamber with enough residence timefor burnout between the burner and the heat exchanger, the oxidation of CO is governed by the totalavailability of molecular oxygen, irrespective of whether it is provided in the primary or secondaryair.
Measurements of NOx and CO as a function of primary aeration at constant power was alsoobtained using a commercially available floor standing boiler. These measurements are reported inFigure 4. The strong decrease in NOx emission with increasing primary aeration ratio as observedin the idealized boiler is evident. However, in contrast with the idealized boiler, the CO emissionin the practical boiler increases sharply with primary aeration. This difference in behavior istraceable to the fact that whereas the flame in the idealized boiler blows off suddenly at a givenprimary aeration ratio, practical burners begin to lift long before finally blowing off. These liftedflames leak a fuel-air mixture at the edges of the burner, that is then converted to CO en route to theheat exchanger (5). These effects of primary aeration are responsible for the existence of only anarrow window in terms of operating parameters for acceptable NOx and CO emissions.
0
20
40
60
80
100
1 1.2 1.4 1.6 1.8 2Total aeration ratio
CO
(m
g/kW
h)
Secondar y aeration ratio =
0.0
0.5
0.3
1.0
Figure 2. CO concentration measured inthe idealized boiler.
0
50
100
150
200
250
300
350
0.6 0.8 1 1.2 1.4 1.6Primary aeration ratio
NO
x (m
g/kW
h)
0.3
0.5
1.0
0.0Secondar y
aeration ratio =
Figure 3. NOx concentration measuredin the idealized boiler.

1998 INTERNATIONAL GAS RESEARCH CONFERENCE 467
Emission Spectroscopy MeasurementsQualitative emission spectroscopy measurements
were performed for the 5 cases selected to characterize thestructure of the 5 flames. Figure 5 shows the global, OH,CH, and C2 spontaneous emission obtained by UV/visibleemission spectroscopy for Cases 1 through 5. The globalemission can be considered as the sum of OH and C2
emission since the emission of CH is weak compared tothat of the others. The flame structure in Case 1 and 2 ischaracterized by an inner cone and two « wings ». Theinner cone corresponds to the primary fuel rich flame(primary aeration ratio is 0.8), whereas the wingscorrespond to the secondary diffusion flame. In both casesthe flame is attached to the edges of the burner slots. Atthis location (i.e., Y = 0 mm), the spontaneous emission isessentially due to OH and CH radicals, since the formationof C2 is initiated only above Y = 0.8 mm. The maximumof the C2 emission is observed at the top of the premixedreaction zone. Furthermore, C2 is present only in thepremixed reaction zone whereas OH and CH are detectedalso in the diffusion flame zone.
For Case 3, the emission profiles are different. The total emission profile only shows aninner fuel lean flame since no secondary air is introduced in this case. The flame appears lifted fromthe burner edges since the total, OH, and CH emissions only start above Y = 1.4 mm. The C2
emission is delayed even further up and starts above Y = 2.4 mm. The OH and CH emissions aremaximum at the top of the premixed flame. Case 4 and 5 which have the same primary andsecondary aeration ratios present very different flame structures. The flame structure in Case 4 isvery close to that of Case 3, i.e., a single premixed reaction zone is observed and no secondarydiffusion flame is detected. However, in contrast with Case 3, the flame appears to be stabilized atthe burner edges since both total and OH emissions start at Y = 0 mm. The flame structure in Case 5is very different from the previous cases. As a reminder, in Case 5 an insert is placed inside theburner blades to create a V-shaped structure. The emission profiles are nearly the same for the threeradicals investigated (OH, CH, C2). They all have a V-shaped structure. The emission intensitiesare higher than in Case 4 and the flame surface appears larger, although the flame height is nearlythe same.
Temperature MeasurementsThe temperatures were measured in the combustion chamber by FWCT and by CARS.
Figure 6 compares the temperature profiles measured by both techniques along the centerline of thecentral burner slot for Case 3. As one can see, the two profiles are in good agreement. Theagreement is also good for Case 4 and 5, but only fair for Case 1 and 2. Since space limitationspreclude a full comparison of the results obtained with both techniques, the following discussion willfocus on FWCT measurements.
The temperature maps measured by FWCT are shown below Y = 40 mm in Figure 7 for thefive cases investigated. As a reminder, the FWCT measurements were obtained by introducing athermocouple on the negative side of the X axis through a slot machined in the glass windows. Sincethis slot caused some flow disturbances up to about X = 0 mm, the measurements shown wereperformed above the slot located at X = +16 mm.
0
50
100
150
200
250
1 1.2 1.4 1.6Primary Aeration Ratio
Em
issi
ons
(mg/
kWh)
NOx
CO
Figure 4. NOx and CO emissions vs.primary aeration in a commercialboiler.

1998 INTERNATIONAL GAS RESEARCH CONFERENCE468
The temperature maps for Case 1and 2 are similar and match the observationsmade by emission spectroscopy. The twocases only differ by the type of fuel used(synthesized natural gas like mixture vs.pure methane) and therefore have the sameflame structure. If one places the flame atthe location where the temperature gradientis maximum, two different flame regions areobserved: above the primary channel aninner fuel rich premixed flame (primaryaeration ratio = 0.6) is observed, and on bothsides of the secondary air channel an outerdiffusion flame develops. The maximumtemperature (2290 K) is measured on bothsides of the inner cone, in the region locatedbetween the premixed and diffusion flame.This corresponds to the stoichiometricreaction zone. An off-centered temperaturepeak is consistent with other investigationsof partially premixed fuel rich flames (1).This temperature peak (i.e., 2290 K) ishigher than that predicted by adiabaticequilibrium calculation (i.e., 2228 K) withan initial reactant temperature of 293 K. This superadiabatic temperature is assignedto preheating of the premixture inside of theburner slots and in the inner flame cone (1).For example, temperatures as high as 600 Kwere measured by thermocouples inside ofthe burner slots.
In Case 3 no secondary air is used,hence a fuel lean flame forms above theprimary burner slot characterized by a sharptemperature gradient. As one can see inFigure 7, the temperature map is moreuniform in the combustion chamber than inCase 1 and 2. The maximum temperature(i.e., 2050 K) is also higher than theadiabatic equilibrium temperature (i.e.,1857 K) for a total aeration ratio of 1.4. Thisis also assigned to preheating. Note that theinner flame in Case 3 is the highest of theflames investigated, thus the premixture hasmore time for preheating. Case 4 shows anintermediate temperature profile betweenCases 1-2 and Case 3. An inner fuel lean flame (primary aeration = 1.2) forms at the burner slot. The maximum temperature (i.e., 2262 K) is measured on both sides of this inner flame. Finally inCase 5, the temperature field is as expected different from the previous cases. Sharp temperature
Figure 5. Total, OH, CH, C2 spontaneous emissionby UV/visible spectroscopy (arbitrary gray scale).
Figure 6. Centerline measurements of temperatureby FWCT and CARS in Case 3.
400
600
800
1000
1200
1400
1600
1800
2000
2200
0 10 20 30 40 50 60Y (mm)
Tem
pera
ture
(K
)
FWCTCARS

1998 INTERNATIONAL GAS RESEARCH CONFERENCE 469
gradients are measured on both sides of the metal insert. They corresponds to the « wings » of theV-shaped flame. The maximum temperature reached (i.e., 2295 K) is higher than in Case 4. Thismaximum temperature is measured above the insert.
Figure 7. Temperature map measured by FWCT for Case 1 through 5.
Species Concentration MeasurementsFigure 8 through 12 give the mean species concentration profiles (O2, CO2, CO, CH4, NO,
NO2) measured using SNPS for Cases 1 through 5, respectively. These measurements were obtainedalong the centerline of the burner slot located at X = +16 mm. They are given in mole fraction (%).Note that the NO/NO2 concentrations are magnified by 1000 for all cases except for Case 3 wherethey are magnified by 10000 (for reference, a mole fraction of 12.0 % on the left axis correspondsto a NO concentration of 12 ppm in case 3, and 120 ppm in all other cases). The mean species molefractions are shown up to Y = +60 mm since they do not evolve significantly further up. Thecorresponding temperature profiles measured using FWCT along the same centerline are shown alsofor each flame case (the temperature axis is given on the secondary Y axis))..

1998 INTERNATIONAL GAS RESEARCH CONFERENCE470
The mean species concentration profiles are similar for Case 1 and 2 as expected fromtemperature and emission spectroscopy measurements. In both cases, the maximum COconcentration measured corresponds to the location where the temperature gradient is maximum,which is assigned to the location of the inner premixed flame. The NO concentration profiles followthe same trend and can be divided in three stages: a stage of sharp concentration increase is observedfrom the burner mouth up to the location of the CO concentration peak (i.e., the location of the innerflame); a stage of gradual concentration increase follows, up to the location where the temperatureis maximum (i.e., Y = 24 mm); finally above this location, the NO concentration remains almostconstant up to Y = +60 mm. At Y = +60 mm, the NO and NO2 concentrations are 90 and 30 ppm,respectively, which corresponds to their respective concentrations in the flue gases. The stage ofsharp concentration increase can be assigned to NO formed through the prompt (Fenimore) pathway.At the end of this stage, the NOx concentration (taken as [NO]+[NO2]) represents half of the totalNOx produced (i.e., the NOx concentration is 60 ppm at Y = 8 mm). This, however, does not takeinto account the dilution with secondary air. The stage of gradual increase, which starts around
0
2
4
6
8
10
12
14
16
18
20
0 10 20 30 40 50 60Y (mm)
Mol
e F
ract
ion
(x10
2 )
400
800
1200
1600
2000
2400
Tem
perature (K)
NO2 x103
NO x103
CO2
O2
COCH4
Temp.
Figure 9. Axial profiles for flame case 2.
0
2
4
6
8
10
12
14
16
18
20
0 10 20 30 40 50 60Y (mm)
Mol
e F
ract
ion
(x10
2 )400
800
1200
1600
2000
2400
Tem
perature (K)
NO2 x103
NO x103
CO2
O2
CO
CH4
Temp.
Figure 11. Axial profiles for flame case 4.
0
2
4
6
8
10
12
14
16
18
20
0 10 20 30 40 50 60Y (mm)
Mol
e F
ract
ion
(x10
2 )
400
800
1200
1600
2000
2400
Tem
perature (K)
NO2 x103
NO x103
CO2
O2
CO
CH4
Temp.
Figure 12. Axial profiles for flame case 5.
0
2
4
6
8
10
12
14
16
18
20
0 10 20 30 40 50 60Y (mm)
Mol
e F
ract
ion
(x10
2 )
400
800
1200
1600
2000
2400
Tem
perature (K)
NO2 x103
NO x103
CO2
O2
COCH4
Temp.
Figure 8. Axial profiles for flame case 1.
0
2
4
6
8
10
12
14
16
18
20
0 10 20 30 40 50 60Y (mm)
Mol
e F
ract
ion
(x10
2 )
400
800
1200
1600
2000
2400
Tem
perature (K)
NO2 x104
NO x104
CO2
O2
COCH4
Temp.
Figure 10. Axial profiles for flame case 3.

1998 INTERNATIONAL GAS RESEARCH CONFERENCE 471
Y = 8 mm at a location where the temperature is above 2000 K, is likely to be due to the formationof thermal NO (Zeldovich pathway). At this temperature level, the Zeldovich pathway is known tohave an important contribution (11). The NO2 concentration remains constant throughout thecombustion chamber although a slight increase is noticeable at the early the stage of the gradualincrease. At Y = 60 mm, NO2 represents only about 25% of the total amount of NOx produced.
The mean species concentration profile for flame Case 3 is shown in Figure 10. In this case,the flame is a Bunsen like fuel lean fully premixed flame since no secondary air is used. The NOconcentration slowly rises from the burner surface to about Y = 8 mm. This slow rise which isassigned to NO produced through the Fenimore pathway is in striking contrast with thecorresponding sharp increase observed in Case 1 and 2. At the end of this rise, i.e., Y = 8 mm, theNO concentration represents only 25% of the total amount of NO produced. As discussed previouslyin the overall measurements, fuel lean flames show lower concentrations of CH radicals than theirfuel rich counterparts. Hence, the concentration of NO produced which is sensitive to the CH-HCNreaction pathway in the Fenimore mechanism (11), remains low. From Y = 8 mm to Y = 20 mm,the NO concentration increases sharply. This is most likely due to the Zeldovich mechanism withcontribution from superequilibrium O atoms. At these locations, the maximum temperature is1997 K. Therefore, the total NOx concentration increases up to 20 ppm. The NO2 concentration isalmost constant up to Y = 8 mm. However, it increases significantly between Y = 8 mm andY = 20 mm. At Y = 60 mm, NO2 represents about 50% of the total NOx produced. Note that thishigh concentration could be due to an artefact of the measurement technique. In both Case 4 and 5,the concentration profiles are similar to those observed in Case 3 in terms of NO and NO2. However,since both flames are shorter than in Case 3, the slow rise assigned to the formation of NO throughthe Fenimore mechanism ends lower in the combustion chamber (i.e., Y = 6 mm). The maximumflame temperature in Case 4 and 5 (i.e., 2262 K and 2295 K, respectively) is higher than in Case 3,therefore the total NOx measured at Y = 60 mm is higher (about 50 ppm in both cases). The NO2
concentration represents about 40% of the total amount of NOx produced, which leads to theconclusion that the relative amount of NO2 produced increases with increasing primary aeration ratio.
CONCLUSIONS
Preliminary results of the experimental investigation of an idealized boiler were presented.They represent one of the most complete set of experiments aimed at understanding the combustionprocesses in a real size household boiler. They show how one can use advanced measurementtechniques in a real practical appliance, to study pollutant formation mechanisms. These results arevery valuable in providing insights into how burner operation affects emission performances. Theywill therefore represent the basis for the boiler Design Guidelines that will be delivered as part ofthe TOPDEC project. Finally, they represent a complete database for the validation of numericalpredictions.
ACKNOWLEDGMENTS
The results of this project are published by kind permission of Companies, Universities andOrganizations which are involved in TOPDEC, and of the European Commission which financialcontribution to this project is gratefully acknowledge.

1998 INTERNATIONAL GAS RESEARCH CONFERENCE472
REFERENCES
1. Nguyen, Q.V., Dibble, R., Carter, C.D., Fiechtner, G.J. and Barlow R.S. (1996). Raman-LIFMeasurements of Temperature, Major Species, OH, and NO in a Methane-Air BunsenFlame. Combustion and Flame, 105:499-510.
2. Van Oostendorp, D.L., Borghols, W. T. A., and Levinsky, H. B. (1991). The influence ofAmbient Air Entrainment on Partially Premixed Burner Flames: LIF Imaging of CO and OH.Combustion and Flame, 79:195-206.
3. Arrigotti, S., Bernstein, S., Levinsky, H.B., Van Oostendorp, D.L., and van der Meij, C.E.(1992). Numerical and Experimental Investigation of a Laminar Bunsen Flame. Proceedings1992 International Gas Research Conference, Orlando, FL, 1753-1762.
4. Hasko, S.M., Fairweather, M., Bachman, J.S., Imbach, J., van der Meij, C.E., Mokhov, A.V.,Jacobs, R.A.A.M. and Levinsky, H.B. (1995). Optical-Diagnostic and Numerical Study ofan Experimental Slot Burner. Proceedings 1995 International Gas Research Conference,Orlando, FL, 33-42.
5. Van der Meij, C.E., Mokhov, A.V., Jacobs, R.A.A.M. and Levinsky, H.B. (1994). On theEffect of Fuel Leakage on CO Production from Household Burners as Revealed by LIF andCARS. Twenty-Fifth Symposium (International) on Combustion, The Combustion Institute243-250.
6. Levinsky, H.B., van Oostendorp, D.L., van der Meij, C.E., Jacobs, R.A.A.M. and Mokhov,A.V. (1992). Pollutant Formation in Household Burners: LIF Imaging of NO. Proceedings1992 International Gas Research Conference, Orlando, FL, 1578-1586.
7. Joos, L. (1995). State of the Art in Pollution Control for Gas Appliances. Proceedings 6thInternational Gas Congress (IRGUC), Prague, Czech Republic.
8. Neveu, F., Corbin, F., Perrin, M. and Trinité, M. (1995). Characterization of the couplingsof aerodynamics and combustion in a nonpremixed turbulent flame. Rev. Gén. Therm.,34:305-314.
9. Shandross, R.A., Longwell, J.P. and Howard, J.B. (1991). Noncatalytic ThermocoupleCoating for Low-Pressure Flames. Combustion and Flame, 85:282-284.
10. Kent, J.H. (1970). A Noncatalytic Coating for Platinum-Rhodium Thermocouples.Combustion and Flame, 14: 279-282.
11. Muzio, L.J. and Quartucy, G.C. (1997). Implementing NOx Control: Research toApplication. Prog. Energy Combust. Sci., 23:233-266.