detailed fem analysis of two different splice … · 2010-07-21 · detailed fem analysis of two...
TRANSCRIPT

DETAILED FEM ANALYSIS OF TWO DIFFERENT SPLICE STEEL CONNECTIONS
A THESIS SUBMITTED TOTHE GRADUATE SCHOOL OF NATURAL AND APPLIED SCIENCES
OFMIDDLE EAST TECHNICAL UNIVERSITY
BY
OĞUZ YILMAZ
IN PARTIAL FULFILLMENT OF THE REQUIREMENTSFOR
THE DEGREE OF MASTER OF SCIENCE IN
CIVIL ENGINEERING
SEPTEMBER 2008

Approval of the thesis:
DETAILED FEM ANALYSIS OF TWO DIFFERENT SPLICE STEEL CONNECTIONS
submitted by OĞUZ YILMAZ in partial fulfillment of the requirements for the degree of Master of Science in Civil Engineering Department, Middle East Technical University by,
Prof. Dr. Canan Özgen ___________________ Dean, Graduate School of Natural and Applied Sciences
Prof. Dr. Güney Özcebe ___________________ Head of Department, Civil Engineering
Asst. Prof. Dr. Alp Caner ___________________Supervisor, Civil Engineering Dept., METU
Assoc. Prof. Dr. Cem Topkaya ___________________Co-Supervisor, Civil Engineering Dept., METU
Examining Committee Members:
Asst. Prof. Dr. Özgür Kurç ___________________ Civil Engineering Dept., METU
Asst. Prof. Dr. Alp Caner ___________________Civil Engineering Dept., METU
Assoc. Prof. Dr. Cem Topkaya ___________________Civil Engineering Dept., METU
Inst. Dr. Afşin Sarıtaş ___________________Civil Engineering Dept., METU
Syed Ateeq Ahmad ___________________General Manager, PROYA
Date : September 05, 2008

iii
I hereby declare that all information in this document has been obtained and presented in accordance with academic rules and ethical conduct. I also declare that, as required by these rules and conduct, I have fully cited and referenced all material and results that are not original to this work.
Name, Last name: Oğuz YILMAZ
Signature:

iv
ABSTRACT
DETAILED FEM ANALYSIS OF TWO DIFFERENT
SPLICE STEEL CONNECTIONS
YILMAZ, Oğuz
M.Sc., Department of Civil Engineering
Supervisor: Asst. Prof. Dr. Alp CANER
September 2008, 68 pages
Beam splices are typically located at moment contraflexure points (where
M=0). Most design specifications require these splices to develop a strength
either to meet design forces or a minimum value set by specifications. The
design forces are typically determined through elastic analysis, which does not
include flexibility of splice connections. In this research, two types of splice
connections, an extended end plate splice connection and a flange and web
plate bolted splice connection, were tested and analyzed to investigate the
effect of the partial strength splice connections on structural response. The
splices were designed to resist 40% and 34% of connecting section capacities
using current steel design codes, respectively. It has been observed from the
experiments and FEM analysis results that splice connections designed under
capacities of connecting steel members can result in changes in design moment
diagrams obtained from analyses without splice connection simulation and can
also significantly decrease the rigidity of the structure endangering
serviceability. The differences in design moment diagrams can go up to 50 %
of elastic analysis without connection flexibility. The vertical displacements
can increase to 155% of values obtained from elastic analysis with no splice

v
connection simulation. Therefore, connection flexibility becomes very
important to define in analysis.
Keywords: Beam splice, End plate splice, Flange and web plate bolted splice,
Connection flexibility, Finite Element Modeling

vi
ÖZ
İKİ FARKLI BAĞLANTILI ÇELİK BİRLEŞİMİNİN DETAYLI
SONLU ELEMANLAR ANALİZİ
YILMAZ, Oğuz
Yüksek Lisans, İnşaat Mühendisliği Bölümü
Tez Yöneticisi: Yrd. Doç. Dr. Alp CANER
Eylül 2008, 68 sayfa
Kiriş bağlantıları tipik olarak moment sıfır noktalarına yerleştirilirler (M=0).
Tasarım şartnamelerinin çoğu bu bağlantıların, ya tasarım kuvvetlerini ya da
şartnamelerin belirlediği minimum bir değeri, karşılayacak dayanımı
sağlamalarını zorunlu kılmaktadır. Tasarım kuvvetleri tipik olarak bağlantı
birleşimlerinin esneklikleri düşünülmeden elastik analiz yöntemiyle elde
edilirler. Bu araştırmada, genişletilmiş uç plakalı ve başlık ve gövde plakalı
civatalı olmak uzere iki bağlantı tipi, kısmi dayanımlı bağlantılı birleşimlerin
yapı davranışı üzerindeki etkisini araştırmak amacıyla test edilmiş ve analiz
edilmiştir. Bu bağlantılar mevcut tasarım şartnameleri kullanılarak, bağlanan
kesit kapasitelerinin 40% ve 34%`üne dayanabilmeleri için tasarlanmışlardır.
Deneylerden ve sonlu elemanlar analiz sonuçlarından, bağlanan kesit eleman
kapasitesinden daha zayıf tasarlanan bağlantılı birleşimlerin, bağlantı
birleşiminin simule edilmediği analizlerden elde edilen tasarım moment
şemalarının değişmesine yol açabildiği ve yapının rijiditesini düşürerek
kullanılabilirliğini tehlikeye atabildiği gözlenmiştir. Tasarım moment
şemalarındaki farklar, bağlantı esnekliğinin düşünülmediği elastik analiz
sonuçlarının 50%`sine kadar çıkabilmektedir. Düşey deplasmanlar, bağlantı
birleşiminin simule edilmediği elastik analiz sonuçlarının 155%`ine

vii
çıkabilmektedir. Bu nedenle birleşim esnekliğinin analiz esnasında
tanımlanması çok önemli olmaktadır.
Anahtar Kelimeler: Kiriş bağlantısı, Uç plakalı bağlantı, Başlık ve gövde
plakalı civatalı bağlantı, Birleşim esnekliği, Sonlu elemanlar modellemesi

viii
To my family

ix
ACKNOWLEDGEMENTS
First and foremost I would like to thank my advisor Asst. Prof. Dr. Alp
Caner for his continuous guidance and support during this research. He was an
invaluable mentor with his deep technical knowledge and sharp insight. It was
a privilege for me to work with him. I also would like to thank to my co
advisor Assoc. Prof. Dr. Cem Topkaya and committee members Asst. Prof. Dr.
Özgür Kurç, Inst. Dr. Afşin Sarıtaş and Mr. Syed Ateeq Ahmad for their
suggestions and comments.
I would like to thank Mr. Mustafa Çobanoğlu, for sharing his
company`s, Bir Yapi A.S.`s, facilities for fabricating the test specimens and
sponsoring the experimental program conducted as a part of this research. With
his expertise in steel works, I could always rely on his knowledge when I had a
question in mind.
I must thank Assoc. Prof. Dr. Özgür Yaman, for his help during the
tests we conducted in the Construction Materials Laboratory. He provided
important support in establishing the test setup and using the data acquisition
system.

x
TABLE OF CONTENTS
ABSTRACT …………………………………………………………....... iv
ÖZ ……………………………………………………………………….. vi
DEDICATION …………………………………………………………… viii
ACKNOWLEDGEMENTS ……………………………………………… ix
TABLE OF CONTENTS ………………………………………………… x
CHAPTER
1. INTRODUCTION ……...…………………………...……………..... 1
1.1 Beam Splices ……………………………….............................. 1
1.1.1 End-Plate Splices ………………………………….... 3
1.1.2 Flange and Web Plate Splices ………...……….......... 7
1.2 Objectives and Scope …………………………………………. 8
2. EXPERIMENTAL INVESTIGATION ………………………..…… 10
2.1 Overview ……………………………………............................ 10
2.2 Test Specimens ………………………………………….......... 10
2.3 Test Setup ………………………………………….................. 15
2.4 Testing Procedure………………………………....................... 18
2.5 Test Results….………………………………........................... 18
3. FINITE ELEMENT STUDY AND COMPARISON WITH
EXPERIMENTAL RESULTS………………..…………………....... 25
3.1 Finite Element Model…………………………………………. 25
3.2 Comparison of Results… ……………………………………… 34

xi
4. COMPARISON OF ANALYSIS RESULTS WITH AND WITHOUT
SPLICES.........................................................................……........... 46
4.1 Verification of Experimental and Numerical Analysis Results
With a Simple Analysis Method in Elastic Range………......... 46
5. SUMMARY AND CONCLUSIONS……………………………… 53
5.1 Summary......………………………………………………...… 53
5.2 Conclusions. ………………………………………………...… 54
5.3 Suggestions. ………………………………………………...… 56
REFERENCES ……………………………………………………………. 57
APPENDICES
A. DESIGN OF TEST SETUPS............................................................... 59
1. Design of Test Setup – End Plate Splice ........................................ 59
2. Design of Test Setup – Flange and Web Plate Bolted Splice....... 64

1
CHAPTER 1
INTRODUCTION
1.1 Beam Splices
Hot rolled beams and plate girders can have splices along their length
due to construction or design requirements. These requirements can be
referenced as: 1) beam or girder length can be less than span length, 2)
shipping limitations, 3) camber and 4) design cross-section change [1]. Splices
typically transfer shear and moment to the connecting members. These load
effects are obtained from structural analysis, which are usually less than load
carrying capacity of the spliced members since splices are placed at or close to
moment contraflexure points of span. In any case these splices are desired to
satisfy minimum requirements of a design code. Other than AISC-LRFD
(2005) [2], Eurocode 3 [3] and AASHTO (1996) [4], some design
specifications are claimed to require splices to transfer full strength of the
connecting members [5]. In this research only major design codes such as
AISC-LRFD, Eurocode 3, and AASHTO are evaluated. If a splice is designed
for the load capacity of the member spliced, no special precautions may be
necessary, since full continuity is maintained.
Some designers prefer to use only shear splices at points of moment
contraflexure where moment is negligible and these shear splices can act as a
real hinge at a point of zero moment. There are two main reasons not to use
shear splices as follows: (1) the point of contraflexure under service load is not

2
at the same location that it develops under factored loads and live load
locations are unknown; (2) moments determined from continuous spans are
invalid if real hinges, shear splices, are inserted along the continuous spans [1].
Hart and Milek demonstrated that in the presence of real hinges at splices, a
given beam may perform as discontinuous when acted by a system of loads
different from the system upon which the analysis was based [6].
When, rarely, the beam splice is placed at a point of maximum moment,
splices shall have a rotation capacity that is consistent with the global analysis
of the overall structure. When, as is usually the case the splice is located at a
low moment zone, rotation capacity of splices is not to be consistent with the
spliced members, which can soften the structural response.
AISC-LRFD requires groove-welded splices to “develop the nominal
strength of the smaller spliced section”. ”Other types of splices in cross
sections of plate girders and beams shall develop the strength required by the
forces at the point of the splice.”
Eurocode 3 requires the internal forces at the splice location to be taken
not less than a moment equal to 25% of the moment capacity of the weaker
section about both axes and a shear force equal to 2.5% of the normal force
capacity of the weaker section in the direction of both axes.
AASHTO requires splice capacity to be maximum of the following
values: 1) average of the required design strength at the point of splice and the
design strength of the member at the same point or 2) 75% of the design
strength of the member.

3
Couple of splice types is available. Most common splice types are
1) end plate splice connections and 2) flange and web plate splice connections.
1.1.1 End-Plate Splices
End-plate connections are typically used to connect a beam to a column
or to splice two beams together. Moment end-plate connections can be made
fully restrained, FR, or partially restrained, PR, based on type, configuration
and end-plate stiffness [7]. The common uses of end-plate moment connections
are illustrated in Figure 1.1.
a) Beam-to-Column Connection b) Beam Splice Connection
Figure 1.1: Typical uses for end-plate moment connections [7]
End-plate connections can be made either flush, as shown in Figure 1.2
or extended, as shown in Figure 1.3.

4
a) Unstiffened b) Stiffened
Figure 1.2: Examples of flush end-plate connections [7]
a) Unstiffened b) Stiffened
Figure 1.3: Examples of extended end-plate connections [7]
A standard column-tree system in which flush end-plate splice
connections are used is shown in Figure 1.4. This connection configuration is
commonly utilized in Turkish practice.

5
Figure 1.4: Flush end-plate splice connections used in a building frame
(Turkish practice) (By courtesy of Caner)
Moment end-plate connections are further described by the number of
bolts at the tension flange and the configuration of the bolt rows. Most
common end plate connections are four bolt unstiffened and eight bolt stiffened
connections.
Because moment end-plate connections do not require time consuming
and costly field welds, they are easy to erect and comparatively more
economical than other moment connections. Also field welds usually have low
quality compared to a similar shop weld. However, these connections require
precise beam length and bolt hole location tolerances. This problem may be
reduced with the increased use of computer controlled fabrication equipment.

6
A design and analysis guide for flush and extended end-plate beam-
column moment connections is developed by Murray and Shoemaker [8]. The
guide includes provisions for the design of four different configurations of
flush and five different configurations of extended end-plate connections.
These provisions only cover connections subject to gravity, wind and low-
seismic forces and a unified design procedure is employed for investigated
connections. Design method is developed utilizing yield line analysis in
determining end-plate thickness and utilizing the modified Kennedy method in
determining bolt forces. Such a method may also be used for design of beam
splices in absence of any other code requirement with some precautions.
A second guide for seismic design is developed by Murray and Sumner
[9] for extended end-plate moment connections. The guide includes provisions
for the design of three different extended end-plate connection configurations.
Similar to Murray and Shoemaker guide, a unified design procedure is
employed using similar assumptions.
Bahaari and Sherbourne (1994) [10] used ANSYS software to analyze
3-D finite element models to assess structural response of four bolt unstiffened
end-plate moment connections instead of 2-D simple models. The new models
utilized plate, brick, and truss elements with non-linear material properties.
They were able to verify the results of investigated experiments and
recommended that the 3-D models are a better option compared to 2-D models
to generate analytical formulations to predict the behavior and strength of the
connection components.
Choi and Chung (1996) [11] stated that membrane, plate, shell, and/or
partially solid elements cannot detect the locally three-dimensional behavior in
end plate connections. In their study they presented a refined finite element

7
model using three-dimensional nonconforming solid elements with variable
nodes. They took the effect of bolt pretensioning and the shapes of the bolt
shank, head and nut into consideration during modeling. A simple but efficient
contact algorithm with gap elements was used to employ the interaction
between the end plate and the column flange. They verified the applicability of
their approach through comparison of the numerical results with test results.
Bursi and Jaspart (1998) [12] provided a summary of developments for
estimating the moment-rotation behavior of bolted end plate moment resisting
connections. Inclusion of friction in the model had limited effect on the
structural behavior of the connection compared to a model without friction
simulation. Details of finite element analysis modeling of end-plate
connections are presented in their study.
1.1.2 Flange and Web Plate Splices
Flange and web plate splices utilize flange plates and a web connection.
Flange plates and web connection may be bolted or welded. A typical example
of a bolted splice connection is shown in Figure 1.5.
Figure 1.5: A flange and web plate bolted splice connection [13]

8
In this type of splice connection shear is primarily transferred thorough
beam web connection and moment through coupling of axial forces at the top
and bottom flange connections. This type of connections is commonly
practiced in United States.
Firas I.Sheikh-Ibrahim and Karl H.Frank (1998) [14] conducted an
extensive testing program for six full-scale symmetric bolted beam splices.
Based on the results of these tests and on the tests available in the literature,
following conclusions are presented; (1) web splice can be conservatively
assumed to carry the total shear even if flange splices, if not fully yielded, carry
a portion of the total shear. (2) the AISC approach is determined to be
satisfactory except when the flanges alone are not able to resist the total
moment, the AISC approach needs to be modified. In this exceptional case,
web splice can be designed for the shear, moment due to eccentricity of the
shear, and moment not resisted by the flanges.
1.2 Objectives and Scope
Beam splices are typically located in regions where internal load effects
are low and they are designed for corresponding moment and shear values
determined from analysis occurring at the location of the splice or some
specification prescribed minimum strength. These splice connections are most
of the time partial strength, partially restrained connections, but in structural
analysis, the reduced stiffness at splice is typically ignored.
Two different splice connections are investigated in this research. An
experimental program is conducted and finite element models of these
connections are developed to investigate effect of splices providing partial
strength on redistribution of internal forces.

9
The details of the experimental program along with the results are
presented in Chapter 2. The finite element models of the connections, analysis
results and comparison of the numerical analysis results with the experimental
results are discussed in Chapter 3. A simple analysis method is presented in
Chapter 4 and linear elastic analyses of the beams tested in the experimental
program are carried out under their respective design loads once with modeling
the beams as continuous and then with incorporating the flexibility of the
splices either through the finite element model of the respective splice
connection developed in Chapter 3 or through the proposed simple analysis
method of defining a moment release at the splice location. The results of the
study are discussed and conclusions are drawn in Chapter 5. Appendix A
contains the design steps followed along with the design calculations for the
end-plate bolted splice and the flange and web plate bolted splice as per AISC
procedure.

10
CHAPTER 2
EXPERIMENTAL INVESTIGATION
2.1 Overview
The experimental program as a part of this research involved five
loading tests. First test was conducted on an unspliced beam. Remaining four
tests were on beams with two types of splice connections providing partial
strength. Type 1: extended end-plate splice (from hereon called EEPS) and
Type 2: flange & web plate bolted splice (from hereon called FWPBS) were
selected for the experiments. Connections were tested under negative and
positive moment regions of beams subjected to monotonic loading applied at
mid span. These tests were conducted to investigate behavior of two types of
partial strength splice connections, to determine redistribution of forces on
structural system, and to provide experimental data to compare to the results of
the finite element analysis which is conducted as a part of this research.
2.2 Test Specimens
For each test, two IPN140 beams of St 37 steel were spliced either by
EEPS or FWPBS at either 20 cm from interior support or 20 cm from mid span
except the first test having no splice. Tabulated beam geometric properties are
listed in Table 2.1. All connections were designed weaker than the connecting
beams as partial strength connections based on AISC design steps in such a
way that the bolts were always the weakest link in the system. (EEPS
11
connection was designed to have a nominal moment capacity of 40% of the
nominal plastic moment capacity of the IPN140 member it connected while
FWPBS was designed for a capacity of 34%, hence both splice types were
designed as partial strength connections) Extended end-plate connection was
designed with a thick plate with no consideration for the prying forces.
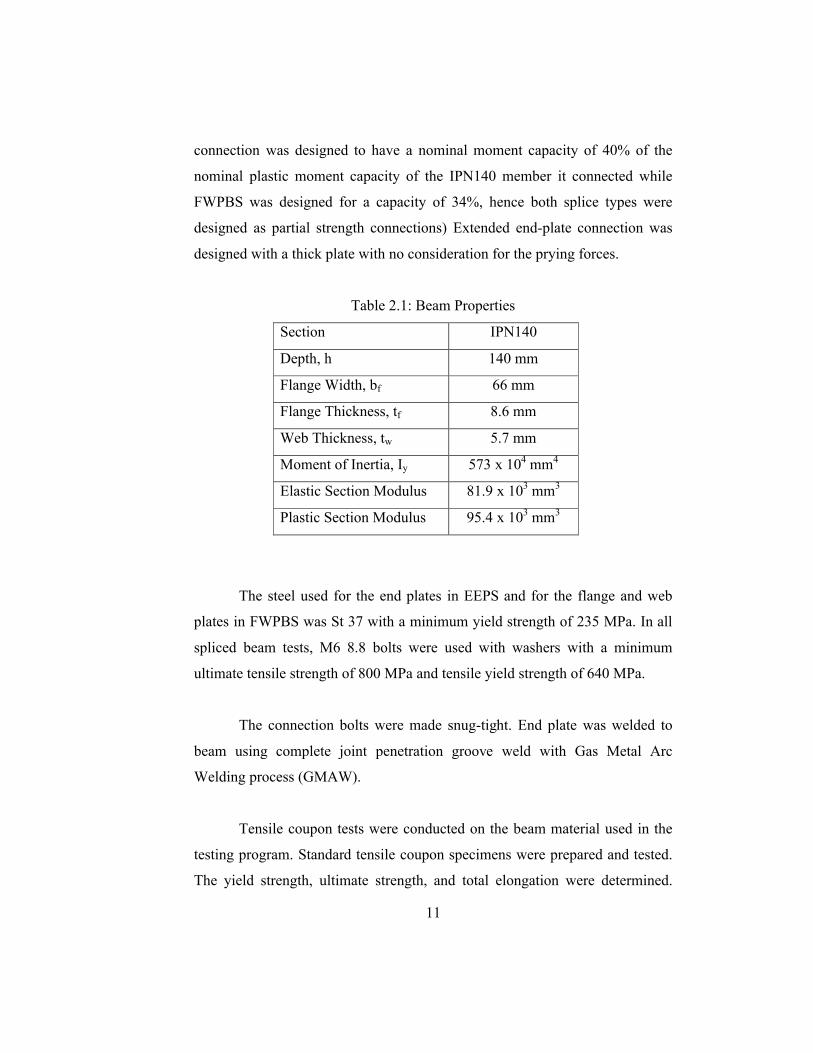
Table 2.1: Beam Properties
Section IPN140
Depth, h 140 mm
Flange Width, bf 66 mm
Flange Thickness, tf 8.6 mm
Web Thickness, tw 5.7 mm
Moment of Inertia, Iy 573 x 104 mm4
Elastic Section Modulus 81.9 x 103 mm3
Plastic Section Modulus 95.4 x 103 mm3
The steel used for the end plates in EEPS and for the flange and web
plates in FWPBS was St 37 with a minimum yield strength of 235 MPa. In all
spliced beam tests, M6 8.8 bolts were used with washers with a minimum
ultimate tensile strength of 800 MPa and tensile yield strength of 640 MPa.
The connection bolts were made snug-tight. End plate was welded to
beam using complete joint penetration groove weld with Gas Metal Arc
Welding process (GMAW).
Tensile coupon tests were conducted on the beam material used in the
testing program. Standard tensile coupon specimens were prepared and tested.
The yield strength, ultimate strength, and total elongation were determined.

12
Also bolt direct tension tests were conducted to find their ultimate strength.
The material tests revealed that the beam specimens had a yield strength of
325 MPa, ultimate strength of 485 MPa, and bolts had an ultimate tensile
strength of 830 MPa and ultimate shear strength of 450 MPa.
Four bolt extended unstiffened end plates with the same bolt layout
pattern were used for both EEPS tests (Tests 2&4). End-plates of 6 mm
thickness were used in Test 2 and 10 mm thickness were used in Test 4. The
end-plate connection nominal geometric dimensions are given in Table 2.2.
Table 2.2: End-plate connection geometric dimensions
Test
#
Bolt
Dia.&
Grade
End-Plate
Width, bp
(mm)
End-Plate
Thickness,
tp (mm)
End-Plate
Length,Lp
(mm)
End-Plate
Extension
pe (mm)
Pitch
pfi=pfo
(mm)
Gage
g
(mm)
2 M6 8.8 100 6 210 35 20 50
4 M6 8.8 100 10 210 35 20 50
The nominal connection geometric parameters shown in Table 2.2 are
defined in Figure 2.1.
The same bolt layout pattern was used for both FWPBS tests (Tests 3 &
5). Flange plates of 6 mm thickness were used in Test 3 instead of 10 mm
thickness plates in Test 5. Both tests used web plates of equal geometric
dimensions (120mmx80mmx3mm). The gap between beams at the splice
location was 10 mm in Test 3 while it was 5 mm in Test 5. The flange and web
plate bolted splice connection geometric dimensions are shown in Figure 2.2.

13
Figure 2.1: Four bolt end-plate connection geometry notation
Figure 2.2: Flange & web plate bolted connection dimensions (mm)

14
In design of members always a margin is provided not to reach limiting
requirements of the code. Most of these members are overdesigned by a factor.
In such a case, splices are most of the time designed for forces on the members
and not to capacity of the members. In investigated cases, the overdesign
factors are determined by dividing unspliced member design load to spliced
member design load. For instance, a 45 kN of design point load will develop
6.4 kN.m of design moment at the splice location, which is 20 cm from the
south interior support. Member selection of IPN140 results in over design of
member that can allow 60 kN of design point load in the absence of a splice.
Therefore, the over design factor for the member is 60/45=1.33 as simulated in
Test 2. Similar to this case, most of the splice connections are designed for
developing a lower spliced member capacity than the unspliced member
capacity.
As shown in Table 2.3, the overdesign factor is ranged from 1.33 to
2.61. The design details of splices are given in Appendix A.
Table 2.3: Overdesign factors for spliced members
Test Member Over Design Factor
Unspliced Member Design Load/Spliced Member Design Load
2 1.33
3 1.58
4 2.22
5 2.61

15
2.3 Test Setup
Mid span loading was applied using a hydraulic system with a loading
capacity of 40 tons. The test beams were pin connected to 50 cm long, 24 mm
diameter inclined rods at each end. The rods were connected by pins to 90 cm
long IPN140 support beams which in turn were supported by the reaction floor.
A photograph of a typical test setup is shown in Figure 2.3. The test setups for
each of the tests are shown in Figure 2.4.
Figure 2.3: Test setup for a typical test
The applied load was measured by a load cell placed at point of load
application at mid span. Also beam deflections were measured by LVDTs
placed at mid span and splice locations. The instrumentation was calibrated

16
prior to use and connected to a PC-based data acquisition system during
testing. The load cell has a capacity of 15 tons and displacement transducers
can measure up to 50 mm deflection.
a) Test setup for Test 1
b) Test setup for Test 2
Figure 2.4: Test setups for all tests (dimensions in mm)
SOUTH (S) NORTH (N)
S N

17
c) Test setup for Test 3
c) Test setup for Test 4
d) Test setup for Test 5
Figure 2.4 (cont`d): Test setups for all tests (dimensions in mm)
S N
S N
S N
18
2.4 Testing Procedure
Once the test specimen was erected under the reaction frame, the
displacement transducers and load cell were setup and connected to the data
acquisition system. The instrumentation was then zeroed.
An initial zero reading was recorded and the test was begun with
loading applied in increments of approximately 10 percent of the predicted
failure load. Data points were recorded and the load steps were applied until
the failure of the connection / beam was observed or until the capacity of
testing instruments was reached.
2.5 Test Results
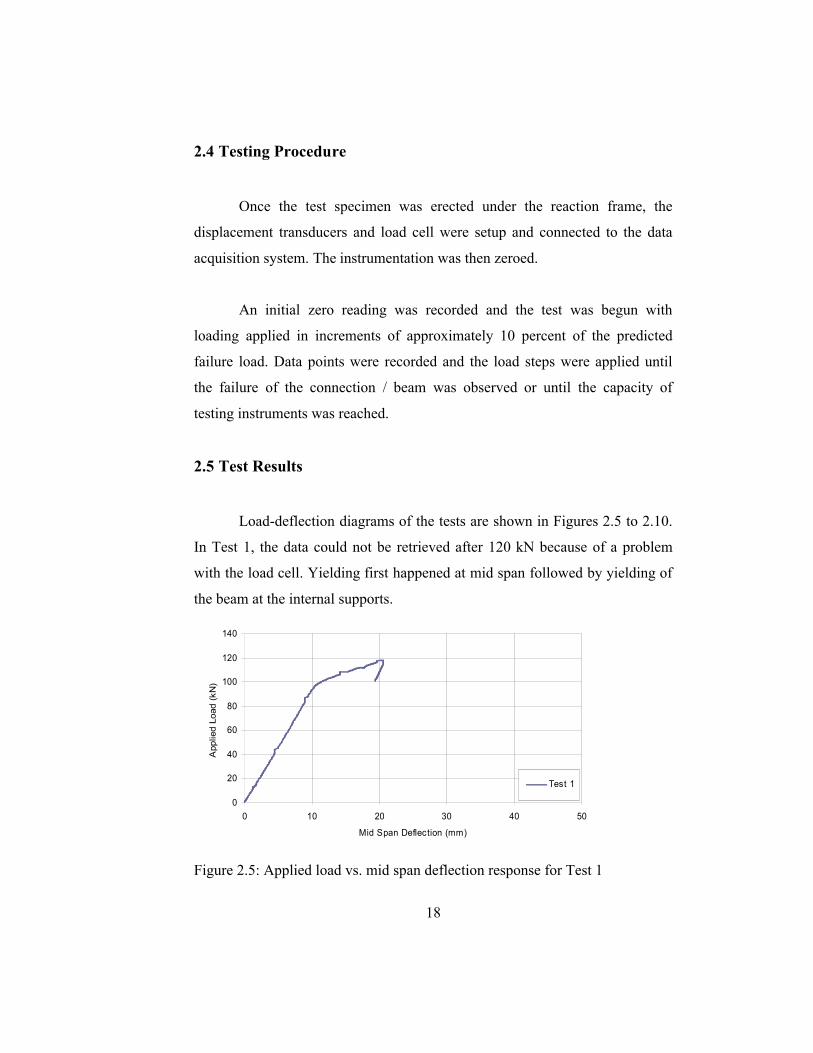
Load-deflection diagrams of the tests are shown in Figures 2.5 to 2.10.
In Test 1, the data could not be retrieved after 120 kN because of a problem
with the load cell. Yielding first happened at mid span followed by yielding of
the beam at the internal supports.
0
20
40
60
80
100
120
140
0 10 20 30 40 50
Mid Span Deflection (mm)
Applie
d L
oad (
kN
)
Test 1
Figure 2.5: Applied load vs. mid span deflection response for Test 1

19
In Test 2, EEPS was located 20 cm from internal support as shown in
Figure 2.4(b). The splice connection in this test like other splice connections in
the remaining tests was designed to be weaker than the beam, taking into
consideration the internal load effects determined from elastic analysis of the
beam without splice flexibility. Test results indicated that the beam yielded
first at mid-span following yielding over north support when mid-span
deflection reached to 30 mm. This was due to the effect of the splice flexibility,
increasing moment at mid span and north support and decreasing it at the splice
location. The nuts were observed to slip from the body of bolts at 110 kN
which was in agreement with the calculated capacity.
0
20
40
60
80
100
120
140
0 10 20 30 40 50
Mid Span Deflection (mm)
Applie
d L
oad (
kN
)
Test 2
Figure 2.6: Applied load vs. mid span deflection response for Test 2
In Test 3, FWPBS was located 20 cm from internal support. Even if the
load cell has 15 tons of capacity, the test was terminated a little bit over 10 tons
due to safety reasons before reaching the calculated capacity of 118 kN of the
specimen. Similar to Test 2, the beam yielded at the mid span and there was a
significant bending on the top flange plate of the connection.

20
0
20
40
60
80
100
120
140
0 10 20 30 40 50
Mid Span Deflection (mm)
Applie
d L
oad (
kN
)
Test 3
Figure 2.7: Applied load vs. mid span deflection response for Test 3
In test 4, the EEPS was located 20 cm from the mid span. The specimen
had a calculated capacity of 50 kN. Despite the performance observed in Test
2, negative moment zone, the splice was subjected to more moment and nuts
started to slip from body of bolts at 60 kN, which was the first sign of
significant damage. The rod at the south end of the support is thought to have
yielded and the load carrying system changed.
0
20
40
60
80
100
120
140
0 10 20 30 40 50
Mid Span Deflection (mm)
Applie
d L
oad (
kN
)
Test 4
Figure 2.8: Applied load vs. mid span deflection response for Test 4

21
In Test 5, FWPBS was located 20 cm from the mid-span. Test 5 had a
different boundary condition than Test 4 since south rod was not fully
functioning and it was fully broken at applied load of 90 kN. North interior
support yielded and the connection performed better than EEPS designed for
similar capacity.
0
20
40
60
80
100
120
140
0 10 20 30 40 50
Mid Span Deflection (mm)
Applie
d L
oad (
kN
)
Test 5
Figure 2.9: Applied load vs. mid span deflection response for Test 5
Superimposed test results are shown in Figure 2.10.
0
20
40
60
80
100
120
140
0 10 20 30 40 50
Mid Span Deflection (mm)
Applie
d L
oad (
kN
)
Test 1Test 2Test 3Test 4Test 5
Figure 2.10: Applied load vs. mid span deflection response for all tests

22
As observed from Figure 2.10, demonstrating superimposed load – mid
span deflection diagrams of all tests, using splices in the beams resulted in
significant reduction in rigidity of the beams when compared with the
unspliced beam in Test 1. Since the end plate splice was located in high
moment region, close to mid span in Test 4, failure of the connection was
observed early at 60 kN. Significant reduction of stiffness seen in Test 5 load
deflection diagram is thought to be caused by the damaged rod at the south
support. Photographs of specimens after testing for each of the tests are shown
in Figures 2.11 to 2.15.
Figure 2.11: Photograph of Test 1 specimen after test

23
Figure 2.12: Photograph of Test 2 specimen after test
Figure 2.13: Photograph of Test 3 specimen after test

24
Figure 2.14: Photograph of Test 4 specimen after test
Figure 2.15: Photograph of Test 5 specimen after test

25
CHAPTER 3
FINITE ELEMENT STUDY AND COMPARISON WITH
EXPERIMENTAL RESULTS
3.1 Finite Element Model
LARSA 4D, Structural and Earthquake Engineering Integrated Analysis
and Design Software, was used to create and analyze finite element models of
the two beam splice connections.
Numerical analysis of bolted connections depends heavily on
constitutive relationships, step size, number of integration points, kinematic
descriptions, element types and discretizations [11]. These items combined
with complex non-linear phenomena which are commonly observed in
connections make finite element modeling of connections difficult. In the
research, three dimensional finite element models were used to analyze the two
beam splice connection types in four tests. Rather than using highly
complicated and varied element types available in literature, a simple modeling
approach was utilized during preparation of finite element models of
connections. In any case, whether the simple or advanced non-linear
connection model is used in analysis, the residual stresses or locked in
construction forces cannot be incorporated into model, which will result in
inaccuracies in stress distribution and stress concentrations within the
investigated elements.

26
Nonlinear translational spring elements instead of solid elements were
used to model the bolts and again non-linear translational spring elements were
used to model the interaction between end plates instead of contact elements to
model the highly non-linear behavior. The comparisons between experimental
and analytical results at the end of the chapter can be used to analyze the
effectiveness of the approach followed. For global system checks, the proposed
non-linear splice modeling is observed to be in good agreement with the test
results even at post-yield zone. However, no completeness is claimed.
In the end plate type of spliced connections, the end plates were
modeled using 4 node quadrilateral plate elements. The plate element in
LARSA 4D is a planar element with constant thickness, with isotropic material
properties. It is a linear element with linear material properties. These elements
are designed to remain elastic.
The interaction of the end plates of the two spliced parts was modeled
using compression only translational spring elements in the axial direction of
the member placed on nodes of the plate elements. The load-deformation
relationship of these springs as used in the analysis is shown in Figure 3.1. An
arbitrarily large stiffness for these springs was selected to avoid penetration of
plate elements modeling end plates into each other.
The contact problem between two bodies is highly non-linear with
unknown boundary conditions. The friction between the end plates was
modeled using translational spring elements in the transverse directions placed
on the nodes of the plate elements which model the end plates. The load-
deformation property of these spring elements is shown in Figure 3.2. These
friction elements simulate an average friction on two end plate surfaces and
friction coefficient was taken as 0.25 [15]. The average normal force was

27
evaluated to be around 20% of yield strength of steel members. Static friction
force was determined from
Ffs = µFn (3.1)
where Ffs is the static friction force, µ is the static friction coefficient and Fn is
the average normal force. The relative displacement between two plates is
supposed to be 0. However a small number has to be entered into the analysis
program, representative of this situation. On static or kinematic friction
coefficient of steel to steel, there is not much consensus due to uncertainties in
determination of roughness of surfaces. In this study, kinematic coefficient was
selected to be significantly smaller than static coefficient.
The analyses were carried out once with modeling the friction with
these spring elements and once without considering friction since there is not
much agreement in industry or academia on how to simulate friction. The bolts
were modeled using spring elements with properties shown in Figures 3.3 &
3.4. The force-displacement relationships of the springs modeling the bolts
reflected the coupon tests of the bolts.
FEM model of the end plate splice connection is rendered in Figure 3.5
and a skeleton model is shown in Figure 3.6.

28
-1.40E+07
-1.20E+07
-1.00E+07
-8.00E+06
-6.00E+06
-4.00E+06
-2.00E+06
0.00E+00
2.00E+06
4.00E+06
-1 -0.5 0 0.5 1Deformation (m)
Force (kN)
Figure 3.1: Force – deformation relationship of compression only
spring elements modeling end-plate interaction
-90
-70
-50
-30
-10
10
30
50
70
90
-10 -5 0 5 10Deformation (mm)
Force (kN)
Figure 3.2: Force – deformation relationship of transverse direction
spring elements modeling friction between end-plates

29
-20
-15
-10
-5
0
5
10
15
20
-20 -15 -10 -5 0 5 10 15 20Deformation (mm)
Force (kN)
Figure 3.3: Force – deformation relationship of axial direction spring
elements modeling bolt tensile action
-10
-8
-6
-4
-2
0
2
4
6
8
10
-20 -15 -10 -5 0 5 10 15 20Deformation (mm)
Force (kN)
Figure 3.4: Force – deformation relationship of transverse direction
spring elements modeling bolt shear action

30
Figure 3.5: Rendered finite element model of the end-plate splice connection
Figure 3.6: Skeleton finite element model of the end-plate splice connection
Spring elements modeling bolts
Plate element modeling endplate
Hysteretic element modeling beam
Spring element modeling endplate interaction
Rigid elements

31
A bi-linear stress strain relationship was utilized for the structural steel
hysteretic elements modeling the connected beam. The post yield to initial
slope ratio of 0.02 was used. The yield strength, Fy, of 325 N/mm2, which was
determined from the coupon tests was used.
The hysteretic beam element was connected to the plate elements in
such a way that the end of beam was modeled by rigid elements in depth to
simulate the plane sections remain plane and normal sections remain normal
condition to avoid stress concentrations at plate elements near neutral axis of
the hysteretic beam element.
In the flange & web plate bolted splice connections the flange and web
plates and the beam in the connection region were modeled again using the 4
node quadrilateral plate elements, which remain essentially elastic. A possible
weak axis bending plastification at the gap can be ignored since the stiffness
contribution of plate bending stiffness around its weak axis is insignificant
compared to plate stiffness developed by its area around neutral axis of the
connection. The bolts were modeled using the same spring elements used in the
EEPS connection. Connection model of the flange and web plate splice is
rendered in Figure 3.7 and a skeleton model is shown in Figure 3.8. The beam
outside of connection region was modeled with hysteretic element with a yield
strength of 325 MPa.
The hysteretic beam elements were connected to the plate elements in a
similar way explained in the previous connection detail. Again plane sections
remain plane and normals remain normal conditions are satisfied.

32
Figure 3.7: Rendered finite element model of the flange & web plate bolted
splice connection
Figure 3.8: Skeleton finite element model of the flange & web plate bolted
splice connection
Spring element modeling bearing between flanges
Spring elements modeling flange bolts
Spring element modeling web bolts
Rigid elements

33
In all models full boundary conditions were incorporated into model as
shown in Figures 3.9 & 3.10. As stated in Chapter 2, the rod at the south
support is believed to be damaged in Test 4, when the nuts slipped from the
body of the bolt. So the south rod in the FEM analysis of Test 5 was modeled
with reduced section properties.
Figure 3.9: Modeled boundary conditions in end-plate splice
Figure 3.10: Modeled boundary conditions in flange & web plate bolted splice

34
3.2 Comparison of Results
All test results were able to be predicted both in elastic and plastic
range with a good accuracy using the modeling described above as shown in
Figures 3.11, 3.13, 3.15, 3.17 and 3.19. Deformed shapes of the finite element
models of the test setups are shown in Figures 3.12, 3.14, 3.16, 3.18 and 3.20.
0
20
40
60
80
100
120
140
0 10 20 30 40 50
Mid Span Deflection (mm)
Applie
d L
oad (
kN
)
Test 1
Analysis 1
Figure 3.11: Test and analysis results compared for Test 1
Figure 3.12: Deformed shape of the FEM of the Test 1 setup

35
0
20
40
60
80
100
120
140
0 10 20 30 40 50
Mid Span Deflection (mm)
Applie
d L
oad (
kN
)
Test 2Analysis 2 with friction
Analysis 2 w/o friction
Figure 3.13: Test and analysis results compared for Test 2
Figure 3.14: Deformed shape of the FEM of the Test 2 setup

36
0
20
40
60
80
100
120
140
0 10 20 30 40 50
Mid Span Deflection (mm)
Applie
d L
oad (
kN
)
Test 3
Analysis 3
Figure 3.15: Test and analysis results compared for Test 3
Figure 3.16: Deformed shape of the FEM of the Test 3 setup

37
0
20
40
60
80
100
120
140
0 10 20 30 40 50
Mid Span Deflection (mm)
Applie
d L
oad (
kN
)
Test 4Analysis 4 with frictionAnalysis 4 w/o friction
Figure 3.17: Test and analysis results compared for Test 4
Figure 3.18: Deformed shape of the FEM of the Test 4 setup

38
0
20
40
60
80
100
120
140
0 10 20 30 40 50
Mid Span Deflection (mm)
Applie
d L
oad (
kN
)
Test 5Analysis 5
Figure 3.19: Test and analysis results compared for Test 5
Figure 3.20: Deformed shape of the FEM of the Test 5 setup

39
Secant stiffness values obtained from experiments and FEM analyses
are summarized in Table 3.1.
Table 3.1: Secant stiffness values obtained from tests and FEM analyses
Secant Stiffness (kN/mm) % of Softening of
System Stiffness
(Analysis)
Test # Test
FEM with
friction
Diff.fromtest
FEM w/o frict.
Diff.fromtest
% of Softening of System Stiffness
(Test) with frict.
w/o frict.
1 9.31 8.90 4.4% - -2 7.59 8.31 9.5% 7.84 3.3% 18.5% 6.6 11.93 7.47 7.80 4.4% - - 19.8% 12.44 5.08 5.10 0.4% 4.89 3.7% 45.4% 42.7 455 2.96 2.89 2.4% - - 51.8% 52.9
As observed from Table 3.1, FEM analyses of the specimens resulted in
secant stiffness values differing from the experiment results varying from 0.4%
to 9.5%. Friction effects seem to be rather limited.
Percentage of softening in system stiffness, %S, was determined from
the following equation:
% S = (1 – Kspl/Kunspl) x 100 (3.2)
where Kspl is the spliced structure secant stiffness and Kunspl is the unspliced
structure secant stiffness. In %S computation the Kunspl term is taken equal to
Test 1 secant stiffness, which is 9.31 kN/mm. However, due to the boundary
condition change at Test 5, the Kunspl is taken from analysis as 6.14 kN/mm.

40
In Figure 3.21, percentage of softening in system stiffness values of
both splice connection types obtained from experiments and finite element
method analyses for different over design factors are plotted.
0
10
20
30
40
50
60
1 1.2 1.4 1.6 1.8 2 2.2 2.4 2.6 2.8
Unspliced Member Design Load/Spliced Member Design Load
% o
f S
ofte
ning
in S
yste
m S
tiffn
ess
EEPS - Neg.Mom.ZoneEEPS - Pos.Mom.ZoneFWPBS - Neg.Mom.ZoneFWPBS - Pos.Mom.ZoneEEPS - TestFWPBS Test
Figure 3.21: % of softening of system stiffness vs overdesign factors
As observed from the experimental data in Figure 3.21, over design
factor (unspliced member design load/spliced member design load) has a
significant effect on structural softening of the system. As the over design
factor increases, softening of the system increases that means the weaker the
connections are with respect to member, vulnerability of softening increases,
endangering the serviceability of the system. Test results indicate that FWPBS
have a better splice performance than EEPS in terms of percentage of softening
in system.
From the analysis results, weaker splice connections are observed to be
resulting in structural softening of the system. In terms of softening trend, the

41
analytical results and test results are in good agreement. Except Test 5 results,
analytical methods result in underestimation of softening by 3% to 12%.
The deformed shapes of the finite element models of the splice
connections are seen in Figures 3.22, 3.24, 3.26 and 3.28. The photographs of
the same connections after corresponding experiments are seen in Figures 3.23,
3.25, 3.27 and 3.29.

42
Figure 3.22: Deformed shape of the FEM of the Test 2 end plate splice
Figure 3.23: Photograph of Test 2 end plate splice after experiment

43
Figure 3.24: Deformed shape of the FEM of the Test 3 flange and web plate
bolted splice
Figure 3.25: Photograph of Test 3 flange and web plate splice after experiment

44
Figure 3.26: Deformed shape of the FEM of the Test 4 end plate splice
Figure 3.27: Photograph of Test 4 end plate splice after experiment

45
Figure 3.28: Deformed shape of the FEM of the Test 5 flange and web plate
bolted splice
Figure 3.29: Photograph of Test 5 flange and web plate splice after experiment

46
CHAPTER 4
COMPARISON OF ANALYSIS RESULTS WITH AND
WITHOUT SPLICES
4.1 Verification of Experimental and Numerical Analysis Results
With A Simple Analysis Method in Elastic Range
The spliced beams tested in the experiments are analyzed in this section
under their design loads first without considering the flexibility of the splice
connections. The moment diagrams obtained in this manner are shown in
Figures 4.1(a), 4.2(a), 4.3(a) and 4.4(a).
The moment diagrams obtained from plastic analysis in the elastic
range incorporating the FEM of the splice connection in the model resulted in
the moment diagrams shown in Figures 4.1(b), 4.2(b), 4.3(b) and 4.4(b).
The moment diagrams obtained from elastic analysis in which 80%
moment releases were placed at splice connection locations are shown in
Figures 4.1(c), 4.2(c), 4.3(c) and 4.4(c).

47
a) Linear Elastic Analysis (P=45 kN)
b) Plastic Analysis – in elastic range (P= 45 kN) – end plate connection
modeled with FEM and non-linear springs
c) Linear Elastic Analysis (P= 45 kN) – moment released at end plate
splice location by 80%
Figure 4.1: Moment Diagrams for Test 2 beam (kN.m)

48
a) Linear Elastic Analysis (P=38 kN)
b) Plastic Analysis – in elastic range (P= 38 kN) – FWPBS modeled with FEM
and non-linear springs
c) Linear Elastic Analysis (P= 38 kN) – moment released at FWPBS location
by 80%
Figure 4.2: Moment Diagrams for Test 3 beam (kN.m)

49
a) Linear Elastic Analysis (P=27 kN)
b) Plastic Analysis – in elastic range (P= 27 kN) – end plate connection
modeled with FEM and non-linear springs
c) Linear Elastic Analysis (P= 27 kN) – moment released at end plate splice
location by 80%
Figure 4.3: Moment Diagrams for Test 4 beam (kN.m)

50
a) Linear Elastic Analysis (P=23 kN)
b) Plastic Analysis – in elastic range (P= 23 kN) – FWPBS modeled with FEM
and non-linear springs
c) Linear Elastic Analysis (P= 23 kN) – moment released at FWPBS location
by 80%
Figure 4.4: Moment Diagrams for Test 5 beam (kN.m)

51
The moment values and mid span deflections obtained from these
analyses and percent differences between the analyses results with and without
splices are summarized in Table 4.1 and Table 4.2.
Table 4.1: Summary of analysis results for test cases
Moments (kN.m)Test
#Model Type Mid
SpanDiff.
South Support
Diff.North
SupportDiff.
No Splice 15 - 10.9 - 10.9 -Splice - FEM 17.2 14.7% 6.8 37.6% 9.8 10.1%2
Splice80% Release
17.2 14.7% 7.5 31.2% 9.9 9.2%
No Splice 12.7 - 9.2 - 9.2 -Splice-FEM 15.3 20.5% 5.4 41.3% 8.4 8.7%3
Splice80% Release
14.5 14.2% 6.4 30.4% 8.3 9.8%
No Splice 9 - 6.5 - 6.5 -Splice-FEM 6.5 27.8% 9.7 49.2% 9.4 44.6%4
Splice80% Release
6.4 28.9% 9.4 44.6% 8.9 36.9%
No Splice 7.7 - 5.6 - 5.6 -Splice-FEM 5 35.1% 7.9 41.1% 7.5 33.9%5
Splice80% Release
5.5 28.6% 8 42.9% 7.5 33.9%
As observed from Table 4.1, incorporation of splice flexibility at the
splice location via the FEM of the connection which was shown to produce
comparable results with experiments in the previous chapter, results in changes
in design moment values varying from 9% to 49%. Thus the assumption of
continuity at the splice location and the load effects obtained as a consequence
of this assumption seems not to be reflecting the real situation.

52
Table 4.2: Summary of mid span displacements for test cases
As observed from Table 4.2, incorporation of splice flexibility at the
splice location via the FEM of the connection, results in changes in mid span
deflections varying from 15% to 55%.
Also it is observed from the analysis results that inserting the FEM of
the specific splice type or an 80% moment release at the splice connection
location produces comparable results.
Test #
Model TypeMid-Span Deflection
(mm)Difference
No Splice 4.07Splice - FEM 4.69 15%2
Splice-80%Release 4.94 21%No Splice 3.43
Splice-FEM 4.15 21%3Splice-80%Release 4.17 22%
No Splice 2.44Splice-FEM 3.77 55%4
Splice-80%Release 3.95 62%No Splice 2.08
Splice-FEM 2.95 42%5Splice-80%Release 3.36 62%

53
CHAPTER 5
SUMMARY AND CONCLUSIONS
5.1 Summary
Beam splices, which can be used due to construction or design
requirements, are typically located in regions where internal forces are low.
Most design specifications require beam splices to be designed for moment and
shear values determined from analysis occurring at the location of the splice or
for some minimum strength. Hence, these splice connections are most of the
time partial strength, partially restrained connections. In structural analysis the
flexibility introduced by the splice at the splice location is typically ignored.
The appropriateness of this approach of, neglecting the splices in the analysis
and analyzing the structure assuming continuous members at splice locations,
is investigated in this research thorough a combined experimental program and
finite element model analysis.
In the experimental program, described in Chapter 2, the behavior of
two types of partial strength splice connections and the effect of this behavior
on the distribution of internal load effects in the test beams were investigated.
Finite element models of the splice connections were prepared and analyses of
finite element models of the test setups with complete boundary conditions
were done following the experiments. The design elastic analyses of the test
setups were done in Chapter 4 once without splices and then with splices which
were incorporated into the structural system through either a FEM of the splice

54
or an 80% moment release at the splice location. Comparisons were made
between the analyses with splices and without splices.
5.2 Conclusions
The conclusions of this study can be summarized as follows:
- Splice connection flexibility is very important to define in analysis to
simulate the accurate structural response.
- While the practice of locating the splices at low moment regions is an
appropriate approach still it is important to define splice flexibility in
the analysis of these structures. The moderate difference between the
design moment diagrams and real behavior may become a high
difference under unfavorable loading arrangements which increase the
moment at the splice locations.
- The splice behavior can be incorporated into the analysis thorough
- Conducting experiments on the specific splice connection type
and inserting the observed moment rotation characteristics of the
specific connection type into the analysis.
- The FEMs developed in this research of two different specific
splice types can be used as a starting point for modeling same type
splices and with different geometries, and then these FEMs may be
used to investigate the behavior of connections and may be used in
the analysis of the system.

55
- The simplified approach of inserting an 80% stiffness moment
release has been shown to produce similar results both to the results
of FEM analysis and experiments. It should be mentioned that the
splices were designed to be partial strength and to have 34-40% of
the strength of the unspliced members in this study. So in the
specific analyses to be conducted, the splice strengths must be
evaluated with respect to the member strength and higher or lower
percentages of moment release may be suitable.
- Experimental results indicate that beam without a splice performs better
than a beam with a splice when structural responses are compared.
- Among the two investigated splices, extended end plate splice
connection resulted in an early bolt connection failure compared to
flange and web plate bolted splice connection designed per AISC.
- Each type of splice connection softens the rigidity of the structure and
end plate splice connection is observed to be the softest one compared
to flange and web plate bolted splice.
- The weaker the connections are with respect to member, vulnerability
of softening increases, endangering the serviceability of the system
- A design based on an analysis without simulation of splice connections
can significantly underestimate vertical deflections due to live load. In
any case, partial strength splices soften the structural response
endangering serviceability.

56
5.3 Suggestions
Splice connections designed to full strength of the members can be
tested to understand their effect on flexibility of the system.

57
REFERENCES
[1] Salmon C.G., Johnson J.E., 1996, “Steel Structures: Design and
Behavior Emphasizing Load and Resistance Factor Design, 4th
Edition”, Prentice Hall, New Jersey
[2] American Institute of Steel Construction, Inc. (AISC), 2005,
“Specification for Structural Steel Buildings”, Chicago, IL.
[3] European Committee for Standardization, 2003, “Eurocode 3: Design
of Steel Structures - Part 1-8: Design of Joints, prEN 1993-1-8-2003”,
Belgium
[4] American Association of State Highway and Transportation Officials,
(AASHTO), 1996, “Standard Specifications for Highway Bridges”,
Washington D.C.
[5] American Institute of Steel Construction, Inc. (AISC), 1994, “Manual
of Steel Construction - Load & Resistance Factor Design, 2nd Ed.”,
Chicago, IL.
[6] Hart W.H., Milek W.A., 1965, “Splices in Plastically Designed
Continuous Structures”, Engineering Journal, AISC, No.2., 33-37
[7] Sumner E.A., 2003, “Unified Design of Extended End-Plate Moment
Connections Subject to Cyclic Loading”, Phd. Thesis, Department of
Civil Engineering, Virginia Polytechnic Institute and State University

58
[8] Murray T.M., Shoemaker W.L., 2002, “Steel Design Guide Series 16,
Flush and Extended Multiple-Row Moment End-Plate Connections”,
American Institute of Steel Construction, Inc., Chicago, IL.
[9] Murray T.M., Sumner E.A., 2004, “Steel Design Guide 4, Extended
End-Plate Moment Connections, Seismic and Wind Applications, 2nd
Edition”, American Institute of Steel Construction, Inc., Chicago, IL.
[10] Sherbourne A.N., Bahaari M.R., 1994, “3-D Simulation of End-Plate
Bolted Connections”, Journal of Structural Engineering, Vol.120,
No.11, 3122-36
[11] Choi C.K., Chung G.T., 1996, “Refined Three-Dimensional Finite
Element Model for End-Plate Connection”, Journal of Structural
Engineering, ASCE, 122(11), 1307-1316
[12] Bursi O.S., Jaspart J.P., 1998, “Basic Issues in the Finite Element
Simulation of Extended End Plate Connections”, Computers &
Structures, Pergamon, 69(3), 361-382
[13] Beam Splice Moment Connection, University of Wyoming College of
Engineering, 2008, “wwweng.uwyo.edu/connections/connection8.html”
[14] Sheikh-Ibrahim F.I., Frank K.H., 1998, “The Ultimate Strength of
Symmetric Beam Bolted Splices”, Engineering Journal, 3rd Quarter,
106-118
[15] Prestressed Concrete Institute, PCI Design Handbook, 3rd Edition,
Chicago, Illinois

59
APPENDIX A
DESIGN OF TEST SETUPS
1. Design of Test Setup – End Plate Splice
In this section the recommended steps to design a bolted end plate
moment connection as per AISC Design Guide 4 are summarized along with
the design calculations performed in the design of Test 2 beam splice
connection. IPN140 beams of St 37 steel used in the tests have the following
tabulated geometric properties shown in Table A.1.1.
Table A.1.1: Beam Properties
Section IPN140
Depth, h 140 mm
Flange Width, bf 66 mm
Flange Thickness, tf 8.6 mm
Web Thickness, tw 5.7 mm
Moment of Inertia, Iy 573 x 104 mm4
Elastic Section Modulus 81.9 x 103 mm3
Plastic Section Modulus 95.4 x 103 mm3

60
The design steps followed are as follows:
1. Determine the required connection design moment and design shear
From elastic analysis of the beam under 45 kN as shown in Section 4.1,
mkNu .4.6
kNVu 5.22
2. Select an end plate moment connection configuration and establish
preliminary values for the connection geometry (g, pfi, pfo, pe etc) and bolt grade.
Four bolt extended end plate moment connection with following connection
geometric properties is selected. 8.8 grade bolts are to be selected for the
connection.
bp = 100 mm (end plate width) Lp = 210 mm (end plate length)
pe = 35 mm (end plate extension) pfi=pfo = 20 mm (inner & outer pitch)
g = 50 mm (gage)
3. Determine the required bolt diameter, db Req`d
db Req`d = )(
2
1hhF
M
ot
u
Mu = 6.4 kN.m
Ft = 600 MPa (reduced bolt tensile strength = 0.75 x 800)
ho = 155.7 mm
h1 = 107.1 mm
db Req`d = )1.1077.155(60075.0
104.62 6
= 5.9 mm Use M6

61
4. Calculate the no prying bolt moment strength, Mnp
Mnp = )(2 10 hhPt
Pt = Bolt tensile strength = 16.1 kN
Mnp= )1071.01557.0(1.162 = 8.5 kN.m
5. Determine the required end plate thickness,
tp Req`d = pypb
np
YF
M
11.1
Fyp= the end plate material yield strength
Yp= the end plate yield line mechanism parameter from Table 3.1 of AISC
Design Guide 4
tp Req`d =934.9522359.0
105.875.011.1 6
= 5.9 mm
6. Calculate the factored beam flange force
Ffu = fb
u
td
; d = depth of the beam
Ffu = 6.8140
104.6 3
= 48.7 kN
Use 6 mm

62
7. Check shear yielding resistance of the extended portion of the four-bolt
extended unstiffened end plate:
ppypnfu tbFR
F6.0
2
9.0
pb width of the end plate
14.761000/61002356.09.035.242
7.48
8. Check shear rupture resistance of the extended portion of the end plate
nupnfu AFR
F6.0
2
75.0
Fup = minimum tensile strength of the end plate
An = net area of the end plate
84)1000/5043706.075.0(2/7.48
9. The bolt shear rupture strength of the connection is conservatively assumed
to be provided by the bolts at compression flange, thus
bvbnu AFnRV
nb = number of bolts at the compression flange
Fv = nominal reduced shear strength of bolts
14.271000/3.28)8004.0(475.05.22
OK
OK

63
10. Check bolt bearing / tear out failure of the end plate
noninu RnRnRV
ni = number of inner bolts = 2
no = number of outer bolts = 2
Rn = ubuc tFdtFL 4.22.1
Lc = clear distance, in the direction of force between the edge of hole and the
edge of the adjacent hole or edge of the material
t = end plate thickness
Fu = minimum tensile strength of end plate
1000/))]3706112.1(75.02())370664.2(75.02[(5.22
OK.
The design steps for Test 4 beam which also utilizes an extended end
plate splice connection is not listed here, since same splice connection with
same geometric and material properties as summarized above is used in Test 4
except with an end plate thickness of 10 mm instead of a 6 mm end plate as is
used in Test 2. Since in Test 4, the splice is located in a higher moment zone
the design factored load which produces the design strength of the splice is
27 kN. The effect of increasing the end plate thickness is to increase the
flexural yielding strength of the end plate, so again the design is for a thick end
plate connection without prying forces considered.

64
2. Design of Test Setup – Flange and Web Plate Bolted Splice
In this section the recommended steps to design a flange and web plate
bolted splice connection as per AISC LRFD Manual of Steel Construction, are
summarized along with the design calculations performed in the design of Test
3 beam splice connection.
1. Determine the required connection design moment and design shear
From elastic analysis of the beam under 38 kN as shown in Section 4.1,
mkNu .4.5
kNVu 19
Check the following limit states :
2. Flange Bolts Shear Rupture
dAFnRM bvbnu
nb = number of bolts at one side of a flange plate
Fv = nominal reduced shear strength of bolts (Use M6 8.8 bolts again)
Ab = nominal gross area of bolt
d = beam depth
Assume nb as 6
7.510/1403.28)8004.0(675.04.5 6 OK

65
3. Tension Yielding of Flange Plate
Ffu = d
u ; gynfu AFRF
Ffu = 140
104.5 3= 38.6 kN
Take dimensions of 170mm x 55 mm x 6 mm for the flange plate
8.691000/6552359.06.38
4. Tension Rupture of Flange Plate
nunfu AFRF
2234)6)26(2()655( mmAn
651000/23437075.06.38
5. Flange Plate Bearing
noninfu RnRnRF
Rn = ubuc tFdtFL 4.22.1
1401000/)]3706112.175.02())370664.2(75.04[(6.38
OK
OK
OK
Factored beam flange force

66
6. Beam Flange Bearing
Need not be checked since flange thickness is higher than flange plate
thickness
7. Block Shear Rupture of Flange Plate
nfu RF
Rn = ntugvyntunvu AFAFAFAF 6.06.0
kNRn 1471023707802356.01023705403706.0
11014775.06.38
8. Compressive Strength of Flange Plate
Assume K=0.65 and l=40 mm
25.1
)655(
12/)655(
4065.03
r
Kl
AFR crn
6.38701000/655211 nR
OK
ØFcr=211 MPa from Table 3-36 of LRFD Manual
OK

67
9. Shear Rupture of Web Bolts
Web will carry shear and moment due to eccentricity of shear
Try 6 bolts in the web
kNAFAFR bubnvn 8.61000/3.288004.075.04.0
kNkNVu 8.674.347.2)235.112/19( 22
10. Shear Yielding of Web Plates
mAFRV gynu 6.0
Take dimensions of 120mm x 80 mm x 3 mm for the web plate
kN9.601000/23802356.09.019
11. Shear Rupture of Web Plates
mAFRV nvunu 6.0
kN9.551000/21683706.075.019 OK
Design shear rupture strength of a single bolt
OK
OK

68
12. Block Shear Rupture of Web Plate
nfu RF
Rn = ntugvyntunvu AFAFAFAF 6.06.0
kNRn 1471023707802356.01023705403706.0
220214775.019
The design steps for Test 5 beam which also utilizes a flange and web
plate bolted splice connection is not listed here, since same splice connection
with same geometric and material properties as summarized above is used in
Test 5 except with a flange plate thickness of 10 mm instead of a 6 mm flange
plate as is used in Test 3. Since in Test 5, the splice is located in a higher
moment zone the design factored load which produces the design strength of
the splice is 23 kN.
OK