detailed concept of the sysml lightweight visualization in
TRANSCRIPT

INTERNATIONAL DESIGN CONFERENCE - DESIGN 2018 https://doi.org/10.21278/idc.2018.0421
DETAILED CONCEPT OF THE SYSML LIGHTWEIGHT VISUALIZATION IN PDM SYSTEMS
C. Nigischer and D. Gerhard
Abstract Cyber-Physical Systems (CPS) are prime examples for the ongoing trend of increasing product complexity within technical systems. Abstract modelling languages like the Systems Modelling Language (SysML) provide a solid basis to handle cross-domain complexity, but have weaknesses concerning data exchange. The paper presents a detailed concept of a lightweight visualization approach of SysML models in Product Data Management Systems. This approach allows SysML model visualization without using specific authoring tools, resulting in a more flexible model data exchange between development partners.
Keywords: systems engineering (SE), visualisation, model based engineering, model data exchange, systems modeling language (SysML)
1. Introduction The ongoing trend of increasing product complexity especially in context with the 4th Industrial Revolution – often abbreviated as “Industry 4.0” – influences product development processes, frameworks and tools to a great extent. Sztipanovits et al. (2011) state that the heterogeneity of structure and behaviour of Cyber-Physical Systems (CPS) induces the need for intensified cross-domain collaboration in many aspects to handle system integration challenges. One crucial aspect are the heterogeneous abstraction layers used across different design processes and development phases. Product design guidelines that support Model-Based Systems Engineering (MBSE) like the well-established V model described in the VDI 2206 (2004) suggest abstract modelling already in the early stages of product development as basis for the following domain-specific detailed modelling activities. One modelling language that can be used to define an abstract system model is the Systems Modelling Language (SysML) specified by the Object Management Group (OMG, 2017). The modelling process itself is supported by special SysML authoring tools, while the models are often saved in Product Data Management Systems (PDMS) to ensure data consistency, version control and other data management functionalities. PDMS are often designated as data backbones for Product Lifecycle Management (PLM) activities and therefore a central platform for all product data along the product lifecycle. As already mentioned above, the development of complex systems demands the collaboration of a variety of specialists from different domains, often geographically separated. Hence, data exchange becomes a crucial factor, but exchange of model data between different IT systems is still a big challenge because of divergent file formats used by software tool vendors. To be able to forward SysML models generated in the conceptual design stages of product development to development partners as easy as possible, this paper will describe a concept for a generic lightweight visualization of SysML models in PDM systems without using the vendor specific proprietary model files. The approach is inspired by Computer-Aided
SYSTEMS ENGINEERING AND DESIGN 2925

Design (CAD) data exchange based on neutral data formats. While the basic concept of the lightweight visualization approach of SysML models in PDM systems was already introduced in Nigischer and Gerhard (2017), this work gives an insight into the advanced stages of the detailed concept. Section 2 recapitulates the basic concept and refers to similar research activities. The overall research methodology is sketched in Section 3. In Section 4 the pre-visualization data extraction and preparation process is discussed. The structure of the aspired generic visualization – so-called “layer model” – and some user functionalities for the visualized model are presented in Section 5.
2. Previous and related work This section gives a brief overview of related work.
2.1. Basic concept of lightweight visualization of SysML models in PDM systems The idea of the lightweight visualization approach is to provide a possibility to display SysML models created by different authoring tools in a generic way. Generic in this case means that the SysML model is not displayed as usual in form of different interconnected diagrams, but as a comprehensive layer model. The model visualization consists of layer sets which represent the design phases “Requirement”, “Function”, “Logical” and “Physical” of the RFLP design approach - a mock-up is depicted in Figure 4. A more detailed description of the RFLP approach can be found in Eigner et al. (2012). The designation “lightweight” originates from the similarity of the concept with the Jupiter Tesselation (JT) visualization approach of CAD models in PDM systems. The standardized JT file format is used to store a lightweight copy of the original model in addition to the proprietary model data in a PDM system. This copy is easy to display and provides a graphical preview of the original CAD model. Further information regarding JT can be found e.g. in the work of Katzenbach et al. (2013).
Figure 1. Basic approach of using a lightweight visualization of SysML models in a
PDM system (Nigischer and Gerhard, 2017)
System modellers create SysML models with aid of special authoring tools. These models are stored as proprietary model files in a PDM system. As shown in Figure 1, additional XML Metadata Interchange (XMI) files with basically the same model information – but often without graphical diagram information - are generated by the authoring tools and stored in the PDM system too. XMI is a neutral data format specified by the Object Management Group (OMG) and shall ease the data exchange between different modelling tools (OMG, 2015). The additional XMI model files are preprocessed and converted by a XMI interpreter. Details regarding the XMI interpreter are presented in Section 4. The converted model data is forwarded to the visualization module which generates an abstracted graphical
2926 SYSTEMS ENGINEERING AND DESIGN

representation of the SysML model in form of a so-called layer model. The visualization module also provides useful functionalities for model analysis. Further information to the visualization module is given in Section 5.
2.2. Other related work Eigner et al. (2012) developed a data schema for functional product descriptions in PDM systems following the RFLP approach. Due to implementation of the suggested data structure it would be possible to store and access every single artefact of a system model directly in the PDM system. In contrast the lightweight visualization gives a preview of the model without creating new data structures in a PDM system. The Interactive Visualization Engine for SysML Tools (InVEST) introduced by Trase and Fink (2014) extracts SysML data from authoring tool reports and presents it in an abstracted way in various charts. Another visualization software tool called Visualization of SysML Meta-model Architecture (VoSMA) was introduced by García (2013). Similar to the InVEST tool it presents especially hierarchical SysML data using established visualization techniques, for instance tree maps. Both tools respectively frameworks share the need for data extraction from different SysML authoring tools with the lightweight visualization approach. Gajer et al. (2001) highlight the importance of displaying graphs as a whole to show the global graph structure and present a novel method for drawing large graphs. SysML models of complex systems can get really large as well, so efficient graph drawing methods are strongly demanded in later implementation phases of the lightweight visualization approach. With regard to the user functionalities that allow various analyses of the abstracted SysML model, Von Landesberger et al. (2011) give an extensive overview of State-of-the-Art techniques for visual analysis of large graphs.
3. Research methodology The extract-abstract-present paradigm described by Tilley et al. (1996), which is commonly used in software architecture reconstruction, is used in an adapted version as basic research methodology to define the process of the lightweight visualization approach. As depicted in Figure 2, the first step is represented by data extraction from a SysML model file. In a second step the graphical appearance of SysML model elements and relationships is abstracted to meet the requirements of the aspired alternative visual representation. The third and last step is the spatial arrangement of model elements and relationships to provide a generic visualization of a SysML model, called layer model.
Figure 2. Extract-abstract-present paradigm modified for the lightweight
visualization approach
After the software prototype implementation is completed, several SysML models will be used for testing and validation activities.
4. Data extraction and preparation Starting point for the XMI interpreter is a XMI model file that was exported from a SysML authoring tool and stored in the PDM system. The interpreters overall task of converting the SysML model captured in the XMI export file can be divided into four crucial steps:
1. Parsing 2. Interpreting 3. Design phase assignment 4. Model artefact selection for visualization
SYSTEMS ENGINEERING AND DESIGN 2927
After performing these 4 steps, the converted model data is forwarded to the visualization module. Deepening the roughly outlined data extraction process by Nigischer and Gerhard (2017), following subsections describe the steps in detail with focus on the technical implementation of the concept.
4.1. Parsing To extract SysML model data from a given XMI file, it is necessary to parse the XML structured content of the file. As an example, there are three basic parsing approaches in the Java community (García, 2013):
Tree-based Application Programming Interfaces (APIs) Event-based APIs Specific string manipulation parsing
Tree-based APIs like the Document Object Model (DOM) API (W3C, 2005) generate a tree model from the XML document. Because the entire tree model object is kept in memory, the DOM approach is more memory intensive than the Simple API for XML (SAX), which is a representative of the group of event-based APIs (SAX, 2004). Due to the event driven approach SAX is able to operate just portions of XML files and forward it to a client application (Harold, 2002). While the memory efficiency may cause problems with large model files, the possibility to navigate through the whole tree structure and the changeability of the node structure can be an advantage of DOM parsers (Nuccitelli et al., 2010). The third option is to read in the XML data using a self-programmed parser which extracts the data from XML files using string manipulation methods. This specialized parsing approach can have performance advantages, but the implementation is usually more expensive than the adaption of a well-established parser framework, and often not reusable (García, 2013). All three mentioned parsing approaches – or frameworks based on them - are possible candidates for a software implementation. In summary, SAX parsers work more efficient in respect of memory and CPU usage, DOM interfaces are in general easier to use (García, 2013). Further information concerning operational and performance characteristics of XML document parsers – including DOM and SAX – can be found in a survey done by Lam et al. (2008). The first software prototype uses a specific self-programmed parser that can be adapted easily for various test scenarios.
4.2. Interpreting The parsing process creates a mapping from the XML syntax to a chosen data structure – e.g. a DOM tree model. The next step is the interpretation and categorization of the given structured data. The algorithm has to figure out if the extracted data is a SysML model and suitable for the generic lightweight visualization approach. For this purpose, a framework like the Eclipse Modelling Framework (EMF) can be used. EMF is able to produce Java classes from a (meta-) model specification described in XMI (Eclipse, 2017). These classes are used to identify SysML artefacts in the parsed data structure. The needed SysML meta-model specification is provided by the OMG (2016). The categorization divides found artefacts into different categories that can be treated similar in matters of the following visualization process. Different namespaces due to divergent implementations of the SysML specification in authoring tools and the extensibility of SysML may cause additional problems. The solution for the namespace problem is quite simple: Namespaces are carried over as an artefact dataset, but do not influence further categorization and arrangement steps. The determination of predefined namespaces would make no sense anyway, because of the extensibility of SysML profiles. Nonetheless a procedure should be implemented which identifies namespace conflicts that prohibit the distinct positioning of model artefacts. The response to the occurrence of artefacts with unknown type is more costly. E.g. if a specialized stereotype «Function» is derived from the standard SysML stereotype «Block», it is important to know that «Function» can be categorized identically as «Block». A key issue is to identify this crucial categorization information. In the best case, the definition of such SysML extensions is also exported to the XMI file. If those definitions are missing, two further options remain to identify extensions: Assignability to a category due to
relationships and linked elements or naming conventions for derived stereotypes.
2928 SYSTEMS ENGINEERING AND DESIGN

The first approach uses the fact that many SysML relationships only make sense between elements of the same type. If such relationships between the examined element and other elements with known type exist, the examined element can be assigned to the same category. The second possibility is to establish a naming convention for stereotype extensions, e.g. the original stereotype designation has to be part of the derived stereotype name. Applied to the mentioned «Function» stereotype derived from the stereotype «Block», an appropriate designation would be «FunctionBlock».
4.3. Design phase assignment For the approach of organizing the model artefacts with regard to the RFLP design phases, each artefact has to be linked to the proper phase first. For this assignment task, a two-stage process is used:
1. Design phase identification on the basis of manually declarations made by the system modeller 2. Automatic assignment algorithm for artefacts without design phase information
To give the modeller as much freedom as possible, 3 different assignment possibilities for stage 1 are discussed here.
SysML profile extension defining new stereotypes (a) Adding an assignment attribute to model elements (b) Assigment due to additional elements linked with existing model elements (c)
One way to declare the design phase affiliation of a model element is to extend the standard SysML profile and use additional stereotypes (Figure 3a). Instead of the stereotype «Block» more specific stereotypes can be added. The stereotypes «FunctionBlock», «LogicBlock» and «PhysicalBlock» are specializations of «Block», which means the derived stereotypes do have all properties of the original stereotype but also can have additional properties. In this special case no properties are added, only the designation of the derived stereotypes is changed for the purpose of distinctness. The stereotype «Requirement» already exists in standard SysML profiles, no further specializations are needed. The second possibility is to add a design phase attribute to all element classes in the SysML profile. The value of this attribute determines the design phase assignment of the element, e.g. the character “L” for the “Logical” design phase as depicted in Figure 3b. Another option is to add standard SysML «Block» elements with a predefined designation for every design phase – except the Requirement phase, because a distinct requirement element is already available – and link every model element to one of the design phase representing blocks, e.g. with a «Trace» link, as illustrated in Figure 3c.
Figure 3. Assignment possibilities for SysML models
SYSTEMS ENGINEERING AND DESIGN 2929
Since the XMI interpreter module has to be capable to recognize all 3 of the mentioned RFLP design phase assignment possibilities, the different assignment options have several advantages and disadvantages. The approaches with additional stereotypes (a) and attributes (b) are easy to use within new modelling projects. The system modellers just have to use the extended modelling elements instead of the universal «Block» respectively apply the proper design phase attribute value. For existing models it is sometimes not possible to apply another or an updated profile. In this case, option (c) seems to be the assignment method of choice. Existing models can be easily updated with 3 additional standard SysML «Block» elements that represent the F, L and P design phases. All model elements – except requirements – have to be connected to the fitting design phase «Block» element. This approach is more time-consuming, but works without any changes to the applied profiles. Automatic assignment is an additional procedure for models with some elements without design phase assignment. It works similar to the categorization of non-standard artefacts using relationships and linked element types described in Section 4.2. If hierarchical relationships between the examined element and other elements with known design phase assignment exist, the element is most likely affiliated to the same design phase if particular conditions are met. Elements that are assigned to a design phase in the described automated way receive an additional tag so that viewers of the generic layer model are aware of the fact that an explicit design phase assignment is missing for the tagged elements.
4.4. Model artefact selection for visualization Up to this point, ideally all elements and relationships of the analysed XMI model file and their corresponding properties and attributes are available in a chosen data structure. With regard to the first software prototype, an implementation of the entire SysML specification to its full extent would not be feasible. Hence, a preselection of artefacts for the visualization approach has to be done. Another reason for the preselection is the intention that the aspired lightweight visualization shall give an overview of SysML models and not to depict all details of those models. Nonetheless further structural artefacts and also behavioural constructs can be considered in advanced stages of extension. The selected artefacts are divided into 3 basic types - elements, relationships and attributes – and forwarded to the visualization module.
5. Visualization of the model The data extraction process described in Section 4 finally delivers a selection of model elements chosen to represent the model in a graphical lightweight visualization. Because of the fact that the SysML notation was not developed for 3D representations and for simplification reasons – users who are not familiar with SysML at all should also be able to interpret the overall system context – the available model information has to be abstracted. While the basic concept introduced by Nigischer and Gerhard (2017) gives just a vague idea of how the layer model can look like, the following subsections describe the approach to attain an authoring tool independent visualization of SysML models in detail.
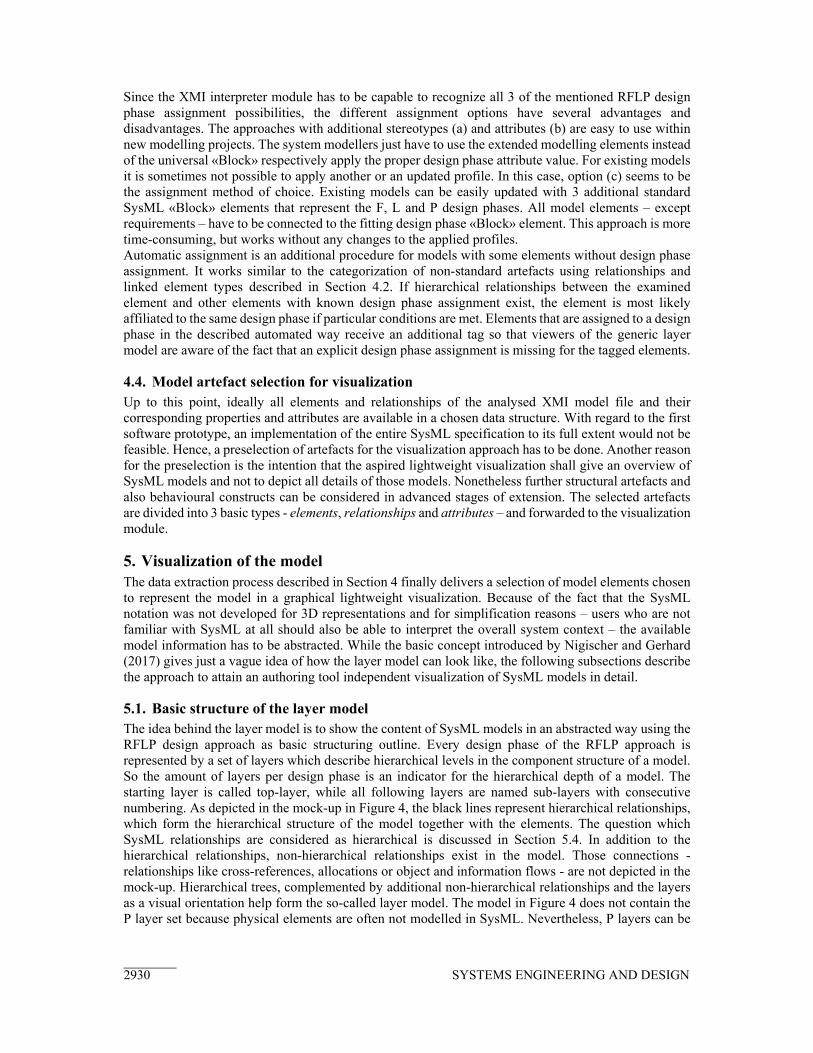
5.1. Basic structure of the layer model The idea behind the layer model is to show the content of SysML models in an abstracted way using the RFLP design approach as basic structuring outline. Every design phase of the RFLP approach is represented by a set of layers which describe hierarchical levels in the component structure of a model. So the amount of layers per design phase is an indicator for the hierarchical depth of a model. The starting layer is called top-layer, while all following layers are named sub-layers with consecutive numbering. As depicted in the mock-up in Figure 4, the black lines represent hierarchical relationships, which form the hierarchical structure of the model together with the elements. The question which SysML relationships are considered as hierarchical is discussed in Section 5.4. In addition to the hierarchical relationships, non-hierarchical relationships exist in the model. Those connections - relationships like cross-references, allocations or object and information flows - are not depicted in the mock-up. Hierarchical trees, complemented by additional non-hierarchical relationships and the layers as a visual orientation help form the so-called layer model. The model in Figure 4 does not contain the P layer set because physical elements are often not modelled in SysML. Nevertheless, P layers can be
2930 SYSTEMS ENGINEERING AND DESIGN
integrated in the visualization as well, if the physical product structure – usually called Bill of Materials (BoM) – can be extracted from the PDM system and connected to the SysML model.
Figure 4. Mock-up of generic 3-D visualization of a SysML model (Nigischer and
Gerhard, 2017)
5.2. Variants of layer model appearance If all SysML model elements are assigned to a RFLP design phase, the layer model consists of up to 4 sets of layers. Is the assignment incomplete and cannot be completed by the automatic assignment algorithm, an alternative layer model that is not divided into different design phases can be established. In this case the visualized model consists of just 1 general-purpose layer set which represents the hierarchical structure of the model without subdividing the artefacts into different design phases.
5.3. Graphical representation of model artefacts As already mentioned, the appearance of SysML artefacts is designed for 2D diagrams. The layer model visualization cannot use exactly the same symbolism because of the 3D approach. Elements in general can be represented by cuboidal blocks. Other shapes like spheres or more complex structures are of course possible. The advantage of cuboids is the quite simple geometry and – contrary to spheres - also have a clear orientation in space which makes it easier for a viewer to navigate and orientate himself during observing the model. Colours can be used to distinguish different element types clearly. Regarding the graphical representations of relationships in 3D space two ways seem reasonable. Either try to come as close to the standardized 2D graphical notation as possible or keep it very simple with a uniform representation for all relationships, enriched with the SysML name respectively the SysML stereotype. Which representation option is easier to read is highly dependent from the observer’s prerequisites. For viewers with SysML knowledge a SysML similar appearance is likely advantageous. Model observers without SysML experience might prefer the more simplified solution. For optimal visualization results, further research is necessary.
5.4. Spatial model element arrangement One core issue of the layer model is the spatial arrangement of the model elements. As previously mentioned the basic structure of the layer model is given by hierarchical trees. The layer sets are an auxiliary tool which function as separators for elements of different design phases and as visualization help. The first step of building the hierarchical trees is to find the elements for each design phase that
SYSTEMS ENGINEERING AND DESIGN 2931
have no hierarchical superordinate parent elements. These elements are positioned on the top-layer of the particular design phase. Starting from these top-layer elements the hierarchical tree structures are established due to interpreting the SysML relationships of the analysed model.
5.4.1. Hierarchical and non-hierarchical relationships
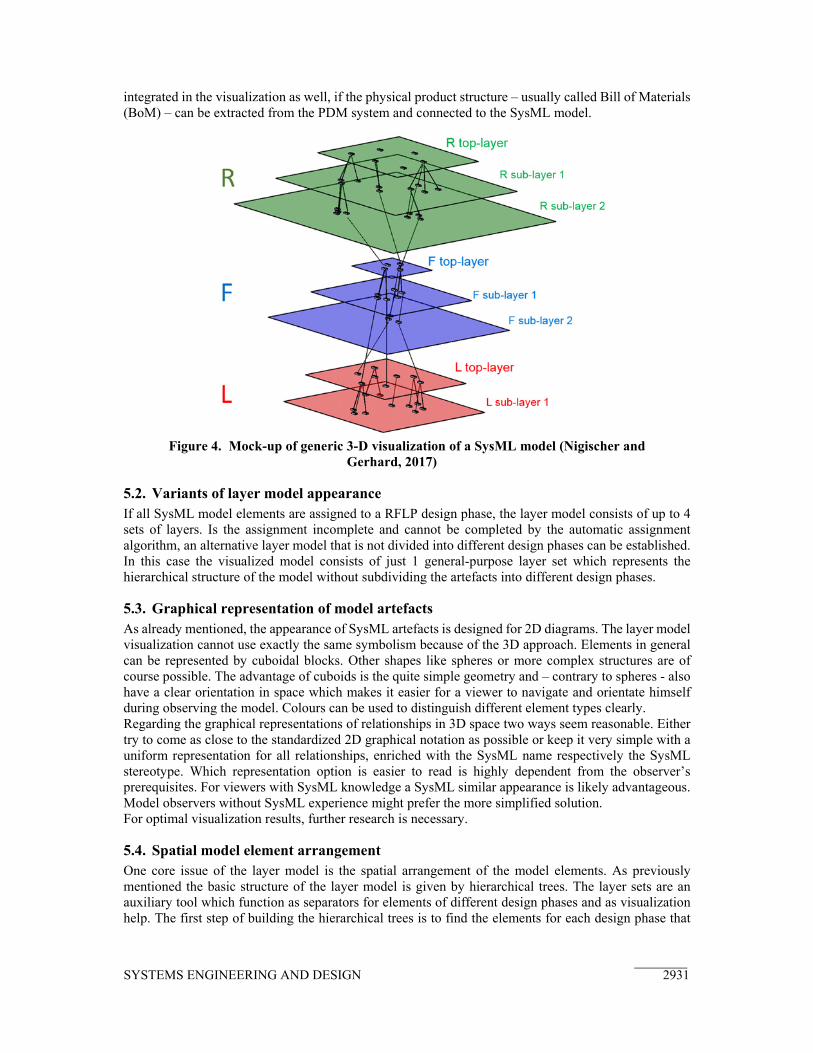
To form the hierarchical trees, existing SysML relationships have to be divided into hierarchical and non-hierarchical relationships. While hierarchical relationships determine the structure of the model non-hierarchical connections do not influence the element positioning of the layer model. Figure 5 shows a selection of SysML relationships with focus on the R design phase. The “containment”, “copy” and “derive” relationships are assigned to the group of hierarchical relationships. Parent and child elements have the same element type and therefore the child element can be positioned one layer lower than the parent element’s layer. The relationships “verify”, “satisfy”, “refine” and “trace” are considered as non-hierarchical. The first three of these relationships connect elements of different element type. In general elements of a specific element type are organized with other elements of the same type in a hierarchical way. Hence, relationships between elements of different element types are considered as non-hierarchical cross-references in the first step. The “trace” relationship creates a universal connection between elements with same or different element type. The direction of this relationship is usually not stringent and can be read in both directions. Thus, a “trace” link is considered as a non-hierarchical relationship without impact on the tree building process. Of course there are exceptions which are discussed in the following section.
Figure 5. Selection of hierarchical and non-hierarchical requirement relationships
5.4.2. Prioritization of hierarchical relationships
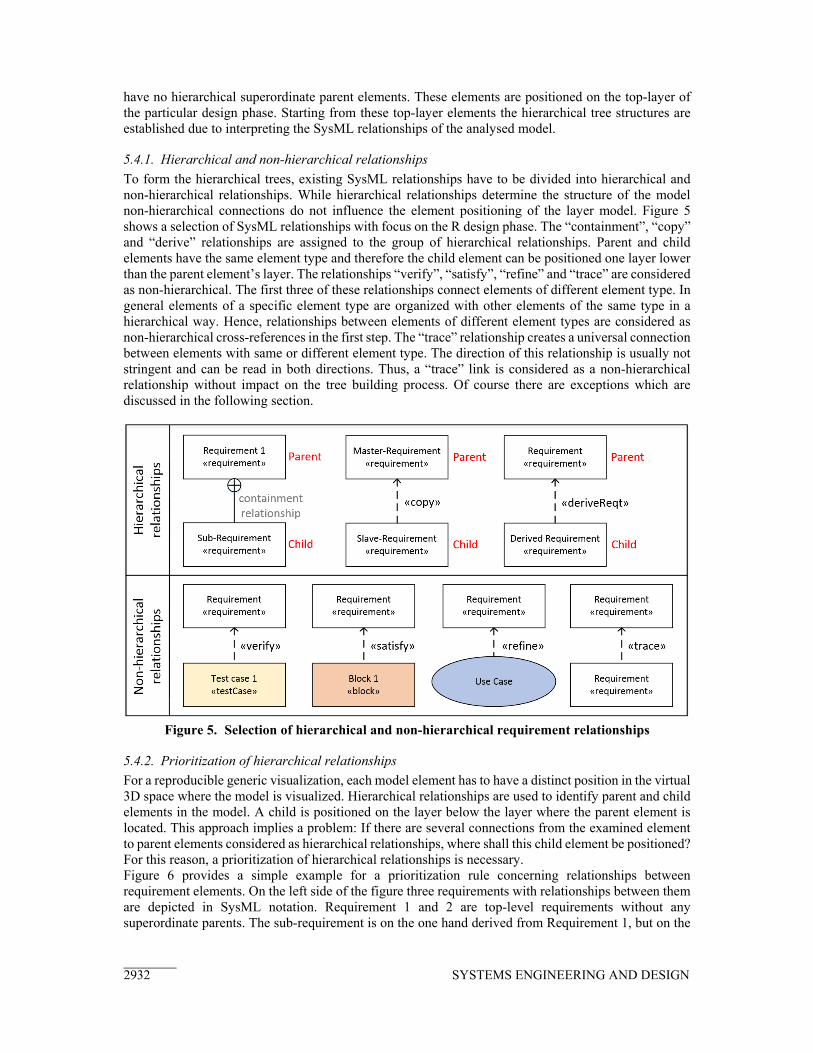
For a reproducible generic visualization, each model element has to have a distinct position in the virtual 3D space where the model is visualized. Hierarchical relationships are used to identify parent and child elements in the model. A child is positioned on the layer below the layer where the parent element is located. This approach implies a problem: If there are several connections from the examined element to parent elements considered as hierarchical relationships, where shall this child element be positioned? For this reason, a prioritization of hierarchical relationships is necessary. Figure 6 provides a simple example for a prioritization rule concerning relationships between requirement elements. On the left side of the figure three requirements with relationships between them are depicted in SysML notation. Requirement 1 and 2 are top-level requirements without any superordinate parents. The sub-requirement is on the one hand derived from Requirement 1, but on the
2932 SYSTEMS ENGINEERING AND DESIGN

other hand a part of Requirement 2. For the layer model arrangement, the containment relationship is prioritized higher than the “derived” relationship. As a result, the sub-requirement is positioned directly below Requirement 2 on R sub-layer 1, and not beneath Requirement 1, as depicted on the right side of Figure 6. A subsequent problem to handle is to find out if an element has at least two hierarchical relationships to superordinate elements with the exact same prioritization level. Often such scenarios are modelling mistakes but are not indicated by the used authoring tool. In absence of alternatives the arrangement algorithm should randomly select one of the equally prioritized parent elements for the positioning. Of course, all other relationships are visualized in the layer model as well. In addition a software implementation should pass a warning to the user informing him concerning the lack of definiteness.
Figure 6. Prioritization example for requirement element positioning
5.4.3. Positioning pattern for hierarchical children
Depending on the quantity of child elements of a parent element the positioning of the hierarchical children on the next lower layer can be done using different 2D arrangement patterns. Generally the pattern for the child element arrangement is not crucial for the success of the visualization, but some patterns are easier to read. A suggestion for a basic arrangement pattern is given in Figure 7. For a child count (nc) of 1 to 5 the pattern is manually predefined. If the child count exceeds 5, a generic matrix arrangement approach can be used to position the child elements.
Figure 7. Isometric view of hierarchical child arrangement
SYSTEMS ENGINEERING AND DESIGN 2933
5.5. Arrangement and visualization optimizations The following two optimization strategies aim to increase the clarity especially for the visualization of large models. These methods are applied to the already established layer model to improve the visualization quality due to restructuring and visualization adaptions.
5.5.1. Smart arrangement of (sub-)structures
The basic principle is quite simple: Model structures that are connected heavily among each other should be brought together as close as possible. Non-hierarchical relationships between different hierarchical trees and sub-trees are analysed with respect to quantity of relationships between the investigated structures and virtual length of the relationship symbolizing lines. These parameters are indicators for the interdependence of different tree segments. If there are strongly cross-linked areas that are located far away from each other, the algorithm tries to exchange the positions of the affected trees/sub-trees with other trees that are not so strongly interconnected. This arrangement strategy especially tries to reduce overlapping of lines.
5.5.2. “Phantom” element positioning
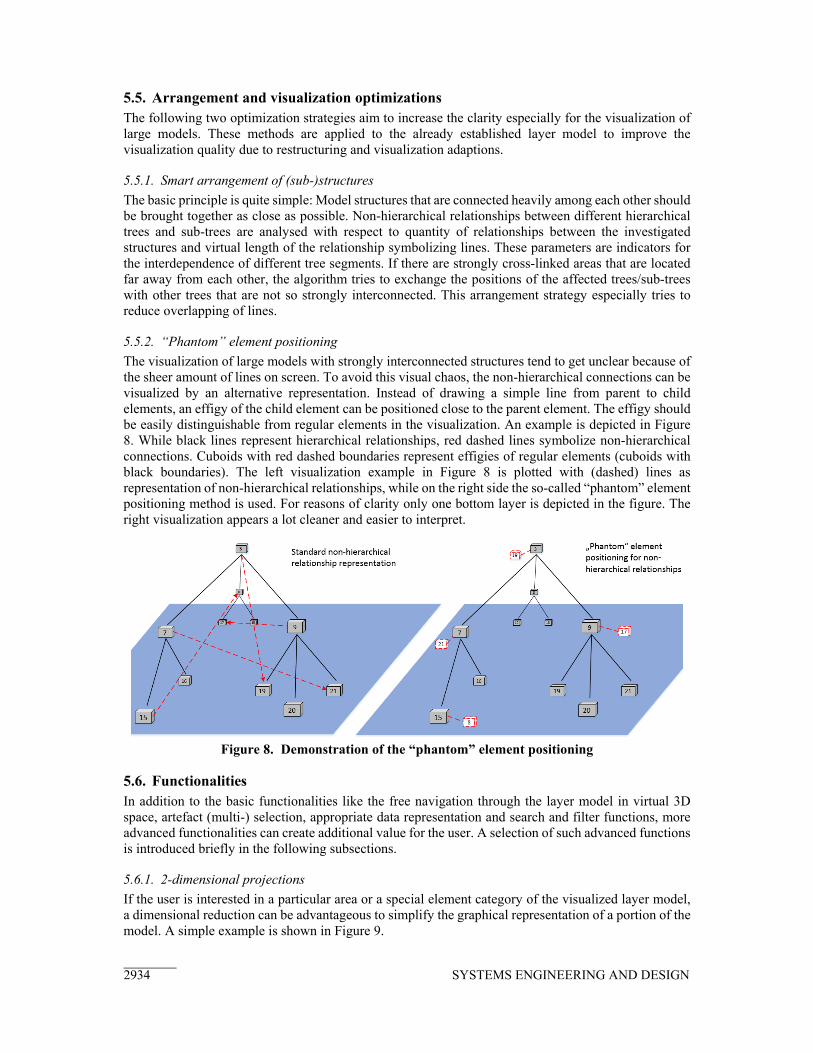
The visualization of large models with strongly interconnected structures tend to get unclear because of the sheer amount of lines on screen. To avoid this visual chaos, the non-hierarchical connections can be visualized by an alternative representation. Instead of drawing a simple line from parent to child elements, an effigy of the child element can be positioned close to the parent element. The effigy should be easily distinguishable from regular elements in the visualization. An example is depicted in Figure 8. While black lines represent hierarchical relationships, red dashed lines symbolize non-hierarchical connections. Cuboids with red dashed boundaries represent effigies of regular elements (cuboids with black boundaries). The left visualization example in Figure 8 is plotted with (dashed) lines as representation of non-hierarchical relationships, while on the right side the so-called “phantom” element positioning method is used. For reasons of clarity only one bottom layer is depicted in the figure. The right visualization appears a lot cleaner and easier to interpret.
Figure 8. Demonstration of the “phantom” element positioning
5.6. Functionalities In addition to the basic functionalities like the free navigation through the layer model in virtual 3D space, artefact (multi-) selection, appropriate data representation and search and filter functions, more advanced functionalities can create additional value for the user. A selection of such advanced functions is introduced briefly in the following subsections.
5.6.1. 2-dimensional projections
If the user is interested in a particular area or a special element category of the visualized layer model, a dimensional reduction can be advantageous to simplify the graphical representation of a portion of the model. A simple example is shown in Figure 9.
2934 SYSTEMS ENGINEERING AND DESIGN

Figure 9. 2D projections of selected model structures
5.6.2. Impact analysis
Traceability is a big issue in large technical systems. If any changes in the system requirements occur, affected parts or subsystems eventually have to be adapted, i.e. if a system component undergoes a change, the compliance of concerned requirements have to be checked. For these reasons, the impact analysis function shall provide multi-level traceability throughout the whole layer model.
6. Conclusion and outlook The introduced detailed concept of the lightweight visualization approach for SysML models refines the basic concept presented by Nigischer and Gerhard (2017). The most important issues of the data extraction and preparation process as well as the visualization module were discussed in more detail with respect to a technical implementation. A feature that should be highlighted is the possibility of the visualization module to generate a layer model from models without RFLP design phase information, too. Hence, models created using other design approaches can also be displayed. The tree-building process for the hierarchical structures follows a quite simple approach in the current state of the concept. For further performance optimizations well-established graph drawing algorithms should replace the current approach to ensure reliability and scalability of the visualization module. The next step will be to implement a software prototype to proof that the presented concept works. The first prototype will not include all features of the concept to full extent, but will hopefully provide an answer to the question if the generic lightweight visualization approach for SysML models in PDM systems is feasible and helpful dealing with abstract model data exchange difficulties. The layer model is not intended to replace any SysML authoring tools, but shall be able to provide an authoring tool independent visualization to ease model data exchange between development stakeholders. Because the detailed concept of the generic lightweight visualization approach has to deal with a variety of different aspects concerning data extraction and 3D visualization, not all details could be addressed in this paper. Subjects like the handling of feedback loops in hierarchical structures or further functionalities could not be discussed, but are considered in the comprehensive concept and will be presented in further publications.
References Eclipse (2017), Eclipse Modeling Framework (EMF). [online] Eclipse Foundation. Available at:
https://www.eclipse.org/modeling/emf/ (accessed 21.11.2017).
SYSTEMS ENGINEERING AND DESIGN 2935

Eigner, M., Gilz, T. and Zafirov, R. (2012), “Proposal for functional product description as part of a PLM solution in interdisciplinary product development”, Proceedings of the DESIGN 2012 / 12th International Design Conference, Dubrovnik, Croatia, May 21-24, 2012, The Design Society, Glasgow, pp. 1667–1676.
Gajer, P., Goodrich, M.T. and Kobourov, S.G. (2001), “A Multi-dimensional Approach to Force-Directed Layouts of Large Graphs”, Proceedings of the 8th International Symposium Graph Drawing: GD 2000, Colonial Williamsburg, VA, USA, September 20-23, 2000, Springer, Berlin, Heidelberg, pp. 211–221. https://doi.org/10.1007/3-540-44541-2_20
García, J. (2013), Visualization of SysML Project Meta-Model Architecture and Evolution, Master thesis, Delft University of Technology.
Harold, E.R. (2002), Processing XML with Java: A Guide to SAX, DOM, JDOM, JAXP, and TrAX, Addison-Wesley Professional, Reading.
Katzenbach, A., Handschuh, S. and Vettermann, S. (2013), “JT Format (ISO 14306) and AP 242 (ISO 10303): The Step to the Next Generation Collaborative Product Creation”, Proceedings of the IFIP TC 5 International Conference / NEW PROLAMAT 2013, Dresden, Germany, October 10-11, 2013, Springer, Berlin, pp. 41–52. https://doi.org/10.1007/978-3-642-41329-2_6
Lam, T.C., Ding, J.J. and Liu, J.-C. (2008), “XML Document Parsing: Operational and Performance Characteristics”, Computer, Vol. 41 No. 9, pp. 30-37. https://doi.org/10.1109/MC.2008.403
Nigischer, C. and Gerhard, D. (2017), “Lightweight visualization of SysML models in PDM systems”, Proceedings of the 21st International Conference on Engineering Design (ICED ’17), Vol. 3: Product, Services and Systems Design, Vancouver, Canada, August 21-25, 2017, The Design Society, Glasgow, pp. 61-70.
Nuccitelli, R., Guerra, E. and Fernandes, C. (2010), “Parsing XML Documents in Java using Annotations”, Proceedings of XML, Associated Technologies and Applications Conference (XATA 2010), Vila do Conde, Portugal, May 19-20, 2010, pp. 103–114.
OMG (2015), XML Metadata Interchange (XMI) Specification Version 2.5.1. [online] Object Management Group (OMG). Available at: www.omg.org/spec/XMI/2.5.1/PDF (accessed 01.12.2017).
OMG (2016), OMG SysML 1.5 Normative machine consumable specification. [online] Object Management Group (OMG). Available at: www.omg.org/spec/SysML/20161101/SysML.xmi (accessed 20.11.2017).
OMG (2017), OMG Systems Modeling Language Version 1.5. [online] Object Management Group (OMG). Available at: www.omg.org/spec/SysML/1.5/ (accessed 14.11.2017).
SAX (2004), About SAX. [online] SAX Project. Available at: www.saxproject.org (accessed 15.11.2017). Sztipanovits, J., Koutsoukos, X., Karsai, G., Kottenstette, N., Antsaklis, P. et al. (2011), “Toward a Science of
Cyber-Physical System Integration”, Proceedings of the IEEE, Vol. 100 No. 1, pp. 29-44. https://doi.org/10.1109/JPROC.2011.2161529
Tilley, S.R., Paul, S. and Smith, D.B. (1996), “Towards a framework for program understanding”, Proceedings of the 4th International Workshop on Program Comprehension, Berlin, Germany, March 29-31, 1996, IEEE, pp. 19-28. https://doi.org/10.1109/WPC.1996.501117
Trase, K. and Fink, E. (2014), “A Model-Driven Visualization Tool for Use with Model-Based Systems Engineering Projects”, Proceedings of the IEEE Aerospace Conference, Big Sky, Montana, USA, March 1-8, 2014, IEEE, pp. 1-10. https://doi.org/10.1109/AERO.2014.6836268
VDI 2206 (2004), Entwicklungsmethodik für mechatronische Systeme – Design methodology for mechatronic systems, Beuth, Düsseldorf.
Von Landesberger, T., Kuijper, A., Schreck, T., Kohlhammer, J. van Wijk, J.J. et al. (2011), “Visual Analysis of Large Graphs: State-of-the-Art and Future Research Challenges”, Computer Graphics Forum, Vol. 30 No. 6, pp. 1719-1749. https://doi.org/10.1111/j.1467-8659.2011.01898.x
W3C (2005), Document Object Model (DOM). [online] W3C Web Applications Working Group. Available at: www.w3.org/DOM (accessed 15.11.2017).
Christian Nigischer, Dipl.-Ing. TU Wien, IKL - Maschinenbauinformatik und Virtuelle Produktentwicklung Getreidemarkt 9/307, 1060 Vienna, Austria Email: [email protected]
2936 SYSTEMS ENGINEERING AND DESIGN