detailed assessment of phosphorus sources to minnesota ... · subject: detailed as sessment of...
TRANSCRIPT

P:\23\62\853\Deicing Agents\DEIC Tech Memo\final v2 Technical Memorandum Deicer Phosphorus Sources.doc
To: Marvin Hora, Minnesota Pollution Control Agency
Mark Tomasek, Minnesota Pollution Control Agency
Doug Hall, Minnesota Pollution Control Agency
From: Jeffrey Lee
Subject: Detailed Assessment of Phosphorus Sources to Minnesota Watersheds – DeicingAgents
Date: December 17, 2003
Project: 23/62-853 DEIC 008
c: Greg Wilson
Henry Runke
The purpose of this memorandum is to provide a discussion on deicing agents as sources ofphosphorus to Minnesota watersheds. This discussion is based on a review of the available literature,monitoring data and the results of phosphorus loading computations done for each of Minnesota’smajor watershed basins as part of this study. This memorandum is intended to:
-- Provide an overview and introduction to deicing agents as a source of phosphorus-- Describe the results of the literature search and review of available monitoring data-- Discuss the characteristics of each watershed basin as it pertains to deicing agents as a source
of phosphorus-- Describe the methodology used to complete the phosphorus loading computations and
assessments for this study-- Discuss the results of the phosphorus loading computations and assessments− Discuss the uncertainty of the phosphorus loading computations and assessment− Provide recommendations for future refinements to phosphorus loading estimates and
methods for reducing error terms-- Provide recommendations for lowering phosphorus export from deicing agents
Technical Memorandum

To: Marvin Hora, Mark Tomasek and Doug Hall, Minnesota Pollution Control AgencyFrom: Jeffrey LeeSubject: Detailed Assessment of Phosphorus Sources to Minnesota Watersheds – Deicing AgentsDate: December 17, 2003Page: 2
P:\23\62\853\Deicing Agents\DEIC Tech Memo\final v2 Technical Memorandum Deicer Phosphorus Sources.doc
Overview and Introduction to Deicing Agents as Source(s) of Phosphorus
The use of deicing chemicals has increased in the U.S. since the 1940s and 1950s to provide “barepavement” for safe and efficient winter transportation. As more and more transportation agenciesadopted the “bare pavement” policy, the use of salt, salt and sand mixtures, liquid brines andalternative deicers increased with the need to maintain this standard for pavement conditions duringinclement weather. Sodium chloride (NaCl) is one of the most commonly used deicing chemicals.Concern about the effects of sodium chloride on the nation's environment and water quality hasincreased with this chemical's continued usage.
As environmental and associated impacts of salt usage became better documented, the MinnesotaDepartment of Transportation (MnDOT) began implementing procedures to reduce the usage of saltand sand on the state maintained roadway system. In 1996 MnDOT conducted a pilot project – SaltSolutions – to develop tools for reducing their usage of deicing agents, while maintaining saferoadways (SRF Consulting Group, 1998). Following a successful pilot project in winter of 1996-97,the program was adopted state-wide. Other road agencies in Minnesota such as cities, townships andcounties use deicing agents to maintain a similar standard for pavement conditions during inclementweather. Many of these agencies have less rigorous record keeping programs than MnDOT.
The search for alternatives to salt for road deicing has been prompted primarily due to theinfrastructure corrosion concerns and the impacts of chloride on water quality and vegetation.Recent research in Colorado, New York, and British Columbia have documented water qualityconcerns related to phosphorus and other chemicals present in deicing agents, as well as thealternative compounds. Due to the recent nature of the work on phosphorus in road salt andalternative deicers, the amount of information present in the scientific literature is somewhat limited,scattered, and quite variable in quality.
Results of Literature Search and Review of Available Monitoring Data
Review of the existing scientific literature with regard to deicing agents as a phosphorus source wasconcerned with three major areas; 1) usage patterns of deicing agents in Minnesota and other stateswith regard to road types and road management agency, 2) the phosphorus content of deicing agents– salt, sand, and deicing alternatives, and 3) the impact of weather patterns on usage levels.
The data available for the usage patterns of deicing within the state of Minnesota available fromMnDOT is extensive and detailed (MnDOT, 2003; MnDOT Office of Maintenance. 2003; MnDOTOffice of Transportation Data & Analysis. 2002). MnDOT has undertaken extensive analyses ofusage patterns with regard to road type, service levels and weather patterns. In 1996 MnDOT began aprogram to reduce the usage of deicers in District 1 and has subsequently expanded the programstatewide (SRF Consulting Group, 1998). Figure 1 provides the MnDOT District boundaries inrelation to the basin boundaries. The Minnesota Office of Legislative Auditor completed a reportthat identified some of the best techniques for snow and ice control in Minnesota with the purpose of

R e d R i v e r R e d R i v e r o f t h e N o r t ho f t h e N o r t h
U p p e rU p p e rM i s s i s s i p p iM i s s i s s i p p i
R a i n y R i v e rR a i n y R i v e r
M i n n e s o t a R i v e rM i n n e s o t a R i v e r
L a k e S u p e r i o rL a k e S u p e r i o r
L o w e r L o w e r M i s s i s s i p p iM i s s i s s i p p i
S t . C r o i xS t . C r o i xR i v e rR i v e r
M i s s o u r iM i s s o u r i
D e s M o i n e sD e s M o i n e sR i v e rR i v e r
C e d a r R i v e rC e d a r R i v e r
88
2 A2 A
1 A1 A
2 B2 B
00
1 B1 B
3 A3 A
4 A4 A
7 B7 B
3 B3 B4 B4 B
6 A6 A
7 A7 A6 B6 B
Bar
r F
oote
r: D
ate:
10/
20/2
003
1:04
:29
PM
F
ile:
I:\P
roje
cts\
23\6
2\85
3\G
IS\A
rcM
ap\M
nDO
TS
ubdi
stric
ts.m
xd U
ser:
tja
0 25 50 75 10012.5Miles
FIGURE 1Major Basins with MnDOT
Subdistricts
Major Basins
Subdistricts
MnDOT Districts
Counties

To: Marvin Hora, Mark Tomasek and Doug Hall, Minnesota Pollution Control AgencyFrom: Jeffrey LeeSubject: Detailed Assessment of Phosphorus Sources to Minnesota Watersheds – Deicing AgentsDate: December 17, 2003Page: 3
P:\23\62\853\Deicing Agents\DEIC Tech Memo\final v2 Technical Memorandum Deicer Phosphorus Sources.doc
cataloging effective methods of snow and ice control and to encourage the adoption of practices asappropriate throughout the state (Minnesota Legislative Auditor, 1995). While this report attemptedto identify practices, it provided little quantitative data on application rates and usage levels. Table 1presents a summary of the local government salt to sand mix uses from this report.
The states of California, Colorado, Michigan and New Hampshire; as well as the province of BritishColumbia, Environment Canada and the U.S. Department of Transportation Federal HighwayAdministration have undertaken studies on the usage of deicing agents in an effort to document andreduce the environmental impacts of their use (Environment Canada and Health Canada, 2001;Fischel, 2001; Goldman, and Hoffman, 1975; Lewis, 1999; Public Sector Consultants, 1993; U.S.Department of Transportation Federal Highway Administration, 1996; Warrington, 1998; Universityof New Hampshire, 1996;) In nearly all cases, the various studies recommend that service levels beestablished to define acceptable road conditions and deicing guidelines that define the frequency ofwinter maintenance and service level needs based upon weather conditions. MnDOT and many otherroad agencies have developed and implemented sand and salt application guidelines to ensure saferoads and minimize the application of deicers. MnDOT has established targets for snow and iceremoval based upon service levels:
Road Class Avg. Annual Daily Traffic Target Time to Bare LaneSuper Commuter More than 30,000 1-3 hoursUrban Commuter 10,000-30,000 2-5 hoursRural Commuter 2,000-10,000 4-9 hours
Primary 800-2,000 6-12 hoursSecondary Under 800 9-36 hours
Attainment of the desired pavement conditions is dictated by several factors, including weatherconditions and pavement temperature. Weather conditions, precipitation type and temperaturedetermine the deicing mixture (ratio of sand to salt) or compound to be used, the rate of application(quantity per lane mile) and the frequency of application. The summary data for the state highwaysystem and Twin Cities Metropolitan Area (TCMA) county roads in Tables 2 and 3 illustrates howthe implementation of the maintenance guidelines is impacted by weather and the road service levelneeds across the state and TCMA counties.
Many local road agencies such as the City of Duluth and some out-state counties have adoptedapplication guidelines similar to MnDOT guidelines, but a review of the literature yielded fewexamples of specific guidelines (Duluth Streams, 2003; SRF Consulting Group, 1998). Review ofMinneapolis and St. Paul NPDES stormwater permit annual reports, various MnDOT reports and adatabase prepared by the Ramsey-Washington Metro Watershed District provided some informationrelated to annual usage rates. In most cases the information in these reports did not provide detailedusage data that could be converted to lane mile usage levels. Lane mile usage levels were calculatedor provided for the MnDOT data (City of Minneapolis and Minneapolis Park and Recreation Board,2003; Weber, 2003; Watson, 2003; Ramsey-Washington Metro Watershed District. 1999; SRFConsulting Group, 1998;). SRF Consulting Group (1998) provided information on usage rates forthe TCMA county road agencies for the winter of 1994 – 98. Information provided by Minnesota

To: Marvin Hora, Mark Tomasek and Doug Hall, Minnesota Pollution Control AgencyFrom: Jeffrey LeeSubject: Detailed Assessment of Phosphorus Sources to Minnesota Watersheds – Deicing AgentsDate: December 17, 2003Page: 4
P:\23\62\853\Deicing Agents\DEIC Tech Memo\final v2 Technical Memorandum Deicer Phosphorus Sources.doc
Legislative Auditor (1995) indicates that many local units of government use higher ratios of sand tosalt than does MnDOT. Some counties, such as Pine, St. Louis and Lake, report the use of sand onlyfor winter road maintenance, while data for the eight TCMA counties indicates that the TCMAcounties use a higher salt to sand ratio than what was indicated for other counties across the state(SRF Consulting Group, 1998). In many areas of the state MnDOT, some cities and counties nowexclusively use salt without the use of sand for road deicing purposes.
Table 1. Percent of Local Governments Using Various Ratios of Sand to Salt in Mix (from:Minnesota Legislative Auditor, 1995)
Percent of Counties Cities TownshipsSand in Mix (n = 68) (n = 137) (n = 6) 99 to 90% 47% 28% 50% 89 to 80% 29% 39% 17% 79 to 70% 15% 10% 0 Less than 70% 3% 9% 16% No Reply 6% 14% 17%

To: Marvin Hora, Mark Tomasek and Doug Hall, Minnesota Pollution Control AgencyFrom: Jeffrey LeeSubject: Detailed Assessment of Phosphorus Sources to Minnesota Watersheds – Deicing AgentsDate: December 17, 2003Page: 5
P:\23\62\853\Deicing Agents\DEIC Tech Memo\final v2 Technical Memorandum Deicer Phosphorus Sources.doc
Table 2. MnDOT Sand & Salt Application Summary Analysis (Winter of 2002-2003)Summary per District
District Average Sand (Tons)/LM Average Salt (Tons)/LMSalt: Sand
Ratio
1 7.8 6.9 0.5
2 3.5 2.5 0.4
3 3.5 5.8 0.6
4 3.4 3.5 0.5
METRO 0.4 11.4 1.0
6 4.5 8.0 0.6
7 2.2 3.3 0.6
8 3.6 2.6 0.4
STATEWIDE 3.5 5.9 0.6Summary per Service Level
Service Level Average Sand (Tons)/LM Average Salt (Tons)/LMSalt: Sand
Ratio
Primary 3.6 3.5 0.5Rural
Commuter 4.3 5.0 0.5Super
Commuter 0.6 11.2 1.0
Secondary 3.6 3.1 0.5Urban
Commuter 3.6 9.0 0.7
ALL 3.5 5.9 0.6Data based on MNDOT Report PS1A6 – “Sand, Salt, Brine Usage; Coverage Ratesby Lane Miles Only” from 10/15/2002 to 4/20/2003

To: Marvin Hora, Mark Tomasek and Doug Hall, Minnesota Pollution Control AgencyFrom: Jeffrey LeeSubject: Detailed Assessment of Phosphorus Sources to Minnesota Watersheds – Deicing AgentsDate: December 17, 2003Page: 6
P:\23\62\853\Deicing Agents\DEIC Tech Memo\final v2 Technical Memorandum Deicer Phosphorus Sources.doc
Table 3. TCMA County Road Agency Sand & Salt Application Summary (from: SRF Consulting
Group, 1998).
YearSand Ap(tons/LM)
Salt Ap(tons/LM)
Sand + Salt Ap(tons/LM) * % Salt
1994-95 10 5 15 33%
1995-96 15 7 22 32%
1996-97 16 8 24 33%
1997-98 12 7 19 37%
AVG 13.25 6.75 20 33.75%
*Calculated from data in SRF Consulting Group, 1998 Number of counties = 8
As a review of existing literature was undertaken it became obvious that the application rates andmixtures of deicers used are strongly predicated by weather conditions. Initially the concept of wet,dry and average year were proposed as the means of defining the average and extreme conditions.However a further examination of the MnDOT records indicated that the number of “events” perseason appeared to be the driving factor in the quantities of material applied (MnDOT, 2003;MnDOT Office of Maintenance. 2003; MnDOT Office of Transportation Data & Analysis, 2002;).There was a limited amount of information as to how these vagarities in weather patterns impactedusage levels by counties and local units of government (SRF Consulting Group, 1998). The MnDOTapplication guidelines listed below in Table 4 provide some insight into this pattern.

To: Marvin Hora, Mark Tomasek and Doug Hall, Minnesota Pollution Control AgencyFrom: Jeffrey LeeSubject: Detailed Assessment of Phosphorus Sources to Minnesota Watersheds – Deicing AgentsDate: December 17, 2003Page: 7
P:\23\62\853\Deicing Agents\DEIC Tech Memo\final v2 Technical Memorandum Deicer Phosphorus Sources.doc
Table 4. MnDOT Sand and Salt Application Guidelines (from: SRF Consulting Group, 1998)
Pavement Weather Pounds per Operation
Temperature Conditions Two Lane Mile
30+ Snow 200 - 400 As needed
Freezing rain 200 Re-apply as necessary
25 - 30 Wet Snow 400 - 500 Re-apply as necessary
Freezing rain 300 Initial
200 Re-apply as necessary
20 - 25 Wet snow /sleet
1200 sand/salt Repeat as necessary
Freezing rain 1200 sand/salt Repeat as necessary
15 - 20 Dry snow 1200 sand/saltSand hazardous areas 20:1
Sand/salt mixture(stockpile)
Wet snow /
sleet 1200 sand Repeat as necessary
Below 15 Dry Snow 1200 - 1500Sand hazardous areas 20:1
Sand/salt mixture(stockpile)
Based upon an assessment of the snow data and usage levels provided by MnDOT for the period of1971 to 2003 the amount of winter snow was used as a surrogate for the number of events. The highvariability in the number of events between regions of the state in any given year, as well the year-to-year variability in the number of events precluded the use of events in this analysis. The winter snowfall amount at MSP Airport was used to define average, dry (low snowfall – 90th percentile) and wet(10th percentile) conditions.
As the concern over and documentation of the environmental impacts of deicing agents hasincreased, a number of authors and agencies have attempted to document the concentrations of otherelements or compounds of concern that are introduced into the environment through road deicing.Some of the earliest studies were in high quality water basins such as Lake Tahoe and the TCMA(Goldman and Hoffman, 1975; Oberts, 1986). Subsequent studies have furthered the analyses andwidened the scope of study (Environment Canada and Health Canada, 2001; Fischel, 2001; Lewis,1999; Public Sector Consultants, 1993; Levelton Engineering, 1998, 1999, and 2000; Tierney andSilver, 2002;). Recent concern over the environmental impacts of chloride has led to searches foralternatives to salt and also widened the concerns for other elements present in these substances.Much of the recent research shows that road salt still is the best alternative for road deicing (Ohrel,2000). Mangold (2000) references several studies that express concern over the biological oxygendemand exerted on surface waters by the acetate based substitutes and the New York State Attorney

To: Marvin Hora, Mark Tomasek and Doug Hall, Minnesota Pollution Control AgencyFrom: Jeffrey LeeSubject: Detailed Assessment of Phosphorus Sources to Minnesota Watersheds – Deicing AgentsDate: December 17, 2003Page: 8
P:\23\62\853\Deicing Agents\DEIC Tech Memo\final v2 Technical Memorandum Deicer Phosphorus Sources.doc
General Office’s analysis of the phosphorus content of readily available deicers has heightenedconcerns for protection of the New York water supply (Tierney and Silver, 2002;). The results fromNew York and the Levelton Engineering reports (1998, 1999, and 2000) document a wide variety ofsubstances present in deicers and the concern over elevated levels of phosphorus in the deicersderived from agricultural waste products. Table 5 summarizes results from these various analysesand shows the wide variation in phosphorus concentrations among deicers.
Table 5. Phosphorus Concentrations in Deicers
Companyor Item Product or Product Constituent Name Description
Total Phosphorus(ppm*)
Sears Ecological Applications Co. MgCl2(30% solution)** From Dead Sea 6.2 (1)
Sears Ecological Applications Co. Magic-O:Laboratory measured value of productconsisting of top two components
Ice B' Gone 1(Spanish Cane)+ MgCl2-50:50*** 164.8 (1)
Sears Ecological Applications Co. Magic-O:Estimate calculated from ratio of above twocomponents
Ice B' Gone 1(Spanish Cane)+ MgCl2-50:50 194.2 (1)
Sears Ecological Applications Co. Magic-O
Ice B' Gone 1(VenezuelanCane) + MgCl2-50:50 50.8 (1)
Sears Ecological Applications Co. Magic-O
Ice B' Gone 1(Sugar Beet) +MgCl2 50:50 108.7 (1)
Sears Ecological Applications Co. Ice B'Gone 2
Syntheticproduct 0.81 (1)
Natural Solutions Summit M
Corn Steepresidue +MgCl2- 50:50
2281.9 (1); 3692.4(1)#
Natural Solutions Performance Plus M
Corn Steepresidue +MgCl2- 16:84 1556.1 (1); 2062.1(1)#
Natural Solutions Ultra MCorn-basedproduct + MgCl2 13.4 (1); 16.7 (1)#
Natural Solutions MgCl2 (30% solution)**From Great SaltLake 13.4 (1); 12.1 (1)#
SWP Caliber M1000
Manufacturedcorn product +MgCl2-10:90 109.4 (1)
SWP Caliber M2000
Manufacturedcorn product +MgCl2-20:80 249.6 (1)
MagnesiumChlorideDeicing
Products
SWP MgCl2 w/rust inhibitor 259.5 (1)

To: Marvin Hora, Mark Tomasek and Doug Hall, Minnesota Pollution Control AgencyFrom: Jeffrey LeeSubject: Detailed Assessment of Phosphorus Sources to Minnesota Watersheds – Deicing AgentsDate: December 17, 2003Page: 9
P:\23\62\853\Deicing Agents\DEIC Tech Memo\final v2 Technical Memorandum Deicer Phosphorus Sources.doc
SWP NC-3000
Carbohydrate,potassiumcarboxylatesmix 90.6 (1); 50.5 (1)##
Envirotech FreezGard Zero MgCl2 42 (5)
FreezGard Zero (with 4% Ice Ban) MgCl2 230 (4)
FreezGard Zero/TEA
MgCl2 +TriethanolamineInhibitor (5% byweight) 13 (4)
80% Freezgard + 20% Ice BanMgCl2 + IceBan 800 (4)
50% MgCl2 + 50% Ice Ban 2,160 (4)
Calibre M1000
MgCl2 + 10%Corn-basedInhibitor 76 (4)
Natural Solutions Performance Plus C
Corn Steepresidue +CaCl2-50:50 2,133.4 (1)
Natural Solutions Performance Plus C
Corn Steepresidue +CaCl2-16:84 863.2 (1)
Liquidow CaCl2 (Dow) CaCl2 30 (4)
Inhibited CaCl2 (Dow)
CaCl2 with 4%Dow organicinhibitor 53 (4)
50% CaCl2 + 50% Ice Ban 3,840 (4)
70% CaCl2 + 30% Ice Ban 2,600 (4)80% CaCl2 + 20% Ice Ban 230 (4)
CalciumChlorideDeicing
Products
Calibre C1500
CaCl2 + 15%Corn-basedInhibitor 324 (4)
Sears Ecological Applications Co. Ice B' Gone( concentrate)**
Spanish canesugar byproduct 323.4 (1)
Ice Ban
Byproduct fromwet milling ofcorn andalcoholproduction 10,700 (4)
Liquid CMA (25%)
CalciumMagnesiumAcetate 24 (4)
Liquid KA (50%)PotassiumAcetate 86 (4)
OtherDeicing
Products
Liquid CMAK50% CMA +50% KA 120 (4)
Westchester County salt 4 (1)Westchester County salt 1 (1)Delaware Co. NYSDOT salt 2 (1)
Salt
Leslie Foods, Newark, California 0.213 (3)

To: Marvin Hora, Mark Tomasek and Doug Hall, Minnesota Pollution Control AgencyFrom: Jeffrey LeeSubject: Detailed Assessment of Phosphorus Sources to Minnesota Watersheds – Deicing AgentsDate: December 17, 2003Page: 10
P:\23\62\853\Deicing Agents\DEIC Tech Memo\final v2 Technical Memorandum Deicer Phosphorus Sources.doc
Utah Salt Co., Salt Lake City, Utah 0.231 (3)
Southwest Salt Co., Los Angeles, California 25.696 (3)
Morton Salt Co., Burlingame, California 0.872 (3)West Coast Salt & Milling Co., Bakersfield,California 14.312 (3)NaCl Brine 23% <2 (4)23% NaCl Brine + 20%Ice Ban 1020 (4)
NaCl plus 10% Calibre Inhibitor
NaCl + 10%Corn-basedInhibitor 559 (4)
Minnesota Road Salt 4.6 (2)Hennepin County Hwy Dept Salt 1 (6)Westchester County sand 53.4 (1)Westchester County sand 55 (1)SandHennepin County Hwy Dept Sand 4.7 (6)Delhi (10:90) 113.5 (1)Walton Village (10:90) 55 (1)Bloomville salt/sand (10:90) 163.5 (1)Colorado Salt/Sand (18:82) 1.91 (5)Colorado Salt/Sand (5:95) 3.23 (5)
Salt:Sand
Colorado Salt/Sand (5:95) 2.47 (5)Notes: * ppm = parts per million
** Product constituents = Ice B' Gone 1 concentrate and MgCl2 or magnesium chloride salt (30% solution)
*** 50:50 = A ratio consisting of 50% Ice B'Gone 1 and 50% MgCl2.# Sample re-analyzed
## Product was analyzed twice with a duplicate analysis each time. Agreement between duplicates was poor and
outside quality control limits. Results of the four analyses ranged from 14.9 to 112.8 ppm. Lab concluded thatthere was interference with this sample and the method.
Source: (1) Office of NY Sate Attorney General, 2002. Scientific Guidance on Lower-Phosphorus Roadway De-
icers http://www.oag.state.ny.us/environment/deicer.html(2) Biesboer and Jacobson, 1993.
(3) Goldman and Hoffman, 1975.
(4) Levelton Engineering Ltd. 1998.(5) Lewis, 1999.
(6) Oberts, 1986.
Phosphorus Concentrations in Deicing Agents
Unfortunately much of the analysis done for phosphorus content have not been conducted under anytype of standard testing protocol; as such much of the available data had to be converted to a standardmeasure of phosphorus concentration. For purposes of this analysis, all of the data was converted toconcentration in parts per million (mg P/L or mg P/kg). The statistical summary data presented inTable 5 for salt, sand and salt/sand mixtures were the used for the phosphorus load calculationscompleted for the deicing agents for each of the basins.

To: Marvin Hora, Mark Tomasek and Doug Hall, Minnesota Pollution Control AgencyFrom: Jeffrey LeeSubject: Detailed Assessment of Phosphorus Sources to Minnesota Watersheds – Deicing AgentsDate: December 17, 2003Page: 11
P:\23\62\853\Deicing Agents\DEIC Tech Memo\final v2 Technical Memorandum Deicer Phosphorus Sources.doc
Table 5a. Summary statistics for salt, sand and salt/sand mixtures; all values in ppm – phosphorus.
Salt (NaCl) Sand Sand salt mixesMean 4.99 37.70 33.93
Std. Dev. 7.97 28.59 55.05
Number 11 3 13
Watershed Basin Characteristics
The literature review made it obvious that the application rates and mixtures of deicers used arestrongly predicated by weather conditions that are not always closely related to total annualprecipitation levels. An assessment was completed for the snow and deicer usage levels provided byMnDOT for the period of 1971 to 2003. The lack of long term data on number of events, coupledwith the high variability in the number of events between regions of the state in any given year andthe year-to-year variability in the number of events precluded the use of events in this analysis.Based upon this data the amount of winter snow was used as a surrogate for the number of events, asthe number of events is the main determinant for the amount of sand used in a winter season. Basedupon this data the winter snow fall amount at MSP Airport was used to define average, dry (lowsnowfall – 90th percentile) and wet (10th percentile) conditions. The amount of deicer usage (sandand salt) varied between road class service levels, as did the ratio of sand and salt. The variation inweather patterns that determine the deicer usage appear to be too complex to define accurately acrossall of the basins on a year-to-year basis, so weather variability based upon annual snow fall and ratiosestablished between the districts was based upon the best data years (1994-98 and 2002-03). Table 8provides a tabular summary of the weather pattern, usage variability and the conditions selected foraverage, wet and dry years.
The initial attempt to estimate salt usage for the three scenarios was based upon these sameconditions and assumptions. A subsequent assessment of those results and the actual MnDOT usagelevels proved those assumptions to be invalid. Conversations with MnDOT staff strongly suggestedthat another estimation alternative would be needed to accurately predict the salt usage over thedifferent weather conditions. The total season usage levels of salt are more strongly influenced bythe number of events than the amount of snow, so the assumptions for sand and snowfall do not applyto salt. Also, since the implementation of the Salt Solutions study, the use of sand has been reducedand the amount of salt used has become more stable from year-to-year (Vasek, 2003). The salt usagerates that were used in the overall basin loading estimates are constant from year-to-year, but arevariable with regard to road type. These results were compared for accuracy and uncertainty to saltuse data for the last sevens years – the time period that coincides with implementation of the SaltSolutions study.

To: Marvin Hora, Mark Tomasek and Doug Hall, Minnesota Pollution Control AgencyFrom: Jeffrey LeeSubject: Detailed Assessment of Phosphorus Sources to Minnesota Watersheds – Deicing AgentsDate: December 17, 2003Page: 12
P:\23\62\853\Deicing Agents\DEIC Tech Memo\final v2 Technical Memorandum Deicer Phosphorus Sources.doc
MnDOT deicer usage data for the winters of 1994 – 1998 and the winter of 2002 – 2003 were alsoanalyzed to determine the differences in application rates for the various portions of the state basedupon the MnDOT Maintenance Districts and sub-district boundaries (SRF Consulting Group, 1998;MnDOT, 2003). This data shows that the Metro, Northeast and Southeast maintenance districts havethe highest application rates for deicers (see Table 6). An analysis was completed for the statehighway application rates for the Metro District and these were then adjusted based upon thevariation for application rates with the individual districts to estimate lane miles applications rates forthe three scenarios.
MnDOT databases and GIS were used to develop road miles for each county in the state and then theroad miles were distributed by basin based upon area-weighting within county boundaries. Roadswere categorized based upon the road type and lane miles as per Table 7.
Table 6. MnDOT Maintenance District Deicer Usage Rates Data – Comparison of UsageRates for the Winter of 2002 – 2003
“Dry year”(Winter of
2002 – 2003)District
ServiceLevel
AverageSand
(Tons)/LM
AverageSalt
(Tons)/LM
AverageBrine
(Gals)/LM
Salt +Sand
(Tons)/LM
PercentSalt+Sand
Use –higher/lowerthan Metro
TotalMiles
Serviced
1 ALL 7.83 6.93 70.9 14.76 25% 37841A ALL 6.6 7.01 48.15 13.61 15% 20101B ALL 9.41 6.93 99.06 16.34 38% 17282 ALL 3.5 2.5 9.62 6 -49% 39043 ALL 3.52 5.75 62.12 9.27 -22% 3987
3A ALL 5.1 5.46 40.3 10.56 -11% 19213B ALL 1.96 5.77 80.75 7.73 -35% 20664 ALL 3.41 3.46 40.81 6.87 -42% 3588
METRO ALL 0.4 11.43 8.63 11.83 0% 53336 ALL 4.52 7.95 62.42 12.47 5% 3691
6A ALL 7.51 7.44 75.36 14.95 26% 19176B ALL 1.28 8.5 48.44 9.78 -17% 17747 ALL 2.24 3.25 36.31 5.49 -54% 3217
7E ALL 1.27 3.62 44.52 4.89 -59% 16317W ALL 3.13 2.78 26.95 5.91 -50% 16398 ALL 3.62 2.61 42.57 6.23 -47% 2928
STATEWIDE ALL 3.49 5.91 40.08 9.4 -21% 30386

To: Marvin Hora, Mark Tomasek and Doug Hall, Minnesota Pollution Control AgencyFrom: Jeffrey LeeSubject: Detailed Assessment of Phosphorus Sources to Minnesota Watersheds – Deicing AgentsDate: December 17, 2003Page: 13
P:\23\62\853\Deicing Agents\DEIC Tech Memo\final v2 Technical Memorandum Deicer Phosphorus Sources.doc
Table 7. Total road lane miles by basin.
Road Type
UpperMississippi
River(LaneMiles)
St.CroixRiver(LaneMiles)
RedRiver of
theNorth(LaneMiles)
RainyRiver(LaneMiles)
MissouriRiver(LaneMiles)
MinnesotaRiver(LaneMiles)
LowerMississippi
(LaneMiles)
LakeSuperior
(LaneMiles)
DesMoinesRiver(LaneMiles)
CedarRiver(LaneMiles)
Interstate Trunk Highway 2,558 890 497 0 497 1,175 1,224 290 191 550
U. S. Trunk Highway 3,718 71 2,237 368 134 2,143 1,852 726 155 159Minnesota TrunkHighway 5,470 890 2,654 1,256 319 4,211 1,695 880 336 187County State-aidHighway 16,640 2,705 11,779 2,456 1,761 14,768 6,652 2,871 1,538 1,207Municipal State-aidStreet 3,799 202 254 18 10 1,271 660 515 13 130
County Road 7,980 1,510 6,113 2,136 839 6,273 1,909 2,556 382 354
Township Road 26,665 4,185 27,859 1,210 3,713 28,613 11,425 1,801 3,285 2,035Unorganized TownshipRoad 554 68 578 1,686 0 0 0 379 0 0
Municipal Street 16,886 1,696 1,821 269 305 6,235 3,649 1,713 368 497National ForestDevelopment Road 831 0 0 816 0 0 0 1,000 0 0
Indian Reservation Road 83 0 633 94 0 0 0 0 0 0
State Forest Road 667 159 579 1,011 0 0 116 270 0 0
State Park Road 29 58 27 16 2 17 16 6 1 1National Wildlife RefugeRoad 0 0 0 0 0 10 0 0 0 0
Frontage Road 0 0 0 0 0 0 0 2 0 0
Ramp 331 31 30 2 11 155 72 26 4 27
Private Jurisdiction Road 17 3 0 0 0 35 0 0 0 0
Other 15 2 5 61 1 14 2 3 1 0
Total 86,240 12,469 55,066 11,399 7,592 64,919 29,271 13,038 6,275 5,147

To: Marvin Hora, Mark Tomasek and Doug Hall, Minnesota Pollution Control AgencyFrom: Jeffrey LeeSubject: Detailed Assessment of Phosphorus Sources to Minnesota Watersheds – Deicing AgentsDate: December 17, 2003Page: 14
P:\23\62\853\Deicing Agents\DEIC Tech Memo\final v2 Technical Memorandum Deicer Phosphorus Sources.doc
Table 8. Summary statisatics for MnDOT deicing applications for winters 1971 - 2003 and 1996 - 2003.
1971 - 2003 Snowfall (inches)
Sand (Tons)
Sand Applied (Tons/LM)
Chemical Applied (Salt
Tons)Salt Applied (Tons/LM)
Sand+Salt Applied (Tons)
Sand+Salt Applied
(Tons/LM)Percent salt
(tons/LM)
MAX = 99 397,798 13 251,159 8 620,448 20 75%MIN = 17 106,478 4 56,295 2 224,634 7 34%AVG = 58 279,765 9 154,956 5 434,721 14 64%
90th %ile 36 284,157 6 150,031 3 431,827 11 52%Median 57 367,906 9 229,040 5 558,405 14 68%
10th %ile 76 174,393 12 95,325 8 326,804 18 72%
>90th %ile mean 24 177,818 6 117,483 4 295,301 10 60%Mean 58 279,765 9 154,956 5 434,721 14 64%
<10th %ile mean 92 311,035 10 142,937 5 453,971 15 69%
1996 - 2003
MAX = 76 369,289 12 251,159 8 620,448 20 59.5%MIN = 35 106,478 4 171,087 6 287,039 9 33.6%AVG = 55 220,529 7 215,445 7 435,974 14 48.6%Median 57 229,263 8 222,894 7 441,526 15 51.9%Median 57 229,263 8 222,894 7 441,526 15 51.9%
* Assumes 30,386 Total Miles Serviced Statewide (2002-03 MNDOT data) for 1971 - 2003 time period** Within percentile values used for analysis based upon >10th %tile and <90 %tile, respectively for 1971 - 2003 only

To: Marvin Hora, Mark Tomasek and Doug Hall, Minnesota Pollution Control AgencyFrom: Jeffrey LeeSubject: Detailed Assessment of Phosphorus Sources to Minnesota Watersheds – Deicing AgentsDate: December 17, 2003Page: 15
P:\23\62\853\Deicing Agents\DEIC Tech Memo\final v2 Technical Memorandum Deicer Phosphorus Sources.doc
Approach and Methodology for Phosphorus Loading Computations
Phosphorus loading computations were primarily based upon the MnDOT data sources as this was the mostdetailed data set and extended over the longest time period. Loading calculations for TCMA counties werefrom SRF Consulting Group (1998) and other road types were extrapolated using the MnDOT data trends,applications rates and deicing mixtures. The following discussion of loading rate calculations is organizedaround the application of deicing agents to the road classification based upon level of governmentmaintaining the particular road type.
MnDOT Maintained Roads:
As has been previously mentioned, the MnDOT database was the most comprehensive and most useful indetermining application rates across the range of conditions for wet, dry and average years. Table 8presented the summary of weather patterns and application rates for the 1971 – 2003 time period. This dataassessment shows that dry years result in decreased usage and wet years increase usage rates. The period ofrecord used in this analysis was not used any further for the loading calculations as much of the data is fromwinters prior to the Salt Solutions Report (SRF Consulting Group, 1998) and thus may not be indicative ofcurrent winter road maintenance practices. It does however provide strong support for the adjustment ofapplication rates due to weather variability from year-to-year based upon snowfall amounts.
The applications rates for each MnDOT District, and thus for each basin, is based upon the use of statewideaverages based upon their relationship to snowfall amounts over a winter. Application rates for salt and sandwere then adjusted to account for the wet, dry and average conditions based upon the ratios derived from the1971 – 2003 time period and the relationship between the years of detailed information provided in the SaltSolutions Report and MnDOT’s Work Management System Reports (SRF Consulting Group, 1998; MnDOT,2003;). See Tables 9 – 11 for the results of these calculations for salt, sand and brine use for each scenariofor the state highway types.
The use of brine for deicing has increased in recent years, but the period of record for its application islimited and thus 2002 rates were used in the calculations as insufficient data was available to attempt toadjust for year-to-year variability in its application rate. The NaCl brine solution used by MnDOT is a 26%solution having a delivered concentration of phosphorus of 0.49 ppm per gallon. MnDOT has also recentlystarted use of MgCl2 , with 78,199 gallons applied in 2002 – 03 in Districts 1, 2 and 3 combined. MnDOTuses a number of different MgCl2-based deicing agents in various quantities; Calibre M1000, Calibre M2000,30% MgCl2 , and Freezgard Zero. The current data does not provide a breakdown of the amounts of eachdeicer, but if for discussion purposes the total volume applied was for each of the alternative compoundsthen the quantity of phosphorus would be as follows: Deicing Compound Phosphorus concentration Kg of P for 78,199 gallons per year
Calibre M1000 76 ppm P 1.6 kg P
Calibre M2000 249 ppm P 5.1 kg P30% MgCl2 6.2 ppm P 0.13 kg P
Freezgard Zero 42 ppm P 0.87 kg P

To: Marvin Hora, Mark Tomasek and Doug Hall, Minnesota Pollution Control AgencyFrom: Jeffrey LeeSubject: Detailed Assessment of Phosphorus Sources to Minnesota Watersheds – Deicing AgentsDate: December 17, 2003Page: 16
P:\23\62\853\Deicing Agents\DEIC Tech Memo\final v2 Technical Memorandum Deicer Phosphorus Sources.doc
The limited quantity of phosphorus involved in this current use (less than 0.001% of annual deicer load), theshort-term experience for use of these compounds, and limited records of use did not warrant its inclusion inthis analysis.

To: Marvin Hora, Mark Tomasek and Doug Hall, Minnesota Pollution Control AgencyFrom: Jeffrey LeeSubject: Detailed Assessment of Phosphorus Sources to Minnesota Watersheds – Deicing AgentsDate: December 17, 2003Page: 17
P:\23\62\853\Deicing Agents\DEIC Tech Memo\final v2 Technical Memorandum Deicer Phosphorus Sources.doc
Table 9. MnDOT Dry Year Deicer Usage Rate Calculations Based Upon 2002 - 2003 (Dry Year) Recorded Usage
"Dry year" Average Sand
(Tons)/LMAverage Salt (Tons)/LM
Average Sand (Tons)/LM
Average Salt (Tons)/LM
Average Sand (Tons)/LM
Average Salt (Tons)/LM
Average Brine (Gals)/LM
District All State Roads1 0 14.76 4.43 10.33 7.38 7.38 70.9
1A 0 13.61 4.08 9.53 6.81 6.81 48.151B 0 16.34 4.90 11.44 8.17 8.17 99.062 0 6.00 1.80 4.20 3.00 3.00 9.623 0 9.27 2.78 6.49 4.64 4.64 62.12
3A 0 10.56 3.17 7.39 5.28 5.28 40.33B 0 7.73 2.32 5.41 3.87 3.87 80.754 0 6.87 2.06 4.81 3.44 3.44 40.81
METRO 0 11.83 3.55 8.28 5.92 5.92 8.636 0 12.47 3.74 8.73 6.24 6.24 62.42
6A 0 14.95 4.49 10.47 7.48 7.48 75.366B 0 9.78 2.93 6.85 4.89 4.89 48.447 0 5.49 1.65 3.84 2.75 2.75 36.31
7E 0 4.89 1.47 3.42 2.45 2.45 44.527W 0 5.91 1.77 4.14 2.96 2.96 26.958 0 6.23 1.87 4.36 3.12 3.12 42.57
Interstate Trunk Highways US Trunk Highways Minnesota Trunk Highways

To: Marvin Hora, Mark Tomasek and Doug Hall, Minnesota Pollution Control AgencyFrom: Jeffrey LeeSubject: Detailed Assessment of Phosphorus Sources to Minnesota Watersheds – Deicing AgentsDate: December 17, 2003Page: 18
P:\23\62\853\Deicing Agents\DEIC Tech Memo\final v2 Technical Memorandum Deicer Phosphorus Sources.doc
Table 10. MnDOT Average Year Deicer Usage Rate Calculations Based Upon 2002 - 2003 (Dry Year) Recorded Usage
"Average year" Average Sand
(Tons)/LMAverage Salt (Tons)/LM
Average Sand (Tons)/LM
Average Salt (Tons)/LM
Average Sand (Tons)/LM
Average Salt (Tons)/LM
Average Brine (Gals)/LM
District All State Roads1 0 14.76 9.32 10.33 15.53 7.38 70.9
1A 0 13.61 11.18 9.53 18.63 6.81 48.151B 0 16.34 4.13 11.44 6.89 8.17 99.062 0 6.00 6.32 4.20 10.53 3.00 9.623 0 9.27 7.21 6.49 12.02 4.64 62.12
3A 0 10.56 5.27 7.39 8.78 5.28 40.33B 0 7.73 4.70 5.41 7.83 3.87 80.754 0 6.87 8.10 4.81 13.50 3.44 40.81
METRO 0 11.83 8.51 8.28 14.18 5.92 8.636 0 12.47 10.21 8.73 17.01 6.24 62.42
6A 0 14.95 6.72 10.47 11.21 7.48 75.366B 0 9.78 3.73 6.85 6.21 4.89 48.447 0 5.49 3.32 3.84 5.54 2.75 36.31
7E 0 4.89 4.05 3.42 6.75 2.45 44.527W 0 5.91 4.29 4.14 7.16 2.96 26.958 0 6.23 0.00 4.36 0.00 3.12 42.57
Interstate Trunk Highways US Trunk Highways Minnesota Trunk Highways

To: Marvin Hora, Mark Tomasek and Doug Hall, Minnesota Pollution Control AgencyFrom: Jeffrey LeeSubject: Detailed Assessment of Phosphorus Sources to Minnesota Watersheds – Deicing AgentsDate: December 17, 2003Page: 19
P:\23\62\853\Deicing Agents\DEIC Tech Memo\final v2 Technical Memorandum Deicer Phosphorus Sources.doc
Table 11. MnDOT Wet Year Deicer Usage Rate Calculations Based Upon 2002 - 2003 (Dry Year) Recorded Usage
"Wet year" Average Sand
(Tons)/LMAverage Salt (Tons)/LM
Average Sand (Tons)/LM
Average Salt (Tons)/LM
Average Sand (Tons)/LM
Average Salt (Tons)/LM
Average Brine (Gals)/LM
District All State Roads1 0 14.76 16.88 10.33 28.13 7.38 70.9
1A 0 13.61 15.53 9.53 25.88 6.81 48.151B 0 16.34 18.63 11.44 31.05 8.17 99.062 0 6.00 6.89 4.20 11.48 3.00 9.623 0 9.27 10.53 6.49 17.55 4.64 62.12
3A 0 10.56 12.02 7.39 20.03 5.28 40.33B 0 7.73 8.78 5.41 14.63 3.87 80.754 0 6.87 7.83 4.81 13.05 3.44 40.81
METRO 0 11.83 13.50 8.28 22.50 5.92 8.636 0 12.47 14.18 8.73 23.63 6.24 62.42
6A 0 14.95 17.01 10.47 28.35 7.48 75.366B 0 9.78 11.21 6.85 18.68 4.89 48.447 0 5.49 6.21 3.84 10.35 2.75 36.31
7E 0 4.89 5.54 3.42 9.23 2.45 44.527W 0 5.91 6.75 4.14 11.25 2.96 26.958 0 6.23 7.16 4.36 11.93 3.12 42.57
Interstate Trunk Highways US Trunk Highways Minnesota Trunk Highways

To: Marvin Hora, Mark Tomasek and Doug Hall, Minnesota Pollution Control AgencyFrom: Jeffrey LeeSubject: Detailed Assessment of Phosphorus Sources to Minnesota Watersheds – Deicing AgentsDate: December 17, 2003Page: 20
P:\23\62\853\Deicing Agents\DEIC Tech Memo\final v2 Technical Memorandum Deicer Phosphorus Sources.doc
Application rates for state highways for all Districts used for the “dry” year scenario used application ratesbased upon the recorded uses for the winter of 2002 – 03. The level of detail in Work Management SystemReports allowed for the development of usage rates for each of the districts and some of the sub-districts.Salt usage rates remained constant at the 2002 – 2003 rates throughout the three loading scenarios and variedbased upon the sand/salt ratios described for each service level below.
“Wet” year conditions were calculated using the Metro District data for the winters of 1995 – 97 and thenadjusting for the other district usage rates based upon percentage differences using the 2002 – 03 data. Whilethe years of 1995 – 97 were not within the 10th percentile of the years from 1971 – 2003 dataset, they werethe wettest years for the time period since the implementation of the Salt Solutions Report recommendationsand are the usage estimates that provided the closest agreement with actual use rates for sand (SRFConsulting Group, 1998).
“Average” year conditions and sand usage rates were calculated in a similar fashion using the winter of 1994– 95 data and extrapolating to the other districts. Development of usage rates to the sub-district levelallowed for a finer scale of estimation as to state highway loadings across the basins. See Figure 1 forMnDOT District, sub-district and watershed basin boundaries.
MnDOT’s road classes (service levels) were used to further define the application assumptions for the mixratios of deicers used on the three road types maintained by MnDOT. Based upon and examination of the2003 – 02 deicer usage report the total salt plus sand application, in tons per lane mile, was modified for thethree types of roads maintained by MnDOT (MnDOT, 2003a).
01 - Interstate Trunk Highway – uses a 100% salt assumption (assuming "super commuter" servicelevel)
02 - U.S. Trunk Highway – uses a 70% salt assumption (assuming "urban commuter" service level)03 - Minnesota Trunk Highway – uses a 50% salt assumption (assuming "rural commuter" service
level)
County and Local Government Maintained Roads:
County and local road agency specific data was less readily available for use in this analysis, except for theTCMA counties (SRF Consulting Group, 1998). An analysis was undertaken using the 1994 – 1997 dataavailable for the TCMA to develop usage rates for the County State Aid Highway (CSAH) system. TheTCMA deicer usage rates were summarized based upon average conditions (1994 – 95) for both salt and sandusage on a lane mile basis. The 1995 – 1997 period was used for calculation of the wet year conditions. Thedry year conditions were used based upon the 90th percentile summary statistics presented in Table 8. Theseusage numbers were applied to all CSAH miles across the state as they were viewed as the more heavilytraveled and thus more highly maintained roads in both the TCMA and out-state areas. These usage numbersare conservatively high based upon the sand to salt ratios reported in the Minnesota Legislative Auditor(1995) report, with a salt percentage of 33%. The sand and salt application rates used for this analysis areshown in Table 12.

To: Marvin Hora, Mark Tomasek and Doug Hall, Minnesota Pollution Control AgencyFrom: Jeffrey LeeSubject: Detailed Assessment of Phosphorus Sources to Minnesota Watersheds – Deicing AgentsDate: December 17, 2003Page: 21
P:\23\62\853\Deicing Agents\DEIC Tech Memo\final v2 Technical Memorandum Deicer Phosphorus Sources.doc
Table 12. Sand and Salt Application Rates for County State Aid Highways for Loading Calculations.
Year Sand (tons/LM) Salt (tons/LM)Dry 7.1 3.2Average 10.0 5.0Wet 15.5 7.5
Deicer usage rates for other county highways and local roads were developed based upon an even smallerdatabase of actual usage rates. As such, the usage rates for the “rural” counties in the TCMA – Scott, Carverand Chisago counties – were used to develop usage rates for other roads included in this analysis. Ananalysis was undertaken using the 1994 – 1997 data available for these TCMA in manner consistent with theCSAH analysis described above. Again this estimate is conservatively high due to a lack of actualapplications rate up0n which to further refine the estimates. Those rates are presented in Table 13.
Table 13. Sand and Salt Application Rates for County and Local Roads for Loading Calculations.
Year Sand (tons/LM) Salt (tons/LM)Dry 3.8 1.4Average 6.0 2.0Wet 7.5 2.5

To: Marvin Hora, Mark Tomasek and Doug Hall, Minnesota Pollution Control AgencyFrom: Jeffrey LeeSubject: Detailed Assessment of Phosphorus Sources to Minnesota Watersheds – Deicing AgentsDate: December 17, 2003Page: 22
P:\23\62\853\Deicing Agents\DEIC Tech Memo\final v2 Technical Memorandum Deicer Phosphorus Sources.doc
Results of Phosphorus Loading Computations and Assessments
The basin loading calculations were computed using the application rates and concentrations defined in theApproach and Methodology section for the lane miles in each basin. Each basin calculation was completedusing the application rates for the respective MnDOT Districts that encompass the basin; whenever the basinincludes TCMA counties, those state highway lane miles were calculated using the higher Metro Districtrates for each county. Table 14 provides a summary of the district and Metro counties included in each basincalculation.
Table 14. Summary of the district and Metro counties included in each basin calculation.Basin MnDOT District Metro District
(state roads) (Metro counties)St. Croix River 1A Chisago, Ramsey, Washington
Upper Mississippi River 3Anoka, Carver, Dakota, Hennepin, Ramsey,Washington
Lower Mississippi River 6 Dakota, ScottRed River 2 & 4 avgRainy River 1BLake Superior 1AMissouri River 7WMinnesota River 7 & 8 avg Carver, Dakota, Hennepin, ScottCedar River 6BDes Moines River 7W
Table 15 presents the phosphorus loading results for each of the basins under the three loading scenarios anda summary for the state-wide total phosphorus load from deicing agents under the same three scenarios.

To: Marvin Hora, Mark Tomasek and Doug Hall, Minnesota Pollution Control AgencyFrom: Jeffrey LeeSubject: Detailed Assessment of Phosphorus Sources to Minnesota Watersheds – Deicing AgentsDate: December 17, 2003Page: 23
P:\23\62\853\Deicing Agents\DEIC Tech Memo\final v2 Technical Memorandum Deicer Phosphorus Sources.doc
Table 15. Phosphorus loading results for Minnesota basins and state-wide totals for three snowfall scenarios.
BasinSnowfallScenario
Tons ofSalt
Tons ofSand
Gallons ofBrine
Kg PfromSalt
Kg PfromSand
Kg PfromBrine
Total KgP
Dry Year 37,525 55,343 59,431 170 1893 0.03 2,063
Avg Year 47,143 88,364 59,431 213 3022 0.03 3,236St. Croix River
Wet Year 57,862 124,331 59,431 262 4252 0.03 4,514
Dry Year 214,976 376,477 521,969 973 12876 0.26 13,849
Avg Year 279,640 600,253 521,969 1266 20529 0.26 21,795Upper
Mississippi River
Wet Year 350,167 835,955 521,969 1585 28590 0.26 30,176
Dry Year 88,034 132,454 268,117 399 4530 0.13 4,929
Avg Year 110,716 213,189 268,117 501 7291 0.13 7,793Lower
Mississippi River
Wet Year 136,270 302,924 268,117 617 10360 0.13 10,977
Dry Year 112,554 240,506 135,874 510 8226 0.07 8,735
Avg Year 156,495 374,579 135,874 708 12811 0.07 13,519Red River
Wet Year 204,893 546,846 135,874 928 18703 0.07 19,630
Dry Year 32,576 57,318 160,864 147 1960 0.08 2,108
Avg Year 41,389 95,993 160,864 187 3283 0.08 3,470Rainy River
Wet Year 51,190 138,824 160,864 232 4748 0.08 4,980
Dry Year 37,625 60,767 91,289 170 2078 0.04 2,249
Avg Year 47,755 98,765 91,289 216 3378 0.04 3,594Lake Superior
Wet Year 59,068 140,577 91,289 267 4808 0.04 5,075
Dry Year 16,903 32,231 25,586 77 1102 0.01 1,179
Avg Year 23,002 49,589 25,586 104 1696 0.01 1,800Missouri River
Wet Year 29,845 68,392 25,586 135 2339 0.01 2,474
Dry Year 141,111 285,517 251,770 639 9765 0.12 10,404
Avg Year 193,267 446,062 251,770 875 15256 0.12 16,131Minnesota River
Wet Year 251,497 589,445 251,770 1138 20160 0.12 21,298
Dry Year 15,504 21,514 43,379 70 736 0.02 806
Avg Year 19,503 33,493 43,379 88 1145 0.02 1,234Cedar River
Wet Year 24,042 46,803 43,379 109 1601 0.02 1,710
Dry Year 13,370 27,606 18,403 61 944 0.01 1,005
Avg Year 18,573 42,620 18,403 84 1458 0.01 1,542Des Moines
River
Wet Year 24,447 59,097 18,403 111 2021 0.01 2,132
To: Marvin Hora, Mark Tomasek and Doug Hall, Minnesota Pollution Control AgencyFrom: Jeffrey LeeSubject: Detailed Assessment of Phosphorus Sources to Minnesota Watersheds – Deicing AgentsDate: December 17, 2003Page: 24
P:\23\62\853\Deicing Agents\DEIC Tech Memo\final v2 Technical Memorandum Deicer Phosphorus Sources.doc
Tons ofSalt
Tons ofSand
Gallons ofBrine
Kg PfromSalt
Kg PfromSand
Kg PfromBrine
Total KgP
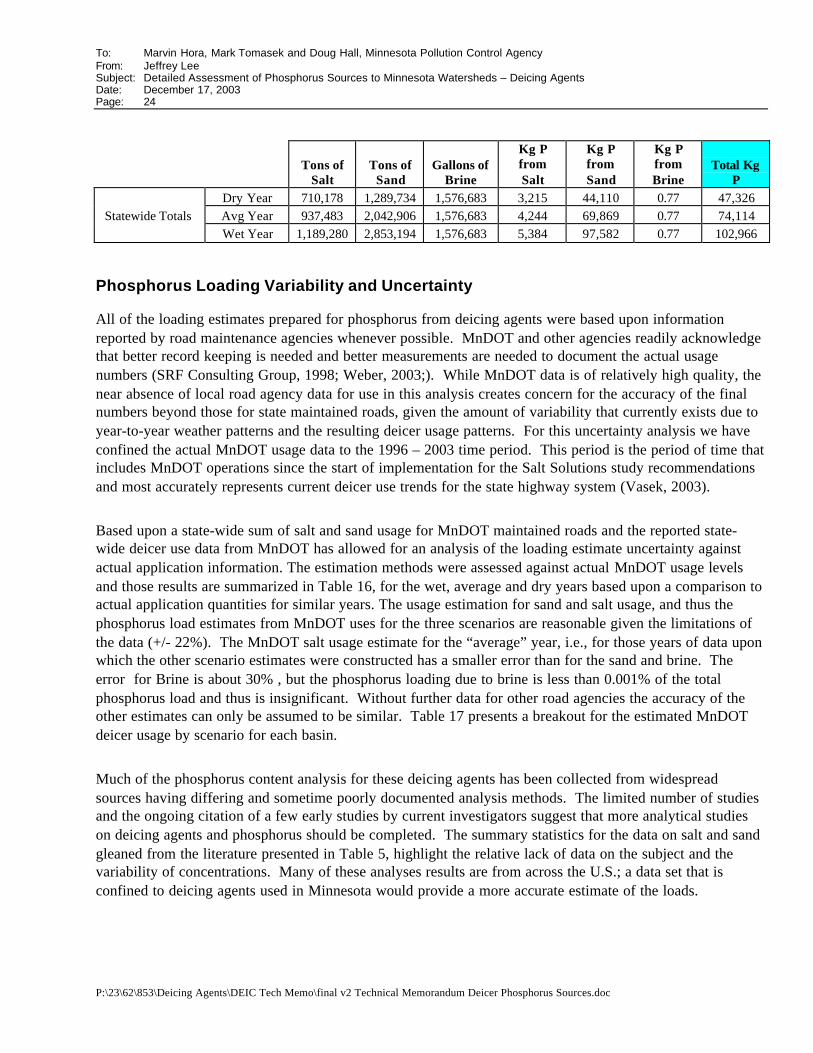
Dry Year 710,178 1,289,734 1,576,683 3,215 44,110 0.77 47,326Statewide Totals Avg Year 937,483 2,042,906 1,576,683 4,244 69,869 0.77 74,114
Wet Year 1,189,280 2,853,194 1,576,683 5,384 97,582 0.77 102,966
Phosphorus Loading Variability and Uncertainty
All of the loading estimates prepared for phosphorus from deicing agents were based upon informationreported by road maintenance agencies whenever possible. MnDOT and other agencies readily acknowledgethat better record keeping is needed and better measurements are needed to document the actual usagenumbers (SRF Consulting Group, 1998; Weber, 2003;). While MnDOT data is of relatively high quality, thenear absence of local road agency data for use in this analysis creates concern for the accuracy of the finalnumbers beyond those for state maintained roads, given the amount of variability that currently exists due toyear-to-year weather patterns and the resulting deicer usage patterns. For this uncertainty analysis we haveconfined the actual MnDOT usage data to the 1996 – 2003 time period. This period is the period of time thatincludes MnDOT operations since the start of implementation for the Salt Solutions study recommendationsand most accurately represents current deicer use trends for the state highway system (Vasek, 2003).
Based upon a state-wide sum of salt and sand usage for MnDOT maintained roads and the reported state-wide deicer use data from MnDOT has allowed for an analysis of the loading estimate uncertainty againstactual application information. The estimation methods were assessed against actual MnDOT usage levelsand those results are summarized in Table 16, for the wet, average and dry years based upon a comparison toactual application quantities for similar years. The usage estimation for sand and salt usage, and thus thephosphorus load estimates from MnDOT uses for the three scenarios are reasonable given the limitations ofthe data (+/- 22%). The MnDOT salt usage estimate for the “average” year, i.e., for those years of data uponwhich the other scenario estimates were constructed has a smaller error than for the sand and brine. Theerror for Brine is about 30% , but the phosphorus loading due to brine is less than 0.001% of the totalphosphorus load and thus is insignificant. Without further data for other road agencies the accuracy of theother estimates can only be assumed to be similar. Table 17 presents a breakout for the estimated MnDOTdeicer usage by scenario for each basin.
Much of the phosphorus content analysis for these deicing agents has been collected from widespreadsources having differing and sometime poorly documented analysis methods. The limited number of studiesand the ongoing citation of a few early studies by current investigators suggest that more analytical studieson deicing agents and phosphorus should be completed. The summary statistics for the data on salt and sandgleaned from the literature presented in Table 5, highlight the relative lack of data on the subject and thevariability of concentrations. Many of these analyses results are from across the U.S.; a data set that isconfined to deicing agents used in Minnesota would provide a more accurate estimate of the loads.

To: Marvin Hora, Mark Tomasek and Doug Hall, Minnesota Pollution Control AgencyFrom: Jeffrey LeeSubject: Detailed Assessment of Phosphorus Sources to Minnesota Watersheds – Deicing AgentsDate: December 17, 2003Page: 25
P:\23\62\853\Deicing Agents\DEIC Tech Memo\final v2 Technical Memorandum Deicer Phosphorus Sources.doc
Table 16. Comparison of calculated and actual statewide deicer usage on Minnesota state highway system.
Snowfall Scenario Calculated Actual % DifferenceDatabase Year(s) Tons sand Tons sand (calc/actual)
Calculated dry year 118,3582002 - 03 106,478
Calculated average year 268,874Mean 1996 - 2003 220,529
Calculated wet year 448,5221996 - 1997 369,289
Calculated Actual DifferenceTons salt Tons salt %
Calculated 242,177Median 1996 - 2003 222,894
Calculated Actual DifferenceGallons Brine Gallons Brine %
Calculated average year 1,576,6832002 -2003 1,215,915
129.67%
111.16%
121.92%
121.46%
108.65%

To: Marvin Hora, Mark Tomasek and Doug Hall, Minnesota Pollution Control AgencyFrom: Jeffrey LeeSubject: Detailed Assessment of Phosphorus Sources to Minnesota Watersheds – Deicing AgentsDate: December 17, 2003Page: 26
P:\23\62\853\Deicing Agents\DEIC Tech Memo\final v2 Technical Memorandum Deicer Phosphorus Sources.doc
Table 17. Estimated deicer usage totals by basin for Interstate, US Trunk and Minnesota Trunk highways.
BasinLow YearSalt (tons)
Low YearSand (tons)
Avg YearSalt (tons)
Avg YearSand (tons)
High YearSalt (tons)
High YearSand (tons)
Brine(gallons)
Upper Mississippi River 80,732 38,486 80,732 86,725 80,732 144,126 521,969St. Croix River 17,789 6,065 17,789 13,830 17,789 23,048 59,431Red River 21,801 12,857 21,801 29,393 21,801 80,026 135,874Rainy River 14,469 12,066 14,469 27,515 14,469 45,858 160,864Missouri River 4,434 1,180 4,434 2,692 4,434 4,487 25,586Minnesota River 34,183 18,699 34,183 42,648 34,183 40,875 251,770Lower Mississippi River 41,761 17,404 41,761 39,583 41,761 65,961 268,117Lake Superior 16,858 8,954 16,858 20,431 16,858 34,046 91,289Cedar River 7,381 1,378 7,381 3,159 7,381 5,265 43,379Des Moines River 2,769 1,270 2,769 2,899 2,769 4,831 18,403 Estimated MnDOT Deicer Use 242,177 118,358 242,177 268,874 242,177 448,522 1,576,683Estimated Total Deicer Use 710,178 1,289,734 1,246,445 2,042,906 1,868,976 2,853,194 1,576,683
MnDOT Percentage 34.1% 9.2% 19.4% 13.2% 13.0% 15.7% 100.0%

To: Marvin Hora, Mark Tomasek and Doug Hall, Minnesota Pollution Control AgencyFrom: Jeffrey LeeSubject: Detailed Assessment of Phosphorus Sources to Minnesota Watersheds – Deicing AgentsDate: December 17, 2003Page: 27
P:\23\62\853\Deicing Agents\DEIC Tech Memo\final v2 Technical Memorandum Deicer Phosphorus Sources.doc
Recommendations for Future Refinements
See previous section for relevant discussion.
Recommendations for Lowering Phosphorus Export
Efforts currently underway as part of MnDOT’s road weather information system (RWIS) use timelyand accurate weather and road data in deicing application decisions; these efforts have optimized theuse of deicing materials. The Minnesota Legislative Auditor (1995) reported that “(M)ost counties(93 percent), cities providing their own service (91 percent), and townships providing their ownservice (59 percent) rely on television or radio weather reports, including the National WeatherService reports via telephone, for weather information.” More accurate weather information couldlead to reduced usage of deicing agents. The use of brines can also improve the effectiveness ofdeicing agents and in all cases where the quantities of deicers are reduce there as cost savings to theroad agency and safety benefits to the public.
The high phosphorus content of many of the agriculturally derived alternatives to road salt isnoteworthy. In most cases the high phosphorus content for the alternatives is due to the corrosioninhibitor portion of the mixtures. As concerns for the environmental impacts has chlorides increased,additional emphasis may be placed on the use of these alternatives. While this analysis does notmake any attempt to quantify what those impacts would be, a cursory evaluation of theconcentrations shows that many of these products have phosphorus concentrations 100 to 10,000times greater than road salt or sand.

To: Marvin Hora, Mark Tomasek and Doug Hall, Minnesota Pollution Control AgencyFrom: Jeffrey LeeSubject: Detailed Assessment of Phosphorus Sources to Minnesota Watersheds – Deicing AgentsDate: December 17, 2003Page: 28
P:\23\62\853\Deicing Agents\DEIC Tech Memo\final v2 Technical Memorandum Deicer Phosphorus Sources.doc
Literature Cited
Alger, R.G., Adams, E.E. and Beckwith, J.P. 1993. Development of Anti-Icing Technology -Chemical Treatment - Controlled Access Highway, Strategic Highway Research Program -National Research Council.
Barr Engineering Company. 1993. Phosphorus Reduction Study for the Twin Cities MetropolitanArea. Prepared for the Minnesota Pollution Control Agency.
Biesboer, David and Robert Jacobson. 1993. Screening and Selection of Salt Tolerance in NativeWarm Season Grasses. Minnesota Department of Transportation, Report 94-11.
City of Minneapolis and Minneapolis Park and Recreation Board. 2003. NPDES StormwaterManagement Program and Annual Report. Prepared by Minneapolis Public Works Department incompliance with NPDES Permit No. MN0061018
Duluth Streams.org. 2003. Road Salt: Can we have safe roads and healthy streams?http://www.duluthstreams.org/understanding/impact_salt.html
Environment Canada and Health Canada. 2001. Priority Substances List Assessment Report - RoadSalts. Environment Canada and Health Canada, Hull, Québec.http://www.ec.gc.ca/substances/ese/eng/psap/final/roadsalts.cfm
Fischel, Marion. 2001. Evaluation of Selected Deicers Based on a Review of the Literature. ReportNo. CDOT-DTD-R-2001-15. Prepared for Colorado Department of Transportation. The SeaCrestGroup, Louisville, CO. http://www.dot.state.co.us/Publications/PDFFiles/deicers.pdf
Goldman, C.R. and Hoffman, R.W. 1975. A study of the influence of highway deicing agents on theaquatic environment in the Lake Tahoe basin and drainages along Interstate 80. EcologicalAssociates Report, California Department of Transportation. Cited in: Environment Canada andHealth Canada, 2001.
Hanes, R.E., L.W. Zelazny and R.E. Blaser. 1970. Effects of deicing salts on water quality and biota;literature review and recommended research. National Cooperative Highway Research Program,Report 91.
Levelton Engineering Ltd. 2000. Anti Icers – Chemical Analysis and Toxicity Test Results.Prepared for the Insurance Corporation of British Columbia, Kamloops, BC.
Levelton Engineering Ltd. 1999. Freezgard Zero Chemical and Toxicity Testing. Prepared for theInsurance Corporation of British Columbia, Kamloops, BC.
Levelton Engineering Ltd. 1998. Liquid Road deicing Environmental Impact. Prepared for theInsurance Corporation of British Columbia, Kamloops, BC.

To: Marvin Hora, Mark Tomasek and Doug Hall, Minnesota Pollution Control AgencyFrom: Jeffrey LeeSubject: Detailed Assessment of Phosphorus Sources to Minnesota Watersheds – Deicing AgentsDate: December 17, 2003Page: 29
P:\23\62\853\Deicing Agents\DEIC Tech Memo\final v2 Technical Memorandum Deicer Phosphorus Sources.doc
Lewis, W.M., Jr. 1999. Studies of environmental effects of magnesium chloride deicer in Colorado.Prepared for the Colorado Department of Transportation, Denver, CO.
Lord, B.N. 1988. Program to Reduce Deicing Chemical Usage. Design of Urban Runoff QualityControls.
Mangold, T. 2000. Road Salt Use for Winter Maintenance: A Review of Impacts, Alternatives, andRecommendations for the St. Paul Campus Stormwater Management Plan. Prepared forNRES5061, St. Paul MN.
Minnesota Legislative Auditor. 1995. Snow and Ice Control: A Best Practices Review. Report #95-06. Office of the Legislative Auditor, State of Minnesota. St. Paul, MN.
MnDOT. Undated. How does Mn/DOT set targets for snow & ice removal?http://www.dot.state.mn.us/dashboards/snowandice.html
MnDOT, 2003a. Sand, Salt and Brine Usage Coverage Rates by Lane Miles Only. WorkManagement System Report PS1A6.
MnDOT Office of Maintenance, 2003, Winter Maintenance Material Usage Reports for 2000-2001,2001-2002, and 2002-2003. Electronic worksheets provided by Steve (Rocky) Haider,Maintenance Business Planning Administrator.
MnDOT Office of Transportation Data & Analysis. 2002. Statewide Mileage and Lane Miles.
Report 1: By County / Route System and by Route System Only
Report 2: By Construction District / Metro Division and Route System (Trunk Highways)
Report 3: —By County/City/Route System —By City only —By Route System Only
Report 4: By County / Surface Type and by Surface Type only
http://www.dot.state.mn.us/tda/reports/mileage_lanemiles.html
Oberts, G.L. 1986. Pollutants Associated with Sand and Salt Applied to Roads in Minnesota. WaterResources Bulletin, 22(3):479-483.
Ohrel, R.L. 2000. Rating deicing agents: salt still stands firm. (Watershed Protection Techniques1(4):217-220). In: Schueler, T.R. and H.K. Holland. 2000. The Practice of Watershed Protection.The Center for Watershed Protection.
Pacific Northwest Snowfighters. 2002. Snow and ice control chemical products specifications andtesting protocols for the PNS Association of British Columbia, Idaho, Montana, Oregon andWashington. http://www.wsdot.wa.gov/partners/pns/pdf/PNS_SPECS_2002_FINAL.pdf

To: Marvin Hora, Mark Tomasek and Doug Hall, Minnesota Pollution Control AgencyFrom: Jeffrey LeeSubject: Detailed Assessment of Phosphorus Sources to Minnesota Watersheds – Deicing AgentsDate: December 17, 2003Page: 30
P:\23\62\853\Deicing Agents\DEIC Tech Memo\final v2 Technical Memorandum Deicer Phosphorus Sources.doc
Public Sector Consultants. 1993. The Use of Selected Deicing Materials on Michigan Roads:Environmental and Economic Impacts. Prepared for the Michigan Department of Transportation.http://www.michigan.gov/documents/toc-deice_51451_7.pdf
Ramsey-Washington Metro Watershed District. 1999. RWMWD City Street Management Database –Fall 1999. Electronic graphic file document.
SRF Consulting Group, 1998. Salt Solutions - Statewide Salt and Sand Reduction. Prepared for theMinnesota Department of Transportation Evaluation Report MN/RC – 1988-20. St. Paul, MN.Trost, S.E., Heng, F.J., and Cussler, E.L., 1988, Chemistry of Deicing Roads - Penetrating theIce. Minnesota Department of Transportation UM-TOC-25; MN/RC-88/6.
`Tierney, J. and Silver, C. 2002. Scientific Guidance on Lower-Phosphorus Roadway De-icers. NewYork State Attorney General's Office, Albany NY.
Trost, S.E., Heng, F.J., and Cussler, E.L., 1988, Chemistry of Deicing Roads - Penetrating the Ice.Minnesota Department of Transportation UM-TOC-25; MN/RC-88/6.
U.S. Department of Transportation Federal Highway Administration, 1996. Manual of Practice forEffective Anti-icing Program: A Guide for Highway Winter Maintenance Personnel. ElectronicVersion of Publication No. FHWA-RD-95-202.http://www.fhwa.dot.gov/reports/mopeap/mop0296a.zip
U.S. Environmental Protection Agency. 2002. Managing Highway Deicing to Prevent Contaminationof Drinking Water. Source Water Protection Practices Bulletin. EPA 816-F-02-019. US EPAOffice of Water, Washington, D.C.
U.S. Environmental Protection Agency. 1999. Storm Water Management Fact Sheet – MinimizingEffects from Highway Deicing. EPA 832-F-99-016. US EPA Office of Water, Washington, D.C.http://www.epa.gov/owm/mtb/ice.pdf
University of New Hampshire, 1996. Manual of practice for Anti-icing of Local Roads. TechnologyTransfer Center, University of New Hampshire, Durham NH.
Vasek, R. 2003. Personal communication. October 21, 2003.
Warrington, P. D., 1998. Roadsalt and Winter Maintenance for British Columbia Municipalities.British Columbia Ministry of Water, Land and Air Protection, Water Quality Section, Vancouver,BC. http://wlapwww.gov.bc.ca/wat/wq/bmps/roadsalt.html#table%202
Watson, L. 2003. Street management literature review, analysis and BMP recommendations report.Ramsey-Washington Metro Watershed District Report for the Development of a District-wideStreet Management for Water Quality Program Plan.
Weber, A. 2003. Personal communication. October 2003.