“detached” deep earthquakes: are they really?
TRANSCRIPT
Physics of the Earth and Planetary Interiors 127 (2001) 109–143
“Detached” deep earthquakes: are they really?
Emile A. OkalDepartment of Geological Sciences, Northwestern University, Evanston, IL 60208, USA
Received 28 March 2000; accepted 27 July 2000
Abstract
We use primarily the generation of acousticT waves into the ocean by deep seismic sources to investigate the propagationof high-frequency seismic energy from the bottom of subduction zones to the shoreline at the earth’s surface. Conversionfrom shear waves to oceanic acoustic waves can be used as a proxy for the existence of a continuous slab featuring lowanelastic attenuation. With the help of other techniques, such as the estimation ofQ from S-to-P spectral amplitude ratios,we examine systematically a number of regions where earthquakes have been described as “detached”. We establish themechanical continuity of the slab to the hypocenters of the 1990 Sakhalin and 1982 Bonin events, which occurred severalhundred kilometers in front of the mainstream seismic zone. The study of the 1989 Paraguay shock is inconclusive, probablydue to its much smaller size. The vertical continuity of the South American slab through its aseismic depth range is verified,and a similar situation probably exists in Java. Attenuation data suggests that the deep Spanish earthquakes occur within avertically large segment of colder material, and a similar situation may exist in Colombia. The only clearly detached deepevents with no mechanical connection to the surface make up the Vityaz cluster, under the North Fiji Basin. Based on a varietyof geophysical evidence, the small deep earthquakes under New Zealand are likely to take place in a detached blob at least350 km below the termination of mainstream seismicity. These results support a model integrating buoyancy forces over along continuous slab as the source of the down-dip compressional stresses observed in large earthquakes at the bottom of thetransition zone. © 2001 Elsevier Science B.V. All rights reserved.
Keywords: Detached; Deep earthquakes; High-frequency seismic energy
1. Introduction and background
This paper studies a number of selected deep earth-quakes, often described as “detached” because of thediscontinuous character of seismicity at the bottom ofthe relevant subduction zones. Our principal tool ofinvestigation are theT phases received at teleseismicdistances across the ocean following these events; weare motivated by the fact thatT waves can be chan-neled by the SOFAR low-velocity waveguide (Ewinget al., 1946) only at frequenciesf > 2.5 Hz, andthat their excitation, thus, expresses the ability for the
E-mail address: [email protected] (E.A. Okal).
earthquake to efficiently send high-frequency seismicenergy, convertible intoT waves, to the coastal area.We conclude that several such earthquakes can be bet-ter described as occurring in warped but continuoussections of the Wadati–Benioff zone (WBZ). We alsoshow on several examples thatT waves are indeedroutinely recorded from large deep earthquakes at thebottom of subduction zones.
In a previous study concerned with the 1994 Bo-livian earthquake (Okal and Talandier, 1997, 1998)(hereafter Paper I), we showed that theT phases itgenerated had to be converted from high-frequencyS waves, which in turn required a path with lowshear attenuation from the hypocenter to the water
0031-9201/01/$ – see front matter © 2001 Elsevier Science B.V. All rights reserved.PII: S0031-9201(01)00224-2
110 E.A. Okal / Physics of the Earth and Planetary Interiors 127 (2001) 109–143
column, which could be explained only if a thermallyand hence mechanically continuous slab extends up-wards from the 1994 hypocenter. This observationwas of particular interest since the Bolivian earth-quake occurred in a region with no previous record ofseismicity deeper than 280 km, between the Peruvianand south Bolivian–Argentinian deep clusters (Kirbyet al., 1995). The combination of the 1994 seismic-ity (including aftershocks of the 9 June event), ofseveral recent earthquakes, and of the efficient prop-agation of high-frequency regionalS waves (withQµ estimated as at least 800 in Paper I), indicatesthat rather than being torn, the slab is merely warpedalong a jog linking the Peruvian and Argentiniansegments, and remains continuous both laterally andvertically.
A conclusion of Paper I, substantiated by the ex-amination of spectra of regionalS waves, was thatthe existence of anS → T conversion from a deepearthquake at the bottom of a subduction zone canbe viewed as a proxy for a mechanically continu-ous slab, an especially valuable result in the presenceof a gap of activity in the WBZ. Similarly, a recentstudy by Mele (1998) in the Calabrian arc, has esti-matedQµ ≈ 1000 and calculated that a 25-km gapin the continuity of the slab would suffice to eradi-cate high-frequency (6 Hz)S waves, such resolutionbeing of course much finer than that of even the besttomographic models. Armed with this technique, wefocus in this paper on a number of regions where sev-eral earthquakes have been previously described as“detached” in the literature. Their geographical lay-out can take several forms which we now examine indetail.
1.1. Wadati–Benioff zones with depth gaps
Ever since the pioneering work of Benioff (1949),it was noticed that seismicity in several slabs is notdownward continuous, prompting early authors topropose that the slab may be mechanically “broken”,with earthquakes taking place in individual blobs ofsinking lithosphere, (e.g., Isacks and Molnar, 1971;Wortel, 1984). The primary example of such a ge-ometry is South America, where seismicity gapsexist between depths of 337 and 502 km in north-ern Argentina, and between 211 and 506 km inPeru–Brazil (Engdahl et al., 1998), while farther
North, activity below 292 km is documented only inthe form of three very large, very deep events in 1921,1922 and 1970 (Okal and Bina, 1994), and of threesimilarly very deep but very small 1997 shocks scat-tered between the 1921–1922 hypocentral area andthe northern end of the Peru–Brazil deep cluster (Okaland Bina, 2001). The occurrence of the great 1994Bolivian earthquake, its aftershocks, and several re-cent earthquakes (14 March 1995; 28 November1997) indicated that while the slab itself must becontinuous horizontally between the foci of abundantdeep seismicity in Peru–Bolivia and Argentina, itdoes feature a vertical gap in seismicity in central Bo-livia from 280 to 566 km depth. Another example ofa gap in seismicity with depth is the Java WBZ, Westof 115◦E, where no earthquakes are known between338 and 470 km, (e.g., Kirby et al., 1996).
1.2. Outboard earthquakes
Lundgren and Giardini (1994) have reviewed anumber of cases of earthquakes occurring severalhundred km in front of the general trend of the WBZin the relevant subduction zone. The most promi-nent examples are the 1990 Sakhalin, 1982 BoninIslands and 1989 Paraguay events. Under the SouthFiji Basin, West of Tonga, a number of narrow fingersof seismicity extending as much as 700 km in frontof the WBZ have also been documented (Okal andKirby, 1998; Brudzinski and Chen, 1998).
1.3. The Vityaz deep cluster
Under the North Fiji Basin, Okal and Kirby (1998)have analyzed in detail a large cluster of frequent,relatively small earthquakes at depths of 570–660 km.They concluded that these events take place in a pieceof slab severed from a deactivated subduction systemand lying recumbent on the bottom of the transitionzone.
1.4. The small deep earthquakes under New Zealand
The bottom limit of the WBZ rises regularlyfrom 650 km under the Kermadec Islands at 30◦S to260 km under Cook Strait at 41◦S. It is probable thatthis process is controlled by the reduction in ther-mal parameterΦ (Kostoglodov, 1989; Kirby et al.,

E.A. Okal / Physics of the Earth and Planetary Interiors 127 (2001) 109–143 111
1991) resulting from a slower convergence rate asone moves southwards closer to the pole of rotationof the Pacific–Australian plate system (DeMets et al.,1990). However, a few earthquakes have been doc-umented at depths of 570–622 km under the NorthIsland of New Zealand at 39◦S (Adams, 1963; Adamsand Ferris, 1976), where mainstream seismic activ-ity stops at 250 km. Additional events in 1991–1998confirm the existence of this intriguing seismic clus-ter. Incidentally, it should be emphasized that thissituation is not unique among subduction zones, andthat individual events are occasionally reported atdepths greater than that of cessation of abundantseismicity at the tip of WBZs. A striking exampleis the South Sandwich system, where seismicity isconfined to the upper 200 km of slab, but whererare events can occur down to∼300 km (the latestone on 5 October 1997;h = 273 km; mb = 6.3).However, we do not address such cases of detachedearthquakes at intermediate depths in the presentpaper.
1.5. The deep Spanish earthquakes
The origin of the large 1954 shock at 627 km,studied in detail by Chung and Kanamori (1976),remains to this day a largely unresolved puzzle; onlythree events are known in its vicinity, in 1973, 1990,and 1993. Intermediate seismicity is known to theSSW, down to∼135 km depth (Mezcua and Rueda,1997).
In all above geometries, the question arises whetherthe deep seismicity occurs in blobs of sinking litho-sphere actually detached from the main slab, or ratheris merely a result of a change in geometrical or ther-momechanical properties controlling the existence orthe release of ambient stresses in an otherwise phys-ically continuous slab. The answer to this question isof course of great importance for our understandingof the dynamics of the subduction process.
2. Previous approaches
Three main lines of evidence have previously beenused to explore the nature of gaps in deep seismic-ity: first, experiments in seismic tomography havebeen used to infer thermal continuity for the South
American slab (Engdahl et al., 1995), to suggest atleast partial deflection of the latter’s southern seg-ment, as well as of the Izu–Bonin slab (van der Hilstet al., 1993), and to image a flat lying extension of theTonga slab under the South Fiji Basin (van der Hilst,1995), where it hosts the seismic fingers describedby Okal and Kirby (1998). Also, in the case of the1982 “detached” event in the Bonin Islands, Okinoet al. (1989) used travel-time residuals at Japanesestations to argue for the presence of fast material inthe event’s immediate vicinity.
Second, Isacks and Molnar (1971) and Huang et al.(1998) (among others) have noted the coherence of fo-cal geometries of events below the depth gap in SouthAmerica, notably in Argentina, where the mechanismsexpress down-dip compression, arguing for the me-chanical continuity of the slab through its aseismicsegment. The latter was explained by Engebretson andKirby (1992) as involving an age discontinuity in thedowngoing lithosphere. Conversely, Okal and Kirby(1998), noting the wide variety of focal mechanismsin the Vityaz deep cluster, have argued for its beingmechanically unrelated to any shallower structures.Lundgren and Giardini (1994) also presented evidencethat outboard events have mechanisms differing fromthose of neighboring events in the mainstream WBZ.
Finally, a number of regional studies have identifiedhigh-frequencyS waves in various subduction zones,some of them with seismicity gaps. In particular, inSouth America, Sacks (1969), and later Isacks andBarazangi (1973), Snoke et al. (1974a) and James andSnoke (1990) used this technique to propose the me-chanical continuity of the slab through the aseismicdepth gap, although Snoke et al. (1974b) also proposedan underside reflection on the subducting slab as an al-ternate explanation for the late phases. Mooney (1970)in New Zealand, Barazangi et al. (1972) in Tonga, andMele (1998) in the Calabrian arc, also used similartechniques. van der Hilst and Snieder (1996) modeledthe propagation of high-frequencyP waves through athree-dimensional model of lateral heterogeneity un-der New Zealand and concluded that their observationalmost certainly requires the continuity of the slab. Ourapproach will be conceptually similar, building on thesame principle, i.e. that high-frequencyS waves needa cold, continuous medium to propagate from the bot-tom of the WBZ, but will use a different observationalstrategy, and be global in scope.
112 E.A. Okal / Physics of the Earth and Planetary Interiors 127 (2001) 109–143
3. Dataset and methodology
In this general framework, we investigate in thepresent study the propagation of high-frequencyS
waves up slab from a number of deep earthquakeslocated in targeted subduction zones. We focus onthe process of generation ofT waves in the oceaniccolumn, complemented occasionally by the directspectral analysis of regionalS waves. We refer toPaper I for a description of the general techniquesused.
3.1. Dataset
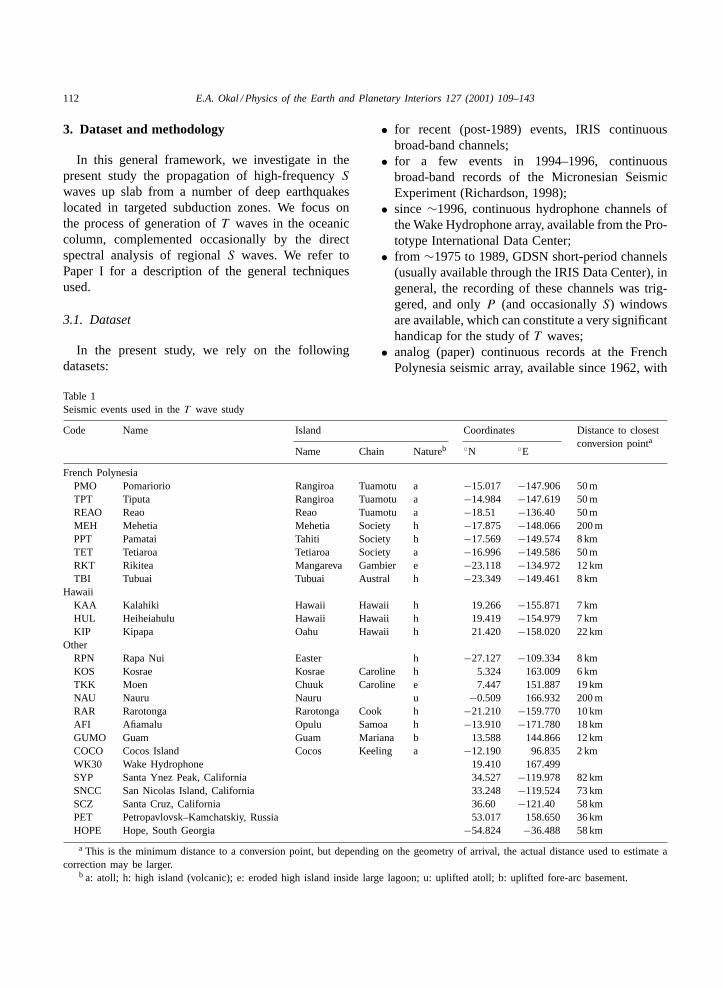
In the present study, we rely on the followingdatasets:
Table 1Seismic events used in theT wave study
Code Name Island Coordinates Distance to closestconversion pointa
Name Chain Natureb ◦N ◦E
French PolynesiaPMO Pomariorio Rangiroa Tuamotu a −15.017 −147.906 50 mTPT Tiputa Rangiroa Tuamotu a −14.984 −147.619 50 mREAO Reao Reao Tuamotu a −18.51 −136.40 50 mMEH Mehetia Mehetia Society h −17.875 −148.066 200 mPPT Pamatai Tahiti Society h −17.569 −149.574 8 kmTET Tetiaroa Tetiaroa Society a −16.996 −149.586 50 mRKT Rikitea Mangareva Gambier e −23.118 −134.972 12 kmTBI Tubuai Tubuai Austral h −23.349 −149.461 8 km
HawaiiKAA Kalahiki Hawaii Hawaii h 19.266 −155.871 7 kmHUL Heiheiahulu Hawaii Hawaii h 19.419 −154.979 7 kmKIP Kipapa Oahu Hawaii h 21.420 −158.020 22 km
OtherRPN Rapa Nui Easter h −27.127 −109.334 8 kmKOS Kosrae Kosrae Caroline h 5.324 163.009 6 kmTKK Moen Chuuk Caroline e 7.447 151.887 19 kmNAU Nauru Nauru u −0.509 166.932 200 mRAR Rarotonga Rarotonga Cook h −21.210 −159.770 10 kmAFI Afiamalu Opulu Samoa h −13.910 −171.780 18 kmGUMO Guam Guam Mariana b 13.588 144.866 12 kmCOCO Cocos Island Cocos Keeling a −12.190 96.835 2 kmWK30 Wake Hydrophone 19.410 167.499SYP Santa Ynez Peak, California 34.527−119.978 82 kmSNCC San Nicolas Island, California 33.248−119.524 73 kmSCZ Santa Cruz, California 36.60 −121.40 58 kmPET Petropavlovsk–Kamchatskiy, Russia 53.017 158.650 36 kmHOPE Hope, South Georgia −54.824 −36.488 58 km
a This is the minimum distance to a conversion point, but depending on the geometry of arrival, the actual distance used to estimate acorrection may be larger.
b a: atoll; h: high island (volcanic); e: eroded high island inside large lagoon; u: uplifted atoll; b: uplifted fore-arc basement.
• for recent (post-1989) events, IRIS continuousbroad-band channels;
• for a few events in 1994–1996, continuousbroad-band records of the Micronesian SeismicExperiment (Richardson, 1998);
• since∼1996, continuous hydrophone channels ofthe Wake Hydrophone array, available from the Pro-totype International Data Center;
• from ∼1975 to 1989, GDSN short-period channels(usually available through the IRIS Data Center), ingeneral, the recording of these channels was trig-gered, and onlyP (and occasionallyS) windowsare available, which can constitute a very significanthandicap for the study ofT waves;
• analog (paper) continuous records at the FrenchPolynesia seismic array, available since 1962, with

E.A. Okal / Physics of the Earth and Planetary Interiors 127 (2001) 109–143 113
high-frequency (T wave) channels (Talandier andKuster, 1976) available since the mid-1970s;
• analog (paper and develocorder film) continuousrecords of the Hawaii Volcano Observatory (HVO)short-period array;
• analog (paper) continuous records of the Caltechshort-period network in southern California;
• analog (micro-film) continuous short-period recordsof the WWSSN, they suffer from the often mediocregains used at ocean island stations.
It should be emphasized that signal processingmethods, such as high-pass filtering and spectro-gram analysis can be applied routinely only to digitaldatasets. In the case of analog records, we were occa-sionally able to hand-digitize time series for furtherprocessing, after enlarging the record several timesusing a magnifying photocopier. The quality of theresulting time series remains low, and they can beused only at the lower end of the frequency windowof interest here (f ≤ 3 Hz).
Whenever possible, we use in this studyT wavereceiving stations located on atolls characterized bysteep reefs optimizing the acoustic-to-seismic conver-sion on the receiver side (Talandier and Okal, 1996).Table 1 lists parameters for stations used in the presentwork, and Table 2 lists events studied with theT wavetechnique.
3.2. Station corrections
As detailed in Paper I, and based upon the workof Talandier and Okal (1998), we introduce sta-tion corrections to compensate for the faster prop-agation inside the insular or continental structureafter conversion back into seismic energy on thereceiver side. These corrections are unnecessary inthe case of atoll sites such as the Rangiroa sta-tions in French Polynesia, or for very small highislands whose dimensions can be neglected (Mehetia,Pitcairn).
3.3. Example and methodology
As intriguing as this situation may be, giventhat their sources are de facto removed from theoceanic water mass, the excitation ofT phases bydeep earthquakes is the rule rather than the excep-tion. Fig. 1 shows a typical example ofT wave
recorded at station RPN, (Easter Island) followingthe earthquake of 21 July 1994 under the Primoryeprovince of eastern Russia. This event is discussed inmore detail in Appendix A, but we use this recordhere to describe the methodology of the presentstudy.
The two T wave arrivals are easily extracted byfiltering in Fig. 1b, and further resolved by the spec-trogram in frame (c). TheT phase is clearly com-posed of two arrivals, with maxima separated by90 s, at 21:09:14 and 21:10:44 GMT, respectively. Weuse a station correction of 4 s to account for 11 kmof on-land propagation at Easter Island followingacoustic-to-seismic conversion (Talandier and Okal,1998) for final times of 21:09:18 and 21:10:48, witha precision estimated at±5 s. In Fig. 2, which isconceptually similar to Figs. 3–5 of Paper I,1 westudy the residual (defined as the difference betweenthe observed arrival time of theT phase and the ar-rival time computed from a modeled conversion), asa function of the latitude of the point of conversionalong the Japan–Kuril shoreline. The fundamentalresult from Fig. 2 is that noP → T conversionanywhere along the shore can explain the second ar-rival, which remains always more than 1 min late. Onthe other hand, it is easily explained by anS → T
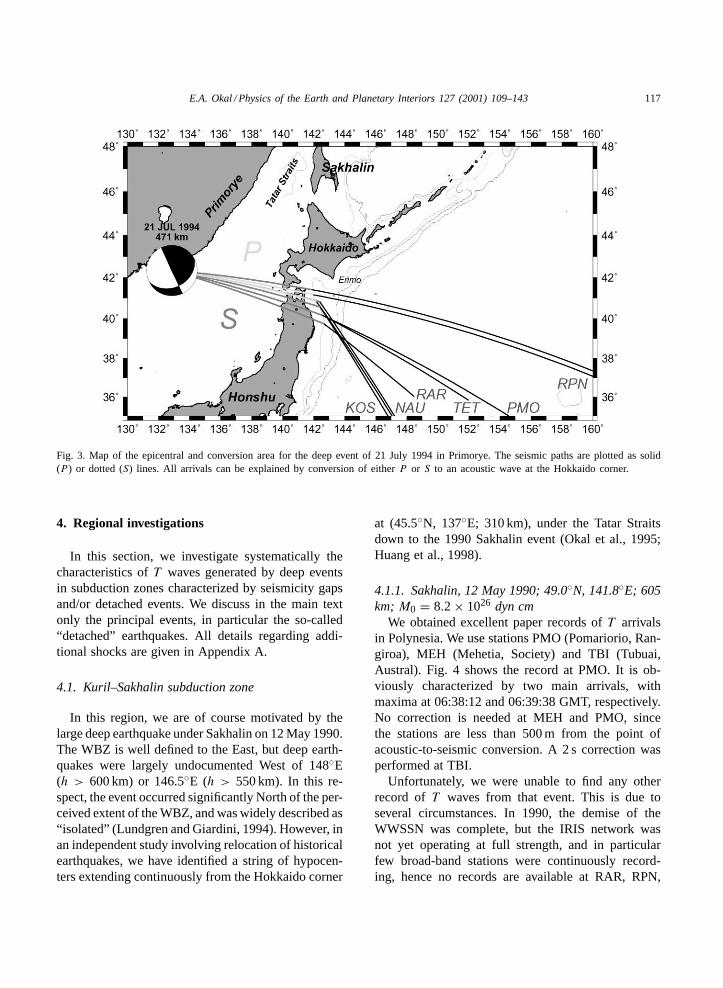
conversion taking place at 41.5◦N, 141.9◦E, whichcorresponds to a concave bight in the 1200 m isobathat the Hokkaido corner (Fig. 3). Note that the firstarrival can be explained by aP → T conversion atessentially the same location (it could also, conceiv-ably, be explained by anS → T conversion off CapeErimo). We conclude that the two pulses in theT
phase correspond toP → T andS → T conversions,respectively, generated by a scatterer at the Hokkaidocorner.
The S → T conversion is observed in Fig. 1 tobe of larger amplitude than theP → T one; this isfound to be a common occurrence, which can be jus-tified along the following arguments: first, as is wellknown from elementary seismic theory, (e.g., Okal,1992), the generation ofS waves by a double-coupleis (α/β)3 times more efficient (5.2 times in a Poissonsolid) than that ofP waves. This results in teleseis-
1 Due to a production error, Figs. 3 and 4 were permuted in(Okal and Talandier, 1997). The figures were reprinted correctlyin (Okal and Talandier, 1998).

114 E.A. Okal / Physics of the Earth and Planetary Interiors 127 (2001) 109–143
Table 2Seismic events used in theT wave study
Date (D M (J) Y) Origin time (GMT) Hypocenter Published CMT solution
Latitude (◦N) Longitude (◦E) Depth (km) M0 (1027 dyn cm) φ, δ, λ (◦)
Okhotsk–Sakhalin–Primorye30 AUG (242) 1970 17:46:09.0 52.38 151.60 645 1.1 229, 78, 2845 SEP (248) 1970 07:52:27.9 52.10 150.99 561 0.07 4, 79, 28129 JAN (029) 1971 21:58:05.4 51.73 150.95 524 0.25 31, 73, 25510 JUL (192) 1976 11:37:12.8 47.36 145.72 421 0.02 64, 81, 26321 DEC (355) 1975 10:54:17.7 51.84 151.75 545 0.21 44, 77, 26521 JUN (172) 1978 11:10:38.2 47.98 149.01 403 0.07 185, 85, 1161 FEB (032) 1984 07:28:27.8 49.10 146.31 581 0.04 231, 85, 8318 MAY (138) 1987 03:07:34.7 49.12 147.39 552 0.17 50, 83, 27012 MAY (132) 1990a 04:50:08.7 49.04 141.85 605 0.82 172, 29, 21021 JUL (202) 1994 18:36:31.7 42.34 132.87 471 1.1 64, 34, 178
Izu–Bonin–Marianas31 JAN (031) 1973 20:55:53.1 28.18 138.86 506 0.25 327, 79, 30813 MAY (133) 1977 11:13:31.2 28.12 139.73 440 0.06 342, 72, 28618 MAY (138) 1979 20:18:01.1 23.94 142.66 581 0.06 57, 47, 2674 JAN (004) 1982 06:05:01.3 17.92 145.46 595 0.07 167, 58, 2714 JUL (185) 1982a 01:20:07.6 27.92 136.48 552 0.12 80, 80, 2486 MAR (066) 1984 02:17:21.1 29.60 139.110 446 1.4 332, 88, 2905 AUG (217) 1990 01:34:57.5 29.48 137.500 520 0.06 296, 87, 32223 AUG (235) 1995 07:06:02.6 18.88 145.30 599 0.46 136, 42, 24216 MAR (076) 1996 22:04:06.2 28.98 138.94 477 0.11 68, 23, 197
Argentina–Paraguay21 DEC (355) 1983 12:05:06.3 −28.19 −63.17 602 0.27 202, 14, 11528 FEB (059) 1989a 13:01;57.6 −23.11 −61.47 569 0.07 194, 24, 29023 JUN (174) 1991 21:22:28.9 −26.80 −63.35 558 0.86 162, 68, 25629 APR (119) 1994 07:11:30.3 −28.51 −63.22 566 0.25 169, 71, 26010 MAY (130) 1994 06:36:28.4 −28.50 −63.10 600 0.28 256, 10, 18319 AUG (231) 1994 10:02:51.8 −26.72 −63.42 563 0.06 159, 73, 253
Bolivia9 JUN (160) 1994 00:33:16.2 −13.841 −67.553 631 26 302, 10, 300
Colombia31 JUL (212) 1970 17:08:05.2 −1.46 −72.56 651 21 148, 58, 261
Vityaz13 APR (103) 1995 02:34:38.0 −13.45 170.43 637 0.021 312, 45, 287
New Zealand14 SEP (257) 1991 14:14:42.0 −39.180 174.434 602
a The three outboard events studied by Lundgren and Giardini (1994).
mic S classically having larger amplitudes thanP attypical long periods (10 s and above). At the high fre-quencies used in this study (ω > 20 rad/s), teleseismicS waves are generally eradicated by anelastic attenua-tion, but propagation over a short distance (≈1000 km)up a cold slab with highQµ (≈800) can result inSwaves of greater amplitude thanP at the conversionpoint.
In addition, the radiation pattern ofS waves up theslab can be more favorable that than ofP for theparticular focal mechanism involved. Also, Talandierand Okal (1998) have shown in the idealized case ofa planar shore dipping at a constant angle thatS →T conversions can be favored overP → T for awide range of combinations of shore dips and rayincidences.

E.A. Okal / Physics of the Earth and Planetary Interiors 127 (2001) 109–143 115
Fig. 1. Typical example of a teleseismic record ofT wave from a deep earthquake (Primorye event of 21 July 1994 recorded at EasterIsland (RPN)). The epicentral distance is 127.8◦, and the oceanic path of the acoustic wave 13,450 km. (a) Original broad-band record.(b) High-pass filtered record (f ≥ 1.5 Hz). Note the two strong arrivals interpreted asP → T and S → T conversions at the source. (c)Spectrogram of the record, in the frequency window 1.5–6 Hz.
Finally, the exact location and mechanism of theseismic-to-acoustic conversion has to be controlledby the morphology of the shoreline at the depth ofthe SOFAR channel, on a scale comparable to a fewacoustic wavelengths, typically 1 km. For example,the presence of bays, coves or bights at the SO-
FAR depths will affect strongly and in a differentmanner theP → T and S → T conversions. Inthe absence of its precise knowledge, the combina-tion of all above factors can easily justifyS → T
conversions with stronger amplitudes thanP → T
ones.

116 E.A. Okal / Physics of the Earth and Planetary Interiors 127 (2001) 109–143
Fig. 2. Residual (observed minus computed) travel-times for the first (solid line) and second (dashes) arrivals at RPN, plotted as a functionof the latitude of a hypothetical point of seismic-to-acoustic conversion, on the 1200 m isobath along the Japan–Kuril trench (see Fig. 3).The top frame assumes initial seismic propagation as aP wave, the bottom one as anS wave.
E.A. Okal / Physics of the Earth and Planetary Interiors 127 (2001) 109–143 117
Fig. 3. Map of the epicentral and conversion area for the deep event of 21 July 1994 in Primorye. The seismic paths are plotted as solid(P ) or dotted (S) lines. All arrivals can be explained by conversion of eitherP or S to an acoustic wave at the Hokkaido corner.
4. Regional investigations
In this section, we investigate systematically thecharacteristics ofT waves generated by deep eventsin subduction zones characterized by seismicity gapsand/or detached events. We discuss in the main textonly the principal events, in particular the so-called“detached” earthquakes. All details regarding addi-tional shocks are given in Appendix A.
4.1. Kuril–Sakhalin subduction zone
In this region, we are of course motivated by thelarge deep earthquake under Sakhalin on 12 May 1990.The WBZ is well defined to the East, but deep earth-quakes were largely undocumented West of 148◦E(h > 600 km) or 146.5◦E (h > 550 km). In this re-spect, the event occurred significantly North of the per-ceived extent of the WBZ, and was widely described as“isolated” (Lundgren and Giardini, 1994). However, inan independent study involving relocation of historicalearthquakes, we have identified a string of hypocen-ters extending continuously from the Hokkaido corner
at (45.5◦N, 137◦E; 310 km), under the Tatar Straitsdown to the 1990 Sakhalin event (Okal et al., 1995;Huang et al., 1998).
4.1.1. Sakhalin, 12 May 1990; 49.0◦N, 141.8◦E; 605km; M0 = 8.2 × 1026 dyn cm
We obtained excellent paper records ofT arrivalsin Polynesia. We use stations PMO (Pomariorio, Ran-giroa), MEH (Mehetia, Society) and TBI (Tubuai,Austral). Fig. 4 shows the record at PMO. It is ob-viously characterized by two main arrivals, withmaxima at 06:38:12 and 06:39:38 GMT, respectively.No correction is needed at MEH and PMO, sincethe stations are less than 500 m from the point ofacoustic-to-seismic conversion. A 2 s correction wasperformed at TBI.
Unfortunately, we were unable to find any otherrecord of T waves from that event. This is due toseveral circumstances. In 1990, the demise of theWWSSN was complete, but the IRIS network wasnot yet operating at full strength, and in particularfew broad-band stations were continuously record-ing, hence no records are available at RAR, RPN,

118 E.A. Okal / Physics of the Earth and Planetary Interiors 127 (2001) 109–143
Fig. 4. T waves recorded in Polynesia from the isolated deep earthquake of 12 May 1990. Top: original paper record at PMO. Note thetwo puffs of high-frequency activity, separated by∼90 s, which compose theT phase. Bottom: map of the Primorye–Sakhalin–Okhotskarea showing the mechanism of conversion at Cape Erimo, Hokkaido. The stars are other deep events generatingT phases into the PacificOcean, including the large 1970 Okhotsk Sea earthquake. The event at extreme left is the Primorye earthquake described in Figs. 1–3.The triangle is a small 1997 event at 416 km, confirming the warped geometry of the slab.
AFI. While the broad-band channel at KIP (Kipapa,Hawaii) is continuously available, the station ismasked by Kauai, and noT wave arrival could beidentified; similarly, a systematic search of the HVOrecords failed to turn up aT phase. Finally, propaga-tion to California coastal stations is blocked by theAleutian arc.
Fig. 5 shows that whereas the first arrivals (solidlines) at stations PMO, MEH, and TBI are readily in-
terpreted by aP → T conversion, the second maximain the T waves (dotted lines) occur too late to corre-spond to conversion from aP wave anywhere alongthe coastline, from 37 to 50◦N (conversion at 42◦N;142◦E is not acceptable, because at this location, theoffshore direction faces the source rather than the re-ceiver). On the other hand, these arrivals, as well asthe maximum inT at TET, are readily explained byS → T conversion at the southern tip of Hokkaido,

E.A. Okal / Physics of the Earth and Planetary Interiors 127 (2001) 109–143 119
Fig. 5. Same as Fig. 2 for the 1990 Sakhalin event.
in the vicinity of Cape Erimo, at 41.5◦N and 143.5◦E,essentially the same location as for theP → T con-version.
Even though the unavailability of digital data pre-vents formal spectrogram analysis, the mere propa-gation of theT wave in the Pacific SOFAR channelrequires frequencies of at least 3 Hz, and, thus, ourobservations indicate the possibility of propagating
high-frequencyS waves from the Sakhalin deep focusto the Hokkaido corner. We interpret this as evidencefor mechanical continuity of the slab in this area.
T waves from additional large deep shocks in theSea of Okhotsk were studied systematically; all de-tails are given in Appendix A. The emerging patternis that of the routine generation ofT waves from bothP and S body waves at the Kuril trench for eastern

120 E.A. Okal / Physics of the Earth and Planetary Interiors 127 (2001) 109–143
Sea of Okhotsk events, and on the southern shores ofHokkaido for the western ones. We note that this con-version is efficient — events as small as 1025 dyn cmroutinely generateT waves detectable in Polynesia.
In this respect, the 1990 Sakhalin earthquake doesnot exhibit any singularity in its generation ofT waves,as compared with events both in the Sea of Okhotskto the East (Fig. 1) and in the Sea of Japan to the West(Fig. 3). The slab is vertically mechanically continuouswith the lithosphere subducted at the Hokkaido corner,as also documented by the seismic “finger” reachingthe 1990 hypocenter (Huang et al., 1998) (we failed tofind any new events (1994–1998) which would haveupdated the seismicity along the finger).
Rather, the northerly position of the 1990 Sakhalindeep shock indicates that the slab is warped, with thesubducting angle significantly shallower in the westernpart of the Sea of Okhotsk than in its eastern part, aninterpretation in line with the model of Glennon andChen (1993), and with the tomographic results of vander Hilst et al. (1991). Finally, it is also borne outby the occurrence of a moderately deep shock underPrimorye on 1 October 1997 (h = 416 km;mb = 5.2;triangle in Fig. 4), which constrains the WBZ to anortherly location. FaintT waves were recorded fromthis event at the Wake hydrophones, but were of anamplitude too small for a meaningful study.
4.2. Bonin–Marianas arc
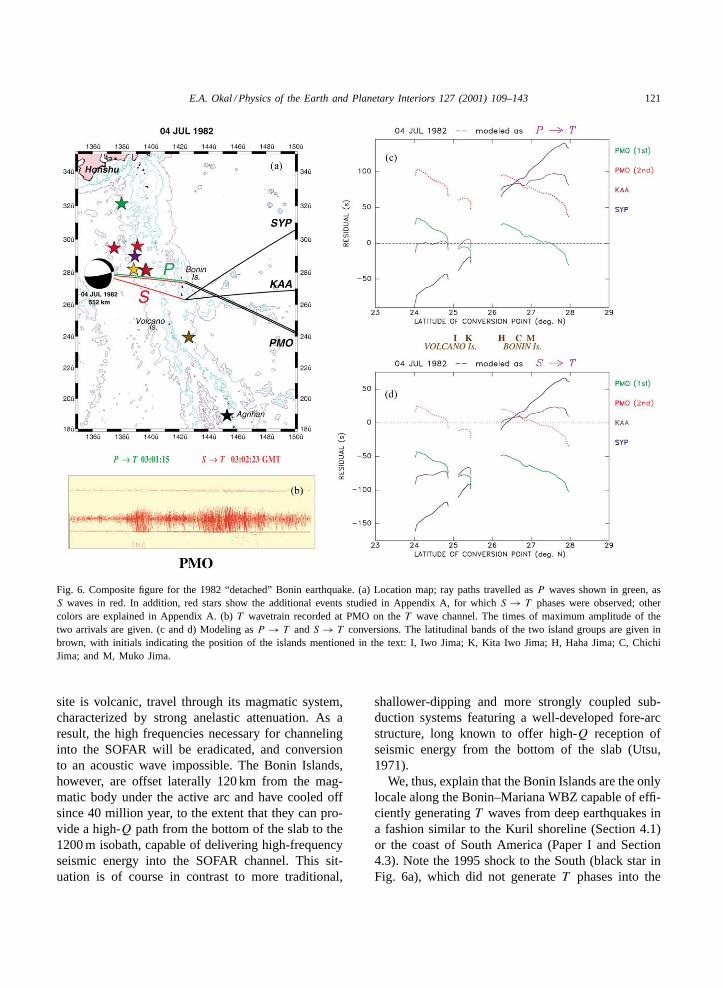
4.2.1. 4 July 1982; 27.9◦N, 136.5◦E; 552 km;M0 = 1.2 × 1026 dyn cm
This “isolated” event, mentioned by Okino et al.(1989), was discussed in detail by Lundgren and Gia-rdini (1994). StrongT waves were detected at PMO,where two arrivals are separated by 68 s. No WWSSNor GDSN records could be found for the expected timewindows ofT waves, but a strongT phase with max-imum at 02:34:05 was found at KAA, on the westerncoast of the Big Island of Hawaii, and a weak but un-deniable record is also present at SYP at the westernend of the southern California network.
Because the Izu–Mariana arc is composed of dis-crete island and seamount structures, few of whichpenetrate the SOFAR channel, the latitude samplingin Fig. 6(c and d) is discontinuous. Even so, the inter-pretation of the records is somewhat ambiguous. Mostarrivals can be interpreted as conversions either at the
northern end of the Volcano Islands (Kita Iwo Jima)or at a site on the Bonin Island group. The exceptionis the SYP record, which can only be interpreted asanS → T conversion on Haha Jima, on the southerntip of the Bonin group. Note, however, that the path toSYP involves a 32 s receiver side correction (account-ing for 86 km of travel in continental structure), whichis bound to be imprecise, given the complex geometryof the shoreline.
The most important observation from Fig. 6(c andd) is that it is impossible to account for the second,stronger arrival at PMO (dotted line in Fig. 6c) by in-voking a P → T conversion at any of the shallowstructures available along the arc. Rather, it is readilyinterpreted as anS → T conversion. Here again, thisrequires the propagation of strongS waves at frequen-cies greater than 3 Hz, proving that the slab must bemechanically continuous from the hypocenter to theocean. The 1982 earthquake cannot have occurred ina detached blob of subducted lithosphere; this resultalso upholds van der Hilst et al.s’ (1991) tomographicsection, in which the Bonin slab sags westward abovethe 670 km discontinuity.
4.2.2. T waves from other eventsOther deep events in the Bonin–Mariana WBZ were
studied systematically, with full details reported in Ap-pendix A. A remarkable result of this study is thatwhile some travel times can be explained by conver-sion on the Volcano Islands, none require it; on theother hand, the Wake hydrophone signals (and the pos-sible arrival at SCZ) from the 1996 event (purple starin Fig. 6a) can be explained only by conversion in theBonin group. In this framework, the latter becomesthe only proven scatterer ofP andS energy into theSOFAR channel.
This can be understood by noting that unlike thepresently active Volcano Islands, the Bonin groupis an uplifted fragment of fore-arc basement whosevolcanics are at least 40-million year-old, (e.g.,Umino, 1985; Taylor et al., 1994). In the fully de-coupled Bonin–Mariana subduction zone (Uyedaand Kanamori, 1979), there are few shallow slopespermitting conversion of seismic energy into the SO-FAR channel, and in practice, only islands or largeseamounts are adequate structures. However, in thegeometry of that steeply dipping slab, the seismicrays will arrive vertically to the island and, thus, if the
E.A. Okal / Physics of the Earth and Planetary Interiors 127 (2001) 109–143 121
Fig. 6. Composite figure for the 1982 “detached” Bonin earthquake. (a) Location map; ray paths travelled asP waves shown in green, asS waves in red. In addition, red stars show the additional events studied in Appendix A, for whichS → T phases were observed; othercolors are explained in Appendix A. (b)T wavetrain recorded at PMO on theT wave channel. The times of maximum amplitude of thetwo arrivals are given. (c and d) Modeling asP → T andS → T conversions. The latitudinal bands of the two island groups are given inbrown, with initials indicating the position of the islands mentioned in the text: I, Iwo Jima; K, Kita Iwo Jima; H, Haha Jima; C, ChichiJima; and M, Muko Jima.
site is volcanic, travel through its magmatic system,characterized by strong anelastic attenuation. As aresult, the high frequencies necessary for channelinginto the SOFAR will be eradicated, and conversionto an acoustic wave impossible. The Bonin Islands,however, are offset laterally 120 km from the mag-matic body under the active arc and have cooled offsince 40 million year, to the extent that they can pro-vide a high-Q path from the bottom of the slab to the1200 m isobath, capable of delivering high-frequencyseismic energy into the SOFAR channel. This sit-uation is of course in contrast to more traditional,
shallower-dipping and more strongly coupled sub-duction systems featuring a well-developed fore-arcstructure, long known to offer high-Q reception ofseismic energy from the bottom of the slab (Utsu,1971).
We, thus, explain that the Bonin Islands are the onlylocale along the Bonin–Mariana WBZ capable of effi-ciently generatingT waves from deep earthquakes ina fashion similar to the Kuril shoreline (Section 4.1)or the coast of South America (Paper I and Section4.3). Note the 1995 shock to the South (black star inFig. 6a), which did not generateT phases into the

122 E.A. Okal / Physics of the Earth and Planetary Interiors 127 (2001) 109–143
Pacific Basin, despite having the largest seismic mo-ment of the regional group studied, and being in theimmediate vicinity of an island (the volcanically ac-tive Agrihan). On the contrary, the last event studied,event farther South, did generate aT wave, throughconversion on Guam, which is not an active memberof a volcanic arc, but rather a limestone-capped up-lifted segment of fore-arc basement, estimated to beat least Early Miocene in age (Tracey et al., 1964).Finally, this pattern is also upheld in the Izu regionto the North, as documented by the 1993 earthquake,for which conversions are not observed at the nearbyvolcanic islands and seamounts (e.g. Hachichojima),but rather off the continental structure of southeasternHonshu (see Appendix A).
4.2.3. Other detached eventsIn the general vicinity of the 1982 shock, we were
able to identify two outlying earthquakes, on 23 June1988 (mb = 4.5) and 12 September 1997 (mb = 4.1),which qualify as “detached” in the sense that theyare clearly located in front of the mainstream WBZ(Fig. 7). We relocated these events using the formalismof Wysession et al. (1991). In particular, we attemptedunsuccessfully to force the events into the WBZ, byarbitrarily deleting stations. In addition, we performedMonte Carlo relocations after injecting random noiseinto the dataset, usingσG = 1.5 s as the standard de-viation of the Gaussian noise, a generous value forsuch modern events. As shown in Fig. 7b, the result-ing error ellipses do not reach the WBZ, and we mustconclude that the events are indeed located outside themain body of WBZ.
Another potential candidate, on 9 October 1963,was relocated with its Monte Carlo ellipse reaching theWBZ, and a historical shock on 20 April 1933, listedby the ISS at 20.5◦N, 140◦E (477 km), is probablyan intermediate depth earthquake under the Sea ofOkhotsk.
4.2.4. DiscussionWe regard the identification of the 1988 and 1997
outliers as a very important result, in that it establishesthe continuity of seismogenic material from the WBZto the 1982 hypocenter. Together with the detectionof the S → T conversion from the latter, this estab-lishes the mechanical continuity of a segment of slab
extending to the location of the 1982 shock. This is ingeneral agreement with regional tomographic modelssuch as Van der Hilst et al.s’ (1991) and Fukao et al.(1992), which show a zone of fastP wave velocitiesextending West of the Bonin arc at the relevant depth(550 km), thus suggesting that the slab sags and stag-nates above the lower mantle. This feature is, how-ever, absent from their models for the southern part ofthe Philippine Basin, West of the Mariana arc. Morerecently, and based on a comparison between tomo-graphic inversions ofP - andS-travel-times, Widiyan-toro et al. (1999) have suggested that the stagnatingand subducting portions of the Izu–Bonin slab mayhave different signatures, the latter being unseen in theS tomography. A model compatible with the high-Q
path required by our documentedS → T conversionswould have to involve a change of mineralogy increas-ing the Poisson ratio of the stagnant material, while atthe same time keeping a low attenuation.
There is no clear explanation as to why outboardseismicity takes place in front of the WBZ only at thelatitude of the 1982 shock and of its two small outly-ing companions. Of course, the latter observation maybe an artifact of a short time sampling of seismolog-ical observations. We note the intriguing coincidenceof this feature with the presence of the Bonin Islandsgroup to the East, which constitute the only emergeduplifted fore-arc along the whole Izu–Bonin subduc-tion system. One can only speculate that there mayexist a common geodynamic agent explaining the ap-parent upwards deflection of both systems, with obvi-ously very different vertical scales.
4.3. South America
We are motivated in this region by the 1989 earth-quake in Paraguay, the third of the main “detached”events reported in the literature (Lundgren and Giar-dini, 1994).
4.3.1. Paraguay, 28 Feb 1989; 23.11◦S, 61.47◦W;569 km; M0 = 7.2 × 1025 dyn cm
Unfortunately, we were unable to document a con-sistent set ofT waves at Pacific stations which couldbe associated with this event. There are twoT wavesignals in Polynesia: a very weak one, legible only onthe T wave channel, at RKT (Gambier) at 14:24:47GMT, the other one at TPT, detectable on the regular

E.A. Okal / Physics of the Earth and Planetary Interiors 127 (2001) 109–143 123
Fig. 7. (a) Deep seismicity of the Izu–Bonin WBZ, showing the three outlying events (1982, 1988 and 1997) as large dots. The ‘+’ signsare unrelocated NEIC earthquakes (h = 400 km) for the period 1964–1998. (b) Relocation of the outlying events. The triangles show theoriginal NEIC locations of the 1988 and 1997 events; the dots are our relocations, with associated error ellipses (σG = 1.5 s). Also shownin gray is the 1963 earthquake, listed as outlying in the NEIC catalogue, but relocating to the mainstream WBZ. The ISC estimates of theuncertainty on the 1982 epicenter are≤1.5 km, less than the size of the symbol. (c) Cross-section of the dataset in panel (a) along theazimuth 63◦, perpendicular to the strike of the WBZ; only events North of 25◦N are included; we verified that the two deepest events,shown as open circles, are poorly located shocks which are not genuine outliers. (d) Cross-section along azimuth 153◦, parallel to thestrike of the WBZ.

124 E.A. Okal / Physics of the Earth and Planetary Interiors 127 (2001) 109–143
short-period channel at 14:29:19 GMT. These timesindicate that the two signals cannot share a commonsource on the coast of South America. Indeed, theycan be reconciled with a small earthquake at 13:19:36GMT, off the coast of Guerrero, Mexico, a region forwhich station TPT is particularly sensitive toT waves.A systematic examination of both paper and develo-corder archives at HVO failed to turn up a legibleT
phase at the coastal station HUL. No IRIS/GDSN dig-ital data are available at appropriate combinations oftime windows and sampling rates; similarly we could
Fig. 8. Comparison ofT waves received at station HUL from deep events in northern Argentina. This figure illustrates a threshold of∼1026 dyn cm for their detection.
not find digitalS wave records at coastal South Amer-ican stations to investigate the possible presence ofhigh-frequencyS waves, using the spectral ratio tech-niques of Paper I.
We conclude that noT waves from the 1989Paraguay earthquake were recorded in the PacificBasin. Given the adequate performance of the Poly-nesian stations, and despite the absence of continuousbroad-band digital records at that date, we believethat the event did not send measurableT phasesinto the ocean. Noting that its moment is smaller
E.A. Okal / Physics of the Earth and Planetary Interiors 127 (2001) 109–143 125
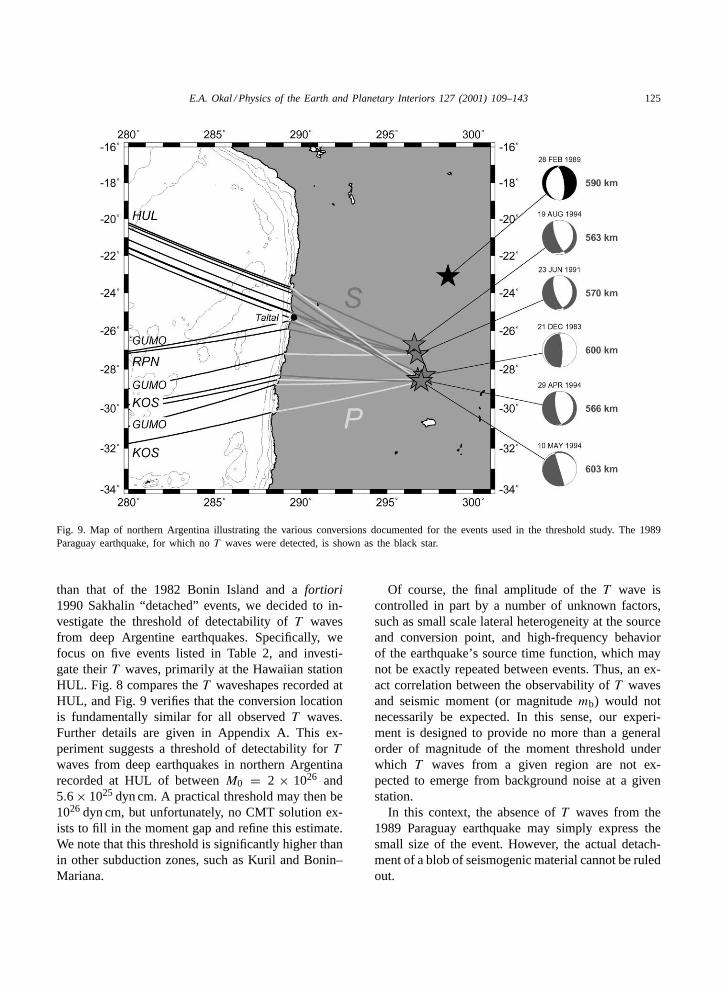
Fig. 9. Map of northern Argentina illustrating the various conversions documented for the events used in the threshold study. The 1989Paraguay earthquake, for which noT waves were detected, is shown as the black star.
than that of the 1982 Bonin Island and afortiori1990 Sakhalin “detached” events, we decided to in-vestigate the threshold of detectability ofT wavesfrom deep Argentine earthquakes. Specifically, wefocus on five events listed in Table 2, and investi-gate theirT waves, primarily at the Hawaiian stationHUL. Fig. 8 compares theT waveshapes recorded atHUL, and Fig. 9 verifies that the conversion locationis fundamentally similar for all observedT waves.Further details are given in Appendix A. This ex-periment suggests a threshold of detectability forT
waves from deep earthquakes in northern Argentinarecorded at HUL of betweenM0 = 2 × 1026 and5.6× 1025 dyn cm. A practical threshold may then be1026 dyn cm, but unfortunately, no CMT solution ex-ists to fill in the moment gap and refine this estimate.We note that this threshold is significantly higher thanin other subduction zones, such as Kuril and Bonin–Mariana.
Of course, the final amplitude of theT wave iscontrolled in part by a number of unknown factors,such as small scale lateral heterogeneity at the sourceand conversion point, and high-frequency behaviorof the earthquake’s source time function, which maynot be exactly repeated between events. Thus, an ex-act correlation between the observability ofT wavesand seismic moment (or magnitudemb) would notnecessarily be expected. In this sense, our experi-ment is designed to provide no more than a generalorder of magnitude of the moment threshold underwhich T waves from a given region are not ex-pected to emerge from background noise at a givenstation.
In this context, the absence ofT waves from the1989 Paraguay earthquake may simply express thesmall size of the event. However, the actual detach-ment of a blob of seismogenic material cannot be ruledout.
126 E.A. Okal / Physics of the Earth and Planetary Interiors 127 (2001) 109–143
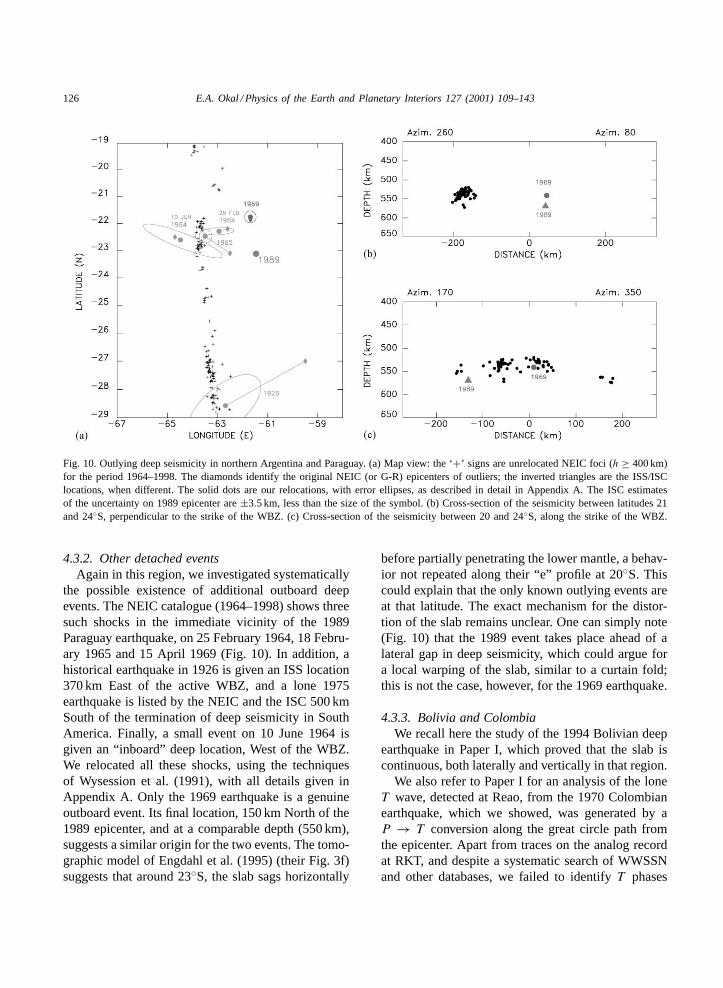
Fig. 10. Outlying deep seismicity in northern Argentina and Paraguay. (a) Map view: the ‘+’ signs are unrelocated NEIC foci (h ≥ 400 km)for the period 1964–1998. The diamonds identify the original NEIC (or G-R) epicenters of outliers; the inverted triangles are the ISS/ISClocations, when different. The solid dots are our relocations, with error ellipses, as described in detail in Appendix A. The ISC estimatesof the uncertainty on 1989 epicenter are±3.5 km, less than the size of the symbol. (b) Cross-section of the seismicity between latitudes 21and 24◦S, perpendicular to the strike of the WBZ. (c) Cross-section of the seismicity between 20 and 24◦S, along the strike of the WBZ.
4.3.2. Other detached eventsAgain in this region, we investigated systematically
the possible existence of additional outboard deepevents. The NEIC catalogue (1964–1998) shows threesuch shocks in the immediate vicinity of the 1989Paraguay earthquake, on 25 February 1964, 18 Febru-ary 1965 and 15 April 1969 (Fig. 10). In addition, ahistorical earthquake in 1926 is given an ISS location370 km East of the active WBZ, and a lone 1975earthquake is listed by the NEIC and the ISC 500 kmSouth of the termination of deep seismicity in SouthAmerica. Finally, a small event on 10 June 1964 isgiven an “inboard” deep location, West of the WBZ.We relocated all these shocks, using the techniquesof Wysession et al. (1991), with all details given inAppendix A. Only the 1969 earthquake is a genuineoutboard event. Its final location, 150 km North of the1989 epicenter, and at a comparable depth (550 km),suggests a similar origin for the two events. The tomo-graphic model of Engdahl et al. (1995) (their Fig. 3f)suggests that around 23◦S, the slab sags horizontally
before partially penetrating the lower mantle, a behav-ior not repeated along their “e” profile at 20◦S. Thiscould explain that the only known outlying events areat that latitude. The exact mechanism for the distor-tion of the slab remains unclear. One can simply note(Fig. 10) that the 1989 event takes place ahead of alateral gap in deep seismicity, which could argue fora local warping of the slab, similar to a curtain fold;this is not the case, however, for the 1969 earthquake.
4.3.3. Bolivia and ColombiaWe recall here the study of the 1994 Bolivian deep
earthquake in Paper I, which proved that the slab iscontinuous, both laterally and vertically in that region.
We also refer to Paper I for an analysis of the loneT wave, detected at Reao, from the 1970 Colombianearthquake, which we showed, was generated by aP → T conversion along the great circle path fromthe epicenter. Apart from traces on the analog recordat RKT, and despite a systematic search of WWSSNand other databases, we failed to identifyT phases
E.A. Okal / Physics of the Earth and Planetary Interiors 127 (2001) 109–143 127
from that event at any other Pacific receiver location.A search forT waves from the small 1997 earthquakeswas similarly unsuccessful, so that no definite conclu-sion can be reached as to the nature of the materialseparating the three deep hypocenters (1921, 1922,1970) from the intermediate depth WBZ.
The best argument for mechanical continuity wouldbe the continuous subduction of the Farallon, laterNazca, plate for the past 50 million years; the absenceof an S → T conversion from the 1970 earthquakecan be ascribed to an unfavorable radiation coefficientat the source (RSV = 0.07); note also that thePaxes for the two historical events are only 16 and 26◦away from the one in 1970, and that this common di-rection would correspond to down-dip compressionalstress release in the model of a continuous slab. As forthe 1997 earthquakes, they may be simply too small(mb ≤ 4.8) to excite detectableT phases. On the otherhand, the tomographic results of Engdahl et al. (1995)fail to image the slab through the transition zone, andGrand’s (1994) tomographic model is inconclusive.
4.4. Java
The deep seismicity under the Sunda arc has beendescribed in detail by Kirby et al. (1996). Deep earth-quakes, absent from Sumatra, are present East of theSunda Straits at 107◦E, but a gap in seismicity ex-ists West of 115◦E, between 338 and 470 km. Thisgap ends significantly shallower than in Argentina.We have verified through relocation (Wysession et al.,1991) the depth of the limiting event (1 June 1997,h = 470 ± 17 km). Based on tomographic studies,Widiyantoro et al. (1997) have proposed necking ofthe slab under western Java, in a region which wouldgrossly coincide with the seismicity gap. We soughtto analyzeT waves from deep shocks from this zone;unfortunately, the eastern part of the gap is maskedfrom many sites by Western Australia; in addition, theinstrumentation of the Indian Ocean is only very re-cent, so that we could study only one event, on 19January 1997.
4.4.1. Java, 19 January 1997; 5.03◦S, 108.40◦E;651 km; M0 = 1.7 × 1024 dyn cm
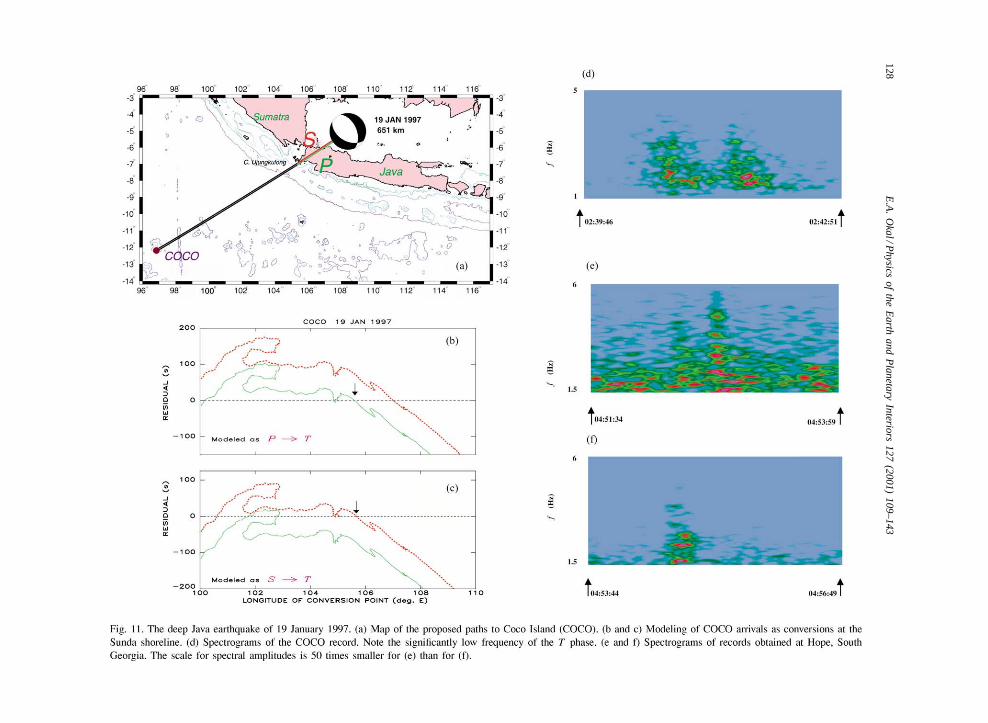
T wave arrivals could be identified at two stations:Cocos Island and Hope (South Georgia). The recordsat COCO are characterized by two strong arrivals,
which can be interpreted asP → T and S → T
conversions, from a scatterer south of Cape Ujungku-long, at 7.1◦S; 105.6◦E. This interpretation is, how-ever, non-unique since other points along the coast ofJava would also be adequate converters, without theneed to invokeS → T conversions (Fig. 11). Further-more, theT waves recorded at COCO are character-ized by very low frequencies (down to 1.7 Hz), whichshould not propagate in a standard Pacific SOFARchannel, but may be explained if the channel is lesswell defined, i.e. extends over a greater depth rangeand features faster axial velocities, estimated locally at1489 m/s (Levitus et al., 1994). Such low frequenciesthen significantly diminish the power of the methodas a proxy for the continuity of high-Q material alongtheS fragment of the path.
The HOPE record also shows two arrivals, at04:52:48 and 04:54:51 GMT, the second one be-ing much stronger (Fig. 11(e and f)). Unfortunately,travel-time corrections to Hope are practically impos-sible to assess given that the 12,700 km great-circlepath grazes the Kerguelen Plateau and Antarctica,and samples extreme southern latitudes where themorphology of the SOFAR channel is expected tobe strongly altered, with minimum velocities beingprobably lower but largely uncharted (Levitus et al.,1994). This in turn would suggest off great-circlepropagation and quite possibly reflections.
As for the use of spectral properties ofS waves,we could not find digital stations in Java sufficientlyremoved from active volcanic structures to compute ameaningful estimate ofQµ.
In order to obtain some quantitative assessment ofthe slab’s continuity, we investigated the distributionof deep focal mechanisms both in the zone featuringthe seismic gap (West of 115◦E) and in the portionwith continuous seismicity with depth, defined hereas between 115 and 121◦E (we do not include mech-anisms farther East into the Banda Sea, where theregime of subduction is significantly different). Weconsider all 47 published CMT solutions deeper than500 km, including those for 1957–1976 inverted byHuang et al. (1997, 1998), 15 of which belong to theEastern group, and 32 to the Western one. For eachgroup, we calculate a composite focal mechanism,by summing the moment tensors and solving for thebest-fitting double-couple (without weighting the so-lutions according to moment, which in essence would
128E
.A.
Okal/P
hysicsof
theE
arthand
Planetary
Interiors127
(2001)109–143

E.A. Okal / Physics of the Earth and Planetary Interiors 127 (2001) 109–143 129
keep only the contribution of the largest earthquake inthe dataset). The results show that the stress release inthe Western group remains coherent, and essentiallyexpresses the release of quasi-vertical compressionalstress, as it does in the Eastern group. The averageP
axes East and West of the divide dip 85◦ at azimuthN189◦E, and 77◦ at azimuth N273◦E, respectively.These two directions are separated in space by only13◦. Furthermore, the average best double-couples areseparated by a rotation of 28◦ about a steeply (67◦)dipping axis, in the formalism of Kagan (1991). Thisindicates that the predominant down-dip compres-sional stress believed to control the strain release ofthe deepest earthquakes is transmitted in a coherentfashion through the seismic gap.
4.5. New Zealand
We investigate here the cluster of deep New Zealandearthquakes, originally discovered by Adams (1963).Table 3 is a list of apparently detached events, up-dated to June 1999, on the basis of the latest availablecatalogues. Since the 1998 event has not yet been pro-cessed by the ISC, we relocated it based on the datasetavailable from the EDR files. The essential point isthat the depth of the event is perfectly controlled byregional stations, at a value of 600± 10 km. Thus, atotal of 10 deep New Zealand earthquakes are nowconfirmed from teleseismic records. None of the sixrecent shocks were large enough to be processed by theHarvard CMT project, and so, no modern focal mech-anism is available. Adams (1963) proposed a thrustmechanism for the 1960 event, based on world-wide
Table 3Deep earthquakes under New Zealand
Date (D M (J) Y) Origin time (GMT) Epicenter Depth (km) Magnitude Reference
◦N ◦E
24 MAR (083) 1953 03:37:13.0 −38.9 174.5 570 5ML Adams (1963)23 MAR (083) 1960 01:32:18.0 −39.05 174.87 607 6.25ML Adams (1963)23 MAR (083) 1960 01:36:35.7 −39.10 175.07 612 6.2ML Adams (1963)7 FEB (038) 1975 15:19:43.0 −39.27 174.26 582 4.9ML Adams and Ferris (1976)14 SEP (257) 1991 14:14:42.0 −39.180 174.434 602 5.0mb ISC on line Bulletin26 FEB (057) 1992 00:05:33.7 −38.896 174.693 602 4.0mb ISC on line Bulletin8 JUL (190) 1992 12:25:25.0 −39.116 174.362 622 4.9ML ISC on line Bulletin5 MAY (125) 1993 03:51:19.2 −38.903 174.440 577 4.6ML ISC on line Bulletin8 APR (098) 1994 04:06:54.8 −39.194 174.455 602 3.8mb ISC on line Bulletin4 JUL (185) 1998 07:47:47.5 −39.16 174.510 600 4.3mb This study
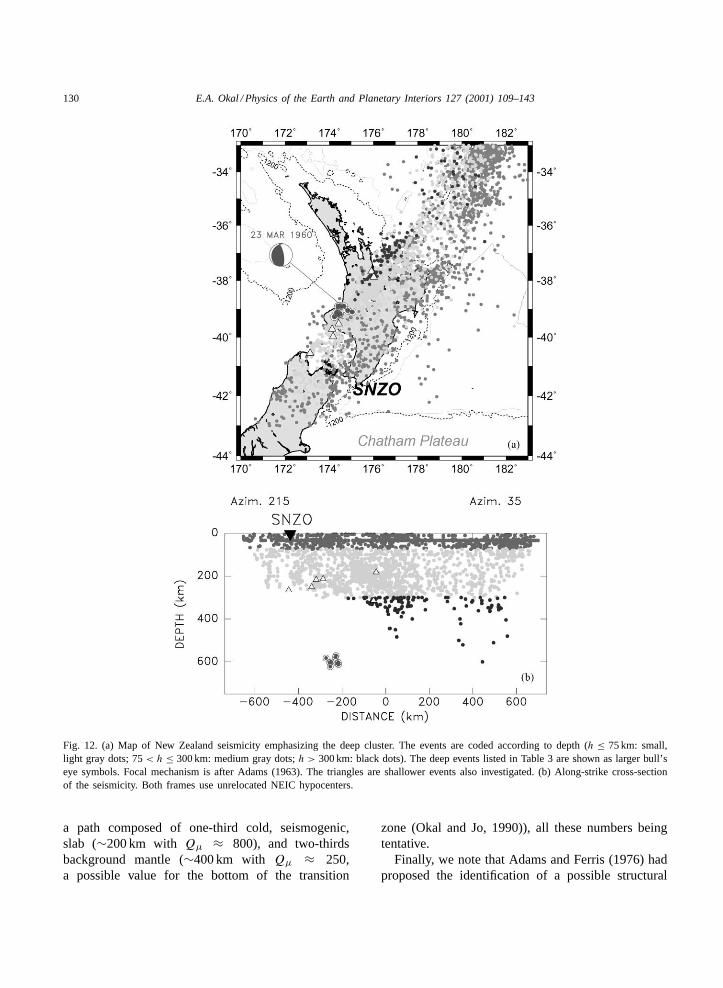
first motion readings. Fig. 12 shows a map view anda cross-section along strike of the relevant seismicity.
T waves are routinely recorded from those andother deep Kermadec events at Pacific stations, such asTBI, PPT, RPN, and even KIP, often showing complexwavetrains, suggesting multipathing. However, the in-terpretation of their arrival times is made difficult, ifnot outright impossible, by the presence of numer-ous shallow structures, including the Chatham Rise,which provide a large selection of potential converters.Consequently, the identification of possibleS → T
converted phases at distant receivers is not a realisticmeans of investigating the structure of the slab.
Rather, we use here the spectral ratio techniquedescribed in Paper I, based on three-componentbroad-band data at station South Kariro (SNZO). IRISrecords are only available for the three events of 8July 1992, 8 April 1994 and 4 July 1998. The recordsof the small event of 1992 have poor signal-to-noiseratios, and only the other two events could be studied(Figs. 13 and 14). Over the exact same frequencyrange (1–3 Hz), we obtain an average estimate ofQµ = 300, which is very significantly lower thanfound in Paper I for Bolivia–northern Chile, wherea continuous path had been documented byS → T
conversions. By contrast with this situation, we sur-mise that the path from the deep seismic cluster toSNZO is not made of continuous cold-slab material.This value ofQµ is only an estimate, but we notethat the results for the two events are surprisinglyconsistent, despite different waveshapes, suggestiveof different focal geometries. We propose that thisvalue represents a weighted average ofQ−1
µ along
130 E.A. Okal / Physics of the Earth and Planetary Interiors 127 (2001) 109–143
Fig. 12. (a) Map of New Zealand seismicity emphasizing the deep cluster. The events are coded according to depth (h ≤ 75 km: small,light gray dots; 75< h ≤ 300 km: medium gray dots;h > 300 km: black dots). The deep events listed in Table 3 are shown as larger bull’seye symbols. Focal mechanism is after Adams (1963). The triangles are shallower events also investigated. (b) Along-strike cross-sectionof the seismicity. Both frames use unrelocated NEIC hypocenters.
a path composed of one-third cold, seismogenic,slab (∼200 km with Qµ ≈ 800), and two-thirdsbackground mantle (∼400 km with Qµ ≈ 250,a possible value for the bottom of the transition
zone (Okal and Jo, 1990)), all these numbers beingtentative.
Finally, we note that Adams and Ferris (1976) hadproposed the identification of a possible structural
E.A. Okal / Physics of the Earth and Planetary Interiors 127 (2001) 109–143 131
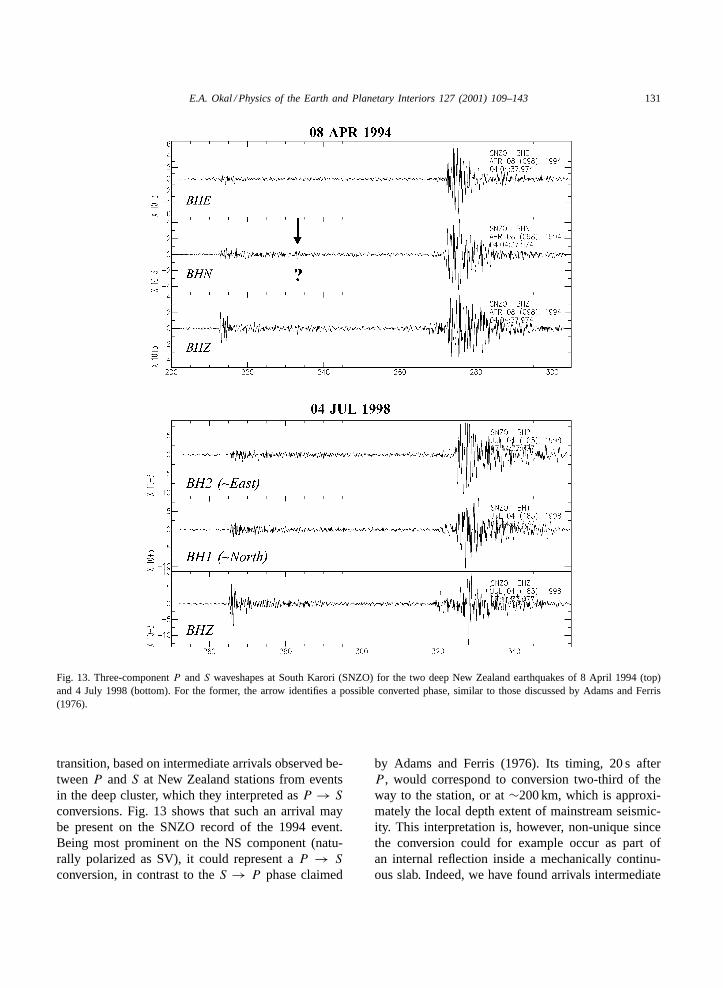
Fig. 13. Three-componentP andS waveshapes at South Karori (SNZO) for the two deep New Zealand earthquakes of 8 April 1994 (top)and 4 July 1998 (bottom). For the former, the arrow identifies a possible converted phase, similar to those discussed by Adams and Ferris(1976).
transition, based on intermediate arrivals observed be-tweenP andS at New Zealand stations from eventsin the deep cluster, which they interpreted asP → S
conversions. Fig. 13 shows that such an arrival maybe present on the SNZO record of the 1994 event.Being most prominent on the NS component (natu-rally polarized as SV), it could represent aP → S
conversion, in contrast to theS → P phase claimed
by Adams and Ferris (1976). Its timing, 20 s afterP , would correspond to conversion two-third of theway to the station, or at∼200 km, which is approxi-mately the local depth extent of mainstream seismic-ity. This interpretation is, however, non-unique sincethe conversion could for example occur as part ofan internal reflection inside a mechanically continu-ous slab. Indeed, we have found arrivals intermediate

132 E.A. Okal / Physics of the Earth and Planetary Interiors 127 (2001) 109–143
Fig. 14. Estimation ofQµ on the quasi-vertical path from the New Zealand deep shocks to station SNZO. Each figure shows the variationof the spectral ratioXS(ω)/XP(ω), for two events and two sets of components: at left North–South (essentially SV); at right East–West(SH). The straight segments provide the regressed best linear fit to the logarithmic decay of the ratio with frequency between 1 and 3 Hz.
betweenP and S on vertical records at SNZO ofshallower, mainstream events (shown as triangles inFig. 12). Such phases would more precisely matchthe description given in Adams and Ferris (1976),but would violate their model because of the conti-nuity of the slab to those shallow sources. Finally,theP → S conversion reported here is absent for the1998 event, but this could be due to a different focalmechanism.
To a large extent, the body of data available fromthe few and small deep New Zealand earthquakes isstill inconclusive. However, the following argumentswould favor a mechanical separation between the deep
cluster and the mainstream WBZ: the relatively lowvalue ofQ on the near-vertical path to SNZO, the ten-tativeP → S converted phase on the 1994 record, andthe down-dip tensional character of the mechanism(φ = 350◦; δ = 71◦; λ = 79◦) determined by Adams(1963) for the 1960 earthquake. In particular, the firsttwo observations are generally consistent with the me-chanical termination of the slab at the depth of ces-sation of mainstream seismicity. Finally, we note thatthe tomographic results of van der Hilst and Snieder(1996) would suggest the existence of a body of slowwavespeed between depths of 250 and 500 km at 40◦S(their Fig. 12e).
E.A. Okal / Physics of the Earth and Planetary Interiors 127 (2001) 109–143 133
4.6. Vityaz
The Vityaz deep cluster, under the North Fiji Basin,was studied in detail by Okal and Kirby (1998). Sincethis study was completed, 34 more deep earthquakes(spanning July 1996–June 1999) have been given pre-liminary locations in the cluster. While the precisedepths of these events have not been determined, theirepicenters generally fit the several groups identifiedby Okal and Kirby (1998); the two available newCMT solutions are of small moment (1× 1024 and2 × 1024 dyn cm); one mechanism is normal faulting,the other strike-slip. Finally, an intermediate shockgiven at 200 km under the North Fiji Basin, on 14November 1997, is most probably a shallow crustalearthquake in the North Fiji Basin: the dataset of 10stations is found to have no depth resolution.
Despite the availability of good records at KIP, PET,GUMO, SNCC and TKK, we failed to identifyTphases from the largest recent deep Vityaz event, on 13April 1995. This suggests that high-frequency energyis not transmitted to the earth’s surface North of theVityaz trench, where adequate converters would existin the form of numerous shallow bathymetric struc-tures. This supports Okal and Kirby’s (1998) conclu-sion, namely that the Vityaz seismic cluster resides ina severed piece of lithospheric slab, orphaned fromthe Pacific plate after the reorganization of subductionalong the Tonga and Vanuatu systems, and having lainrecumbent at the bottom of the transition zone eversince.
4.7. Spain
In this relatively complex tectonic province, themain unanswered question remains the origin of thedeep seismicity. Any integrated tectonic model shouldalso explain a growing body of geophysical data atshallower depths, in particular intermediate depth seis-micity.
A large scale tomographic experiment by Blancoand Spakman (1993) has imaged a possibly contin-uous slab, extending in a generally SW–NE direc-tion, between depths of 200 and 670 km. Its struc-ture, withP wavespeed anomalies of+1.5%, wouldbe compatible with subduction of oceanic lithosphere,and its size much larger than the 100 km scale, whichGrimison and Chen (1986) argued was the maximum
width of a paleo-ocean separating Europe and Africafrom which to drain such material. Blanco and Spak-man (1993) also note that the mapped anomaly doesnot extend to the surface, and thus speculate that theimaged slab may have been detached, possibly as earlyas the Miocene, whereas Grimison and Chen (1986)suggest sinking over only a few million years.
The focal mechanism of the 1954 earthquake wasworked out by Chung and Kanamori (1976), Udíaset al. (1976) and Buforn et al. (1991). Their solutionsare generally similar, with the azimuth of dip of theP
axis varying from N87◦E to N61◦E, only in fair agree-ment with a down-dip compression in the geometryof Blanco and Spakman (1993), which would requirea more southerly azimuth. The small events of 1973and 1990 were also worked out by Buforn et al. (1991,1997), who found mechanisms close, but not exactlysimilar, to that in 1954.
At shallower depths, we refer to the recent reloca-tions by Seber et al. (1996) and Mezcua and Rueda(1997), who mapped the main body of intermediatedepth seismicity as spanning a 140 km long segmentoriented N10◦E across the Sea of Alborán, from Spainto the northern coast of Morocco. This places its north-ern end 50 km southeast of the epicenters of the deepshocks (Fig. 15a). Seber et al. (1996) also documentstrong seismic attenuation in a lower crust–upper man-tle body extending at depths of 20–60 km under theSea of Alborán, and underlain by a more rigid andseismically active mantle structure which they inter-pret as a fragment of continental (Spanish) lithosphere,delaminated below asthenospheric material under theSea, that they relate to Neogene volcanism in the Seaof Alborán (Bellon, 1981). On the other hand, Loner-gan and White (1997) question the generation of meltin this geometry, and Morales et al. (1999) present amodel supported by localP andS wave nseismic to-mography and gravity data, suggesting active conti-nental subduction under the Sea of Alborán.
In this general framework, the question remains ofthe exact source of seismogenic material for the deepSpanish earthquakes, of its history, and of its relation-ship, if any, to the subducting or delaminating seg-ments carrying the present intermediate seismicity. Itshould be emphasized that the relative geographicaloffset between the intermediate and deep seismicityis not compatible with a single subducting structurealong the geometry outlined by Blanco and Spak-
134 E.A. Okal / Physics of the Earth and Planetary Interiors 127 (2001) 109–143
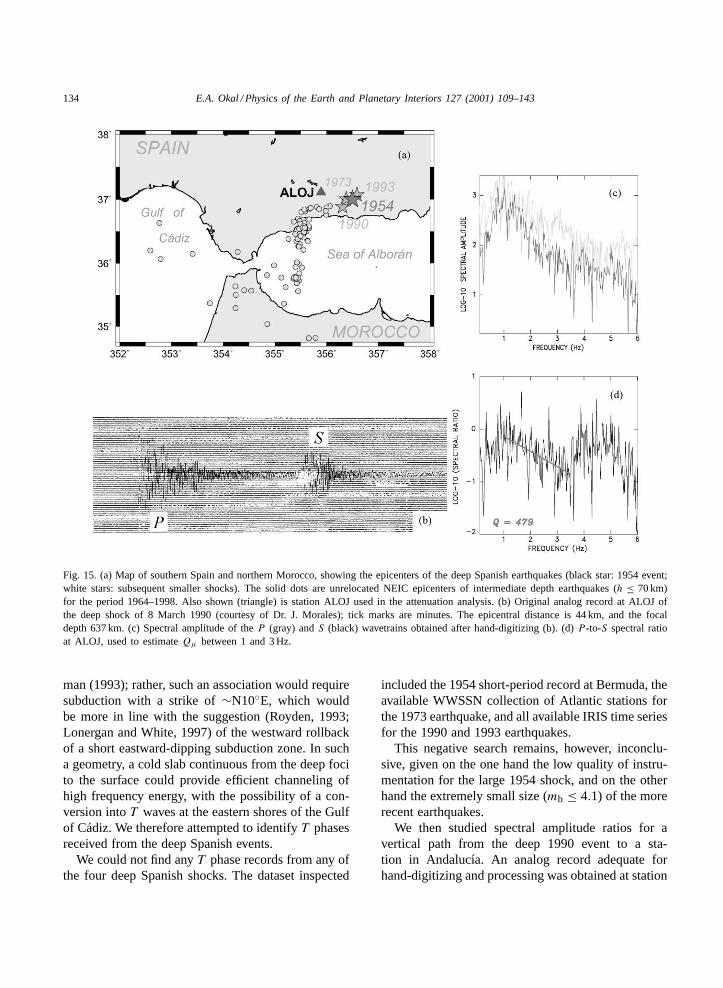
Fig. 15. (a) Map of southern Spain and northern Morocco, showing the epicenters of the deep Spanish earthquakes (black star: 1954 event;white stars: subsequent smaller shocks). The solid dots are unrelocated NEIC epicenters of intermediate depth earthquakes (h ≤ 70 km)for the period 1964–1998. Also shown (triangle) is station ALOJ used in the attenuation analysis. (b) Original analog record at ALOJ ofthe deep shock of 8 March 1990 (courtesy of Dr. J. Morales); tick marks are minutes. The epicentral distance is 44 km, and the focaldepth 637 km. (c) Spectral amplitude of theP (gray) andS (black) wavetrains obtained after hand-digitizing (b). (d)P -to-S spectral ratioat ALOJ, used to estimateQµ between 1 and 3 Hz.
man (1993); rather, such an association would requiresubduction with a strike of∼N10◦E, which wouldbe more in line with the suggestion (Royden, 1993;Lonergan and White, 1997) of the westward rollbackof a short eastward-dipping subduction zone. In sucha geometry, a cold slab continuous from the deep focito the surface could provide efficient channeling ofhigh frequency energy, with the possibility of a con-version intoT waves at the eastern shores of the Gulfof Cádiz. We therefore attempted to identifyT phasesreceived from the deep Spanish events.
We could not find anyT phase records from any ofthe four deep Spanish shocks. The dataset inspected
included the 1954 short-period record at Bermuda, theavailable WWSSN collection of Atlantic stations forthe 1973 earthquake, and all available IRIS time seriesfor the 1990 and 1993 earthquakes.
This negative search remains, however, inconclu-sive, given on the one hand the low quality of instru-mentation for the large 1954 shock, and on the otherhand the extremely small size (mb ≤ 4.1) of the morerecent earthquakes.
We then studied spectral amplitude ratios for avertical path from the deep 1990 event to a sta-tion in Andalucía. An analog record adequate forhand-digitizing and processing was obtained at station

E.A. Okal / Physics of the Earth and Planetary Interiors 127 (2001) 109–143 135
ALOJ, for which the quasi-vertical path would beexpected to sample the structure imaged by Blancoand Spakman (1993). We obtainQµ = 479, a valueintermediate between that of a typical upper mantleaverage (200) and the much higher values (800–1000)characteristic of propagation through actively sub-ducting cold slabs (Paper I; Mele, 1998). Being higherthan the typical mantle average, it requires sustainedpropagation through cold material, and also a pathavoiding the asthenosphere. A tentative model involv-ing a 440 km path in (Blanco and Spakman, 1993)structure, assumed to haveQµ = 700 (this lowervalue reflecting possible reheating after detachment),would requireQµ = 283 for the complementarysegment from 200 km depth to the surface, whichincidentally samples the zone of intermediate depthseismicity, and remains significantly North of the at-tenuating body, as mapped in Fig. 2 of Seber et al.(1996). The estimateQµ = 283 would be in therange of values for continental lithosphere, given inparticular the uncertainty on the thermal structure of asubducted or delaminated fragment (Mitchell, 1995).
It is clear that these results remain very tentative,and that further experimentation, hopefully with dig-ital data acquired during future deep Spanish earth-quakes, is warranted.
5. Conclusion
Having examined in detail “detached” or isolateddeep earthquakes in eight different environments, wecan draw the following conclusions.
1. T phases are routinely generated by the deepestearthquakes, as documented for example in ourstudies of the Sea of Okhotsk, northern Argentinaor the Izu–Bonin systems. The threshold of de-tection at teleseismic distances varies significantlywith the relevant subduction zone; we have foundit to be particularly low in Java and much higher inSouth America. This variation is probably relatedto the morphology of the converting slope for eachsubduction zone.
2. In two cases out of three (Sakhalin and Bonin)of detached earthquakes occurring outboard ofwell-documented WBZs with abundant seismicity,we offer proof of mechanical continuity with the
subducting slab. The evidence includesS → T
conversions, and a string of seismic activity atlower magnitudes. In the third case (Paraguay),we fail to documentT phases, but we take notethat the earthquake falls below the threshold ofdetectability from nearby deep shocks; we docu-ment an even smaller outboard event 145 km tothe North. In general, our results are also compati-ble with tomographic images, and suggest that theslab undergoes warping, resulting in an offset ofthe seismicity, rather than tearing and detachmentof a lump. In Sakhalin, this is probably related tothe cusp in subduction at the Hokkaido corner; inBonin, we can only make the intriguing observa-tion that the fold in the slab seems to correlategeographically with the presence of the upliftedBonin Islands at the same latitude along the sub-duction zone. In Paraguay, we can offer no insightinto the mechanism of warping.
3. In subduction zones where a depth gap in seismic-ity is observed, the presence ofS → T conver-sions proves that the slab is indeed mechanicallycontinuous through the gap, the latter expressingonly a change in the seismogenic character of thematerial, rather than the physical separation of adeep blob. In Argentina and Bolivia, this is upheldby the consistency of focal mechanisms, and bytomographic imaging. The temporary loss of seis-mogenic potential (between 337 and 502 km in Ar-gentina) can be ascribed to an age discontinuity inthe subducting material, in the model of Engebret-son and Kirby (1992). In Java, where tomographysuggests necking of the slab, ourT wave resultssupport a continuous slab, without requiring it, thebest evidence for mechanical continuity being thecoherence of focal mechanisms for the deep eventsbelow the gap.
4. The cases of Colombia and Spain are somewhatcomparable regarding the extreme isolation of theseismicity, mostly expressed by very large shocks,but differ in relation to small events, present inSpain at the same location as the large ones, butapparently offset to the South in Colombia. Also,Colombia is part of a well-documented major sub-ducting system, whereas Spain is not; on the otherhand, a large fast slab is imaged by tomographyunder Spain, but is not detected under Colombia.In both cases, an argument can be made for

136 E.A. Okal / Physics of the Earth and Planetary Interiors 127 (2001) 109–143
mechanical continuity based on the geometry ofstress release: Bina (1997) has modeled downwardcompressional stresses at the bottom of sinkingslabs from the integral of buoyancy forces result-ing from the retardation of phase transformationsin the cold interior of slabs. A continuous slab,extending several hundred kilometers up from theseismic foci, would provide a consistent domainover which these forces can be integrated in acoherent fashion, whereas a small blob extendingonly 100 km or less around the seismogenic zone,would not. Thus, it is probable that both Colombiaand Spain have a mechanically and thermally con-tinuous slab, since they both feature consistentdown-dip compressional stresses. Additional evi-dence supporting this model exists but its natureis different: in Spain, it comes from tomographyand highQ values; in Colombia, mainly from thehistory of subduction of the Pacific lithosphere andfrom the geometry of stress release. Both inter-pretations leave substantial questions unanswered:in Spain, the origin of the material, as discussedby Grimison and Chen (1986), and the orienta-tion of the stress with respect to the slab imagedby tomography; in Colombia, the absence of anydetectable tomographic signal, and of low-levelseismicity around the 1970 focus (Okal and Bina,1994, 2001).
5. On the other hand, the Vityaz cluster, where abun-dant seismicity occurs at relatively low momentlevels, and with incoherent geometries of stress re-lease, is most easily explained as a severed piece oflithosphere lying recumbent on the top of the lowermantle, as proposed by Okal and Kirby (1998).The failure to detect anyT waves from these deepearthquakes would support this model, but a majordifficulty resides in the thermal state of the severedfragment which is expected to be cooling too fastto preserve metastable olivine as a candidate seis-mogenic material (Van Ark et al., 1999).
6. This leaves the case of the deep New Zealand earth-quakes as perhaps the most intriguing and enig-matic detached events. The extreme complexity ofthe local coastlines makes it impossible to interprettheirT waves. A significant body of evidence con-sisting of the lone available focal mechanism, to-mographic results, relatively lowQ values, and thetentative observation of converted phases, would
support the concept of a mechanically detachedlump of seismogenic material, but its origin andpast history remain elusive.
Acknowledgements
Digital data used in the present study were ob-tained from the IRIS, GEOSCOPE and pIDC datacenters. I am grateful to Paul Okubo at HVO andOlivier Hyvernaud at PPT for access to their respec-tive analog archives. Numerous visits to the Caltechand Lamont–Doherty collections are also acknowl-edged. Dr. José Morales kindly provided the Andalu-sian records used in Section 4.7. Discussions withSteve Kirby, Craig Bina and Ray Russo are gratefullyacknowledged. I thank Paul Lundgren and Rob vander Hilst for constructive comments on a previousversion of the paper, and Renata Dmowska for a per-sonalized international library loan. This study wassupported in part by the National Science Founda-tion under grants EAR-93-16396 and EAR-97-06152,and by the Department of Defense, under grantDTRA-01-00-C0065. Many figures were drafted us-ing the GMT software (Wessel and Smith, 1991).
Appendix A
We present here a detailed discussion of variousevents and records used in this study.
A.1. Kuril–Sakhalin subduction zone
A.1.1. Sea of Okhotsk, 30 August 1970; 52.4◦N,151.69◦E; 645 km; M0 = 1.1 × 1027 dyn cm
This deep event, studied by, among others, Strelitz(1980) and Sasatani (1980), and more recently, Huangand Okal (1998), is one of the largest recorded at depthunder the Sea of Okhotsk. We documentT waves atfour short-period stations in the Pacific Basin: KIP,AFI and RAR (WWSSN), and PMO (Rangiroa). Notethat “T wave channels” were not yet operational inPolynesia in 1970. Records at RAR and AFI are ar-guably faint, but their spectral characteristics establishthem beyond any possible doubt as high-frequencywaves without counterparts in the time series for thatday, and thus asT phases. That they are at all legible

E.A. Okal / Physics of the Earth and Planetary Interiors 127 (2001) 109–143 137
Fig. 16. Examples ofT waves recorded on short-period channels of the WWSSN following the large 1970 Sea of Okhotsk deep shock.Top: record at Kipapa, Oahu. The duration of the window is 97 s and the original magnification of the record 12,500. TheT wave isclearly apparent three traces below (i.e. 45 mn after) the prominent body waves. Bottom: record at Rarotonga. The duration is 56 s. Notethe unmistakingly high-frequency character of the arrival, which emerges from the noise level despite a particularly mediocre gain at thatstation (originally 6250 at 1 Hz). The geometry of the conversion is shown on the bottom left map (similar to Fig. 3) and its nature asS → T established in the diagrams at bottom right (similar to Fig. 2).
138 E.A. Okal / Physics of the Earth and Planetary Interiors 127 (2001) 109–143
on WWSSN records written at the mediocre magnifi-cations used (6250 at RAR; Fig. 16) suggests a verystrong acoustic wave. The record at KIP is clearer,with an estimated peak-to-peak amplitude of groundmotion of 7�m, a remarkable figure for a wave havingtravelled at least 40 km inside the structure of Oahubefore reaching the station.
While in principle, it would be possible to interpreteach arrival as resulting from aP → T conversion atan individual point of the Kuril coast (ranging from47◦N for PMO to 52◦N for RAR), it is possible tomodel all four arrivals by diffraction of anS waveincident at 49.5◦N, 156.3◦E, off Paramushir Island(arrow in Fig. 16). This model is supported by avery favorable radiation of SV energy by the sourcetowards the conversion point (RSV = 0.90).
A.1.2. Sea of Okhotsk, 5 September 1970; 52.1◦N,150.99◦E; 561 km; M0 = 6.4 × 1025 dyn cm
For this aftershock of the previous event, we couldfind only oneT phase, at PMO. The arrival time re-quires a much more southerlyS → T conversion,at 46.5◦N, 151.5◦E, off the Bussol’ Straits, which iseasily explained by the difference in focal mechanismbetween the two shocks (Huang et al., 1997).
A.1.3. Sea of Okhotsk, 29 January 1971; 51.73◦N,150.95◦E; 524 km; M0 = 2.5 × 1026 dyn cm
We obtained two clear arrivals at KIP, separated by108 s, and one at RAR. The record at PMO was noisyand could not be used. TheT phase at KIP is inter-preted as converted toPn on the northern coast ofKauai, and corrected for the subsequent 199 km to thestation. The travel-times are consistent with a com-mon S → T scatterer to KIP and RAR at 46.8◦N,152.3◦E, near the Bussol’ Straits, and a conversion far-ther North, off Cruzenstern Straits (48.3◦N, 153.9◦E)for theP → T phase at KIP.
A.1.4. Sea of Okhotsk, 21 December 1975; 51.84◦N,151.75◦E; 545 km; M0 = 2.1 × 1026 dyn cm
We read two arrivals at PMO, and a clear one atKIP. They are interpreted asP → T andS → T con-versions to PMO at Bussol’ Straits (46.6◦N, 151.5◦E).The sameS → T scatterer can be invoked on the pathto KIP if an allowance is made for conversion back toPn on the northern shore of Kauai.
A.1.5. Sea of Okhotsk, 21 June 1978; 47.98◦N,149.01◦E; 402 km; M0 = 6.5 × 1025 dyn cm
We obtainedT phase doublets at both PMO andPPT, separated by 81 and 79 s, respectively. They arereadily interpreted as conversions from aP → T scat-terer at 45◦N, 149.7◦E (off Iturup), and anS → T
one farther South off the Catherine Straits, at 44◦N,148◦E.
A.1.6. Sea of Okhotsk, 10 July 1976; 47.36◦N,145.72◦E; 421 km; M0 = 1.9 × 1025 dyn cm
The record at PMO shows two arrivals of fairquality, which can be interpreted asP → T andS → T conversions, respectively, off Shikotan Island(43.5◦N, 147◦E) and Nemuro Peninsula (42.9◦N;145.7◦E).
A.1.7. Sea of Okhotsk, 1 February 1984; 49.10◦N,146.31◦E; 581 km; M0 = 3.6 × 1025 dyn cm
A double arrival at PMO is readily interpreted asP → T and S → T conversions South of Nemuro(42.6◦N, 145◦E). The record at TBI could not be easilyinterpreted.
A.1.8. Sea of Okhotsk, 18 May 1987; 49.12◦N,147.39◦E; 552 km; M0 = 1.7 × 1026 dyn cm
This earthquake generated exceptionally longT
wavetrains at PMO. The first arrival is readily iden-tified as aP → T conversion at Bussol’ Straits, butthe interpretation of the later arrivals requires mul-tipathing through many conversion points along thesouthern Kuril arc. Because we cannot assertivelydemonstrate the occurrence of anS → T conversion,we show this event as an open star in Fig. 4.
A.1.9. Primorye, 21 July 1994; 42.3◦N, 132.9◦E;471 km; M0 = 1.1 × 1027 dyn cm
Finally, we complete here the investigation of thisstrong event under the Primorye province of easternRussia, whose record at RPN was used in the introduc-tion to illustrate our methodology. Most other stationsin the Pacific Basin recordedT phases. We identi-fied S → T conversions at KOS, NAU, RAR, TET,PMO and RPN, with NAU and RPN showing earlierP → T phases. The conversion points are located ona 150 km stretch of the northernmost shore of Honshu(Fig. 3).

E.A. Okal / Physics of the Earth and Planetary Interiors 127 (2001) 109–143 139
A.2. Bonin–Marianas arc
We start with a discussion of events located at asimilar latitude to the 1982 “detached” earthquake, butin the mainstream WBZ.
A.2.1. Bonin Islands, 3 May 1991; 28.14◦N,139.65◦E; 453 km; M0 = 1.3 × 1026 dyn cm
TheT wave channel at PMO saturated, but the reg-ular seismic channel recorded a superb wavepacket,composed of two arrivals, generally similar to thosefrom the 1982 event shown in Fig. 6. They are eas-ily interpreted asP → T andS → T conversions ateither Iwo Jima or Muka Jima.
Despite significant background noise at Easter Is-land (RPN), spectrogram techniques extract aT arrivalat 04:48:35 GMT, in the 3–4 Hz frequency band. Thissignal is interpreted as anS → T conversion at HahaJima, reflected on the northwestern Hawaiian Islands.The exact location of the reflector cannot be furtherconstrained.
A.2.2. Bonin Islands, 13 May 1977; 28.12◦N,139.73◦E; 440 km; M0 = 6.1 × 1025 dyn cm
Results are similar to those of the previous shock:a double arrival at PMO interpreted asP → T andS → T conversions at either Iwo Jima or Chichi Jima.
A.2.3. Bonin Islands, 31 January 1973; 28.18◦N,138.86◦E; 506 km; M0 = 2.5 × 1026 dyn cm
We could obtain only one record, at PMO, onthe regular seismic channel. A prominent arrival at22:36:45, corresponding toP → T conversion atIwo Jima or Chichi Jima, is followed by sustainedhigh-frequency energy, from which no distinctivesecond arrival can be extracted. This event is shownas a yellow star in Fig. 6.
• To the North of the Bonin Islands, we examine thefollowing events:◦ Izu trench, 6 March 1984; 29.60◦N, 139.11◦E;
446 km; M0 = 1.4 × 1027 dyn cmThis earthquake (the largest deep CMT solu-
tion in the Bonin–Mariana arc) generated spec-tacularT phases in Polynesia, which saturated theT wave channel at PMO for 10 min. The regularchannels allow the identification of the strongestarrival at 03:59:35, with a precursor triggering
saturation of theT wave channel at 03:58:12.These two times are readily interpreted asP →T andS → T paths converted either on the north-ern Bonin or northern Volcano Islands. Similarly,a powerful arrival at RKT is well matched by aP → T conversion at Muko Jima, the northern-most Bonin Island.
A very intenseT phase is present at TBI, eventhough the station is masked by the western Mar-shall Islands. The arrival time of the maximumamplitude, 04:12:35 GMT, could correspond to areflection on Johnston Atoll (16.7◦N; 169.5◦W)for anS → T conversion at Haha Jima.
◦ Bonin Islands, 16 March 1996; 28.98◦N,138.94◦E; 477 km; M0 = 1.1 × 1026 dyn cm
Despite the size of this event, we could notidentify T wave signals above noise level at anyof the following stations: KIP, RAR, SNCC, PPT.A strong signal at SCZ, at 23:44:57, could be in-terpreted as aT wave converted fromS at HahaJima at the southern end of the Bonin Islands(26.3◦N; 142.4◦E). This interpretation remainsspeculative in the absence of corroborative sig-nals in California (e.g. SNCC). We obtained adistinct doublet at WK30, readily interpreted asP → T and S → T converted at Muko Jima;these arrivals cannot be explained by conversionat the Volcano group. This event is shown as thepurple star in Fig. 6.
◦ Bonin Islands, 5 August 1990; 29.48◦N,137.50◦E; 520 km; M0 = 5.7 × 1025 dyn cm
We obtained a small but distinctive doublet ontheT wave channel at PMO, interpreted asP →T andS → T conversions at either Iwo Jima orMuko Jima. No other signal could be convinc-ingly read at other stations. We show this eventas a yellow star in Fig. 6.
◦ Izu Islands, 11 October 1993; 32.12◦N, 138.02◦E;364 km; M0 = 2.5 × 1026 dyn cm
This large event, about half-way between theBonin Islands and Japan, produced a singular pat-tern of T waves. The PMO record in Polyne-sia shows a series of arrivals, the first one beingthe familiar S → T conversion at Haha Jima,but the most intense one, at 17:40:29 GMT, be-ing too late to fit conversion anywhere along theislands or shallow seamounts of the Izu–Boninarc. Rather, it can be successfully modeled by
140 E.A. Okal / Physics of the Earth and Planetary Interiors 127 (2001) 109–143
a P → T conversion off the southeastern ex-tremity of Honshu. Similarly, the main doubletof arrivals at RAR is best explained byP →T conversions on the coasts of Iwase (south-ern Honshu) and farther West off Murotozaki(Shikoku). This event is shown as the green star inFig. 6.
• To the South of the Bonin Islands, we investigatethe following events:◦ Mariana Islands, 18 May 1979; 23.94◦N,
142.66◦E; 581 km; M0 = 5.5 × 1025 dyn cmA very weak T wave is readable on theT
wave channel at PMO, at 21:58:18, and is readilyinterpreted as aP → T conversion, at either IwoJima or Haha Jima. No distinctive second arrivalcan be identified in the subsequent part of therecord. We show this event as a brown star inFig. 6.
◦ Mariana Islands, 23 August 1995; 18.88◦N,145.30◦E; 599 km; M0 = 4.6 × 1026 dyn cm
We could not find any definitiveT wave recordfrom this large deep event, despite examiningdata from TBI, PPT, KIP, RAR. We show thisevent as a black star in Fig. 6.
◦ Mariana Islands, 4 January 1982; 17.92◦N,145.46◦E; 595 km; M0 = 6.7 × 1025 dyn cm
A strong T phase is observed at PMO onthe T wave channel, followed by several subse-quent arrivals. The first signal corresponds to aP → T conversion on the eastern shore of Guam(13.6◦N; 145.1◦E). The latter arrivals could notbe modeled assertively.
A.3. South America
A.3.1. Argentina, 23 June 1991; 26.8◦S, 63.3◦W;558 km; M0 = 8.6 × 1026 dyn cm
This is the largest deep Argentinian event with anavailable CMT solution.T waves were recorded inHawaii (HUL), Easter (RPN), and Guam (GUMO).Significant volcanic activity at the Hollister Ridgeduring the relevant time window (Talandier and Okal,1996) prevents the use of Polynesian stations. TheHUL signal does not lend itself well to a clear sep-aration intoP → T and S → T arrivals (Fig. 8b).Based on comparisons with the other sources in thesame region, we interpret the maximum in ampli-tude as anS → T conversion near Taltal, Chile
(25.0◦S; 70.6◦W). The GUMO arrival is composedof a strong wavepacket lasting approximately 150 s,with maximum amplitude at 00:26:03 GMT on 24June, with a smaller precursor at 00:23:47. We adda 4 s station correction at the receiver. These timesthen fit a P → T conversion at 27.2◦S, 71.0◦W,and anS → T one near Taltal (25.5◦S). Finally, theRPN record shows a somewhat tentative arrival at22:08:29 GMT. After applying a 3 s correction, thistime fits anS → T conversion at 25.9◦S; 70.8◦W.Thus, most of theT phases recorded from thisevent would evolve from scatterers located alongthe bight offshore from Taltal, and activated by theS wave, 191 s after the origin time of the earth-quake.
A.3.2. Argentina, 21 December 1983; 28.2◦S,63.2◦W; 602 km; M0 = 2.7 × 1026 dyn cm
This large event occurred at 12:05:06 GMT andwas followed by an aftershock (no CMT available)at 12:15:07 GMT. Both shocks were well recordedat HUL on the southern shore of the Big Island ofHawaii, despite interference with local seismicity. Ar-rival times for the first event are easily interpretedas P → T and S → T conversions at 25.3 and25.0◦S, respectively. For the aftershock, the arrivalcorresponds to theS → T conversion; the expectedP → T conversion is obscured by a local earthquake(Fig. 8a).
A.3.3. Argentina, 29 April 1994; 28.51◦S, 63.22◦W;566 km; M0 = 2.5 × 1026 dyn cm
The S → T conversion is well recorded atHUL, while the P → T one is much fainter(Fig. 8c). Scatterers are modeled at 23.7◦S (P )and 24.0◦S (S). No definitive T phases from thisevent were identified elsewhere in the PacificBasin.
A.3.4. Argentina, 10 May 1994; 28.50◦S, 63.10◦W;600 km; M0 = 2.8 × 1026 dyn cm
The HUL record, shown in Fig. 8d, shows a faintP → T conversion and a better developedS → T
one. The scatterers are located to the North at 23.7◦S(P ) and 24.6◦S (S). In addition, we obtained a cleardoublet at KOS, with scatterers at 30.2◦S (P ) and28.3◦S (S).

E.A. Okal / Physics of the Earth and Planetary Interiors 127 (2001) 109–143 141
A.3.5. Argentina, 19 August 1994; 26.72◦S,63.42◦W; 563 km; M0 = 5.6 × 1025 dyn cm
With this event, we reach what we regard as the limitof detectability at HUL (Fig. 8e). By analogy withthe previous events, we believe that the faint signalat 12:02:03 GMT corresponds to anS → T conver-sion, which would then involve a scatterer at 23.8◦S,70.6◦W. We could not extract definite signals at otherPacific sites.
A.3.6. Paraguay, 15 April 1969; 21.86◦S, 61.68◦W;541 km; mb = 4.0
We relocated this small earthquake just 10 km tothe North; Monte Carlo relocations with a gener-ous noise (σG = 1.5 s) are not sufficient to bringit into the mainstream WBZ, while keeping itsdepth robust (521–574 km). We conclude that theearthquake is indeed an outboard outlier. It re-mains much too small for a study of any possibleT
waves.
A.3.7. Argentina, 8 February 1965; 23.1◦S, 62.5◦W;468 km; mb = 4.7
The above NEIC location stands out, while the ISClocation is in the mainstream WBZ. We also relo-cate the earthquake in the WBZ, and at a significantlygreater depth (22.47◦S; 63.49◦W; 547 km), a hypocen-ter close but not identical to that of a foreshock 2 minearlier.
A.3.8. Argentina, 25 February 1964; 22.2◦S,62.6◦W; 470 km; mb = 4.1
The NEIC location is outboard, but the datasethas poor longitudinal resolution. The Monte Carloellipse drawn with very little noise (σG = 1 s) inter-sects the mainstream WBZ. Our preferred location(22.29◦S; 62.94◦W) also involves a greater depth(506 km).
A.3.9. Argentina, 10 June 1964; 22.5◦S, 64.7◦W;480 km; no magnitude reported
The above NEIC location would make this an“inboard outlier” to the West of the WBZ. Whileour relocation converges on the same solution, thedataset has poor resolution in the ESE–WNW di-rection, and the 1 s ellipse intersects the mainstreamWBZ.
A.3.10. Argentina, 9 February 1926; 27◦S, 59.5◦W;540 km; MPAS = 6
The above ISS location would qualify as an out-board hypocenter, although Gutenberg and Richter’s(1954) solution (28◦S; 62◦W) lies within the WBZ.We relocate the event even farther West (28.57◦S;62.68◦W), at the very bottom of the active WBZ(626 km).
A.3.11. Chile, 18 September 1975; 34.15◦S,68.90◦W; 429 km; no magnitude reported
If its location were confirmed, this small earth-quake would represent an event detached both ver-tically and horizontally, in a section of the Andeansubduction zone where no deep seismicity is other-wise observed. We relocate the earthquake even far-ther South (35.46◦S; 67.67◦W; 465 km), but note thatthe dataset has only 5P times, with the Monte Carloellipsoid (σG = 1.5 s) intersecting the active WBZ atintermediate depths.
References
Adams, R.D., 1963. Source characteristics of some deep NewZealand earthquakes. N.Z. J. Geol. Geophys. 6, 209–220.
Adams, R.D., Ferris, B.G., 1976. A further earthquake atexceptional depth between New Zealand. N.Z. J. Geol.Geophys. 9, 269–273.
Barazangi, M., Isacks, B., Oliver, J., 1972. Propagation of seismicwaves through and beneath the lithosphere that descends underthe Tonga Island arc. J. Geophys. Res. 77, 952–958.
Bellon, H., 1981. Chronologie radiométrique (K–Ar) desmanifestations magmatiques autour de la Méditerraneéoccidentale entre 33 et 1 M a. In: Wezel, F.C. (Ed.),Sedimentary Basins of Mediterranean Margins, Tecnoprint,Bologna, pp. 341–360.
Benioff, H., 1949. Seismic evidence for the fault origin of oceanicdeeps. Geol. Soc. Amer. Bull. 60, 1837–1856.
Bina, C.R., 1997. Patterns of deep seismicity reflect buoyancystresses due to phase transitions. Geophys. Res. Lett. 24, 3301–3304.
Blanco, M.J., Spakman, W., 1993. TheP wave velocity structure ofthe mantle below the Iberian Peninsula: evidence for subductedlithosphere below southern Spain. Tectonophysics 221, 13–34.
Brudzinski, M.R., Chen, W.-P., 1998. Anomalous seismicitydisassociated with highP wave speeds in the transition zonebeneath the Tonga back-arc, Eos. Trans. Am. Geophys. Union,79 (45) F633 (abstract).
Buforn, E., Udías, A., Mezcua, J., Madariaga, R., 1991. A deepearthquake under south Spain, 8 March 1990. Bull. Seismol.Soc. Am. 81, 1403–1407.

142 E.A. Okal / Physics of the Earth and Planetary Interiors 127 (2001) 109–143
Buforn, E., Coca, P., Udías, A., Lasa, C., 1997. Source mechanismof intermediate and deep earthquakes in southern Spain. J.Seismol. 1, 113–130.
Chung, W.-Y., Kanamori, H., 1976. Source process and tectonicimplication of the Spanish deep-focus earthquake of March 29,1954. Phys. Earth Planet. Int. 13, 85–96.
DeMets, D.C., Gordon, R.G., Argus, D.F., Stein, S., 1990. Currentplate motions. Geophys. J. Intl. 101, 425–478.
Engdahl, E.R., van der Hilst, R., Berrocal, J., 1995. Imaging ofsubducted lithosphere beneath South America. Geophys. Res.Lett. 22, 2317–2320.
Engdahl, E.R., van der Hilst, R., Buland, R., 1998. Globalteleseismic earthquake relocation with improved travel-timesand procedures for depth determination. Bull. Seismol. Soc.Am. 88, 722–743.
Engebretson, D.C., Kirby, S.H., 1992. Deep Nazca slab seismicity:why is it so anomalous? Eos. Trans. Am. Geophys. Union 73(43) 379 (abstract).
Ewing, W.M., Woollard, G.P., Vine, A.C., Worzel, J.L., 1946.Recent results in submarine geophysics. Geol. Soc. Am. Bull.57, 909–934.
Fukao, Y., Obayashi, M., Inoue, H., Nenbai, M., 1992. Subductingslabs stagnant in the mantle transition zone. J. Geophys. Res.97, 4809–4822 .
Glennon, M.A., Chen, W.-P., 1993. Systematics of deep-focusearthquakes along the Kuril–Kamchatka arc and theirimplications on mantle dynamics. J. Geophys. Res. 98, 735–769.
Grand, S.P., 1994. Mantle shear structure beneath the Americasand surrounding oceans. J. Geophys. Res. 99, 11591–11621.
Grimison, N.L., Chen, W.-P., 1986. The Azores–Gibraltar plateboundary: focal mechanisms, depths of earthquakes, and theirtectonic implications. J. Geophys. Res. 91, 2029–2047.
Gutenberg, B., Richter, C.F., 1954. Seismicity of the Earth andAssociated Phenomena. Princeton University Press, Princeton,NJ, 310 p.
Huang, W.-C., Okal, E.A., 1998. Centroid moment tensor solutionsfor deep earthquakes predating the digital era: discussion andinferences. Phys. Earth Planet. Inter. 106, 191–218.
Huang, W.-C., Okal, E.A., Ekström, G., Salganik, M.P., 1997.Centroid moment tensor solutions for deep earthquakespredating the digital era: the WWSSN dataset (1962–1976).Phys. Earth Planet. Int. 99, 121–129.
Huang, W.-C., Okal, E.A., Ekström, G., Salganik, M.P., 1998.Centroid moment tensor solutions for deep earthquakespredating the digital era: the historical dataset (1907–1961).Phys. Earth Planet. Int. 6, 181–190.
Isacks, B.L., Barazangi, M., 1973. High-frequency shear wavesguided by a continuous lithosphere descending beneath westernSouth America. Geophys. J. Roy. Astron. Soc. 33, 129–139.
Isacks, B.L., Molnar, P., 1971. Distribution of stresses in thedescending lithosphere from a global survey of focal mechanismsolutions of mantle earthquakes. Rev. Geophys. Space Phys.9, 103–174.
Kagan, Y.Y., 1991. 3-D rotation of double-couple earthquakesources. Geoph. J. Intl. 106, 709–716.
Kirby, S.H., Durham, W.B., Stern, L.A., 1991. Mantle phasechanges and deep-earthquake faulting in subducting lithosphere.Science 252, 216–225.
Kirby, S.H., Okal, E.A., Engdahl, E.R., 1995. The 9 June 1994great Bolivian deep earthquake: an exceptional deep earthquakein an extraordinary subduction zone. Geophys. Res. Lett. 22,2233–2236.
Kirby, S.H., Stein, S., Okal, E.A., Rubie, D., 1996. Deepearthquakes and metastable mantle phase transformations insubducting oceanic lithosphere. Rev. Geophys. Space Phys.34, 261–306.
Kostoglodov, V.V., 1989. Maximal’naya glubina zemletryaseniii fazovye prevrashcheniya v litosfere, pograzhayushchejsyav mantiyu. In: Magnitskii, V.A. (Ed.), Fizika i vnutrenneestroienie zemli. Nauka, Moskva, pp. 52–57 (in Russian).
Levitus, S., Boyer, T.P., Antonov, J., Burgent, R., Conkright, M.E.,1994. World Ocean Atlas 1994, NOAA/NESDIS, Silver Spring,MD.
Lonergan, L., White, N., 1997. Origin of the Betic–Rif mountainbelt. Tectonics 16, 504–522.
Lundgren, P.R., Giardini, D., 1994. Isolated deep earthquakes andthe fate of subduction in the mantle. J. Geophys. Res. 99,15833–15842.
Mele, G., 1998. High-frequency wave propagation from mantleearthquakes in the Tyrrhenian Sea: constraints for the geometryof the South Tyrrhenian subduction zone. Geophys. Res. Lett.25, 2877–2880.
Mezcua, J., Rueda, J., 1997. Seismological evidence for adelamination process in the lithosphere under the Alborán Sea.Geophys. J. Intl. 129, F1–F8.
Mitchell, B.J., 1995. Anelastic structure and evolution of thecontinental crust and upper mantle from seismic surface waveattenuation. Rev. Geophys. 33, 441–462.
Mooney, H.M., 1970. Upper mantle inhomogeneity beneath NewZealand: seismic evidence. J. Geophys. Res. 75, 285–309.
Morales, J., Serrano, I., Jabaloy, A., Galindo-Zaldivar, J., Zhao,D., Torcal, F., Vidal, F., Gonzálaz-Lodeiro, F., 1999. Activecontinental subduction beneath the Betic Cordillera and theAlborán Sea. Geology 27, 735–738.
Okal, E.A., 1992. A student’s guide to teleseismic body-waveamplitudes. Seismol. Res. Lett. 63, 169–180.
Okal, E.A., Bina, C.R., 1994. The deep earthquakes of 1921–1922in northern Peru. Phys. Earth Planet. Int. 87, 33–54.
Okal, E.A., Bina, C.R., 2001. The deep earthquakes of 1997 inWestern Brazil. Bull. Seismol. Soc. Amer., 91, 161–164.
Okal, E.A., Jo, B.-G., 1990.Q measurements for phaseXovertones. Pure Appl. Geophys. 132, 331–362.
Okal, E.A., Kirby, S.H., 1998. Deep earthquakes beneath the Northand South Fiji Basins, SW Pacific: Earth’s most intense deepseismicity in stagnant slabs. Phys. Earth Planet. Int. 109, 25–63.
Okal, E.A., Talandier, J., 1997.T waves from the great 1994Bolivian deep earthquake in relation to channeling ofS waveenergy up the slab. J. Geophys. Res. 102, 27421–27437.
Okal, E.A., Talandier, J., 1998. Correction to “T waves from thegreat 1994 Bolivian deep earthquake in relation to channelingof S wave energy up the slab”. J. Geophys. Res. 103, 2793–2794.
E.A. Okal / Physics of the Earth and Planetary Interiors 127 (2001) 109–143 143
Okal, E.A., Engdahl, E.R., Kirby, S.H., Huang, W.-C., 1995.Earthquake relocations in the Kuril slab: was the 1990 Sakhalinevent not isolated after all? Eos. Trans. Am. Geophys. Union76 (17), S199, (abstract).
Okino, K., Ando, M., Kaneshima, S., Hirahara, K., 1989. Thehorizontally lying slab. Geophys. Res. Lett. 16, 1059–1062.
Richardson, W.P., 1998. Surface-wave tomography of theOntong–Java plateau: seismic probing of the world’s largestigneous province. Ph.D. Thesis. Northwestern University,Evanston, IL, 191 p.
Royden, L.H., 1993. Evolution of retreating subduction boundariesformed during continental collision. Tectonics 12, 628–638.
Sacks, I.S., 1969. Distribution of Absorption of Shear Waves inSouth America, and Its Tectonic Significance. Vol. 67, YearbookCarnegie Institute Washington, pp. 339–344.
Sasatani, T., 1980. Source parameters and rupture mechanism ofdeep-focus earthquakes. J. Fac. Sci. Hokkaido Univ. Ser. 7Geophys. 6, 301–384.
Seber, D., Barazangi, M., Ibenbrahim, A., Demnati, A., 1996.Geophysical evidence for lithospheric delamination beneath theAlborán Sea and Rif–Betic mountains. Nature 379, 785–790.
Snoke, J.A., Sacks, I.S., Okada, H., 1974a. Empirical models foranomalous high-frequency arrivals from deep-focus earthquakesin South America. Geophys. J. Roy. Astron. Soc. 37, 133–139.
Snoke, J.A., Sacks, I.S., Okada, H., 1974b. A model not requiringcontinuous lithosphere for anomalous high-frequency arrivalsfrom deep-focus South American earthquakes. Phys. EarthPlanet. Int. 9, 199–206.
Strelitz, R.A., 1980. The fate of downgoing slab: a study ofthe moment tensors from body waves of complex deep-focusearthquakes. Phys. Earth Planet. Int. 21, 83–96.
Talandier, J., Kuster, G.T., 1976. Seismicity and submarine volcanicactivity in French Polynesia. J. Geophys. Res. 81, 936–948.
Talandier, J., Okal, E.A., 1996. “MonochromaticT waves fromunderwater volcanoes in the Pacific Ocean: ringing witnessesto geyser processes”. Bull. Seismol. Soc. Am. 86, 1529–1544.
Talandier, J., Okal, E.A., 1998. On the mechanism of conversionof seismic waves to and fromT waves in the vicinity of islandshores. Bull. Seismol. Soc. Am. 88, 621–632.
Taylor, R.N., Nesbitt, R.W., Vidal, P., Harmon, R.S., Auvray, B.,Croudace, I.W., 1994. Mineralogy, chemistry and genesis of theBoninite series volcanics, Chichijima, Bonin Islands, Japan. J.Petrol. 35, 577–617.
Tracey Jr., J.I., Schlanger, S.O., Stark, J.T., Doan, D.B., May,H.G., 1964. General geology of Guam. US Geol. Surv. Prof.Paper 403-A, A1–A104.
Udías, A., López-Arroyo, A., Mezcua, J., 1976. Seismotectonicsof the Azores–Alborán region. Tectonophysics 31, 259–289.
Umino, S., 1985. Volcanic geology of Chichijima, the BoninIslands (Ogasawara Islands). J. Geol. Soc. Jpn. 91, 505–523.
Utsu, T., 1971. Seismological evidence for anomalous structuresof island arcs with special reference to the Japanese region.Rev. Geophys. Space Phys. 9, 839–890.
Uyeda, S., Kanamori, H., 1979. Back-arc opening and the modeof subduction. J. Geophys. Res. 84, 1049–1061.
Van Ark, E., Marton, F., Stein, S., Bina, C., Rubie, D.C.,1999. Persistence of metastable olivine in detached slabs asa possible cause of deep earthquakes. In: Proceedings of the1999 Alfred-Wegener Conference. Vol. 7, Terra Nostra, 1999,p. 106 (abstract).
van der Hilst, R., 1995. Complex morphology of subductedlithosphere in the mantle beneath the Tonga trench. Nature374, 154–157.
van der Hilst, R.D., Snieder, R., 1996. High-frequency precursors toP wave arrivals in New Zealand: implications for slab structure.J. Geophys. Res. 101, 8473–8488.
van der Hilst, R.D., Engdahl, E.R., Spakman, W., Nolet, G., 1991.Tomographic imaging of subducted lithosphere below northwestPacific island arcs. Nature 353, 37–43.
van der Hilst, R., Engdahl, E.R., Spakman, W., 1993. Tomographicinversion ofP andpP data for aspherical mantle structure belowthe northwest Pacific region. Geophys. J. Intl. 115, 264–302.
Wessel, P., Smith, W.H.F., 1991. Free software helps map anddisplay data. Eos. Trans. Am. Union 72, 441; 445–446.
Widiyantoro, S., Kennett, B.L.N., van der Hilst, R.D., 1997. Mantlestructure beneath Indonesia inferred from high-resolutiontomographic imaging. Geophys J. Intl. 130, 167–182.
Widiyantoro, S., Kennett, B.L.N., van der Hilst, R.D., 1999.Seismic tomography withP andS data reveals lateral variationsin the rigidity of deep slabs. Earth Planet. Sci. Lett. 173, 91–100.
Wortel, M.J.R., 1984. Spatial and temporal variations in the Andeansubduction zone. J. Geol. Soc. London 141, 783–791.
Wysession, M.E., Okal, E.A., Miller, K.L., 1991. Intraplateseismicity of the Pacific Basin, 1913–1988. Pure Appl.Geophys. 135, 261–359.