desy summer student programme top quark trigger studies ... · desy summer student programme top...
TRANSCRIPT
DESY summer student programme
Top quark trigger studies with theATLAS detector at LHC
Clemens Lange12th September 2007
AbstractThis report gives a short introduction to top quark physics and the ATLAS experiment at LHC. It isconfirmed that several cuts have to be applied to reduce the backgound which also reduce the signalheavily. Errors in the trigger algorithms were discovered and the trigger performances analysed. Theeffect of cuts and binning on the top quark mass reconstruction were evaluated.
Contents
1 Top quark physics 21.1 The top quark and the Standard Model . . . . . . . . . . . . . . . . . .. . . 21.2 Top quark properties . . . . . . . . . . . . . . . . . . . . . . . . . . . . . .31.3 Top quark production at LHC . . . . . . . . . . . . . . . . . . . . . . . . .. 31.4 Top quark decay . . . . . . . . . . . . . . . . . . . . . . . . . . . . . . . . . 4
2 The ATLAS detector 42.1 Overview . . . . . . . . . . . . . . . . . . . . . . . . . . . . . . . . . . . . 42.2 The ATLAS trigger . . . . . . . . . . . . . . . . . . . . . . . . . . . . . . . 5
3 Single top trigger studies 63.1 Cuts for single top t-channel . . . . . . . . . . . . . . . . . . . . . . . .. . 63.2 Trigger turn-on curves . . . . . . . . . . . . . . . . . . . . . . . . . . . .. 73.3 tt̄ background analysis cuts . . . . . . . . . . . . . . . . . . . . . . . . . . . 73.4 Top mass reconstruction . . . . . . . . . . . . . . . . . . . . . . . . . . .. 8
4 Summary 11
5 Acknowledgements 11
References 11
Top quark trigger studies with the ATLAS detector at LHC Clemens Lange
1 Top quark physics
1.1 The top quark and the Standard Model
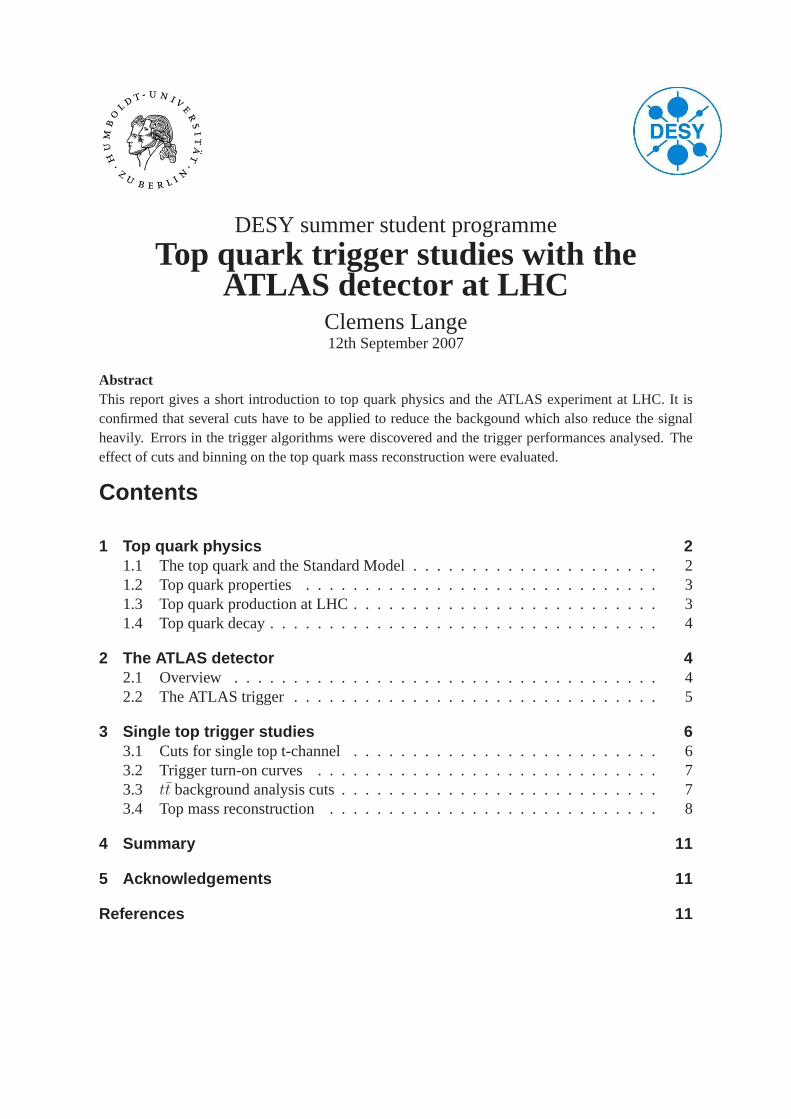
The Standard Model (SM) of elementary particle physics describes strong and electroweakinteraction between elementary particles [1]. Until today, almost all experimental tests of theStandard Model have agreed with its predictions. The Standard Model is divided into threesections: quarks, leptons and force carriers. The quarks and leptons, which in turn are dividedinto three generations, are members of a family of particlescalled fermions (particles with halfinteger spins). Both the quarks and leptons come in pairs. However, the up-like quark of thethird generation, the top quark, was long not found and finally discovered in 1995 at Fermilab[2]. Compared to the other quarks, the top quark is 35 times heavier than the next heavy quarkand with its mass of about 175 GeV very close to the scale of electroweak symmetry breaking,which is known as the Higgs mechanism. The Higgs mechanism postulates the existence ofat least one scalar, electrically neutral boson field whose coupling strength is proportional tothe mass of the particle it interacts with. However, the carrier of the Higgs field, the Higgsboson, has not yet been found and the search turns out to be very difficult because theory doesnot predict a value for the Higgs boson mass. Nevertheless the mass can be constrained byloop corrections to the W± mass which are proportional to the logarithm of the top quarkmass(figure 1).
Another important role plays the mea-
80.3
80.4
80.5
150 175 200
mH [GeV]114 300 1000
mt [GeV]
mW
[G
eV]
68% CL
∆α
LEP1 and SLD
LEP2 and Tevatron (prel.)
Figure 1:mW andmt constraints on Higgs mass [6]
surement of the cross-section of sin-gle quark production which is directlyproportional to the matrix elementVtb
of the Cabibbo-Kobayashi-Maskawa(CKM) matrix. This will either con-firm the unitarity of the CKM matrixor give indirect evidence for the ex-istence of a fourth quark generation.Several properties of the top quark in-cluding kinematical properties of topproduction and measurements of thetop mass have been examined at theTevatron. However, most of these mea-surements are limited by low statisticsdue to the low centre of mass energyof the accelerator and low luminosity(integrated luminosity from 2001 to2009 is expected to be 4.4 to 8.5 fb−1
[3]). Thus the mass of the top quarkcould only be measured up to a precision of about 1%. At LHC centre of mass energies of 14TeV will be reached and even at low luminosity (10 fb−1 / year) about eight milliontt̄ pairsand another few million single tops will be produced and therefore significant improvementsand new measurements can be undertaken.
2

Top quark trigger studies with the ATLAS detector at LHC Clemens Lange
1.2 Top quark properties
According to the Standard Model, the top quark is a fermion with spin 1
2and charge+2
3
transforming as a colour triplet under the group SU(3) of thestrong interactions and as theweak-isospin partner of the bottom quark.
Although none of these quantum numbers
)2
Top Quark Mass (GeV/c150 160 170 180 190 200
0
7
Tevatron 1.8±170.9 (Run I/Run II, March 2007)
/dof = 9.2/102χ
Lepton+Jets: D0 2.7±170.5 )
-1( 900 pb
Lepton+Jets: CDF 2.5±170.9 )
-1( 940 pb
Dilepton: D0 8.0±172.5 )
-1(1000 pb
Dilepton: CDF 5.6±164.5 )
-1(1030 pb
All-Jets: CDF 4.3±171.1 )-1( 943 pb
Best Tevatron Run II (preliminary, March 2007)
Figure 2: measurements ofmt at Tevatron [6]
have been measured so far, there is huge ev-idence for these assignments as for exampleLEP measurements ofZ0 boson propertiesconstrain the top mass to about 170 GeV.The top mass measured at Tevatron to
170.9 ± 1.8 GeV (figure 2)
leads to a lifetime of about4 ·10−25 s whichis an order of magnitude shorter than thecharacteristic QCD hadronisation time of28·10−25 s. Thus no toponium resonances willbe formed and hadronisation will not de-grade the mass measurement (still most ofthe decay products hadronise).
1.3 Top quark production at LHC
At LHC top quarks can be produced astt̄ pairs via strong interaction and as single top quarkvia electroweak interaction. There are three leading orderFeynman diagrams fortt̄ production(figure 3) with a total cross-section ofσ(tt̄) = 833 pb calculated at next-to-leading order whichimplies a production of more than 8 milliontt̄ pairs per year at low luminosity and ten timesthat number at high luminosity [5] (100 fb−1 / year). The dominating production process atLHC is gluon-gluon fusion.
The single top production is about one
Figure 3:tt̄ production Feynman diagrams
third of thett̄ cross-section. The dom-inant mechanisms are the s-channel,the t-channel (W-gluon fusion) and theassociated production (figure 4) wherethe t-channel production is the domi-nant one at LHC (table 1).
(a) s-channel (b) t-channel (c) associated production
Figure 4: single top production Feynman diagrams
3

Top quark trigger studies with the ATLAS detector at LHC Clemens Lange
process LHC (t)√
14 TeV LHC (t̄)√
14 TeVσNLO
s-chan(pb) 6.06 ± 0.004 3.76 ± 0.003σNLO
t-chan (pb) 150.0 ± 0.2 88.5 ± 0.1σNLO
assoc.(pb) 32.1 ± 0.03 32.1 ± 0.03
Table 1: Single top quark production NLO cross-sections [4]
Although the single top production cross-section is smaller than thett̄ cross-section it is stillvery important as for example the CKM matrix elementVtb mentioned above can only bemeasured from single top production and the event topology is easier. Furthermore, as singletops are produced through weak interaction, they are highlypolarised and since the lifetime ofthe top quark is shorter than the time needed for a spin-flip, decay products, in particular theleptons, retain the spin information of the original top quark whereas fortt̄ one can only findspin correlations between the two top quarks. For the study of single top events which thiswork is focussed on,tt̄ production is one of the main background events.
1.4 Top quark decay
The top quark decays predominantly into a
Figure 5: top quark decay chain intt̄ events
b quark and a W (with a branching ratio ofthe size ofVtb). Because of fermion univer-sality in electroweak interactions, the W bo-son decays into a lepton and a neutrino onethird of the time and into a quark antiquarkpair two thirds of the time (figure 5). Fur-ther decay chains are possible if one con-siders flavour changing neutral currents orextensions of the Standard Model, but theseare beyond the scope of this work and willnot be covered.
2 The ATLAS detector
2.1 Overview
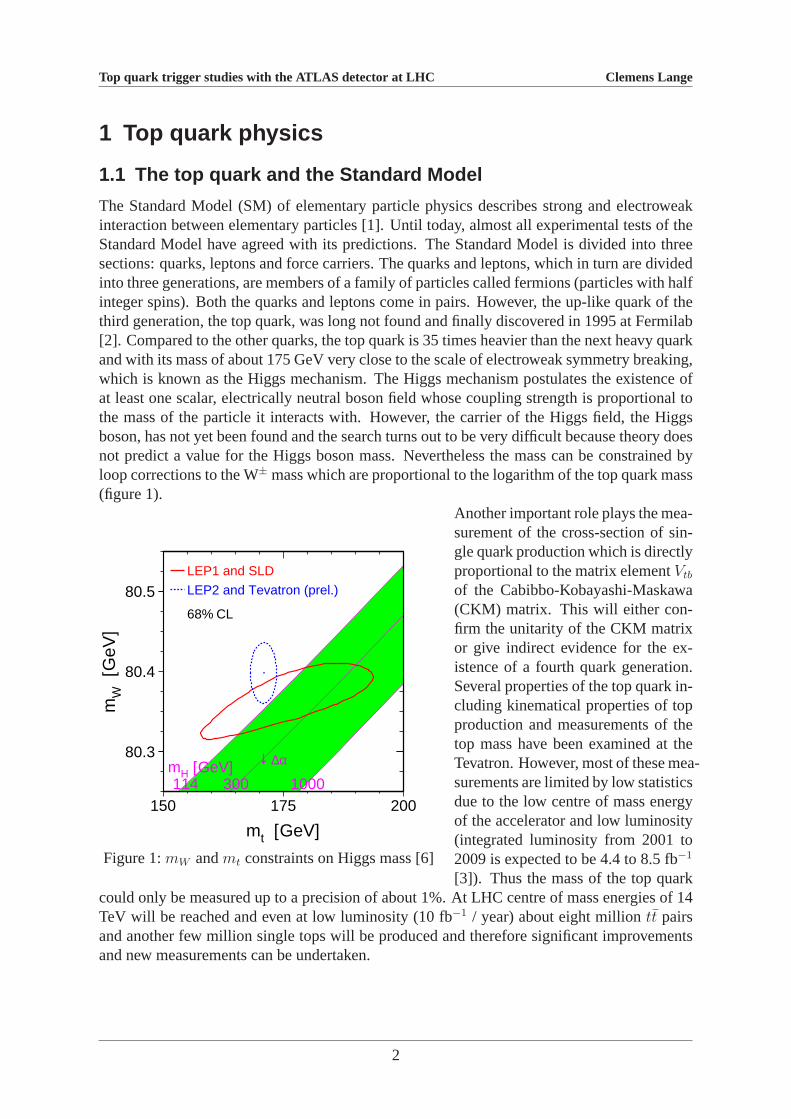
The ATLAS detector is one of the four particle detectors at the Large Hadron Collider (LHC)at CERN near Geneva. ATLAS is like the CMS (Compact Muon Solenoid)detector a multi-purpose detector, because due to its components its measurements can be used for severalareas of particle physics. ATLAS has the shape of a 45 m long cylinder with a diameter of 22m, weighing 7000 t (figure 6). The instrumentation of the detector is grouped in three systems:the inner detector, the calorimeter system, and the muon spectrometer. The inner detector iscomposed of three components used for trace detection. The pixel detector which can measurethe impact parameter is located directly around the interaction point. For measuring charge
4
Top quark trigger studies with the ATLAS detector at LHC Clemens Lange
Figure 6: The ATLAS detector
and transverse momentum of the particles silicon strip detectors and a transition radiationtracker (TRT) are used. The TRT which is put around the silicon strip detectors makes itpossible to distinguish between electrons and hadrons. Thecalometry system consists ofelectron and hadron calorimeters by which the energy of the particles is determined. Themuon spectrometer which forms the outer layer of the detector is used to measure trajectoriesand momenta of the muons because they are the only directly measurable particles that canpass through the calorimeter.
2.2 The ATLAS trigger
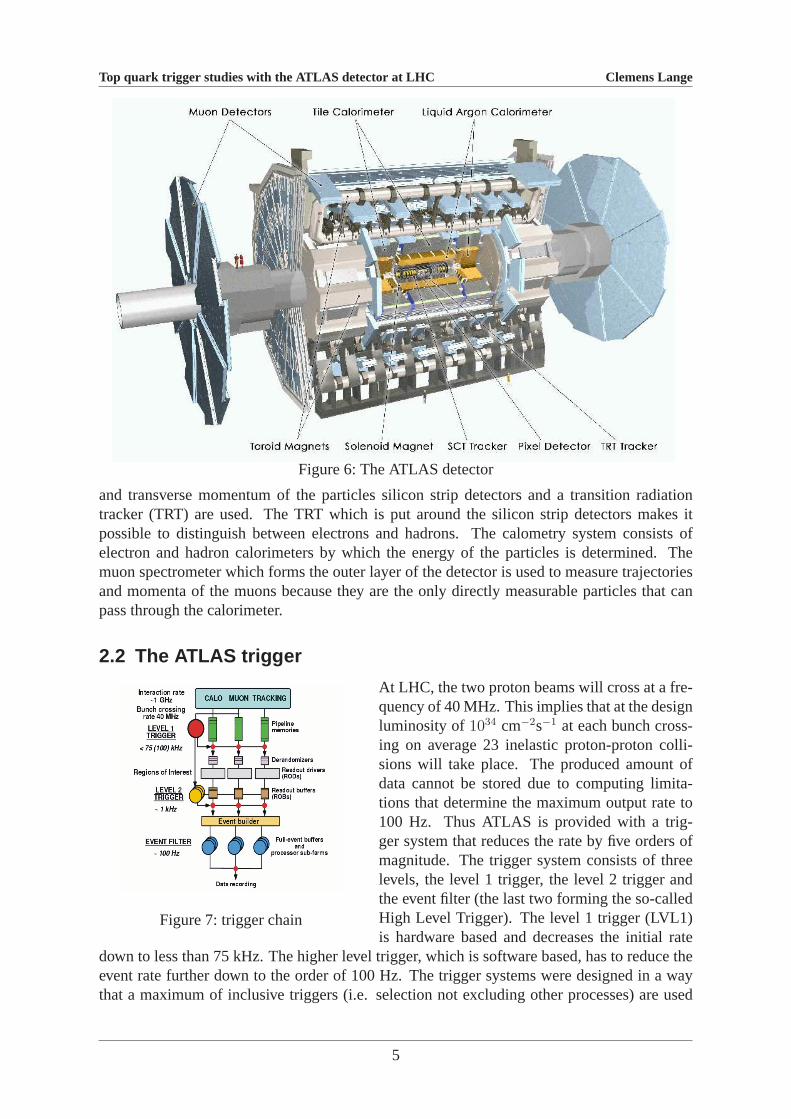
At LHC, the two proton beams will cross at a fre-
Figure 7: trigger chain
quency of 40 MHz. This implies that at the designluminosity of1034 cm−2s−1 at each bunch cross-ing on average 23 inelastic proton-proton colli-sions will take place. The produced amount ofdata cannot be stored due to computing limita-tions that determine the maximum output rate to100 Hz. Thus ATLAS is provided with a trig-ger system that reduces the rate by five orders ofmagnitude. The trigger system consists of threelevels, the level 1 trigger, the level 2 trigger andthe event filter (the last two forming the so-calledHigh Level Trigger). The level 1 trigger (LVL1)is hardware based and decreases the initial rate
down to less than 75 kHz. The higher level trigger, which is software based, has to reduce theevent rate further down to the order of 100 Hz. The trigger systems were designed in a waythat a maximum of inclusive triggers (i.e. selection not excluding other processes) are used
5

Top quark trigger studies with the ATLAS detector at LHC Clemens Lange
on the one hand in order to cover the expected physics as fullyas possible and on the otherhand to be able to discover possible new and unforeseen signatures. The selection of an eventroughly works as follows: The level 1 trigger points to so-called Regions of Interests (RoI)using fairly simple criteria such as passing a certain energy threshold value in a particular partof the detector (figure 7). These regions are passed on to the higher level trigger where ini-tially further information is evaluated by the level 2 trigger. Events considered as interesting(i.e. having fired a sufficient number of triggers) are passedon to the event filter, which thencontains the full physical information of the whole detector for one event that is being savedto disk.
3 Single top trigger studies
3.1 Cuts for single top t-channel
The single top t-channel production has the highest cross-section of the single top processesand is directly proportional toVtb and is therefore the best channel for studying single topevents. As the single top t-channel has a very unique event signature consisting of one forwardjet, one b-tagged jet in the central region, one lepton and one neutrino (missing energy) thereare a number of specific cuts proposed for it in order to cut background events such astt̄,W+jets and others (figure 8):
1. exactly two jets withpT > 30 GeV
2. one of the two jets with|η| > 2.5 andpT > 50 GeV
3. the other jet b-tagged withpT > 50 GeV
4. one lepton withpT > 20 GeV
5. HT > 200 GeV andminv > 300 GeV
6. reconstructed top mass between 150 and 200 GeV.
These cuts decrease the event selection effi-
Figure 8: single top event topology
ciency down to 2% while at the same time re-ducing background events below 0.01%. Forthis study only trigger efficiencies for singletop t-channel and no background events havebeen analysed and can be seen in table 2.The level 1, 2 and event filter cuts are dueto the available trigger menu slightly tighter(e.g. demanding isolated electron withpT >
25 GeV) and therefore further decrease theefficiency. The results are though not in de-tail but in general in good agreement with thefigures given in the TDR [5].
6

Top quark trigger studies with the ATLAS detector at LHC Clemens Lange
cut cumulative efficiency (%)forward jet withpT > 50 GeV, |η| > 2.5 46.3
b-tagged jet withpT > 50 GeV 26.2lepton (µ or e) withpT > 20 GeV 10.3
LVL1 analysis 5.24LVL1 analysis 4.89
EF analysis 4.50
Table 2: Single top quark t-channel cut efficiencies
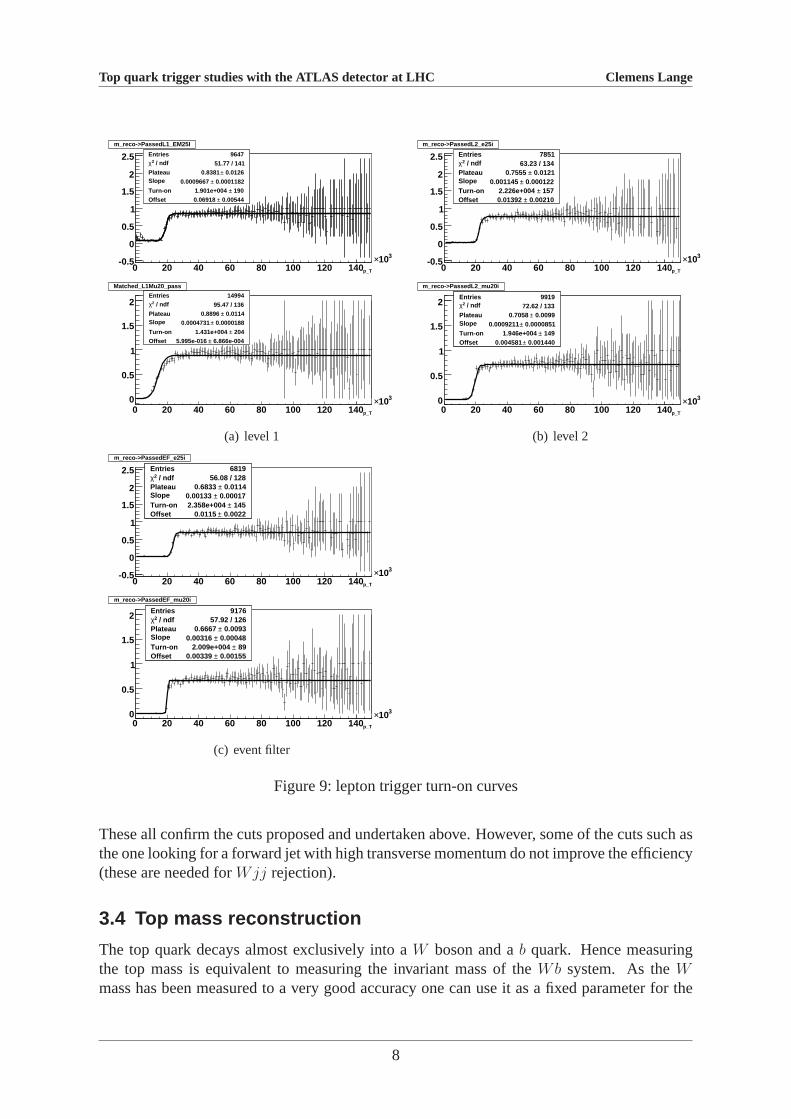
3.2 Trigger turn-on curves
In order to understand the way the trigger works, so-called turn-on curves were producedrelative to the according truth values. As there was a bug in truth for the jets no turn-on curvescould be produced for the jet triggers. At level 1 there was a bug in the muonpT > 20 GeVtrigger as well. However, this could be resolved by implementing a manual trigger by using∆R =
√
∆η2 + ∆φ2 matching of level 1 muons to truth muons. The turn-on curves werethen fitted with a Fermi-Dirac function of the form
f(x) = a +b − a
exp[−d · (x − c)] + 1
wherea denotes the offset,b the plateau,c the turn-on parameter (defined asx-coordinate ofthe mid-point between offset and plateau) andd the slope. The perfect behaviour of a turn-oncurve would be to reject all events up to the threshold value and then let all events pass thatare greater than the threshold value (immediate jump from 0 to 1). One can observe that forleptons this proves to be true and the turn-on behaviour constantly improves from level 1 overlevel 2 to event filter (figure 9).However, turn-on behaviour for the missing transverse energy triggers is very bad (figure 10)which means that one should never use theEmiss
T trigger on its own but always in combina-tion with a lepton trigger. Further investigation of the other missing transverse energy triggersshowed improvements for theEmiss
T > 30 GeV andEmissT > 40 GeV but one should be aware
that use of theEmissT > 40 GeV cuts another 35% of the events compared toEmiss
T > 20 GeVwhich needs further evaluation. Comparison with truthEmiss
T showed shifts (general under-estimation) of on average 4 GeV for level 1, 11 GeV for event filter and 0.4 GeV for thereconstruction (i.e. reconstruction works fine). Depending on the total scalar sum of trans-verse energy one observes improvements in all measurements, although level 1 measurementsfor largeEsum
T > 600 GeV even lead to overestimation (figure 11).
3.3 tt̄ background analysis cuts
As mentioned above, in order to reject background events onehas to apply cuts on multi-plicities of particles and energies. The generally used strategy to determine these cuts is touse efficiency and purity curves. These variables are definedin the follwing way: efficiencyǫ =
Npass
Nsignaland purityp = 1− Nbackground
Ntotal. As the only background data samples available werett̄
samples analyses were only carried out with these. A selection of plots is shown in figure 12.
7
Top quark trigger studies with the ATLAS detector at LHC Clemens Lange
Entries 9647 / ndf 2χ 51.77 / 141
Plateau 0.0126± 0.8381 Slope 0.0001182± 0.0009667
Turn-on 190± 1.901e+004
Offset 0.00544± 0.06918
p_T0 20 40 60 80 100 120 140310×-0.5
0
0.5
1
1.5
2
2.5 Entries 9647 / ndf 2χ 51.77 / 141
Plateau 0.0126± 0.8381 Slope 0.0001182± 0.0009667
Turn-on 190± 1.901e+004
Offset 0.00544± 0.06918
Entries 9647 / ndf 2χ 51.77 / 141
Plateau 0.0126± 0.8381 Slope 0.0001182± 0.0009667
Turn-on 190± 1.901e+004
Offset 0.00544± 0.06918
Entries 9647 / ndf 2χ 51.77 / 141
Plateau 0.0126± 0.8381 Slope 0.0001182± 0.0009667
Turn-on 190± 1.901e+004
Offset 0.00544± 0.06918
m_reco->PassedL1_EM25I
Entries 14994 / ndf 2χ 95.47 / 136
Plateau 0.0114± 0.8896 Slope 0.0000188± 0.0004731
Turn-on 204± 1.431e+004
Offset 6.866e-004± 5.995e-016
p_T0 20 40 60 80 100 120 140310×0
0.5
1
1.5
2Entries 14994
/ ndf 2χ 95.47 / 136
Plateau 0.0114± 0.8896 Slope 0.0000188± 0.0004731
Turn-on 204± 1.431e+004
Offset 6.866e-004± 5.995e-016
Matched_L1Mu20_pass
(a) level 1
Entries 7851 / ndf 2χ 63.23 / 134
Plateau 0.0121± 0.7555 Slope 0.000122± 0.001145 Turn-on 157± 2.226e+004 Offset 0.00210± 0.01392
p_T0 20 40 60 80 100 120 140310×-0.5
0
0.5
1
1.5
2
2.5 Entries 7851 / ndf 2χ 63.23 / 134
Plateau 0.0121± 0.7555 Slope 0.000122± 0.001145 Turn-on 157± 2.226e+004 Offset 0.00210± 0.01392
m_reco->PassedL2_e25i
Entries 9919 / ndf 2χ 72.62 / 133
Plateau 0.0099± 0.7058 Slope 0.0000851± 0.0009211 Turn-on 149± 1.946e+004 Offset 0.001440± 0.004581
p_T0 20 40 60 80 100 120 140310×0
0.5
1
1.5
2Entries 9919
/ ndf 2χ 72.62 / 133Plateau 0.0099± 0.7058 Slope 0.0000851± 0.0009211 Turn-on 149± 1.946e+004 Offset 0.001440± 0.004581
m_reco->PassedL2_mu20i
(b) level 2
Entries 6819 / ndf 2χ 56.08 / 128
Plateau 0.0114± 0.6833 Slope 0.00017± 0.00133 Turn-on 145± 2.358e+004 Offset 0.0022± 0.0115
p_T0 20 40 60 80 100 120 140310×-0.5
0
0.5
1
1.5
2
2.5 Entries 6819 / ndf 2χ 56.08 / 128
Plateau 0.0114± 0.6833 Slope 0.00017± 0.00133 Turn-on 145± 2.358e+004 Offset 0.0022± 0.0115
m_reco->PassedEF_e25i
Entries 9176 / ndf 2χ 57.92 / 126
Plateau 0.0093± 0.6667 Slope 0.00048± 0.00316 Turn-on 89± 2.009e+004 Offset 0.00155± 0.00339
p_T0 20 40 60 80 100 120 140310×0
0.5
1
1.5
2Entries 9176
/ ndf 2χ 57.92 / 126Plateau 0.0093± 0.6667 Slope 0.00048± 0.00316 Turn-on 89± 2.009e+004 Offset 0.00155± 0.00339
m_reco->PassedEF_mu20i
(c) event filter
Figure 9: lepton trigger turn-on curves
These all confirm the cuts proposed and undertaken above. However, some of the cuts such asthe one looking for a forward jet with high transverse momentum do not improve the efficiency(these are needed forWjj rejection).
3.4 Top mass reconstruction
The top quark decays almost exclusively into aW boson and ab quark. Hence measuringthe top mass is equivalent to measuring the invariant mass ofthe Wb system. As theWmass has been measured to a very good accuracy one can use it asa fixed parameter for the
8
Top quark trigger studies with the ATLAS detector at LHC Clemens Lange
Entries 37076
/ ndf 2χ 21.6 / 146
Plateau 0.0207± 0.9943
Slope 1.681e-005± 6.628e-005
Turn-on 4565± 4.687e+004
Offset 0.0449± 0.6344
p_T0 20 40 60 80 100 120 140
×
0.4
0.6
0.8
1
1.2
Entries 37076
/ ndf 2χ 21.6 / 146
Plateau 0.0207± 0.9943
Slope 1.681e-005± 6.628e-005
Turn-on 4565± 4.687e+004
Offset 0.0449± 0.6344
m_reco->PassedL1_XE20
Entries 31070
/ ndf 2χ 43.5 / 146
Plateau 0.0223± 0.9745
Slope 9.765e-006± 7.033e-005
Turn-on 1828± 5.646e+004
Offset 0.022± 0.442
p_T0 20 40 60 80 100 120 140
×
0.2
0.4
0.6
0.8
1
1.2
Entries 31070
/ ndf 2χ 43.5 / 146
Plateau 0.0223± 0.9745
Slope 9.765e-006± 7.033e-005
Turn-on 1828± 5.646e+004
Offset 0.022± 0.442
m_reco->PassedL1_XE30
Entries 23717
/ ndf 2χ 57.78 / 146
Plateau 0.0245± 0.9385
Slope 6.393e-006± 7.393e-005
Turn-on 1381± 6.689e+004
Offset 0.0111± 0.2735
p_T0 20 40 60 80 100 120 140
×
0.2
0.4
0.6
0.8
1
1.2
Entries 23717
/ ndf 2χ 57.78 / 146
Plateau 0.0245± 0.9385
Slope 6.393e-006± 7.393e-005
Turn-on 1381± 6.689e+004
Offset 0.0111± 0.2735
m_reco->PassedL1_XE40
Figure 10: level 1 missing energy turn-on curves
EtfinalEntries 15Mean 3.163e+005RMS 2.514e+005
sum E_T100 200 300 400 500 600 700 800
310×
E_T
rec
o -
E_T
Tru
th
-25000
-20000
-15000
-10000
-5000
0
5000
10000
15000
20000
25000
EtfinalEntries 15Mean 3.163e+005RMS 2.514e+005
Etfinallevel 1
event filter
reco
Figure 11: SumET dependence of missingET
reconstruction of the top quark. In the analysis hadronicW decays are excluded becausethey are difficult to distinguish from the background. Thus the missing transverse energyonly comes from the neutrino and can be used to reconstruct its momentum. However, thez-component of the neutrinopν
z is still unknown. Using four vector calculations and applyingthe principles of conservation of energy and momentum one ends up with a quadratic equation
9

Top quark trigger studies with the ATLAS detector at LHC Clemens Lange
AllJet_multiplicity_histstopEntries 18750Mean 3.586RMS 1.432
N0 1 2 3 4 5 6 7 8 90
1000
2000
3000
4000
5000
AllJet_multiplicity_histstopEntries 18750Mean 3.586RMS 1.432
All Jet multiplicity
efficiencyEntries 10Mean 6.133RMS 2.066
0 1 2 3 4 5 6 7 8 90
0.2
0.4
0.6
0.8
1
efficiencyEntries 10Mean 6.133RMS 2.066
efficiency
(a) all jet multiplicity
Lepton_multiplicity_histstopEntries 18750Mean 0.5774RMS 0.5829
N0 1 2 3 4 5 6 7 8 90
1000
2000
3000
4000
5000
6000
7000
8000
9000
Lepton_multiplicity_histstopEntries 18750Mean 0.5774RMS 0.5829
Lepton multiplicity
efficiencyEntries 10Mean 4.771RMS 2.735
0 1 2 3 4 5 6 7 8 9
0.5
0.6
0.7
0.8
0.9
1
efficiencyEntries 10Mean 4.771RMS 2.735
efficiency
(b) lepton multiplicity
HT_histstopEntries 18750Mean 2.61e+005RMS 9.799e+004
N0 50 100 150 200 250 300 350 400 450 500
310×0
20
40
60
80
100
HT_histstopEntries 18750Mean 2.61e+005RMS 9.799e+004
Total Transverse Energy
efficiencyEntries 500Mean 3.602e+005RMS 9.356e+004
0 50 100 150 200 250 300 350 400 450 500
310×0
0.2
0.4
0.6
0.8
1
efficiencyEntries 500Mean 3.602e+005RMS 9.356e+004
efficiency
(c) total transverse energy
Figure 12: top: multiplicities/energy distribution for single top andtt̄, bottom: efficiency andpurity curves for single top signal withtt̄ background. In black: single top signal,in red/shaded:tt̄ background.
for pνz :
pνz =
−B ±√
B2 − 4AC
2A
where the parametersA = (pl
z)2 − (El)2
B = 2Hplz
C = H2 − (pνT )2(El)2
H =m2
W
2+ pl
xpνx + pl
ypνy
are all known. Events with a negative discriminant were dropped and it turned out to givebetter results when one always used the smallerpν
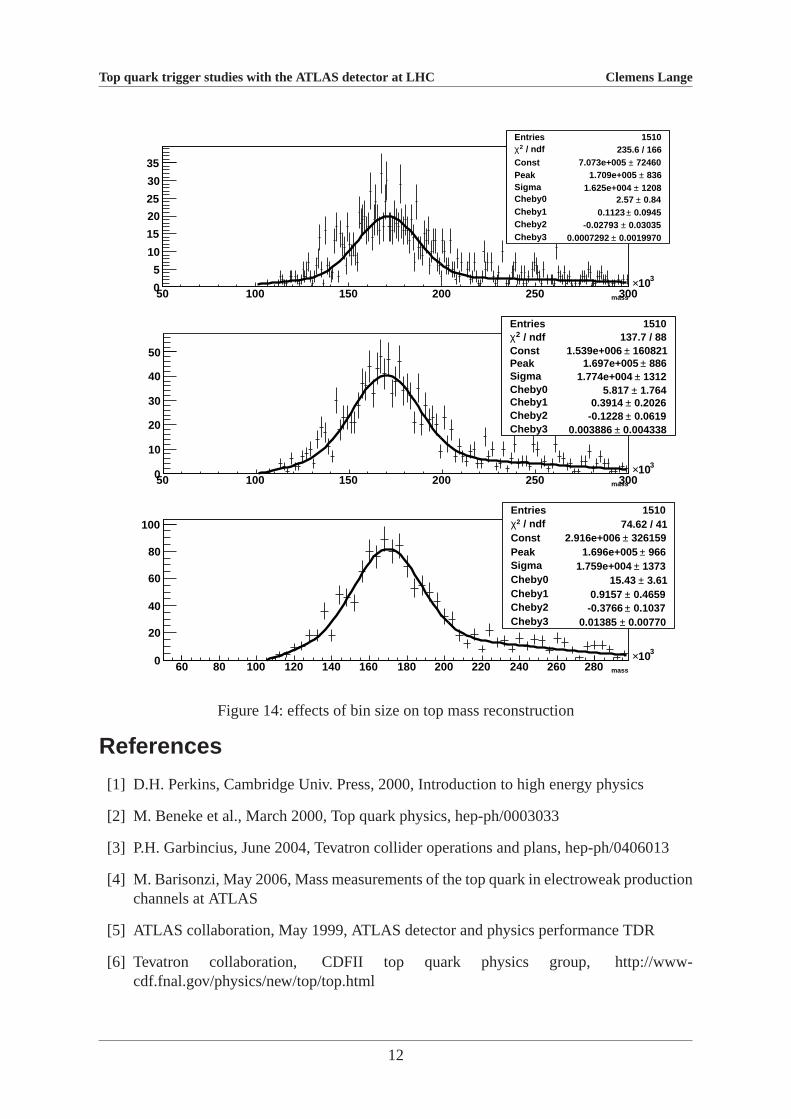
z . Other approaches such as fitting theW mass did not show improvements. The top mass was then obtained by calculating theinvariant mass of theWb system and then fitting the plot with a Gaussian distributionand aChebyshev polynomial of third order whereas the Gaussian models the top mass peak whilethe polynomial curve handles both combinatoric and irreducible background. The plot showsthat there is no bias introduced by the additional trigger cuts (figure 13).In figure 14 one can see that changing the binning from 1 GeV perbin over 2 GeV per binto 4 GeV per bin does not improve the fit (χ2/ndf increases) and slightly shifts the top quarkmass to lower values by about 1 GeV. The top mass values using the Gauss-Chebychev fit areshown in table 3.
binning top mass [GeV] χ2/ndf1 GeV/bin 170.9 1.422 GeV/bin 169.7 1.564 GeV/bin 169.6 1.82
Table 3: top mass reconstruction
10

Top quark trigger studies with the ATLAS detector at LHC Clemens Lange
t_massEntries 1510
Mean 1.829e+005
RMS 3.751e+004
mass50 100 150 200 250 300
310×0
5
10
15
20
25
30
35
t_massEntries 1510
Mean 1.829e+005
RMS 3.751e+004
FullReco t_mass
LVL1 pass t_mass
LVL2 pass t_mass
EF pass t_mass
t_mass
Figure 13: top quark mass plot in MeV for trigger levels and reco
4 Summary
It was shown that though there is a high reduction of the signal of the single top t-channel,this is needed in order to reject the numerous background events (in this report onlytt̄). Theefficiencies obtained are in agreement with earlier studiesand threshold values might onlybe improved slightly by further studies. However, there arestill some errors in the triggeralgorithms that should be fixed. For the missing transverse energy triggers one will have toevaluate if improvement by looking at the transverse energysum dependence can be made orif their performance can be improved by coupling them to lepton triggers. Reconstruction ofthe top quark works well though one has to be aware of the effects of the ambiguity of theneutrino reconstruction and the binning effects.
5 Acknowledgements
I would like to thank the DESY Zeuthen ATLAS working group fortheir support, especiallymy official and unofficial supervisors, Klaus Mönig, Marcello Barisonzi, Sascha Mehlhaseand Oliver Kind.
11
Top quark trigger studies with the ATLAS detector at LHC Clemens Lange
Entries 1510 / ndf 2χ 235.6 / 166
Const 72460± 7.073e+005 Peak 836± 1.709e+005 Sigma 1208± 1.625e+004 Cheby0 0.84± 2.57 Cheby1 0.0945± 0.1123 Cheby2 0.03035± -0.02793 Cheby3 0.0019970± 0.0007292
mass50 100 150 200 250 300310×0
5
10
15
20
25
30
35
Entries 1510 / ndf 2χ 235.6 / 166
Const 72460± 7.073e+005 Peak 836± 1.709e+005 Sigma 1208± 1.625e+004 Cheby0 0.84± 2.57 Cheby1 0.0945± 0.1123 Cheby2 0.03035± -0.02793 Cheby3 0.0019970± 0.0007292
t_mass
Entries 1510 / ndf 2χ 137.7 / 88
Const 160821± 1.539e+006 Peak 886± 1.697e+005 Sigma 1312± 1.774e+004 Cheby0 1.764± 5.817 Cheby1 0.2026± 0.3914 Cheby2 0.0619± -0.1228 Cheby3 0.004338± 0.003886
mass50 100 150 200 250 300310×0
10
20
30
40
50
Entries 1510 / ndf 2χ 137.7 / 88
Const 160821± 1.539e+006 Peak 886± 1.697e+005 Sigma 1312± 1.774e+004 Cheby0 1.764± 5.817 Cheby1 0.2026± 0.3914 Cheby2 0.0619± -0.1228 Cheby3 0.004338± 0.003886
t_mass
Entries 1510 / ndf 2χ 74.62 / 41
Const 326159± 2.916e+006 Peak 966± 1.696e+005 Sigma 1373± 1.759e+004 Cheby0 3.61± 15.43 Cheby1 0.4659± 0.9157 Cheby2 0.1037± -0.3766 Cheby3 0.00770± 0.01385
mass60 80 100 120 140 160 180 200 220 240 260 280310×0
20
40
60
80
100Entries 1510
/ ndf 2χ 74.62 / 41Const 326159± 2.916e+006 Peak 966± 1.696e+005 Sigma 1373± 1.759e+004 Cheby0 3.61± 15.43 Cheby1 0.4659± 0.9157 Cheby2 0.1037± -0.3766 Cheby3 0.00770± 0.01385
t_mass
Figure 14: effects of bin size on top mass reconstruction
References
[1] D.H. Perkins, Cambridge Univ. Press, 2000, Introductionto high energy physics
[2] M. Beneke et al., March 2000, Top quark physics, hep-ph/0003033
[3] P.H. Garbincius, June 2004, Tevatron collider operations and plans, hep-ph/0406013
[4] M. Barisonzi, May 2006, Mass measurements of the top quarkin electroweak productionchannels at ATLAS
[5] ATLAS collaboration, May 1999, ATLAS detector and physics performance TDR
[6] Tevatron collaboration, CDFII top quark physics group, http://www-cdf.fnal.gov/physics/new/top/top.html
12