dessy~ j. - vtechworks.lib.vt.edu · thanks also goes to dr. ray dessy for providing an environment...
TRANSCRIPT

THE DESIGN AND APPLICATION
OF AN AUTOMATED LUMINOMETER
FOR CHEMILUMINESCENCE
by
Ian Chapple
Dissertation submitted to the Faculty of the
Virginia Polytechnic Institute and State University
in partial fulfillment of the requirements
APPROVED:
H. M. McNair
J. F. WolfV
for the degree of
DOCTOR OF PHILOSOPHY
in
Chemistry
R. E. Dessy~ Chai)man
J. G. Mason
J. E. McGrat.h
November, 1984
Blacksburg, Virginia

To
for her love and patience
ii

ACKNOWLEDGEMENTS
The person to whom I am most deeply indebted for this
work is my mother . If it were not for her
initial faith in my abilities and continued support, my
venture into tertiary education would never have started,
nor would it have been seen through to completion.
I would like to thank Dr. and Dr. Harold
McNair for offering me the initial opportunity to come to
the United States to attend graduate school. Also special
thanks goes to Dr. and family for providing a
familiar face and a familiar accent during those first few
months of adjustment.
Thanks also goes to Dr. Ray Dessy for providing an
environment in which so many talented people have
congregated and shared their skills. The members of the
Laboratory Automation and Instrument Design group have
been a constant source of knowl~dge, inspiration and
friendship for which I will always be grateful. In
particular I must thank 1 without whose help
and advice, on such subjects as biochemistry and pulse
counting, this particular project would never have come to
completion.
Finally, I would like to thank my wife
for constantly providing me with the inspiration to go on
and with the notion that, yes, there is life after
iii

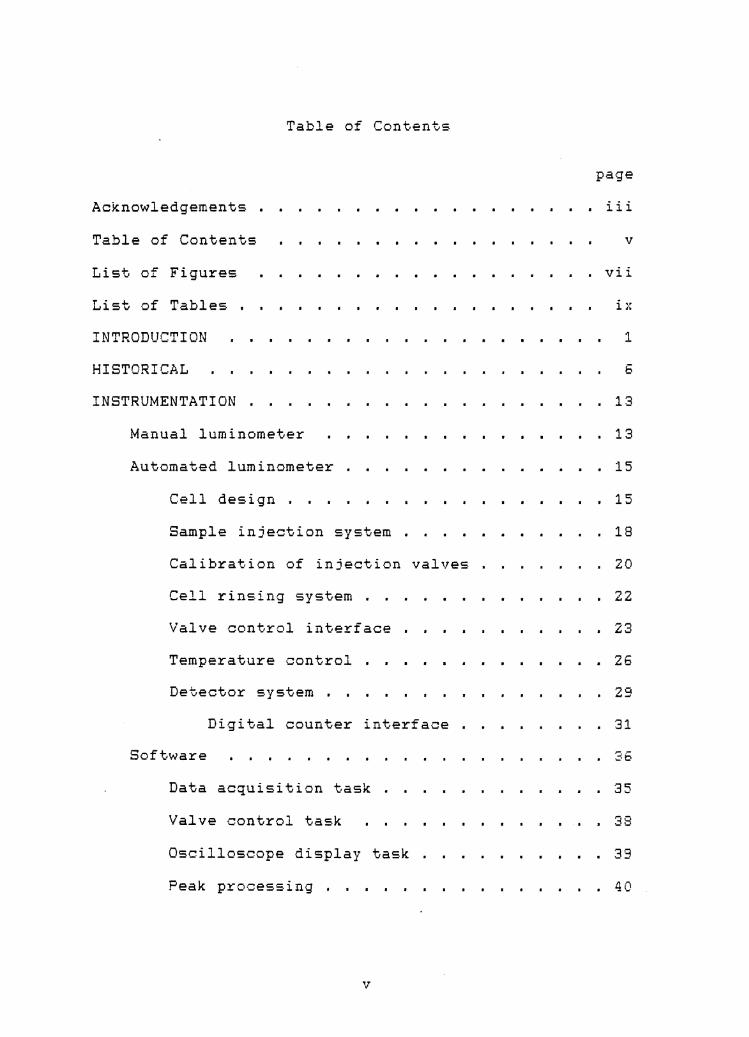
Table of Contents
Acknowledgements .
Table of Contents
List of Figures
List. of Tables .
INTRODUCTION
HISTORICAL
INSTRUMENTATION
Manual luminometer
Automated luminometer .
Cell design .
Sample injection system .
Calibration of injection valves
Cell rinsing system .
Valve control interface .
Temperature control .
Detector system .
Digital counter interface .
Software
Data acquisition task
Valve control task
Oscilloscope display task .
Peak processing .
v
page
. iii
v
vii
l. '·' ,.
1
6
. 13
. 13
. 15
. 15
. 18
. 20
. 23
. 26
29
. 31
36
35
I 38
39
. 40

vi
page
EXPERIMENTAL • • • 42
Eosin purification . . . . . . . . . . ...... 43
Effect of pH . . . . • • . . • . . . . . . . • . • 45
. . . . . . . . .• 49 Buff er concentration .
Manganese concentration
Enzyme concentration .
Eosin concentration
. . . . . . . . . 51
. . . . . . . 55
Effect of oxygen .
NADH response
Coupling to alcohol dehydrogenase
. 59
. 64
. . • 66
. 69
Coupling to glucose-6-phosphate dehydrogenase . • 76
Coupling to formate dehydrogenase . . . . . . 79
Investigation of eosin bleaching . . 83
Lactone formation . . . . . . . . . . . . 83
Superoxide anion . . . . . . • . . . . . . 86
Hydroxyl radical . . . . . . . . . . . 87
EDTA . . . . . . . . . . . . . . . . . . . . . 88
DISCUSSION . . . . . . . . . . . . . . . . . . . . . 90
SUMMARY ...
REFERENCES
APPENDIX A: Software Glossary ....
APPENDIX B: Software Listings ..
VITA
ABSTRACT
106
110
113
121
129
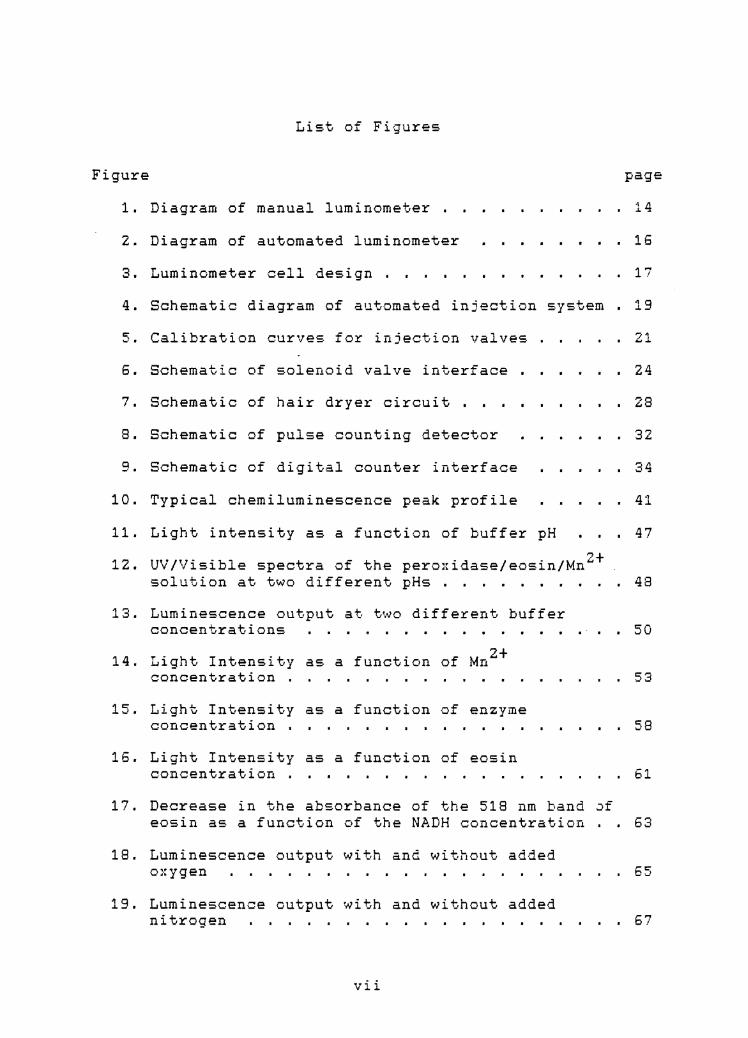
Lis.t of Figures
Figure page
1. Diagram of manual luminometer . . 14
Z. Diagram of automated luminometer . 16
3. Luminometer cell design . . 17
4. Schematic diagram of automated injection system . 19
5. Calibration curves for injection valves 21
6. Schematic of solenoid valve interface . . 24
7. Schematic of hair dryer circuit . ZS
8. Schematic of pulse counting detector 3Z
9. Schematic of digital counter interface . 34
10. Typical chemiluminescence peak profile . 41
11. Light intensity as a function of buffer pH . 47 . . z+ 12. UV/Visible spectra of the perox1dase/eos1n/Mn
solution at two different pHs . . 48
13. Luminescence output at two different buffer concentrations
?t 14. Light Intensity as a function of Mn-concentration .
15. Light Intensity as a function of enzyme concentration .
16. Light Intensity as a function of eosin concentrat,ion .
17. Decrease in the absorbance of the 518 nm band ~f
eosin as a function of the NADH concentration .
18. Luminescence output with and without added oxygen
19. Luminescence output with and without added nitrogen
vii
. 50
. 53
. 58
. 61
. 63
-1:" • b .!
. 67

viii
Figure
ZO. Light intensity as a function of NADH concentration .
21. Rate of reduction of NAD+ by alcohol dehydrogenase in two different buffers at various pHs .
22. Rate of reduction of NAD+ by alcohol dehydrogenase in two different buffers at various pHs .
+ 23. Amount of NAD reduced by glucose-6-phoshate
page
. 70
. 73
. 75
dehydrogenase as a function of incubation time . 78
24. System response to glucose-6-phosphate concentration
25. System response to formic acid concentration
. 80
. 82
26. Mechanism for the oxidation of NADH by peroxidase in the presence of a phenol . . 91

List of Tables
Table page
1. Composition of solutions used f2f evaluation of response as a function of Mn concentration . . 52
z. Composition of solutions used for evaluation of response as a function of peroxidase concentration . . 56
3. Composition of solutions used for evaluation of response as a function of eosin concentration . . 60
4. Standard solutions for NADH calibration curve .. 68
5. Standard solutions for formic acid calibration curve .
l·v ,.
. 81

INTRODUCTION
Chemiluminescence can be defined as the generation of
electronically excited states by means of a chemical
reaction and the subsequent dissipation of this electronic
energy in the form of fluorescence. The known
chemiluminescing reactions are many and varied, as are the
structures of the luminescing species. Chemiluminescence
has been observed from the reaction of simple gases,
aromatic hydrocarbons and biological molecules.
This diversity would imply that there is no single
common mechanism associated with a chemiluminescent
process. Hercules has stated that the requirements for an
efficient chemiluminescent process are: "sufficient
excitation energy; presence of a species capable of
forming an electronically excited state; an emitter to
give off the excitation energy; a fast reaction rate and a
reaction coordinate system that is favorable to excited
state production" (1). The energy available from most
chemiluminescent reactions is sufficient for the
excitation of large aromatic molecules. It is, therefore,
not surprising that the vast majority of these reactions
involve large molecules with low lying antibonding
orbitals and high fluorescence efficiencies.
The use of chemiluminescence as an analytical tool
became truly viable with Albrechts' discovery of
1
2
"luminol", 5-amino-Z,3-dihydrophthalazine-1,4-dione, which
is a simple, easy to handle molecule that can be produced
in high purity and which has one of the highest
chemiluminescent efficiencies known for a non-biological
molecule (Z). The chemiluminescent efficiency of a
reaction is define as:
einsteins of light produced eff. = ----------------------------- [1]
moles of reactant consumed
The efficiency of the luminol reaction is about 0.01
whereas some biological systems such as the firefly
reaction have efficiencies approaching unity (3).
From an instrumental standpoint, chemiluminescence
shares many of the desirable characteristics of
fluorescence. With chemiluminescence, one measures a
small signal against an essentially zero background, as
opposed to trying to observe a small decrease in a very
large background as is the case with absorption. This
feature eliminates the need for dual beam instrumentation
and synchronous detection systems. In chemiluminescence
the exciting reaction is fairly specific, which usually.
results in a single emitting species, therefore, there is
little need to discriminate wavelengths. This eliminates
the need for an emission monochromator, which not only
simplifies the instrumentation but also increases the
3
overall light throughput to the detector. As a result
chemiluminescent instrumentation tends to be simple,
inexpensive and yet capable of very good sensitivity.
The luminol reaction can regularly achieve detection -9 -10 limits in the 10 to 10 M range when analyzing for
metal ions such as Fe(II) and Cr(III) and oxidants such as
( 3) • The firefly reaction, which is most
often used for the determination of ATP, has been able to -12 -11 detect concentrations of ATP in the lxlO M to lxlO M
range ( 3).
One of the major disadvantages of chemiluminescent
analyses, especially with luminol, has been low
selectivity. In an attempt to overcome this problem
chemiluminlent reactions have been used as a detector for
much more specific reactions, namely various enzyme
reactions. With the mating of two such reactions one
still maintains the instrumental simplicity and
sensitivity of traditional chemiluminescence and gains the
considerable selectivity of the enzyme for its substrate.
The bioluminescent reactions, such as that of the firefly,
are naturally enzyme/substrate reactions and already
possess an inherent selectivity.
Because a large number of these biochemical
reactions, which can be followed by chemiluminescence, are
also of considerable clinical importance, it is in this
4
field that mo:.t of th·e act.i ve research on chemiluminescent
analysis is taking place.
Radio immunoassay is an important clinical technique,
however, this method is receiving considerable criticism
due to its environmental and safety impact. Various
substitutes for this technique have been suggested,
fluorescence immunoassay being the one most well
developed. However, chemiluminescence immunoassay is
actively being studied as a more sensitive alternative to
the fluorescence technique (4).
An interesting alternative use of chemiluminescence
suggested by Freeman and Seitz was the immobilization of a
chemiluminescent system on to the end of a fiber optic
bundle to yield a substrate specific optical probe which
could be used in much the sama way as an ion specific
electrode (5). Before such a device could ever be made
practical, a chemiluminescent system would have to be
found that does not destroy the luminescing reagent, so
that a constant fresh supply of this reagent was not
necessary.
Cilento et. al. described a biochemical reaction
which is luminescent and which appears to regenerate the
luminescing species (6). If this is indeed the case it
may serve as a starting point in the development of an
optical probe similar to that proposed by Freeman and

5
Seitz. In this light, the goal of this research is to
investigate the reaction described by Cilento to determine
if the luminescing species is indeed recycling and if so
to determine the analytical applicability of the reaction.
HISTORICAL
In 1928 H. 0. Albrecht discovered that strong
chemiluminescence could be obtained from certain
cyclohydrazides in alkaline solution in the presence of
various oxidizing agents (2). The most notable of these
was 3-aminophthalic hydrazide, which could yield visible
luminescence at concentrations as low as 10-BM when both
hydrogen peroxide and ferricyanide were included. Because
of its uniquely high quantum efficiency this particular
molecule received considerable attention, and it quickly
developed the common name of "luminol". Luminol still
remains, even today, one of the most efficient
chemiluminescing molecules, outside of a few of the
naturally occurring bioluminescent compounds.
Since Albrecht's time the reactions of luminol have
been studied extensively and a large number of analytical
applications have been developed around them. Each one of
the basic components of the luminol reaction:
Mn+ luminol + H2o2 -----> 3-aminophthalic acid + N2 + light (ZJ
has been exploited for analytical purposes. It has been
discovered that there are a considerable number of
transition metals, such as Cu, Fe, Co and Cr, which can be
used to catalyze this reaction. By maintaining an excess
6

7
of the other reagents, it has been found that the light
intensity is proportional to the metal ion concentration.
While the luminol reaction provides a very simple,
sensitive method for the determination of these metals it
lacks the selectivity needed for such things as ground
water samples.
A number of unique solutions to this problem have
been employed in order to make the luminol reaction a
viable tool. Seitz, Suydam and Hercules described a
technique for the quantitation of Cr(III) which relied
upon the fact that the rate of complexing with EDTA was
considerably slower for Cr(III) than for the other
interfering ions (7). Another analytical scheme, also
described by Seitz and Hercules, relied upon the fact that
chemiluminescence could be catalyzed by Fe(II) in the
absence of H2o2 (8). In this particular instance
dissolved oxygen acted as the oxidant. This concept has
been extended t.o the quantitation of hemoglobin and other
hemoproteins in serum samples (9).
Another avenue of active investigation has been the
use of the luminol reaction for the determination of
oxidants, in particular H2o2 . A continuous flow system
for the determination of H2o2 in natural water has been
based on an excess ot luminol and potassium ferricyanide
as the catalyst (10). This particular device could

8
routinely determine concentrations of hydrogen peroxide -7 down to 6x10 M.
Some of the most promising work, utilizing the
detection of HZOZ' has been in the area of indirect
determinations. That is, to use the luminol reaction as a
sensor for hydrogen peroxide, which itself is the product
of some other primary reaction. The most successful
applications of this concept have been with biochemical
reactions where an enzyme/substrate reaction yields H2o2 .
A widely studied example has been the determination of
glucose with glucose oxidase.
glucose + Oz
glucose oxidase
+ H2o ---------> gluconic acid + HZOZ 3-
Fe ( CN) 6 ----------> 3-aminophthalic acid + NZ + light
[3]
[4]
The coupling of the luminol reaction to biochemical
reactions introduces another series of logistic problems.
The most important of these is a mismatch in the optimum
pH for the two consecutive reactions. Most of the
biochemical reactions have pH optima around pH 7 while the
luminol reaction runs most efficiently in the pH 11-1Z
range. Auses, Cook and Maloy overcame this problem by
employing a pH jump technique (11). In their system the
glucose was oxidized in an unbuffered, pH 7,
9
enzyme/luminol solution. At measurement time this ~solution was then mixed with a strongly buffered Fe(CN)~~
0
solution. This technique was carried one step further by
Bobstick and Hercules (12). Here a continuous flow system
was designed where the glucose sample was carried through
a column of immobilized glucose oxidase and the effluent
was mixed with a luminol/Fe(CN) 63- stream in front of the
detector. This particular system gave excellent results -8 -4 for glucose concentrations in the range of 10 M to 10 M.
A totally different approach to the application of
coupled chemiluminescent reactions has been to carry them
out, not entirely in solution, but at a solid liquid
interface. These interfaces have taken various forms
including filtration gels, hydrated membranes and glass
rods (13,14,15). In almost all cases they involve the
immobilization of one or more enzymes onto the solid
surface and applying an analyte solution.
Lippman has described a solid-phase chemiluminescent
system for the analysis of thiols (16). His technique
entailed the covalent binding of a derivatized luminol to
a polysaccharide by means of a disulphide bridge. When a
sample solution containing another thiol or other strong
nucleophile was eluted through the polysaccharide a
sulphide exchange reaction would take place, releasing the
bound luminol. The eluted luminol would then be mixed

10
with H2o? and ferricyanide to yield the chemiluminescence. ~
Ikariyama, Aizawa and Suzuki demonstrated luminous
membranes which consisted of an inert protein, such as
albumin, cross linked with glutaraldehyde (14). Both
glucose oxidase and peroxidase were also co-immobilized in
this membrane. When an aqueous solution of glucose and
luminol was applied, chemiluminescence could be detected
at the membrane surf ace. The membrane concept has been
extended by Vogelhut to a fully self-contained analytical
unit employing the enzymes to produce H2o2 , a
chemiluminescent reagent such as luminol, peroxidase to
catalyze the chemiluminescent reaction and a
photosensitive detector layer (17).
An alternative to the membrane idea has been to
immobilize the luminescence generating enzymes on the end
of a light guide such as a glass rod or fiber optic
bundle. Lee, Jablonski and DeLuca immobilized firefly
luciferase to glass beads which were then cemented to the
end of glass rods (15). These rods would then be dipped
into a cell containing ATP, luciferase and Mgz+ ions to
yield chemiluminescence which was proportional to the ATP
concentration. Freeman and Seitz, on the other hand,
immobilized peroxidase and luminol in a polyacrylamide gel
which they held to the end of a fiber optic bundle by
means of a fine nylon mesh (5). When this probe was
11
dipped into a beaker containing H2o2 a steady state signal
proportional to peroxide concentration was observed. The
main limitation encountered with this detector was the
depletion of luminol at the reaction site. To compensate
somewhat for this depletion, luminol had to be added to
each sample solution.
One common characteristic of all the previously
described chemiluminescent applications is that the actual
luminescing reagent was not reuseable. While this may not
be an important criterion for some of the applications, it
would be highly desirable in such instances as the
luminous membranes and light guide detectors. Ideally,
one would like a luminescent reaction in which the
luminescing species would be left intact after emission so
that it could be reexcited by another analyte molecule.
The type of reaction which comes to mind is that of a
reversible electron transfer where the luminescent species
is first oxidized and subsequently reduced, but where the
reduced form is electronically excited and then
fluoresces.
Cilento et. al. described observing luminescence from
the oxidation of NADH by peroxidase when using eosin as
the catalyzing phenol (6). It has been known from the
early 1960's that this oxidation could be accelerated by
the addition of certain phenols (18,19,20). Cilento's

12
group postulated that if a large conjugated phenol, such
as eosin, were used, they might affect electron transfer
into an unoccupied molecular orbital which would result in
subsequent fluorescence. If this is indeed happening, the
reaction would satisfy the basic requirement for a
reuseable luminescing species.

INSTRUMENTATION
Manual Luminometer
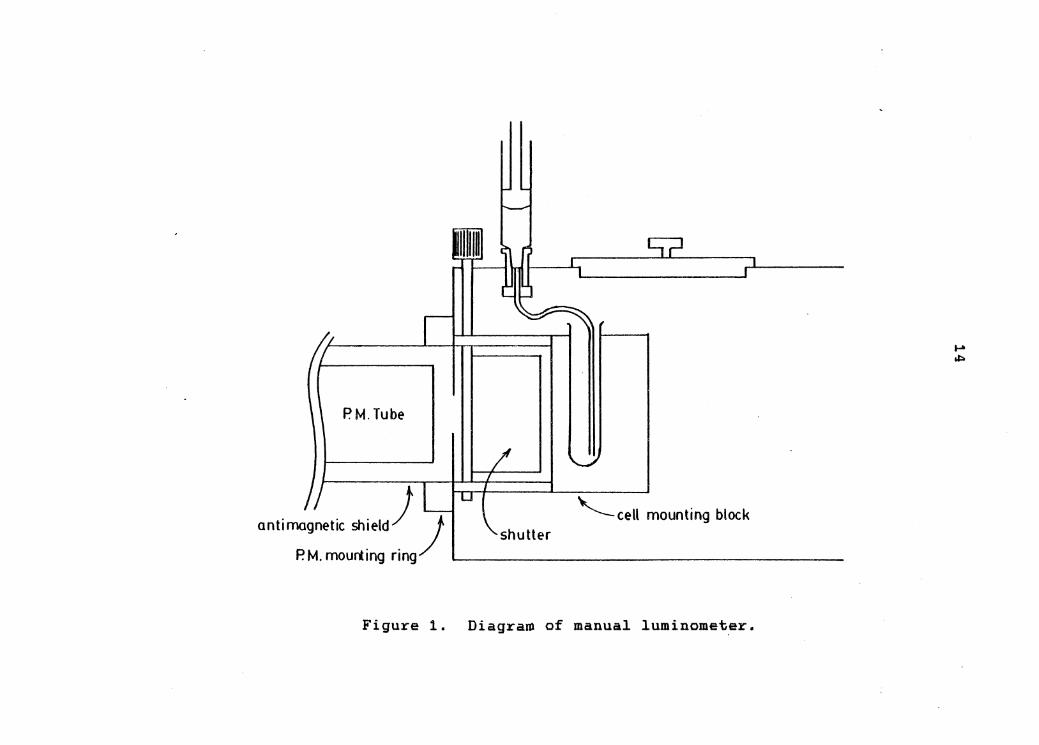
The initial luminometer design was a relatively
simple one, built along the lines of that described by
Arrio et. al. (21). It is illustrated in figure 1. The
instrument consists of a sealed aluminum bo~ with an
exterior, end on photomultiplier housing mounted flush
with a 1 inch diameter hole cut in the end of the box. A
four inch square hole was cut in the top of the box to
provide access to the interior. This hole was sealed with
the cell compartment cover from a Heath EU-701 UV/Visible
spectrometer.
A manually operated shutter, again from the Heath
EU-701, was interposed between the detector and the cell
holder. The state of the shutter could be sensed by means
of a microswitch which was positioned to close whenever
the shutter was opened. The cell consisted of a 10 mm x
75 mm glass test tube which was secured to the shutter
housing by a machined plastic block. Sample injections
were made with a manually operated syringe'through a short
length of 1 mm teflon tubing which was brought to the
exterior of the box by means of a chassis mounted Luer
fitting. While this luminometer design suffered from
13
PM. Tube
antimagnetic shield)) P.M.mourting ring ...__ __________________ _
'-cell mounting block shutter
Figure 1. Diagra~ of manual luminometer.
..... ii:.
15
lower reproducibility, which was due to the manual
injection technique, it did provide flexible adjustment of
reaction conditions.
Automated Luminometer
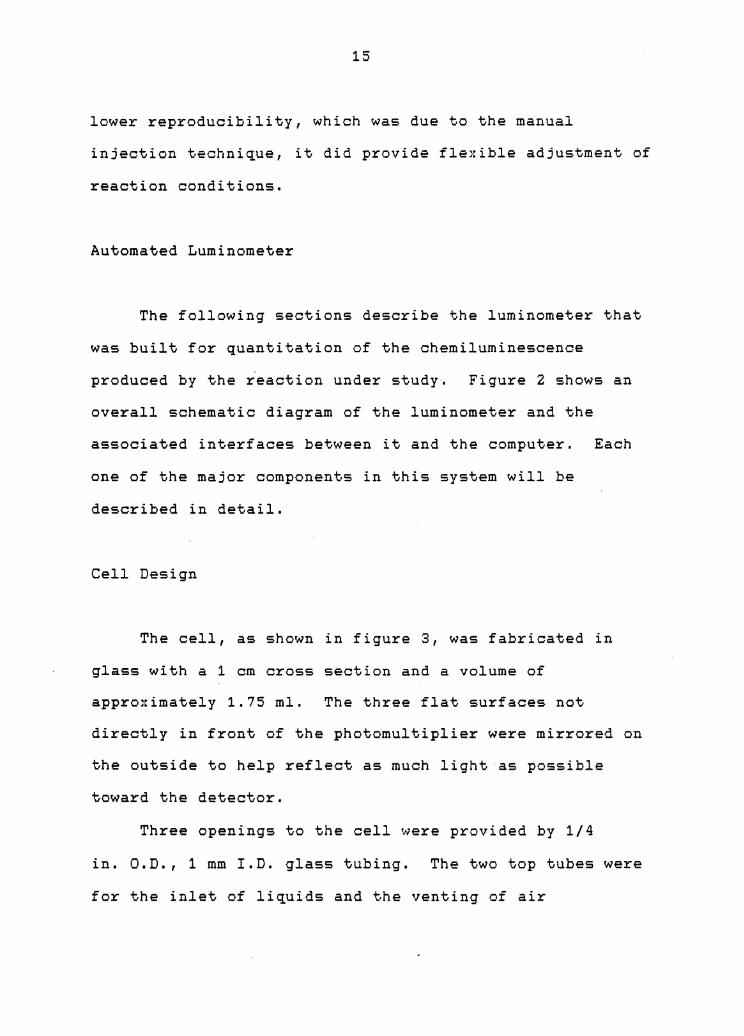
The following sections describe the luminometer that
was built for quantitation of the chemiluminescence
produced by the reaction under study. Figure 2 shows an
overall schematic diagram of the luminometer and the
associated interfaces between it and the computer. Each
one of the major components in this system will be
described in detail.
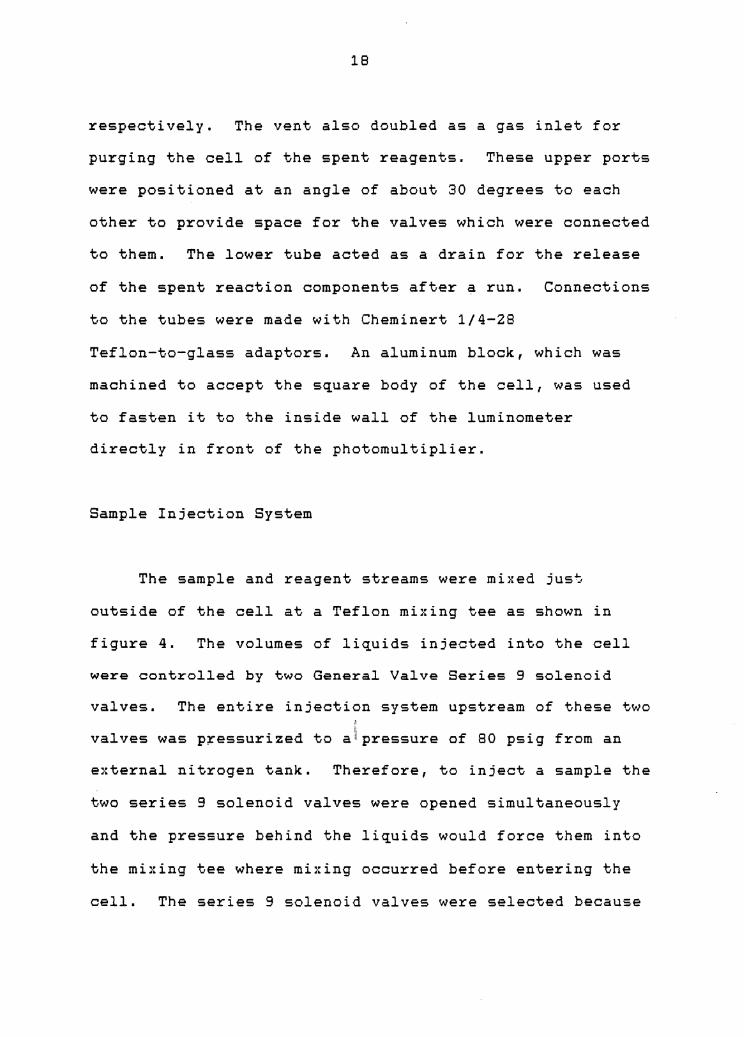
Cell Design
The cell, as shown in figure 3, was fabricated in
glass with a 1 cm cross section and a volume of
approximately 1.75 ml. The three flat surfaces not
directly in front of the photomultiplier were mirrored on
the outside to help reflect as much light as possible
toward the detector.
Three openings to the cell were provided by 1/4
in. O.D., 1 mm I.D. glass tubing. The two top tubes were
for the inlet of liquids and t,he venting of air

clocks
p 0 solenoid a u -- r t -- drive a --- p - I -
111
u - interface -1 t
c p c I pc e
I 0 n u 3 l mixing a -- r n -- u t -- I n ~ valves - p -- n e s ~ t H det. D p a - t r e 1 r - I u ---J. f. cell sample' -t e n o l. r g n. loop ,. u
heaters '"': D Jx fan 1-:
- A - oscilloscope l uminometer - c -- s -y -
Figure 2. Diagram of automated luminometer.
~ '
sample loop
control I
temp. control
....... Ol

~ E u
LO .....
17
Figure 3. Luminometer cell design.
18
respectively. The vent also doubled as a gas inlet for
purging the cell of the spent reagents. These upper ports
were positioned at an angle of about 30 degrees to each
other to provide space for the valves which were connected
to them. The lower tube acted as a drain for the release
of the spent reaction components after a run. Connections
to the tubes were made with Cheminert 1/4-28
Teflon-to-glass adaptors. An aluminum block, which was
machined to accept the square body of the cell, was used
to fasten it to the inside wall of the luminometer
directly in front of the photomultiplier.
Sample Injection System
The sample and reagent streams were mixed jus~
outside of the cell at a Teflon mixing tee as shown in
figure 4. The volumes of liquids injected into the cell
were controlled by two General Valve Series 9 solenoid
valves. The entire injection system upstream of these two ' I
valves was p~essurized to al pressure of 80 psig from an
external nitrogen tank. Therefore, to inject a sample the
two series 9 solenoid valves were opened simultaneously
and the pressure behind the liquids would force them into
the mixing tee where mixing occurred before entering the
cell. The series 9 solenoid valves were selected because

t vent
~
,_ ___ Nitrogen (BOpsig)
}-----------+---- peroxidase/eosin/Mn2• acetate buffer (80psig)
~ . ' xe__::;,-..,...., _____ acetate butter (BO ps1g)
cell
----------- to waste_.,..
Figure 4. Schematic diagram of automated injection system.
...... l.O

20
they have an open/close cycle time of 2 ms which gives
very good control over the volume of liquid injected.
The volume of sample actually injected into the cell
was controlled by a pnuematically actuated chromatographic
sample loop with a 0.5 mL volume. The contents of this
loop was flushed into the cell with a stream of acetate
buffer. The volume of the reagent stream injected was
simply controlled by the amount of time for which its
injection valve was left open. This was calibrated to
give 0.5 mL of reagent per run.
Calibration of Injection System
To verify that the series 9 solenoid valves gave an
injection volume that was linear with respect to
open-time, and to develop the associated calibration
curves, various volumes of liquid were inject.ed into a
glass weighing bottle and weighed on an analytical
balance. The mass of the injected liquid, which is
proportional to the injected volume, was then plotted
against the valve open-time to give the calibration curves
in figure 5. The regression line for the reagent curve
is: Y = 1.06xlo-Z + 1.34xlo-3x; z r = 0.9999; s = y}: ~ -3 3. 15x10 . For the sample curve the regression line is:
-3 -3 Y = 1.7Zx10 + 1.Z6x10 X; r 2 = 0.9994; C - n .-, .. 10-3 ._; - ~ 8 ~.it. I yx

1. 4l / /
/r/ 1. 2
/ / 1.0t / /
~ " r-t e 0.e v
I // ~ 0.6t N
/ .....
0.4+ ~ D Reagent valve
121.2+ /r A Sample valve
,_:/ IA"
0. 121 121 1'!1121 2121121 31210 4121121 5121121 61210 70121 81210 90121 1'!11210 11'110 120121
Time (h'la)
Figure 5. Calibration curves for injection valves.
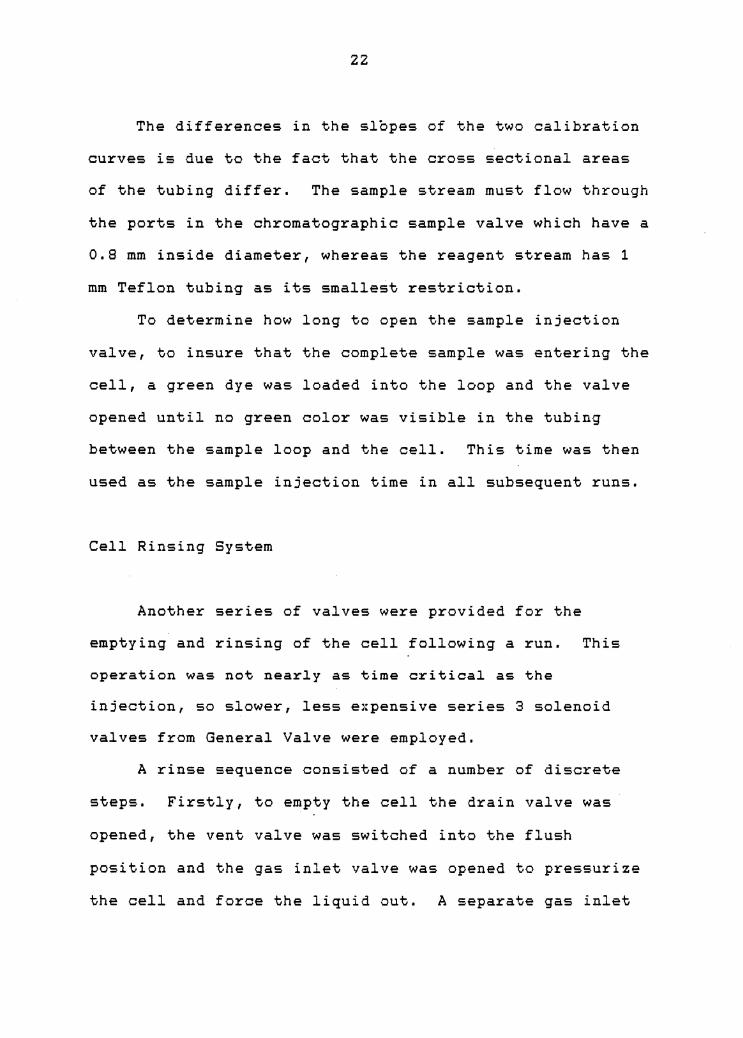
22
The differences in the slopes of the two calibration
curves is due to the fact that the cross sectional areas
of the tubing differ. The sample stream must flow through
the ports in the chromatographic sample valve which have a
0.8 mm inside diameter, whereas the reagent stream has 1
mm Teflon tubing as its smallest restriction.
To determine how long to open the sample injection
valve, to insure that the complete sample was entering the
cell, a green dye was loaded into the loop and the valve
opened until no green color was visible in the tubing
between the sample loop and the cell. This time was then
used as the sample injection time in all subsequent runs.
Cell Rinsing System
Another series of valves were provided for the
emptying and rinsing of the cell following a run. This
operation was not nearly as time critical as the
injection, so slower, less expensive series 3 solenoid
valves from General Valve were employed.
A rinse sequence consisted of a number of discrete
steps. Firstly, to empty the cell the drain valve was
opened, the vent valve was switched into the flush
position and the gas inlet valve was opened to pressurize
the cell and force the liquid out. A separate gas inlet

23
valve was found to be necessary because the three way vent
valve would not hold the 80 psig. while in the vent
position. Secondly, the cell was rinsed with acetate
buffer by switching the sample loop into the load position
and opening the sample injection valve to fill the cell
with buffer. This charge of buffer was then flushed out
using the ~rocedure described above. Finally, the last
remaining liquid in the cell was blown out with nitrogen
by opening the gas inlet valve again for several seconds.
The drain valve was closed and the vent valve switched
back into the vent position ready for the next injection.
Valve Control Interface
The control of the solenoid valves from the computer
required its own interface, shown in figure 6, because the
TTL outputs from the parallel port cannot supply the
current needed to energize the solenoids. At 12 VDC the
Series 3 valves draw about ZOO mA and the Series 9 valves
draw about 750 mA. The TTL circuitry associated with each
output bit of the parallel port is only capable of
supplying 1.6 mA.
Each of the Series 3 valves was driven with a 75152
core memory driver. This 8 pin chip takes a TTL input and
is capable of switching up to 300 mA with its transisitor

24
·12V G.V. Series 9 •12V Parallel Output 2.2K Bit
0
2
4
9
- G.V.Series 9
7407 2.2K
:- G.V. Series 3
75452
•12V -I -
G. V. Series J
G. V. Series 3
7407 :. 2.2K I I ---C>>-·-1f._2V-----1L_;!_t_~~-r-~t"~b
7407 ~2.2K 1
n C> f ::~;.~ 6~
- >-'------~-relay . ..i'"---t"-"'·~ clockD ~ --
Figure 6. Schematic of solanoid valve interface.

25
output.
The Series 9 valves were switched with Silconix VN46
VMOS field effect transistors. Ideally, these FETs should
allow the direct interfacing of TTL circuitry to high
current devices drawing as much as ZA at lZ VDC. In this
case, however, the power available from an individual
output bit of the parallel port was not sufficient to
saturate the gate of these devices, thus preventing them
from switching enough current to open the Series 9 valves.
This problem was cured by driving the gate of the FET with
a 7407 open collector driver.
The nitrogen supply required to actuate the sample
loop was also controlled by two output bits from the
parallel port. The pneumatic pressure was actually
switched by a pair of 1~0 VDC solenoid valves. The. 100
VAC, which is rectified to 110 VDC, is switched by a pair
of solid state relays. These solid state relays can be
activated by the TTL signals from the parallel port.
However, since they were located approximately three feet
from the computer, it was decided to insert 7407 open
collector drivers between the parallel port and the solid
state relays.

26
Temperature Control
In kinetically controlled systems it is essential to
maintain a constant temperature to ensure consistent
reaction rates. Ambient temperature variations throughout
the course of a year were sufficient to warrant the design
and construction of a temperature control system for the
luminometer. A temperature of 35°c was chosen as the
temperature to be maintained, as it was unlikely that
indoor ambient temperatures would ever exceed this value.
Since a single temperature was to be maintained
throughout, it was not considered necessary to use
computer control. A commercially available controller,
RFL Industries (Boonton, NJ) model 72A with a model
27687-3 thermister, was installed. In addition to the
controller a heating source and a circulating fan was
necessary. To conserve space inside the luminometer, a
commercial hair dryer was modified to provide both of
these required components. As manufactured the hair dryer
fan is wired in parallel with one of the heating elements
which means that the heaters must be on to run the fan.
Before it could be used the fan had to be separated from
the heater circuit to allow th~ fan to be run
continuously; the heating elements could then be switched

27
on and off, as necessary, by the temperature controller.
Figure 7 shows a schematic of the hair dryer circuit
before modification. The motor is a 24 VDC type. The 24
VDC is achieved by using the three heating elements as a
voltage divider and tapping off across the smallest
element and feeding it to a bridge rectifier which in turn
drives the motor. To provide separate fan control the
input leads to the rectifier were clipped and connected to
a separate AC supply through a step-down transformer.
Variable fan speeds were achieved by means of a
HEXACON soldering iron controller. This is a silicon
controlled rectifier based device which simply transmits
varying fractions of the AC sine wave through to its load
to control the amount of power delivered. To provide a
safeguard against the possibility of turning the heaters
on without the fan running, a small amount of the 12 VAC
voltage from the step down transformer was tapped off and
rectified to 5 VDC. This DC potential switched a solid
state relay which in turn switched the main AC supply for
the RFL controller. If the fan is not running, na voltage
is available to close the solid state relay and thus no
power is available to the heating elements.

Clip leads and add a external, variable, AC supply. 20.n.
24.!l
28
an
I
-----a: 1200W 60QWq
0 300W
thermal fuse
bi metal switch
Figure 7. Schema~ic of hair dryer circui~.

29
Detector System
The detector used for the measurement of the
luminescent intensity was an RCA (Lancaster,PA} 8575
photomultiplier housed in an Ortec (Oak Ridge, TN) model
265 photomultiplier base. The high voltage supply for
this base was from as Ortec (Oak Ridge, TN) model 456
power supply which provided -2500 VDC to the cathode of
the photomultiplier.
Current pulses at the photomultiplier anode, which
result from the amplification of photoelectrons emitted
from the photocathode, are converted into voltage pulses
by an Ortec (Oak Ridge, TN) model 113 Preamplifier.
These discrete voltage pulses are then further shaped
by an Ortec (Oak Ridge, TN) model 460 delay line
amplifier. This amplifier narrows the incoming pulses by
differentiating the input signal. A very sharp positive
output spike is produced for the leading edge of the input
pulse and a negative spike is produced for the trailing
edge of the input pulse.
The amplitude of the output spikes coming from the
delay line amplifier are then compared with an upper and a
lower threshold voltage by an Ortec (Oak Ridge, TN} model
406A Single Channel Analyzer. The lower threshold voltage

30
is used to discriminate against small pulses which result
from thermionic emision of electrons from one of the
dynodes rather than the photocathode. These thermally
produced electrons result in smaller output pulses at the
anode because they undergo fewer stages of amplification
than true photoelectrons from the photocathode. The upper
threshold is used to discriminate against very large anode
pulses which result, not from a photoelectric event at the
photocathode, but from radioactive decay of trace
radionuclides in the photocathode material. Therefore, to
prevent being rejected, an anode pulse must be of
sufficient amplitude to exceed the lower threshold
voltage, but not be so intense as to also exceed the upper
threshold value. For each input pulse which meets these
requirements the single channel analyzer outputs a very
narrow, TTL level square wave pulse which is then
transmitted to a digitial counter.
The counter used in this detector is an Ortec (Oak
Ridge, Tn) model 707 Buffer Scaler which is a decimal
counter with a counting range from 0 to 999,999. It is a
buffered counter, in that it contains a memory register to
which the current count is transferred whenever it
receives a reset signal. This permits a very small dead
time, about 5 microseconds, between the initiation of a
readout sequence and the resumption of counting. Once a
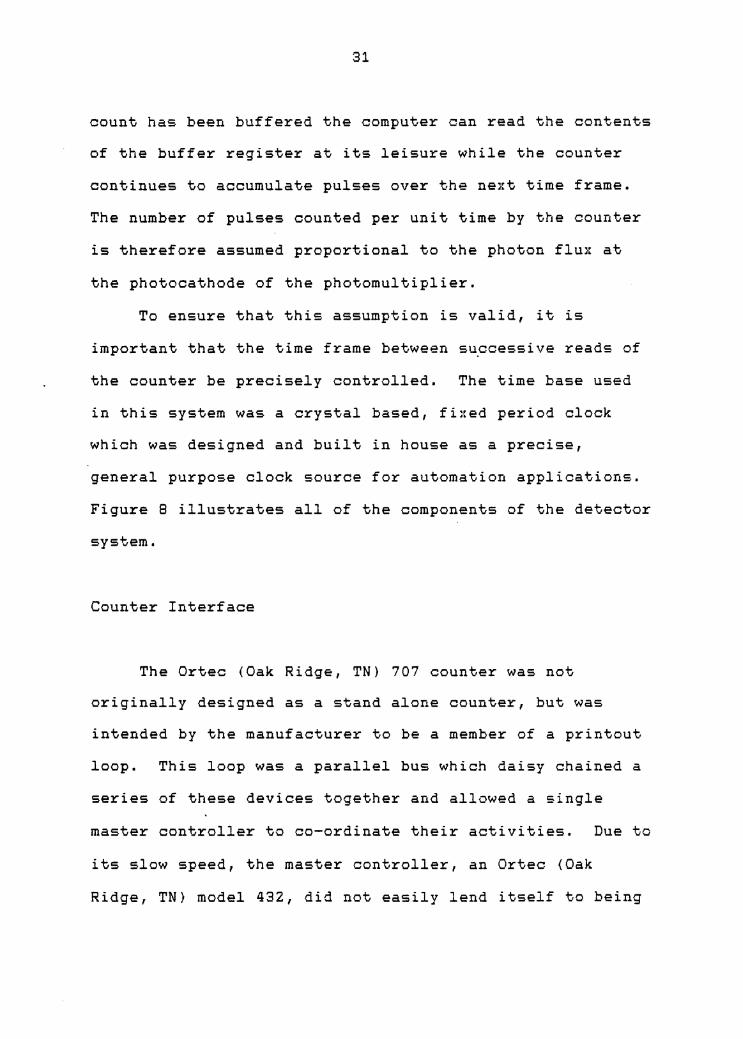
31
count has been buffered the computer can read the contents
of the buffer register at its leisure while the counter
continues to accumulate pulses over the next time frame.
The number of pulses counted per unit time by the counter
is therefore assumed proportional to the photon flux at
the photocathode of the photomultiplier.
To ensure that this assumption is valid, it is
important that the time frame between successive reads of
the counter be precisely controlled. The time base used
in this system was a crystal based, fixed period clock
which was designed and built in house as a precise,
general purpose clock source for automation applications.
Figure 8 illustrates all of the components of the detector
system.
Counter Interface
The Ortec (Oak Ridge, TN} 707 counter was not
originally designed as a stand alone counter, but was
intended by the manufacturer to be a member of a printout
loop. This loop was a parallel bus which daisy chained a
series of these devices together and allowed a single
master controller to co-ordinate their activities. Due to
its slow speed, the master controller, an Ortec (Oak
Ridge, TN} model 432, did not easily lend itself to being

T PMT
I/V
Figure 8.
_]\__ 1r Pulse Shaping
Amplifier
Time Base
1 Discriminator
_s-t_
Schematic of pulse counting detector.
Counter
(J) N
33
interfaced to a computer for rapid read out of the
counter. Therefore, the printer loop and controller were
replaced with a parallel interface which directly linked
the counter and the computer's parallel port. This
interface had to emulate those signals which were normally
sent by the controller to the counter and had to be able
to receive the accumulated count transmitted back by the
counter.
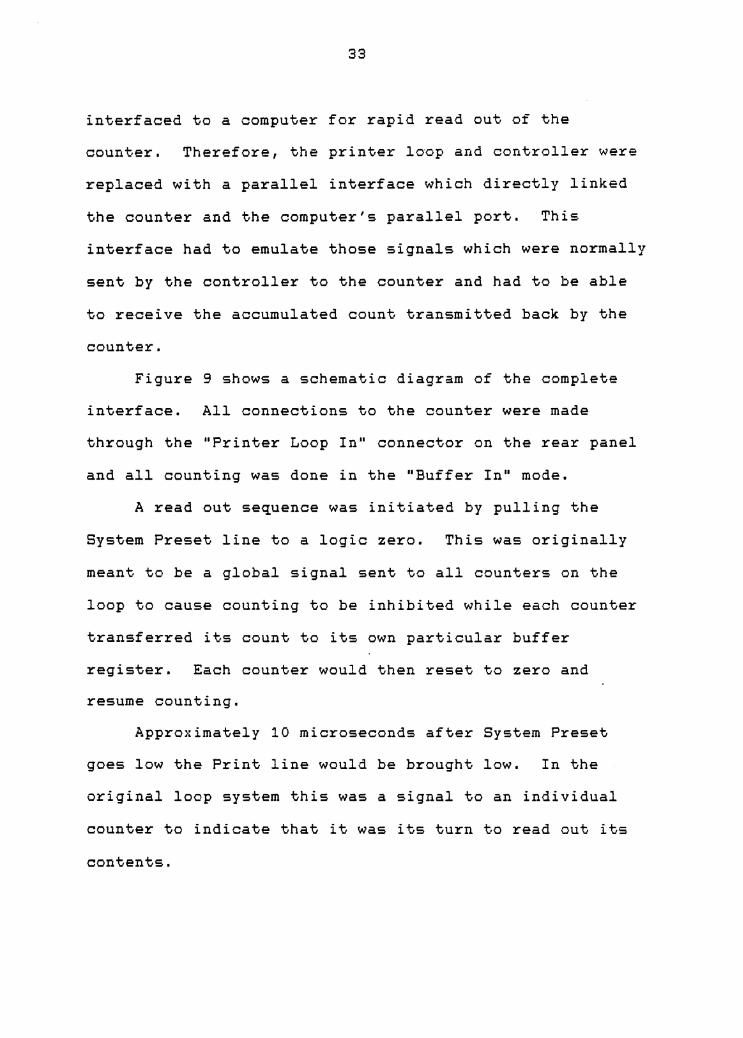
Figure 9 shows a schematic diagram of the complete
interface. All connections to the counter were made
through the "Printer Loop In" connector on the rear panel
and all counting was done in the "Buffer In" mode.
A read out sequence was initiated by pulling the
System Preset line to a logic zero. This was originally
meant to be a global signal sent to all counters on the
loop to cause counting to be inhibited while each counter
transferred its count to its own particular buffer
register. Each counter would then reset to zero and
resume counting.
Approximately 10 microseconds after System Preset
goes low the Print line would be brought low. In the
original loop system this was a signal to an individual
counter to indicate that it was its turn to read out its
contents.

c s R
N
p
u T
PARALLEL BOARD
CSR 0
REQ B
DXMT ~
3 2 1 0
1000p~rnK
B 7 4 1 2
* A 3 Q
100~~20K
..... B 7 •SY-4 1 2
IIA 3 a
T
34
7400
•SY-
D 7 Q .._
l, 7
elk l, cir ~
D ~ 7 4 7
ORTEC 707 "PRINTER LOOP IN"
PRESET 9
PRINT 5
elk 4 Q -c!r y l 11
START DATA 7 XFER
lOOOr~
7 4 1 2
......- A 3 Q PRINT 6 ADV.
L. 3 2 1
Figure 9. Schematic of digital counter interface.
35
The individual digits of the count are strobed out to
the data lines serially as four bit, parallel, binary
coded decimal numbers. The most significant digit of the
count ~s gated onto the data lines when the Start Data
Transfer line is asserted high, approximately 45
microseconds after Print goes low. This signal, like
Print remains asserted until the completion of the read
out sequence.
As each digit is read in through the parallel port
the resulting DXMT pulse is stretched to a width of 5
microseconds, inverted and fed into the Print Advance
input on the counter. Each time a Print Advance pulse is
, received the nex·t digit in sequence is strobed onto the
data lines. This process continues until all six digits
have been read, at which time the Preset signal is
released. The release of the Preset line causes the Print
and Start Data Transfer signals to also be released, thus
terminating the read out sequence.
Software
The Software used for the real time control of the
luminometer and for the data acquisition made use of the
multitasking capabilities of the polyFORTH (FORTH Inc.,
Hermosa Beach, CA) operating system. While all of the

36
software could have been incorporated into a single
program it was decided, for the sake of ease of
programming and maintainability, to break each one of the
distinguishable jobs up into separate programs or tasks
which would run concurrently.
Data Acquisition Task
The data acquisition task has two major functions.
Firstly, the reading of counts from the pulse counting
system at precise intervals and secondly the control of
the valve actuation task. The less time critical portions
are handled by a high level FORTH definition ACQUIRE,
defined in block 309, which is the main definition used by
the operator. ACQUIRE begins by turning on the pulse
counting clock and counter, waits for counts and stores
them in a data array as they arrive. After 60 counts have
been received it instructs the valve control task to
inject the sample and then continues to receive counts at
the prescribed rate. When all of the data for a
particular run has been collected, ACQUIRE disables the
pulse counting system and instructs the valve control task
to rinse the cell in readiness for the next run.
In a multiprogramming environment such as polyFORTH,
the only way to to insure that the software reacts
37
immediately to an external event is to have that event
cause a processor interrupt and have all time critical
processing done by the interrupt service routine. The
crystal based, fixed period clock, used for the pulse
counting interval, interrupts the processor at a frequency
of 10 hertz. Since the required data acquisition
frequency is 5 hertz, data is only taken on every other
interrupt.
Immediately upon entry to the interrupt service
routine for this clock, defined in blocks 303 to 307, the
software initiates a read out sequence by setting CSRO.
The service routine then waits for the counter interface
to respond with a Start Data Transfer signal and then
begins to read in the sequential digits of the count.
These binary coded decimal digits are assembled into a
single 32 bit binary integer on the parameter stack before
being passed back to the data acquisition task.
Since this value is to be passed back to the high
level definition ACQUIRE, some care must be taken to
insure that it is placed on ACQUIRE's parameter stack.
When an asynchronous interrupt occurs in this type of
operating system it is not possible to predict which task
will be interrupted. Therefore, the interrupt service
routine has to locate its calling task and then locate the
parameter stack of that task before depositing the value

38
read from the counter. This particular operation is
carried out by the code in lines 10 to 14 of block 303.
Valve Control Task
Throughout the operation of the luminometer all of
the volumes of liquids injected are controlled by the
amount of time the valves are open. The open time of the
valves is controlled by software. Again to insure
reproducible injection volumes this software has to be
synchronized to a precise clock source. In one instance,
the mixing of the sample stream with the reagent stream,
two valves have to be open simultaneously but for
different lengths of time. Therefore, two fixed period
clocks are used by the valve control software. These two
clocks are run at a relatively high frequency, 1000 Hz, to
allow higher resolution of the volumes injected.
The valve control task consists of two time critical
interrupt service routines, defined in blocks 313 and 314,
which actually control the opening and closing of the
valves. A number of less time critical high level
definitions tell these routines which valves to open and
for how long. A more detailed description of these high
level definitions can be found in Appendix A.
39
Oscilloscope Display Task
A real time display of the raw data, as it is being
acquired, is provided by a third task, defined in block
308. Being the least time critical, this task is not
controlled by one of the fixed period clocks, but by the
60 Hz day clock.
The oscilloscope is operated in XY mode with one of
the system's DACs connected to the vertical amplifier and
the other DAC connected to the horizontal amplifier.
After every third tick of the day clock the display task
scans a single copy of the whole data array out to the
vertical DAC while a constant voltage ramp is
simultaneously scanned out to the horizontal DAC. This
has the effect of producing a constantly updating XY
display of the data set as it is being acquired.
Since the DACs only have a resolution of 2048 in the
positive direction the display will begin to wrap around
as the peaks exceed this limit. To help alleviate this
problem the definition 1SCAN scales the data as it is
being scanned out to the vertical DAC. After scaling the
display will not wrap around unless a peak exceeds a value
of 32,767.
40
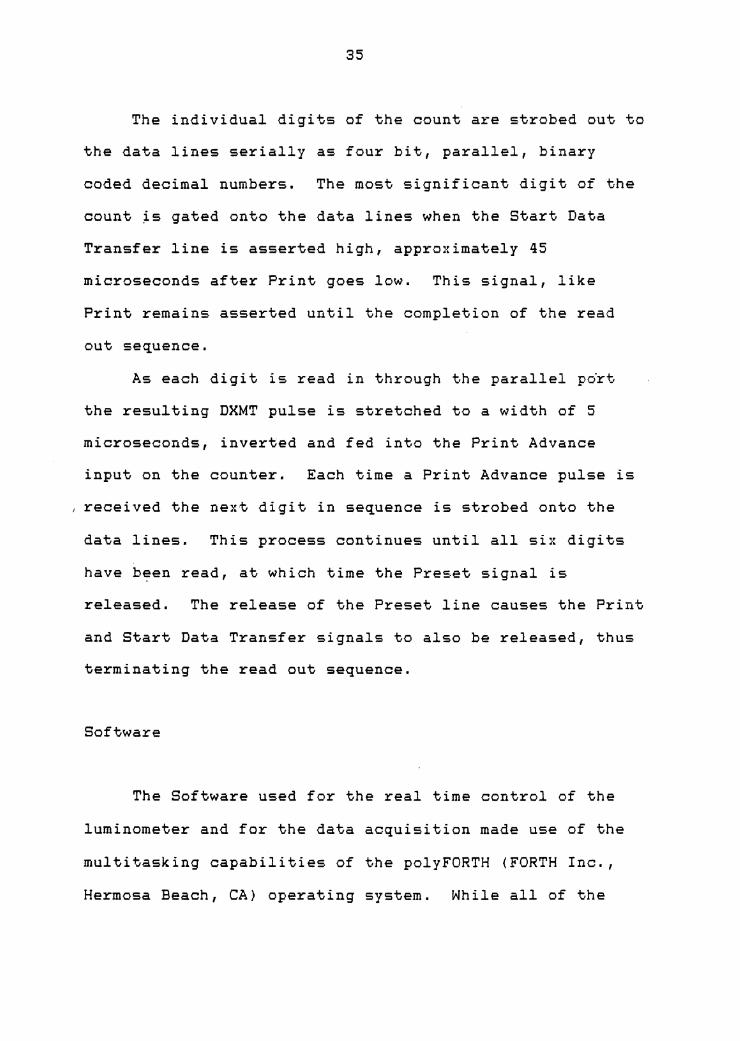
Peak Processing
The total area of the luminescence peak represents
the total light output which should be directly
proportional to the concentration of the analyte of
interest. However, as can be seen from figure 10, the
luminescence peaks tail very badly. The trailing edge's
very gradual approach to the baseline, combined with the
inherent noise of the system, rendered the peak picking
software quite unreliable in its ability to pick a
consistent end of peak. As a result, the integrated peak
areas were quite unreliable.
It became apparent, however, that the peak heights
were giving a value proportional to analyte concentration
that was reproducible. As previously described, 60
baseline data values were taken before the the sample and
reagent streams were mixed. These 60 values were then
averaged to give a mean baseline which was subsequently
subtracted from the maximum value in the data set to yield
the peak height. The background was sampled just prior to
an injection to allow the maximum possible time for the
baseline to have stabilize following the previous
injection. The code to calculate the peak heights is
listed in block 325.

35000 -0) e 30000
l'Sl l'Sl N
' ID 25000 -" c J 0 u 20000 '-J
>-. -"
15000 I I \ .... I .,,, 0)
..... c GI
-" ( ...... 10000
5000
10 212J 30 40 50 Time (eao)
Figure 10. Typical chemiluminescence peak profile.

EXPERIMENTAL
The goal of this section is to determine if
variations in the reaction conditions will provide an
enhancement in the analytical signal. As can be seen from
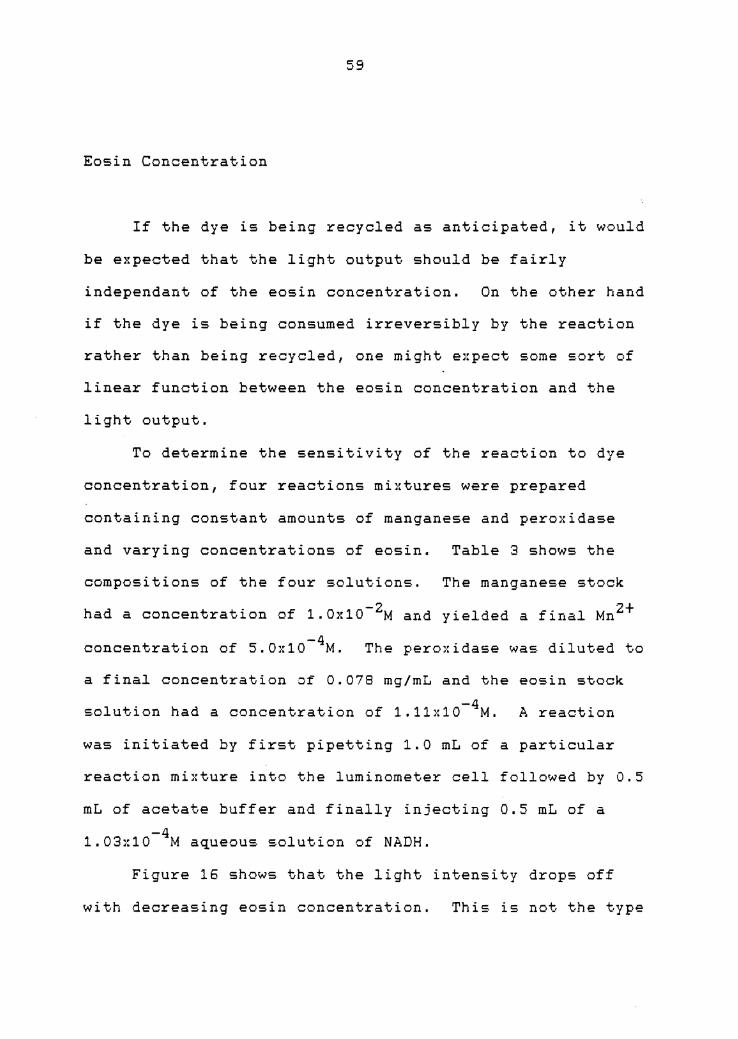
figure 20 (page 70) the chemiluminescent system under
study does yield a linear relationship between the
observed light output and the concentration of NADH being
oxidized. When this particular reaction was reported by
Cilento et. al. (6), no mention was made of analytical
applicability or ideal reaction conditions. Therefore, it
has been necessary to investigate each of the major
reaction parameters with respect to their effects on
analytical performance. The following describes the
experiments performed in order to determine these effects.
Reagents
All biochemicals used in this study were from Sigma
Chemical Co., P.O. Box 14508 1 St. Louis MO 63178. Horse
radish peroxidase type VI was used throughout. Type VI
peroxidase was selected due to its high RZ number, which
is the ratio of the extinction coefficient at 403 nm to
that at 278 nm. This number is often used as a
qualitative indicator of the activity of a particular
enzyme preparation. Zinner has reported that the type VI
42

43
peroxidase was much more effective, for this
chemiluminescent reaction, than the less pure forms of
peroxidase available from Sigma (22). The other enzymes
used, such as alcohol dehydrogenase, glucose-6-phosphate
dehydrogenase and formate dehydrogenase, were all from
Sigma and had the highest available activities. Both the
oxidized and reduced forms of NAD were from Sigma as were
the vari~us enzyme s~bstrates and the Tris acid and base
for the Tris buffers.
Acetic acid, sodium acetate and manganese chloride
were obtained from Fisher Scientific, 3315 Winton Rd.,
Raleigh, NC 27604, while the disodium eosin was from
American Research Products Co., P.O. Box 21009, South
Euclid, OH 44121. The eosin from American Research
Products had a reported dye content of approximately 90
percent and was the most pure form found. This compound
was the only one that was further purified.
Eosin purification
The disodium eosin was dissolved in O.lM ammonium
hydroxide to a concentration of approximately 10 g/L. To
remove neutral components this solution was extracted
several times with equal volumes of diethyl ether and the
organic layer was discarded. The free eosin was then
44
reprecipitated, according to the method of Marshall
et. al., to remove any inorganic salts. The product was
finally dried under vacuum at 100°c for approximately 12
hours. The melting point of 295-297°c for this free acid
compared favorably with the published range of 295-296°C
( 23) .
Since eosin is usually prepared by the bromination of
fluorescein, it is likely that there will be traces of
fluorescein present along with di- and tribromofluorescein
(24). To test for these lower brominated fluoresceins,
thin layer chromatography was carried out on the free acid
according to the method described by Marshall and Lewis
( 25) .
After elution for 24 hours, only two bands appeared.
The main band was that of eosin and the smaller one was
tribromofluorescein. A semiquantitative estimate of the
amount of tribromofluorescein present was obtained by
cutting out the two spots and dissolving them in 1% NH 40H
and recording their UV/Visible spectra. Using the
extinction coefficients published by Mashall, Bentley and
Lewis for dilute ammoniacal solutions of brominated
fluoresceins (38), it was calculated that the
recrystallized free acid of eosin contained approximately
15 percent tribromofluorescein. Due to the very similar
structures of tribromofluorescein and eosin

45
(tetrabromofluorescein}, it was not considered necessary
to purify the dye further. All subsequent experiments
were carried out using this recrystallized eosin.
Effect of pH
Based on their previous work, Cilento et. al. used a
pH 4.Z acetate buffer as their standard reaction medium
( 22) . This particular pH is quite low compared to that
used with most enzyme reactions. If this chemiluminescent
reaction is to be coupled to other enzyme reactions, which
reduce NAD+ to NADH, it would be highly desirable to have
the chemiluminescent reation run at a higher pH.
To determine the sensitivity of the chemiluminescent
reaction to pH, a series of O.ZBM buffers varying in pH
from 4.Z to 7.4 were prepared. Acetate buffers were used
for the pH 4.2 and 5.0 cases, glycine for the 6.0 case and
a Tris buffer for pH 7.4. Phosphate buffers are often
used in the pH 6.0 range. However, in this instance a
phosphate buffer could not be employed because the
manganese would precipitate out as manganese phosphate.
Eosin was added to each buffer solution to give a -5 final dye concentration of 3.Bx10 M and MnC1 2 was added
-3 to give a manganese concentration of 1x10 M. Horse
radish peroxidase was also dissolved in the buffer

46
solutions to a concentration of 0.15 mg/mL. A 1.5 mL
aliquot of this solution was pipetted into the luminometer
cell and the reaction was started by injecting 0.5 mL of -4 an aqueous 2.2:·:10 M NADH solution.
Figure 11 shows a plot of the luminescence peak
height as a function of the pH of the buffer. As can be
seen from the plot, the luminescence intensity appears to
be sensitive to the pH used. It was noted, qualitatively,
that when the enzyme was added to the dye/manganese
solution there was a shift in the color of the solution
from an orange towards a red. This effect seemed
strongest for the pH 4.2 case and decreased as the pH of
the buffers increased.
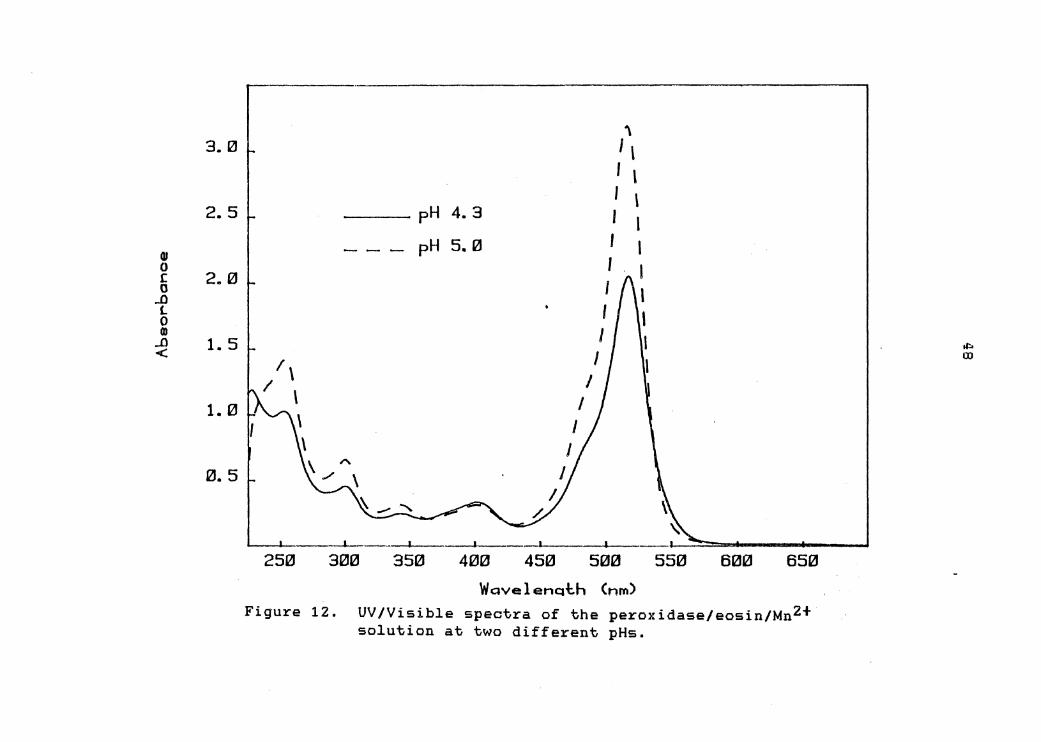
The UV/Visible spectra of the dye/manganese/enzyme at
both pH 4.Z and 5.0 appear in figure 12. As can be seen
from these two spectra, the intensity of the 518 nm eosin
band has decreased by about 30% with a concomitant
increase in the absorbance at 230 nm. This may be
suggesting that there is an enzyme/dye complex being
formed which is respor.sible for the catalysis of the light
emitting reaction.

1812100
16121121121
" 141211211Zi I E
1Sl ~ 12000
' I ~ 10000 J 0 u ...., 81210'11 >-. ..., .... 61210'11 CD c GI ...,
4000 t H
2121121121
0 4. 0
. . . ' 4. 5 5. IZI s. 5 6. 0 6. 5 7.0
pH
Figure 11. Light intensity as a function of buffer pH.
7. 5
..,. -...1
3. 0
I I
I I
I
' I \ I l I \ I I I I I . I I f\ l I I \, I I
I
~
250 300 500 I
1 I --1-~ 550 350 400 450 Wavelenc:ath Cnrn)
...._. I I I 600 650
Figure 12. UV/Visible spectra of the peroxidase/eosin/Mn2+ solution at two different pHs.
tr:. ll)

/
49
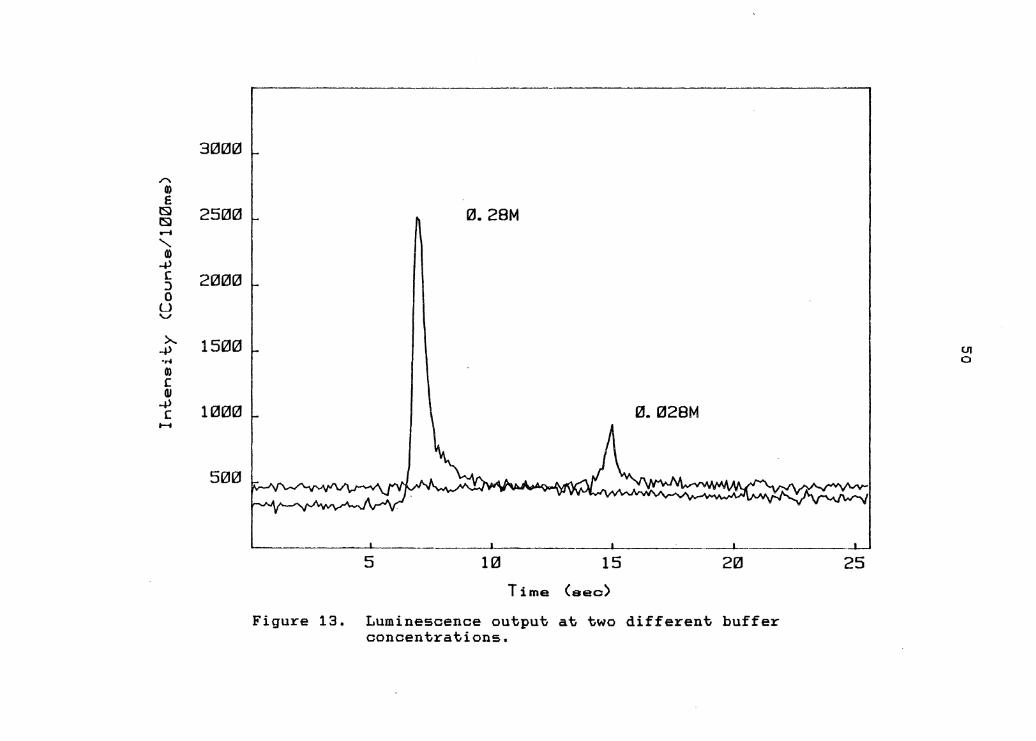
Buff er Concentration
In addition to pH, the concentration of the buffer
was checked for its effect on the light output. Even
though there appears to be a requirement for a low pH, the
high buffer concentration used by Cilento et. al. (6) may
not be absolutely necessary. Again a lower buffer
concentration would be desirable from the point of view of
coupling this reaction to some other enzyme system.
Two pH 4.2 acetate buffers were prepared, one with a
concentration of O.ZSM and the other with a concentration
of O.OZSM. Eosin, MnC1 2 and peroxidase were added to
these two buffers to produce solutions exactly as
described above. Again, 1.5 mL of a buffer solution was
added to the cell of the luminometer and the reaction
initiated by injecting 0.5 mL of NADH. Figure 13
illustrates the rather dramatic effect that the decreased
buffer concentration has on the light output. A number of
other buffer concentrations, between O.OZBM and O.ZBM,
were tried and gave a somewhat linear correlation btween
buffer concentration and light output.
,..... 0) E
lSl ts:i .-. ' (I) ..+> r: J 0 u
'J
)..... ..+> •ri 0) c QI
..+> c t-t
3r21rzJrzJ
25rzJrzJ L .. 121. 28M
2rzJrzJ(ZI
1500 r I \
1121 rzJ 121 L I \ 121. 12128M
51210
5 llZJ 15 21ZJ
Time (sec)
Figure 13. Luminescence output at two different buffer concentrations.
I Ul 0
25
51
Manganese Concentration
The paper published by Cilento et. al. (6) describing
this chemiluminescent reaction also included a description
of a similar reaction which required a different Mn 2+
concentration. Therefore, it was decided to investigate
the effect of the Mn 2+ concentration to see how sensitive
the light emitting process was to manganese.
To investigate the effect of the manganese -1 concentration on the light output, a Zx10 M MnC1 2
solution was prepared in acetate buffer. Another stock -5 solution containing 6.Z5x10 M eosin and 0.15 mg/ml
peroxidase was also prepared in acetate buffer. Five
reaction mixtures were prepared containing 1 mL of the
eosin/enzyme stock solution, varying amounts of the
manganese stock solution and sufficient acetate buffer to
bring the total volume up to 1.5 mL, as outlined in table
1. The chemiluminescent reaction was initiated by the
injection of 0.5 mL of a deionized water solution
containing Z.6x10-4M NADH.
Figure 14 shows a plot of the observed light output
as a function of the manganese concentration. The
drop-off in light intensity at low Mnz+ concentrations is
consistent with earlier repetitions of this experiment.

52
Table 1
Composition of solutions for 2,valuation of light output as a function of Mn concentration
Soln. Vol. Eosin
1 z.o ml
z 2.0 ml
3 2.0 ml
4 2.0 ml
5 z.o ml
eosin stock solution
stock Vol. z+ Mg_ stock
0.1
0.5
1. 0
5.0
8.0
-C:: = 6. 25:-:10 -M
ml
ml
ml
ml
ml
peroxidase concentration = 0.15 mg/ml
Mnz+ stock solution
NADH concentration
pH = 4.Z
-4 = 2.6:-:10 M
CMn~;+J
-5 9.9Zx10 M
-4 4.96:-:10 M
-4 9.9Zx10 M
-3 4.96x10 M -3 7.93x10 M

130121121
1212100
11000 A
~ 1121£l!£l!121 lSl lSl N 91210121 ' • 4> c 81211210 J 0 u 7121121121 '\J
>-.. 4> 6£l!0121 ... • c I 51210121
4> c ..... 41210121
301210
2121121121 121. 0 IZI. 1 e. 2 121. 3 IZI. 4 0. 5 121. 6 "· 7 "· 8 0. 9
Mn(Il) Conoan~ra~ion * 100
Figure 14. Light Intensity as a function of Mn 2+ concentration.
1. " 1. 1
U1 w

54
As the Mn2+ concentration decreases the peak height
decreases and also there is an increased lag time between
injection and the onset of the peak.
Akazawa and Conn (18) had reported that at higher
manganese concentrations, the rate of NADH oxidation
decreased until oxidation became completely inhibited at -2 around lxlO M. This may account for the drop in
luminescence intensity at Mnz+ concentrations above -3 lxlO M.
To investigate these possibilities a second
experiment was undertaken to observe the rate of oxidation
of NADH as a function of the Mn2+ concentration. NADH has
a strong absorption band at 340 nm which is not present in
the oxidized form. Therefore, the rate of oxidation can
be followed by observing the rate of decease of this
chromophore at different Mn 2+ concentrations.
Five solutions were prepared containing Z mL of
1.Z5x10-4M eosi~ solution, varying volumes of a 1x10-ZM
Mn 2+ solution and sufficient acetate buff er to bring the
total volume of each to 10 mL. 1 mL of each solution was
pipetted into a 1 cm cuvette along with 0.5 mL of
1.63x10⁻⁴M aqueous NADH and 0.5 mL of acetate buffer. The
oxidation was initiated by the addition of 100 microliters
of a 1 mg/mL peroxidase solution.
55
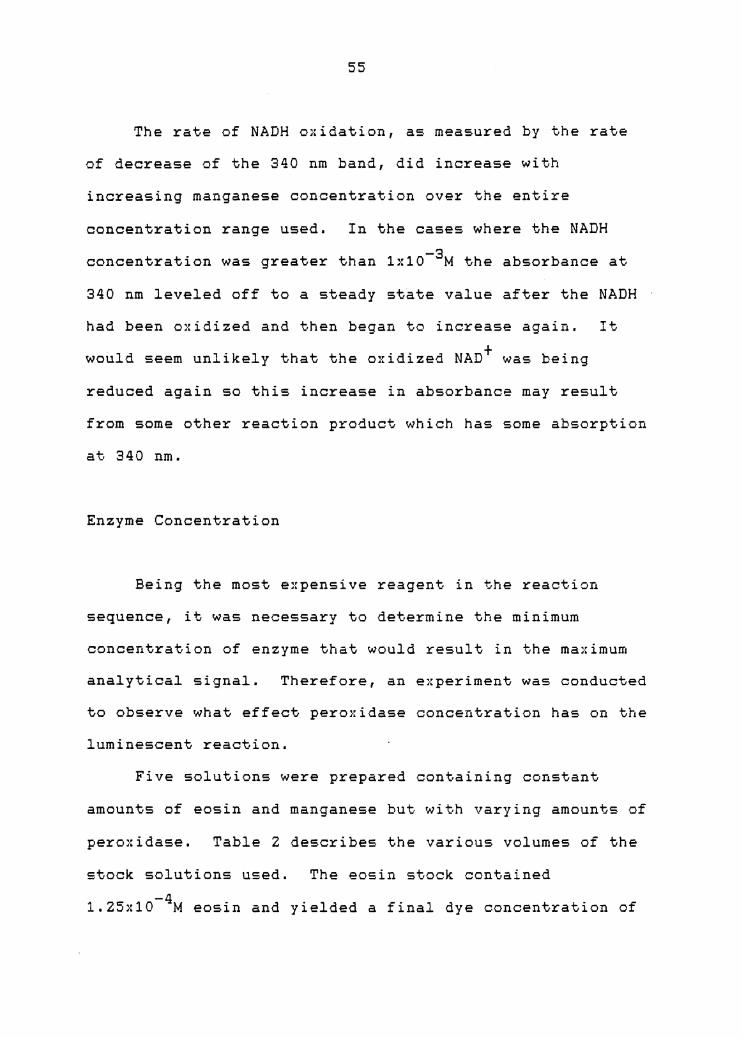
The rate of NADH oxidation, as measured by the rate
of decrease of the 340 nm band, did increase with
increasing manganese concentration over the entire
concentration range used. In the cases where the NADH -3 concentration was greater than 1x10 M the absorbance at
340 nm leveled off to a steady state value after the NADH
had been oxidized and then began to increase again. It
would seem unlikely that the oxidized NAD+ was being
reduced again so this increase in absorbance may result
from some other reaction product which has some absorption
at 340 nm.
Enzyme Concentration
Being the most expensive reagent in the reaction
sequence, it was necessary to determine the minimum
concentration of enzyme that would result in the maximum
analytical signal. Therefore, an experiment was conducted
to observe what effect peroxidase concentration has on the
luminescent reaction.
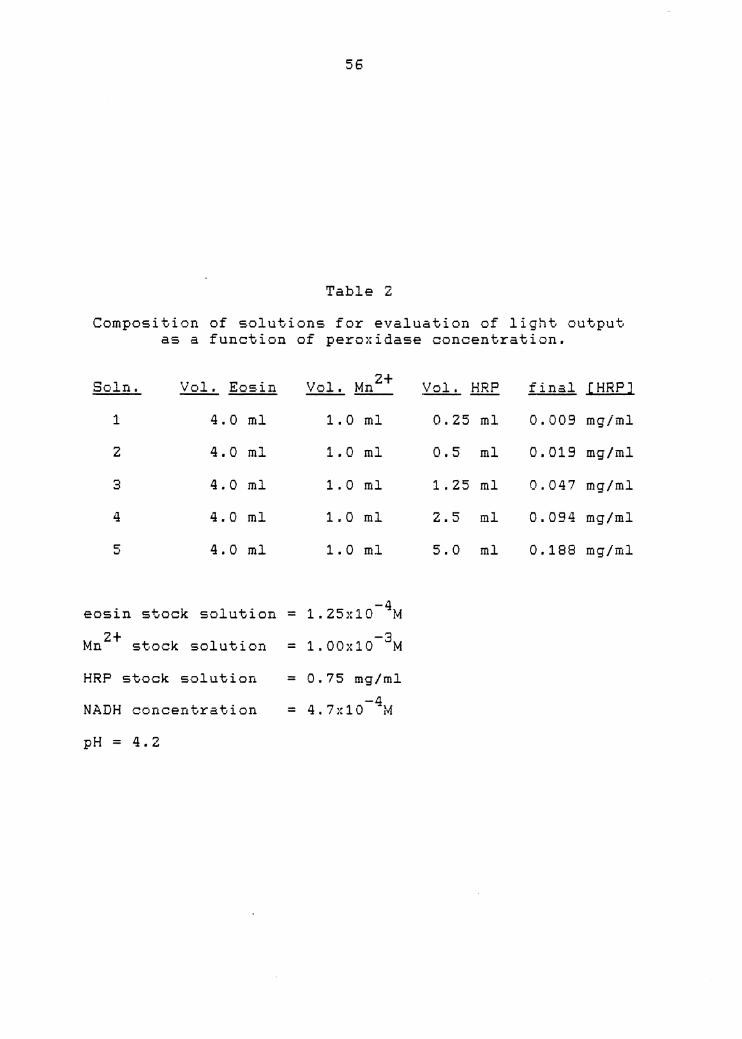
Five solutions were prepared containing constant
amounts of eosin and manganese but with varying amounts of
peroxidase. Table Z describes the various volumes of the
stock solutions used. The eosin stock contained
1.Z5x10-4M eosin and yielded a final dye concentration of
56
Table z Composi t.ion of solutions for evaluation of 1 i ght. -~utput.
as a function
Soln. Vol. Eo:.in
1 4.0 ml
z 4.0 ml
3 4.0 ml
4 4.0 ml
5 4.0 ml
eosin stock solution
Mn 2+ stock solution
HRP stock solution
NADH concentration
pH = 4.2
of peroxidase
z+ Vol. M1L_
1. 0 ml
1. 0 ml
1. 0 ml
1. 0 ml
1. 0 ml
-4 = 1. 25x10 lvf
-3 = 1. 00:-:10 M
= 0.75 mg/ml -4 = 4 I 7:•:10 tvf
concentraticn.
Vol. HRP final [HRPJ
0.25 ml 0.009 mg/ml
0.5 ml 0.019 mg/ml
1. 25 ml 0.047 mg/ml
Z.5 ml 0.094 mg/ml
5.0 ml 0 .188 mg/ml

57
-5 Z.5x10 M. Similarly, the final Mn 2+ concentration for . -4 each one of the five solutions was 5x10 M. The reaction
was started by aliquoting 1.0 mL of a particular reaction
mixture into the luminometer cell and injecting 0.5 mL of -4 a 4.7x10 M aqueous NADH solution.
Figure 15 shows that, below 0.1 mg/mL, the peak
height drops off fairly linearly with enzyme
concentration. Associated with this decreasing peak
heights is an increasing peak width and an increasing lag
time between injection and the onset of the peak. Since
all enzymes have finite rates at which they catalyze their
characteristic reactions, it would not seem unreasonable
that the peak heights should become shorter and broader at
lower enzyme concentrations. This, however, does not
explain the increased lag time between injection and the
start of the peak. At lower enzyme concentrations, the
rate of react~on [11] (figure 26) will be reduced. This
will reduce the rate of reactions [13J and [14] which in
turn will control the H2o2 need to sustain reaction [11].
A reduced rate of production of eosin radicals by reaction
[11] will increase the time necessary to develop a photon
flux which can be detected above the background.

1801210
161211210
" 14121121121 fl E
l'Sl re 12121121121
' I ~ 121121121121 J 0 u
'\J 8121121121 )...
..f) ... 61211210 G) c GI
..f) c 41211210
t-t
2121121121
121-+-~~---~~~~~~-1--~~--~~--;1--~~-+-~~-+-~~~t--~~--~~--1
121.121121 0. 1212 "· fll4 IZI. 1216 121. 1218 0.10 0. 12 0. 14 121~ 16
Peroxidaoe Concentration (mg/ml)
Figure 15. Light Intensity as a function of enzyme concentration.
0. 18 11J. 20
U1 00
59
Eosin Concentration
If the dye is being recycled as anticipated, it would
be expected that the light output should be fairly
independant of the eosin concentration. On the other hand
if the dye is being consumed irreversibly by the reaction
rather than being recycled, one might expect some sort of
linear function between the eosin concentration and the
light output.
To determine the sensitivity of the reaction to dye
concentration, four reactions mixtures were prepared
containing constant amounts of manganese and peroxidase
and varying concentrations of eosin. Table 3 shows the
compositions of the four solutions. The manganese stock
had a concentration of 1.0x10⁻²M and yielded a final Mnz+
-4 concentration of 5.0xlO M. The peroxidase was diluted to
a final concentration of 0.078 mg/mL and the eosin stock
solution had a concentration of 1.11x10⁻⁴M. A reaction
was initiated by first pipetting 1.0 mL of a particular
reaction mixture into the luminometer cell followed by 0.5
mL of acetate buffer and finally injecting 0.5 mL of a -4 1.03x10 M aqueous solution of NADH.
Figure 16 shows that the light intensity drops off
with decreasing eosin concentration. This is not the type

60
Table 3
Composition of solutions for evaluation of light output as a function of eosin concentration.
Soln. Vol. HRP Vc•l. z+ Mn_ Vol.
1 1. 0 ml 1. 0 ml 1. 0
z 1. 0 ml 1. 0 ml z.o 3 1. 0 ml 1. 0 ml 5.0
4 1. 0 ml 1. 0 ml 8.0
eosin stock solution
Mn 2+ stock solution
-4 = 1.11x10 M
-3 = 1.00x10 M
HRP stock solution
NADH concentration
pH= 4.2
= 1.56 mg/ml -4 = 1.03=-~10 M
Eosin final CEosJ
ml -6 5.55:-:10 M
ml -5 1.11:-:10 M
ml -5 Z.78:-:10 M
ml -5 4.44:-:10 M

24121121
22121121
• 2121121121 E
l':l l':l rl
' 18121121 ID
4> ( J 0 16121121 u v
>-.. ..J) 141210 ....
CD ( OI
..J) 12121121 (
H
10121121
80121 121. 5 1. 121
Figure 16.
I I I I I ---1 - ---- -------.
1. 5 2.121 2. 5 3. 121 3. 5 4. 121 4. 5
Eoein Conoenlralion CM x 1.0E5)
Light Intensity as a function of eosin concentration.
m .....

62
of response expected if the dye was indeed being recycled.
Ideally the response should have been independent of the
dye concentration. It was observed, however, that as the
dye concentration was decreased the orange color of the
dye was being bleached by some process associated with the
chemiluminescent reaction. This bleaching could be
measured as a decrease in the absorbance of the 518 nm
band of eosin. At sufficiently low dye concentrations the
spent reaction mixture would be rendered completely
colorless.
It became apparent that the degree of bleaching was
related loosely to the ratio of the dye and NADH
concentrations. Figure 17 illustrates the observed
relationship between the amount of dye lost and the amount
of NADH oxidized. These data were obtained by observing
the decrease in the 518 nm absorption band of eosin after
the addition of various concentrations of NADH.
The lower part of the curve shows a linear trend
which would be expected from a stoichiometric relationship
between the eosin and the NADH. However, the reduced rate
of bleaching at higher NADH concentrations was unexpected.

111. 121111
-l!e fi'l5
-111. lliJ • • 0 ~ -Ill. 15 0
' ,, • -I!. 2QI 0 c 0 -f -111. 25 0 • ..0 < -I!. Sl11
-e.s5
-11J. 412J "· (/J
e.s 1. l2J 1. 5 2." 2. 5 3.111 S.5 4." 4. 5
NAOH Cono•nlralion <M * 1E4)
Figure 17. Decrease in the absorbance of the 518 nm band of eosin as a function of the NADH concentration.
s.e
O"l w

64
Oxygen
The mechanism proposed for the oxidation of NADH by
peroxidase (figure 26) incorporates molecular oxygen in a
non-enzyme mediated chain reaction (20). Therefore, one
might expect the photon emission to be influenced by the
oxygen levels in the solutions. To observe this
influence, the luminescence from an NADH sample was
recorded in the usual manner. The normal dissolved oxygen
level was then forced closer to its saturation point by
bubbling oxygen through both the enzyme/dye/Mn2+ solution
and the NADH solution, by means of a 1 mm Teflon tube, for
approximately 30 minutes. After this 30 minute exposure
to pure oxygen, the luminescence from the same NADH sample
was recorded again. Figure 18 shows the luminescence
spectra before and after exposure to oxygen.
Conversely, the equilibrium dissolved oxygen
concentration can be lowered by bubbling nitrogen through
the solutions and again one might expect this to reverse
the trend observed with the added oxygen. Using the same
procedure as described above, the luminescence from an
NADH sample was recorded before the addition of nitrogen
and again after exposure to nitrogen for 30 minutes.
Figure 19 shows the result of this exposure to added

,...... . CJ)
E l'Sl l'Sl N
' 0) 4' c J 0 u ....,,
>-. ..j) ....
Q) ( OJ
4' c t-1
5QJQJl2J
4012Jl2J
3012Jl2J
2012Jl2J
1 llJ Ill Ill r
----·- ---
No added oxygen
Added oxygen
___ L.._..:_ ___ . _____ L.. ____________ J ___________ L.._ _________ ~__.
112J 20 30 40
T irne (sec) Figure 18. Luminescence output with and without added
oxygen.
5121
en (JJ

66
nitrogen.
An unexpected observation was that after about 15
minutes of bubbling with nitrogen, the red-orange color of
the enzyme/dye complex disappeared leaving only the orange
color of the dye itself. The red-orange color did not
immediately return after rebubbling with oxygen. However,
after this sealed flask had been allowed to stand over
night the red-orange color became clearly evident again.
NADH Response
Because of its higher precision, the automated
luminometer was used to record the system response to NADH
concentration. From previous work with the manual
luminometer, it appeared that a dynamic range of two
orders of magnitude should be possible with a lower limit
of detection in the 10-6M ~ange. With this range in mind,
five calibration so.lutions were prepared by diluting
various volumes of an aqueous NADH solution which had a
concentration of 5.19xl0-4M. These five solutions had -6 -4 concentrations ranging from 5.19xl0 M to 5.19x10 M.
Table 4 describes the actual volumes of NADH stock used
and the resulting concentrations of the calibration
solutions.

.,..... CD E ~ ~ N
' G) _., r: ::> 0 u
'J
~ _., •rt • r: GI _., c ........
·-----------------··
2121121121
15121121 ~ No added nitrogen
1121121121 I I \
I I \t Added nitrogen
5121121 ~ oontJ w ~.,.,
~
L--------J..--- __J_ -1-------··-.--'----------1121 2121 3121 4121
Time (sec) Figure 19. Luminescence output with and without added
nitrogen.
5121
I cr·1 '-.J

68
Table 4
Composition of standard solutions used for NADH calibration curve.
Soln. Vol. NADH stock [NADHJ
1 0.1 ml -6 5.19x10 M
2 1. 0 ml -5 5 .19>:10 M
3 2.0 ml -4 1. 04>:10 M
4 6.0 ml -4 3.11>:10 M
5 10.0 ml -4 5.19x10 M
-4 NADH stock solution = 5.19x10 M
eosin concentration = 3x10⁻⁵M
"+ -3 M ~ ~ ~- -- 1~·10 M n concenvravion ;.
peroxidase concentration = 0.2 mg/ml
pH= 4.2

69
The reagent reservoir was filled with a solution . -s -3 z+ containing 3x10 M eosin, lxlO M Mn and 0.2 mg/mL
peroxidase. The carrier reservoir was filled with O.ZBM
acetate buffer. A sample of each calibration solution was
sucked into the sample loop, in turn, with a plastic
syringe before the injection system was actuated.
Figure ZO shows the light intensity as a function of
NADH concentration. Indeed a linear response was obtained
over the desired two order of magnitude range between
5xl0-6M to 5xl0-4M NADH. The regression line is: Y = -4.055x10 2 + 8.957xl07K,· r 2 = 0.989 and s = 1.903x10³ . yx If one calculates the minimum detectable quantity, as that
which produces a response three times the standard
deviation of the background noise, a value of -6 approximately lxlO M is obtained.
Coupling to ADH
A number of enzymes, particularly the dehydrogenases,
use NAD+ as a cofactor. During the process of oxidizing
their substrates, these enzymes also reduce NAD+ to NADH.
One of the most widely used dehydrogenase of this type is
alcohol dehydrogenase (ADH). This enzyme oxidizes ethanol
to acetaldehyde with a resulting reduction of NAD+ to
NADH.
50000
45000
4000121 " I ~ 3500121 l"SI N ) 321000 4> c ~ 2512100 u "' )... 2012100
4> .... I c 1501210 • 4>
..!; 10000
5000
1 2 3 4 5
NADH Conoeneraeion <M * 1E4)
Figure 20. Light intensity as a function of NADH concentration.
6
'I 0

71
ADH ethanol + NAD+~========~acetaldehyde + NADH + H+ [5]
In neutral solutions the equilibrium for the reaction lies
far to the left. The equilibrium constant is as follows:
K = [acetaldehyde][NADHJ[H+]
+ [ethanol][NAD ] = -11 1.lxlO
it can be seen that there is only a small percentage of
[6]
ethanol in the form of acetaldehyde. The two steps which
are usually taken to force this reaction further to the
right are to run it at a pH of 9 and to add a trapping
agent for the acetaldehyde. Semicarbazide is a common
trapping agent since it will form a semicarbazone with the
acetaldehyde and prevent it from participating in the
reverse reaction.
The requirement of a high pH for this reaction is an
unfavorable one from the point of view of coupling to the
chemiluminescent reaction. Mixing a pH 9 buffer with a pH
4.Z buffer would bring the overall pH up to a point where
no chemiluminescence would be observed. Therefore, an
experiment was conducted to see if the reaction would run
at an appreciable rate with the aid of the semicarbazide
but at a lower pH.

72
Three O.OlM Tris buffers were prepared with pH's of
7.6, 8.3 and 9.0. Each of these buffers were also made up
to O.OlM semicarbazide, 1.4x10⁻⁴M NAD+ and 0.1 mg/mL
alcohol dehydrogenase. A 3 mL aliquot of a particular
buffer was pipetted into a UV/Visible cuvette and the
reaction initiated by the addition of 100 microliters of -2 1.7x10 M ethanol. The rate of reduction of the NAD+ was
followed by watching the increase of the 340 nm band of
NADH. As can can be seen from fi;ure 21, the rate of NAD+
reduction decreases with decreasing pH.
Some enzyme systems are sensitive to the nature of
the buffer used. Therefore, the same experiment was
carried out again, substituting a O.OlM glycine buffer for
the Tris buffer. Again, as can be seen from figure 21,
the rate of NAD+ reduction decreases with decreasing pH
and there seems to be little difference between the
performance in glycine compared to that • m • in .Lr1s.
A pH 9 buffer could perhaps be tolerated if the
concentration of that buffer was very low and 0.5 mL of
such a solution was mixed with 1.5 mL of a very
concentrated pH 4.2 buffer. To test the viability of
using a very weak pH 9 buffer, four pH 9 Tris buffers were
prepared with concentrations ranging from 0.01M to 0.5M.
Each buffer contained O.OlM semicarbazide, 8.5x10⁻⁵M NAD+
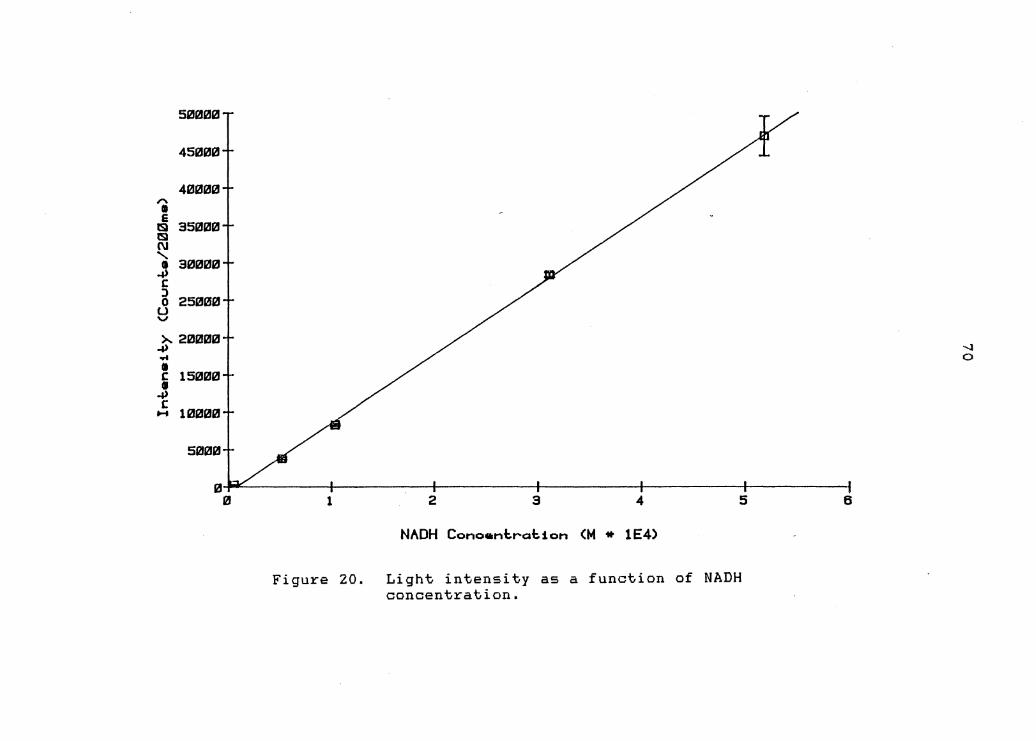
and 0.05 mg/mL alcohol dehydrogenase. The reduction of

J .. ;§
).,,
h l ..., .. ~ )... ..., .. j c
t-4
U/Jfll ...
9B 1-
Bfll i..
7fll i..
6111 I-
Sfll 1-
4111 l.o
3fll i..
O.OlM Tris pH9.0 ·········:;::··; O.OlM Glycine pH9.0 ......... ;;::··:::.··-;,::,··.::.. --
·····::::··:;.. _, ...... -;::,"- .............. O.OlM Tris pH8. 3
..... ;;;";:;:: .. :::: - ......................................... .. .. :,... ...... ,..::,:. ............ .. O.OlM Tris pll7.6
L ... ·;;, ............. .. ....................... .. 2111 .~ ......... ....................... - - - O.OlM Glycine pH8.3 .,,, .... ·········· ~----./: ... ······· ···············.::··::··-- - ,.. .,,-UI L ./. .. ·· ........ ·:,. - ,- _ O.OlM Glycine pH7 .6 ~- ...... .,,.. ----
1 . .;" •••••• ;::.··::.. ~ - - - .,.. - - - - - - _... IT.··~·-·~ - -: -- -- . . . . .
6
Figure 21.
12 18 ·24 3" 36 Ti111• <•tn>
Reduolion oF NAO by Aloohol Dehyrog•na••
Rate of reduction of NAD+ by alcohol dehydrogenase in two different buffers at various pHs.
42
-..J w

74
the NAD+ was initiated in the cuvette by the addition cf
100 microliters of 1.7xl0-2M ethanol. Figure ZZ shows
that the rate of NAD+ reduction is also quite dependant
upon the buffer concentration. This trend may be due, in
part, to the fact that the reaction of the semicarbazide
with the acetaldehyde is acid catalyzed (26}. Based on
alcohol dehydrogenase's dependance on pH and buffer
concentration this enzyme would appear to be a poor
candidate for the initial coupling to the chemiluminescent
reaction.
Another common enzyme used for the determination of
NAD+ is lactate dehydrogenase. However, based upon the
previous experiments with alcohol dehydrogenase, it too
would seem an unlikely candidate, because its equilibrium
constant is also very small:
K = + [pyruvate][NADHJ[H J
+ [lactate][NAD J = lxlo-12 [7]
The same techniques are used to force this reaction to the
right, namely the use of a high pH buffer and a trapping
agent such as semicarbazide.
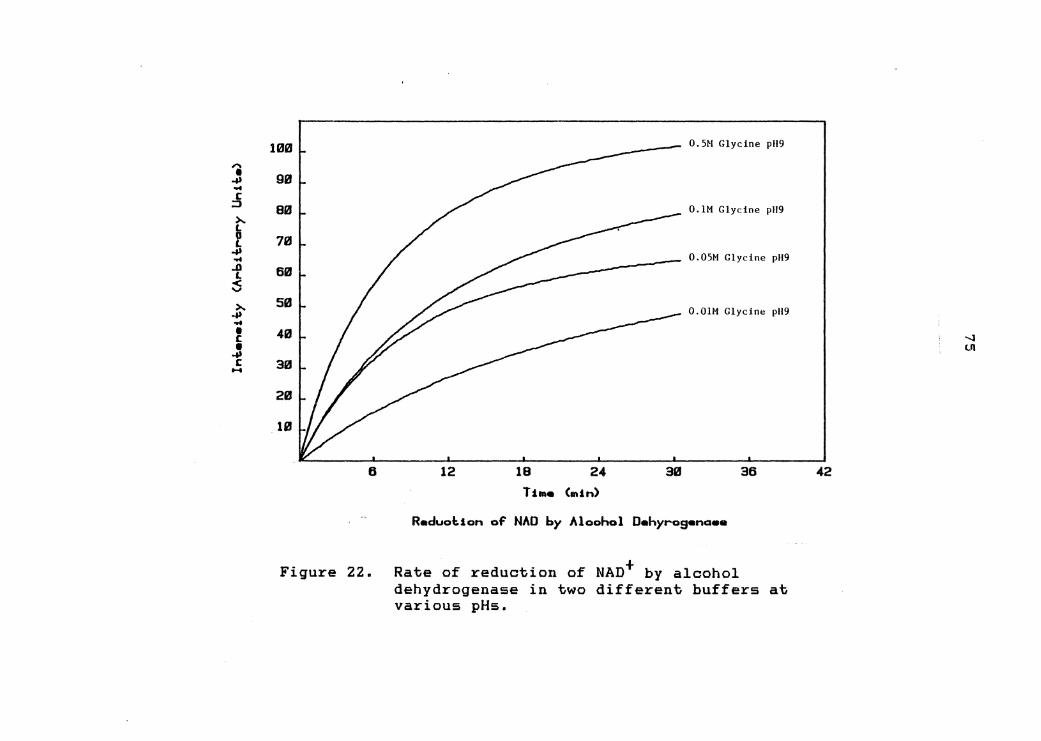
100 ..... I 90 _,, ... c
::J 80 >..
~ 711.1 ..., ... .J) 611.1 '-< ..... >.. 50
..j) ... I 40 c • ..j) c 311.1 .....
211.1
111.1
6
Figure 22.
O.SM Glycine pH9
O.lM Glycine pU9
O.OSM Glycine pU9
0.0lM Glycine pU9
12 18 24 311.1 36 Ti111e Crnin)
R.duolion oF NAO by Aloohol Oehyro9•naee
Rate of reduction of NAD+ by alcohol dehydrogenase in two different buffers at various pHs.
42
--l <.JI

76
Glucose-6-phosphate dehydrogenase
An alternate enzyme system was saught that favored
the reduction of the cofactor. Glucose-6-phosphate
dehydrogenase (G-6-PDH) was found to be such a system.
This enzyme is supplied in a 3.ZM ammonium sulphate
solution and has to be reconstituted with a solution which
consists of 0.005M glycine and 0.1% bovine serum albumin.
A working enzyme solution was prepared by reconstituting
0.25 mL of the G-6-PDH solution with Z.25 mL of the
glycine/albumin solution.
A O.OSM Tris buffer containing 5x10⁻⁴M
-4 + glucose-6-phosphate and 5x10 M NAD was placed in the
sample beam of the spectrophotometer and ZS microliters of
the enzyme solution was added with a micropipette. The
absorbance at 340 nm reached its maximum value in about 2
minutes.
To couple the glucose-6-phosphate system to the
peroxidase reaction, a reagent stream was prepared which -5 -3 ~+ contained 6.Z5x10 M eosin, 1x10 M Mn~ and 0.15 mg/mL
peroxidase. A second solution, comprising Z.5x10-4M NAD+ -4 and Z.SxlO M glucose-6-phosphate in 0.05 Tris buffer, was
injected with 25 microliters of the glucose-6-phosphate
dehydrogenase solution. This second solution was allowed

77
to incubate for about 10 minutes, at room temperature,
before injecting into the luminometer. Initially, the
G-6-P solution gave quite low light levels. However,
subsequent runs gave successively greater light
intensities. Presumably, this increasing trend was due to
the fact that a steady state NADH concentration had not
been reached in the 10 minutes allowed for incubation.
To obtain a more quantitative idea of how long the
incubation time should be, the above experiment was
repeated but with injections made at exactly 5 minute
intervals. Figure 23 shows the system response to
incubation time after which a standard incubation time of
30 minutes was selected.
A glucose-6-phosphate working curve was developed by
preparing four standard solutions containing various
amounts of G-6-P and a constant concentration of NAD+. A -~ Z.OxlO ~M glucose-6-phosphate stock solution was diluted
volumetrically to give a range of concentrations between
To each of these standards was added
Z mL of the NAD+ stock solution to yield a final NAD+ -3 concentration of 1.lxlO M. A 25 microliter sample of the
enzyme solution was injected into the standards and each
was allowed to incubate for 30 minutes before injection
into the luminometer. The resulting working curve showed
a linear response over almost two orders of magnitude as

46121121
441211211
42121121
1 4121121121 e I tg
~ 38121121
' J 36121121 c: ~ 34121121 u v >,, 32121121
-&> ii 3121121121+ c: GI
-&> 28121121 c: H
26121121
24121121
22121121 I ~ 14 16 18
Figure 23.
a
/ a
I
I I I I I I I I I I 2121 22 24 26 28 3121 32 34 36 38
Time (minuteo)
+ Amount of NAD reduced by glucose-6-phoshate dehydrogenase as a function of incubation time.
--..J (D
I I 4121 42

79
can be seen in figure 24. The regression line is: Y = 4.514x10 2 + 3.915x10⁷X; r 2 = 0.997; Syx = 9.063x10 2 .
Formate dehydrogenase
Another potential enzyme system to couple to the
chemiluminescent reaction is formate dehydrogenase.
Shaked and Whitesides have reported the following
equilibrium constant for the formate reaction (27}:
[C0 2 J[NADHJ K = --------------- =
[HC0 2-J[NAD+J [8]
Because of its favorable equilibrium constant, the
suitability of this dehydrogenase was examined further.
Five standard solutions were prepared containing formic -5 -3 acid concentrations ranging from lxlO M to lxlO M. Each
-3 + solution was also made up to lxlO M NAD and 0.3 mg/mL
enzyme. The exact compositions of these five standards is
described in table S. The standard solutions were allowed
to incubate at room temperature for 30 minutes before
being injected into the luminometer. The reagent
reservoir was charged with a solution which was 1x10⁻³M in z+ -5 Mn , 6.Z5x10 M eosin and 0.23 mg/mL peroxidase. Figure
25 shows the system response to formic acid concentration. -5 The point representing the lxlO M standard is not shown

45000
40001tJ
" 3500121 • e lS1 R1 30000
' I 1 2500121 J 0 u
v 2121000 ~
..I)
~ 15000 c • ..I) c 10121121121
H
51211210
0 e. IZI "· 1 0. 2 "· 3 "· 4 "· 5 "· 6 0. 7 "· 8 IZI. 9
G-6-P Conocntration <M * 1E3)
Figure 24. System response to glucose-6-phosphate concentration.
1." 1. 1
co 0
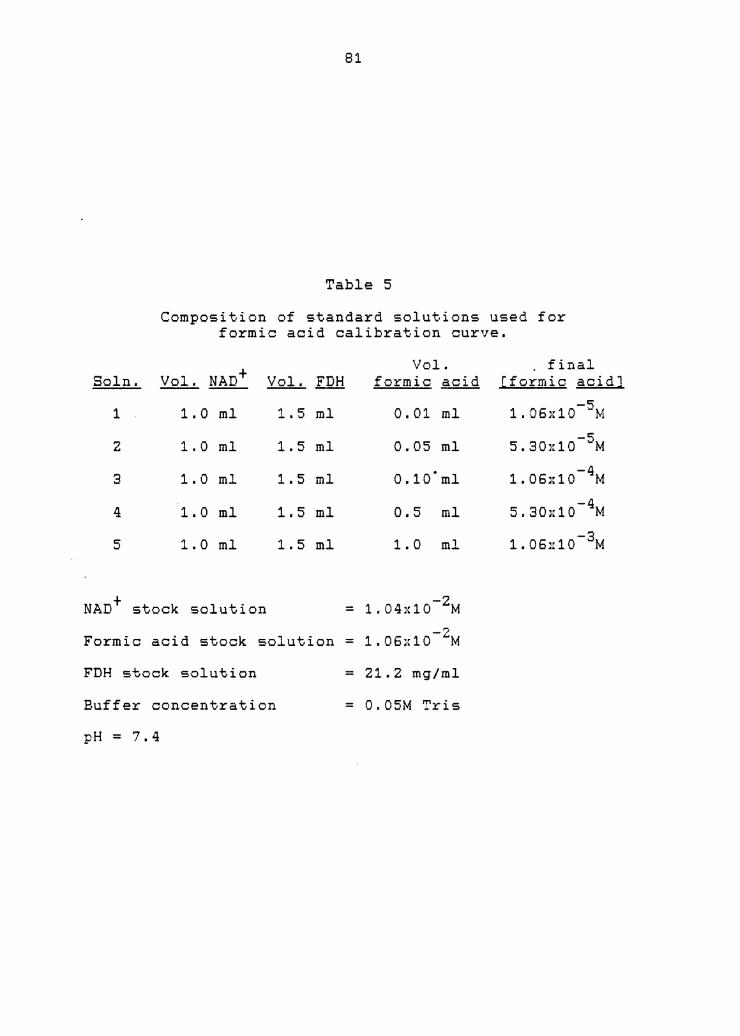
81
Table 5
Composit.ion of st.andard solut.ions used for formic acid calibration curve.
Soln. Vol. NAD+ Vol. FDH
1 1. 0 ml 1. 5 ml
2 1. 0 ml 1. 5 ml
3 1. 0 ml 1. 5 ml
4 1. 0 ml 1. 5 ml
5 1. 0 ml 1. 5 ml
NAD+ stock solution
Formic acid stock solution
FDH stock solution
Buff er concentration
pH= 7.4
Vol. formic acid
0.01 ml
0.05 ml
o.1o·m1
0.5 ml
1. 0 ml
-2 = 1.04x10 M -2 = 1.06:-=10 M
= 21.2 mg/ml
= O.OSM Tris
final [formic acidJ
-5 1.06}:10 M
-5 5.30:-:10 M
-4 1.06:-:10 M
-4 5.30~·:10 M
-3 1.06:-:10 M

9121121121
81210121
" 71211210 6l e
'5l re 6121121121
' GI ~ 500121 J 0 .u
'V 401210 >.. _.., ii 301210 c QI _.., c 201210
H
10121121
121 121. 0 0. 1 0. 2 0. 3 0. 4 0. 5 0. 6 121. 7 0. 8 0. 9 la 0
Formic aoid oonoentration CM * 1E3)
Figure 25. System response to formic acid concentration.
1. 1
I)) ('..)

83
on this plot since the system response for this
concentration could not be discerned from the background
noise.
Investigation of dye bleaching
If this chemiluminescent reaction is to realize its
desired goal the bleaching of the dye, which has been
observed thus far, will need to be suppressed. Before any
steps can be taken to eliminate this bleaching, the cause
will have to be identified. The following section
describes those experiments which were carried out in a~
attempt to pin-point the nature of the bleaching process.
Lactone formation
Looking at the structure of the eosin molecule,
attack at carbon. atom number 1 would have the most
profound effect on the molecule's degree of conjugation.
Addition at this site would restrict the delocalization to
three isolated benzene rings. The absorption maximum of
each isolated ring should be in the 250 nm region which
would be out of the visible range. Such an attack would
explain the decoloration of the solutions after the
reaction is complete.

84
One means for attack at this position would be the
carboxyl group folding back and forming a lactone at this
position. This colorless lactone form predominates in
strongly acidic solution, while the addition of a base
such as KOH or NaOH will regenerate the carboxylate form
(ZS) •
~0YO~oH No·-ovYO~ B~c~Br NaOH B~c~Br
1 --o ~~-->..
\ HCI 6 C=O I : coo-NO
To investigate the possibility of this theory, ZM
NaOH was added dropwise to a bleached reaction solution.
The optical density of this solution did increase although
the newly formed color was more yellow than the original
orange. The UV/Visible spectrum of this solution verified
that the 518 nm eosin band had not increased noticeably
and that a very large, broard band had been introduced
beginning below 220 nm and continuing out to just above
600 nm. To identify which of the components of the
solution was responsible for this behavior, ZM NaOH was
added dropwise to each one of the separate constituents.
It was found that the manganese solution was the only one
which gave a strong yellow color with the addition of the

85
base. With the addition of excess base, manganese
hydroxide precipitated, therefore, the yellow color is
probably due to a mixed chlorohydroxy or perhaps a mixed
acetohydroxy complex of manganese.
In another attempt to investigate the possibility of
lactone formation, ethyl eosin was substituted for eosin.
This molecule has had the carboxy group converted to the
ethyl ester and as such should be much less likely to form
a lactone.
Since the oxidized form of NAD has a very strong
absorption band centered around 260 nm, which might
obscure the spectrum of the lactone form of eosin, the
bleaching was carried out by the addition of hydrogen
peroxide instead of NADH (29).
This ethyl ester of eosin has considerably lower
solubility in water, therefore, 1 mg of the dye was
dissolved in ZOO microliters of ethanol before being
diluted to 100 mL with acetate buffer. The resulting
solution had a dye concentration of only about 1/10 of
that normally used. Consequently, 1 mg of peroxidase was
dissolved in 1 mL of 1x10-ZM Mn 2+ solution and diluted to
a volume of 10 mL with the ethyl eosin solution. Again
the solution took on a more red color as the dye and the
enzyme mixed. Three mL of this solution was pipetted into
a UV/Visible cuvette and the spectrum of the solution was

86
recorded before and after the addition of 100 microliters
of 1x10-ZM H~O~. ~ ~
As with eosin the ethyl eosin was also bleached by
about 50% which would suggest that the bleaching of the
dye does not result from eosin's carboxyl group forming a
lactone ring at the number 1 position.
Superoxide anion
While the above results suggest that it is not the
attack of the number 1 position from the carboxyl group,
it does not rule out the possibility of attack from an
external agent. Since, in general, peroxidases produce
radicals as their products, it would seem reasonable that
such a species might be responsible for the attack on the
eosin.
The mechanism published by Yokota and Yamazaki
(figure 26), describing the oxidation of NADH by
peroxidase in the presence of phenols, involves the
generation of the superoxide anion from oxygen (20). If
this radical was responsible for the bleaching, it should
be inhibited by the addition of a large concentration of
the enzyme superoxide dismutase. This enzyme is specific
for the superoxide anion and dismutes two such radicals
into a molecule of oxygen and a molecule of hydrogen

peroxide.
z·o + zH+ z
87
SOD -----> [9]
This enzyme will compete for the available supply of
·o2 and reduce the extent of all reactions involving it.
If the bleaching process involves ·o2 it too should be
inhibited to some extent. A 3 mL aliquot of a solution -3 z+ -6 containing 1x10 M Mn , 1.5x10 M eosin, 0.1 mg/mL
peroxidase and 0.05 mg/mL superoxide dismutase was
pipetted into a UV/Visible cuvette and the spectrum
recorded before and after the addition of 20 microliters -z of lxlO M H2o2 • Again, the absorbance of the 518 nm band
of eosin was reduced by about 50%, which would indicate
t~at ·o2 is not directly responsible for the bleaching.
Hydroxyl radical
Another highly reactive radical which is often
associated with the decomposition of H2o2 is the hydroxyl
radical 'OH. In an attempt to scavenge 'OH radicals,
hydroquinone was added to the reaction mixture. This -6 mixture consisted of 1.5x10 M . • 10-3M M z+ eos1n, ix n / -6 mg/mL peroxidase and 1.5x10 M hydroquinone. A 3 mL
0.1
aliquot of this solution was pipetted into a cuvette and
the spectrum recorded before and after the addition of 20

88
microliters of 1x10-ZM H2o2 .
The hydroquinone did have a small positive effect on
the degree of bleaching, as measured by the intensity of
the 518 nm band. Therefore, the concentration of
hydroquinone was increased to 1.1x10⁻⁴M to see if the
effect could be increased. At this higher concentration
two hydroquinone band:. were clearly vi:.ible in t.he
absorption spectrum at 245 and 290 nm. After the addition
of the H2o2 the 518 nm eosin band was observed to decrease
by only about 10%. Also, the 290 nm hydroquinone band had
decreased in intensity somewhat while the 245 nm band had
increased by a factor of approximately five.
While the addition of hydroquinone did help suppress
the bleaching of the dye, it also completely suppressed
all detectable light output from the system.
EDTA
O'Brien et. al., in their paper describing weak
chemiluminescence observed from the action of peroxidase
on H2o2 , in the presence of eosin, mentioned that
bleaching of the dye was reduced by the addition of high
concentrations of a compound containing a tertiary amine
such as EDTA (29). This was a viable solution as their
system did not require manganese ions. While it was not

89
as attractive a solution in the present system, due to 2+ EDTA's ability to complex Mn , the effect of EDTA was
never the less investigated in the absence of Mn 2+. A
solution containing 1.5x10⁻⁶M eosin and 0.1 mg/mL was
bleached by the addition of 20 microliters of 1x10-ZM
H2o2 . The absorption spectrum of this bleached solution
was compared with that of a similar solution which also
contained 1x10⁻³M EDTA. The EDTA did suppress the
bleaching to a small extent but not to the extent
described by O'Brien.
The most significant observation from this particular
experiment was not the effect of the added EDTA, but the
effect of the removed manganese. In the absence of
manganese, the 518 nm band of eosin almost completely
disappeared, whereas in previous experiments its intensity
was only reduced by a factor of two. It would appear that
the pr~sence of manganese itself prevents a considerable
amount of bleaching. If this is indeed the case,
increasing the Mn 2+ concentration still further should
have a beneficial effect. When the Mnz+ concentration was -3 raised to 9x10 M the degree of bleaching was reduced to
about 10%, however, as previously noted, increasing the
Mn2+ to this level suppresses all detectable light output.
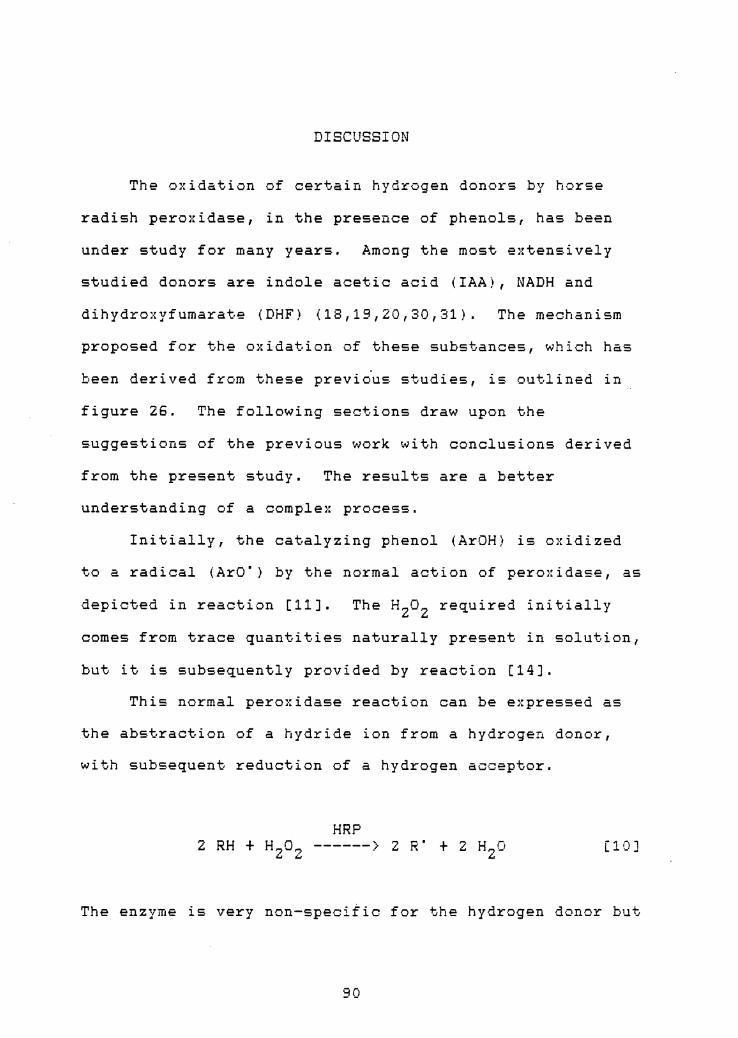
DISCUSSION
The oxidation of certain hydrogen donors by horse
radish peroxidase, in the presence of phenols, has been
under study for many years. Among the most extensively
studied donors are indole acetic acid (!AA), NADH and
dihydroxyfumarate (DHF) (18,19,20,30,31). The mechanism
proposed for the oxidation of these substances, which has
been derived from these previ~us studies, is outlined in
figure 26. The following sections draw upon the
suggestions of the previous work with conclusions derived
from the present study. The results are a better
understanding of a complex process.
Initially, the catalyzing phenol (ArOH) is oxidized
to a radical (ArO') by the normal action of peroxidase, as
depicted in reaction [11]. The H2o2 required initially
comes from trace quantities naturally present in solution,
but it is subsequently provided by reaction (14].
This normal peroxidase reaction can be expressed as
the abstraction of a hydride ion from a hydrogen donor,
with subsequent reduction of a hydrogen acceptor.
HRP Z RH t H?O~ ------> 2 R' t Z H~O ... ,;,, "" [10]
The enzyme is very non-specitic for the hydrogen donor but
90

91
HRP 2 Ar OH + H,..,0,.., ------> z Aro· + 2 H20 (11]
,;!, ,;!,
NADH + ArO' ------> NAD' + P..rOH (12]
NAD' + Oz ------> NAD+ + ·o z [13]
·o 2 + NADH + H+ ------> NAD' + HZOZ (14]
2 ·o + ,.., H+ ------> Hz oz + n (15] z ,;!, -z 2 NAD' + H+ ------> NADH + NAD+ (16]
Figure 26. Mechanism for the oxidation of NADH by peroxidase in the presence of a phenol.
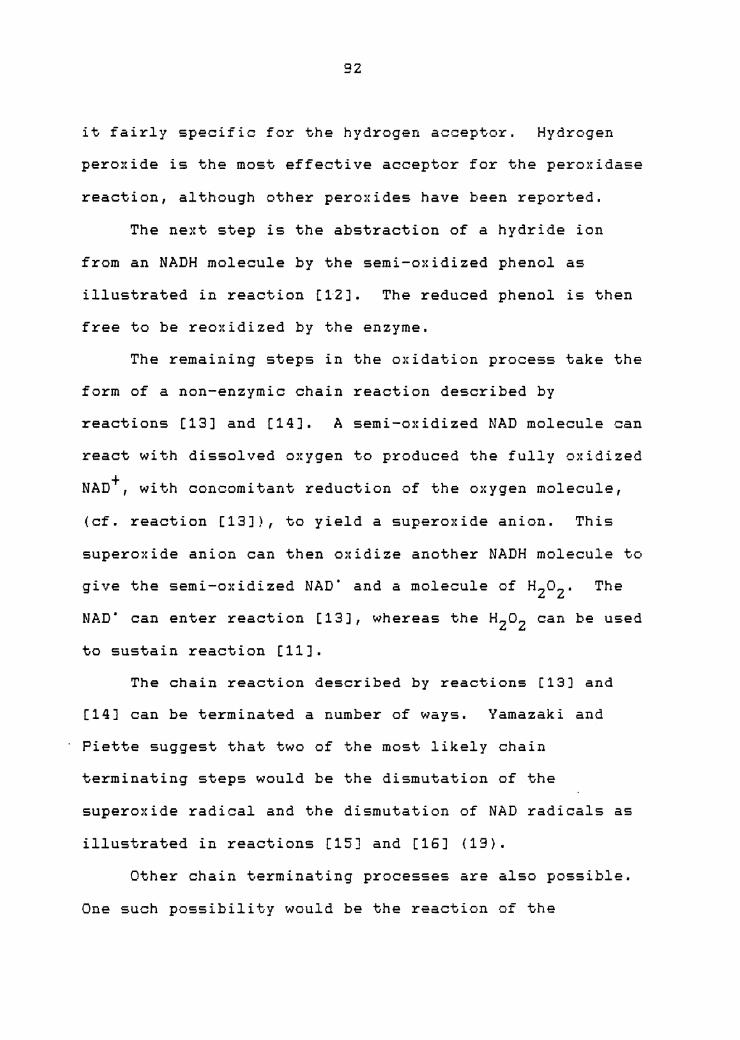
92
it fairly specific for the hydrogen acceptor. Hydrogen
peroxide is the most effective acceptor for the peroxidase
reaction, although other peroxides have been reported.
The next step is the abstraction of a hydride ion
from an NADH molecule by the semi-oxidized phenol as
illustrated in reaction [12]. The reduced phenol is then
free to be reoxidized by the enzyme.
The remaining steps in the oxidation process take the
form of a non-enzymic chain reaction described by
reactions [13] and [14]. A semi-oxidized NAD molecule can
react with dissolved oxygen to produced the fully oxidized
NAD+, with concomitant reduction of the oxygen molecule,
(cf. reaction [13]}, to yield a superoxide anion. This
superoxide anion can then oxidize another NADH molecule to
give the semi-oxidized NAD' and a molecule of H2o2 . The
NAD" can enter reaction [13], whereas the H2o2 can be used
to sustain reaction [11].
The chain reaction described by reactions (13] and
[14] can be terminated a number of ways. Yamazaki and
Piette suggest that two of the most likely chain
terminating steps would be the dismutation of the
superoxide radical and the dismutation of NAD radicals as
illustrated in reactions [15] and [16] (19).
Other chain terminating processes are also possible.
One such possibility would be the reaction of the
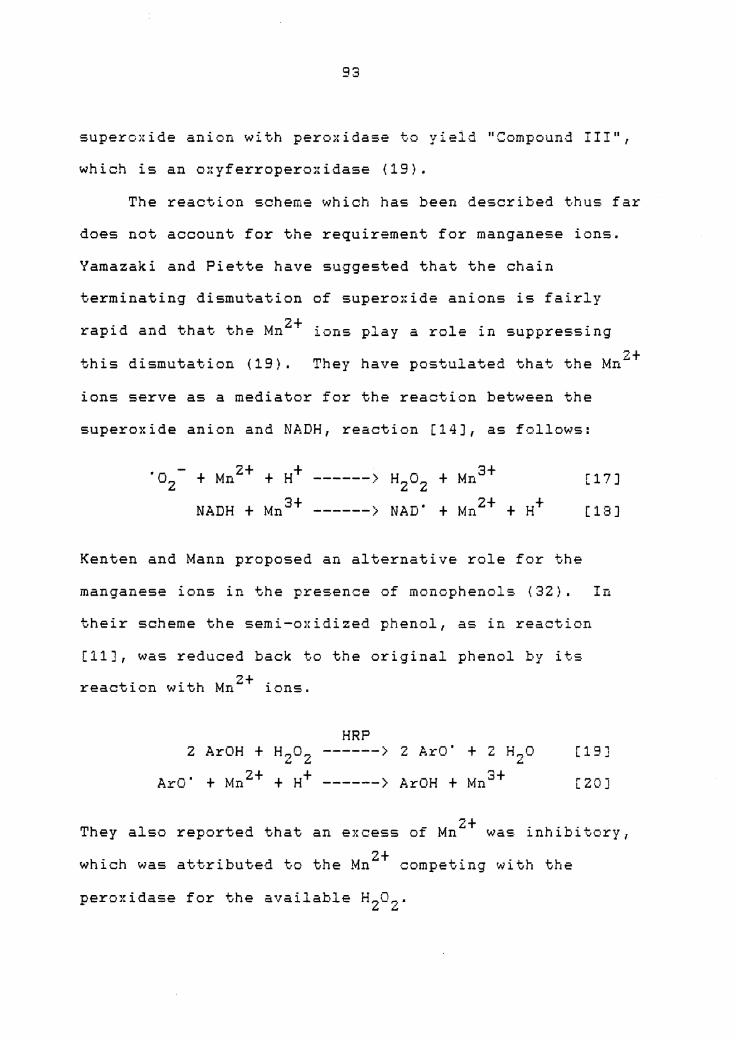
93
superoxide anion with peroxidase to yield "Compound III",
which is an oxyferroperoxidase (19).
The reaction scheme which has been described thus far
does not account for the requirement for manganese ions.
Yamazaki and Piette have suggested that the chain
terminating dismutation of superoxide anions is fairly
rapid and that the Mn2+ ions play a role in suppressing
this dismutation (19). They have postulated that the Mnz+
ions serve as a mediator for the reaction between the
superoxide anion and NADH, reaction [14], as follows:
·02- + Mn2+ + H+ ------> H2o2 + Mn 3+ [17]
NADH + Mn 3+ ------> NAD' + Mn 2+ + H+ [18]
Kenten and Mann proposed an alternative role for the
manganese ions in the presence of monophenols (32). In
their scheme the semi-oxidized phenol, as in reaction
[11], was reduced back to the original phenol by its
t - "th M z+ -reac ion w1 n ions.
HRP 2 Ar OH + H~O~ ------> 2 ArO' + ~ H~O [19] ~
w ~ ~
ArO' + Mn z+ + H+ ------> Ar OH + Mn 3+ [20j
They also reported that an excess of Mn 2+ was inhibitory,
which was attributed to the Mn 2+ competing with the
peroxidase for the available H2o2 .

94
Effect of pH
The requirement that the chemiluminescent reaction be
carried out at a low pH can be possibly accounted for by
the formation of an enzyme/dye complex. It was observed
in this study, that, after the addition of peroxidase, the
enzyme/dye solution at pH 4 developed a more "reddish''
color than its pH 5 counterpart. Figure 12 shows the
UV/Visible spectra of two such solutions. These two
spectra reveal that the main 518 nm band of eosin has
suffered the greatest percentage reduction in intensity.
The work of a number of authors has suggested that
the 518 nm chromophore can be attributed to the
para-quinoid structure of the eosin molecule {33,34}.
Disruption of this delocalized quinoid structure would
result in a decrease of the 518 nm band. In strongly
acidic media, for example, the quinoid structure of eosin
is destroyed by the formation of a lactone (28). This
lactone formation isolates all three aromatic rings to
yield a colorless molecule.
The •xperimentally observed behavior (figure 12)
suggests, therefore, that the interaction between the dye
and the enzyme is effecting the quinoid structure to some
extent. The results of a related experiment undertaken

95
during this study also indicates that the carboxy group is
not likely to be the point of complexing with the enzyme.
When peroxidase was added to a solution of ethyl eosin, an
ethyl ester of eosin, the same color change was observed
at pH 4. Therefore, it would seem that the most probable
site for complexing with the enzyme is the phenoxy group.
The dependance of the reaction on the buff er
concentration discovered in this study, as illustrated in
figure 13, may be the result of an enzymatic sensitivity
towards the ionic strength of the reaction medium.
Variations in enzyme performance as a result in variations
to ionic strength are quite common in biochemical
reactions. Such an effect can be seen, for alcohol
dehydrogenase, in figure ZZ. An alternative
interpretation may be that one of the reactions in the
light emitting process is acid catalyzed, although it is
not clear at this point which specific reaction would be
sensitive to such acid catalysis.
Mn 2+ concentration
Figure 14 shows the system response to manganese
concentration as studied in the current work. The maximum
that this response curve goes through may the result of
two effects. Yamazaki and Piette suggested that a

96
possible role for the manganese ions is to prevent the
dismutation of ·o2 and thus propagate the chain reaction
described by equations [13] and [14]. Therefore, at low
Mnz+ concentrations this chain reaction may be slowed by
dismutation and the rate of generation of H2o2 would be
reduced. A reduced rate of H2o2 production would also
have a negative effect on the rate of reaction [11] which
is associated with the light emitting process. Since the
intensity of a signal from the pulse counting detector is
a measure of the photon flux, or the number of
photoelectric events per unit time, a reduction in the
rate of the light emitting reaction would result in a
reduced signal.
Kenten and Mann concluded that at higher manganese
concentrations there could be effective competition
between peroxidase and the Mn 2+ ions for the available
Direct reaction between the generated H2o2 and
manganese would inhibit reaction [11] but would not effect
the chain reaction. This would explain the reduced light ?+ intensity at higher Mn~ concentrations.
Peroxidase concentration
The first step in the oxidation of NADH has been
proposed to be the formation of a dye radical by the
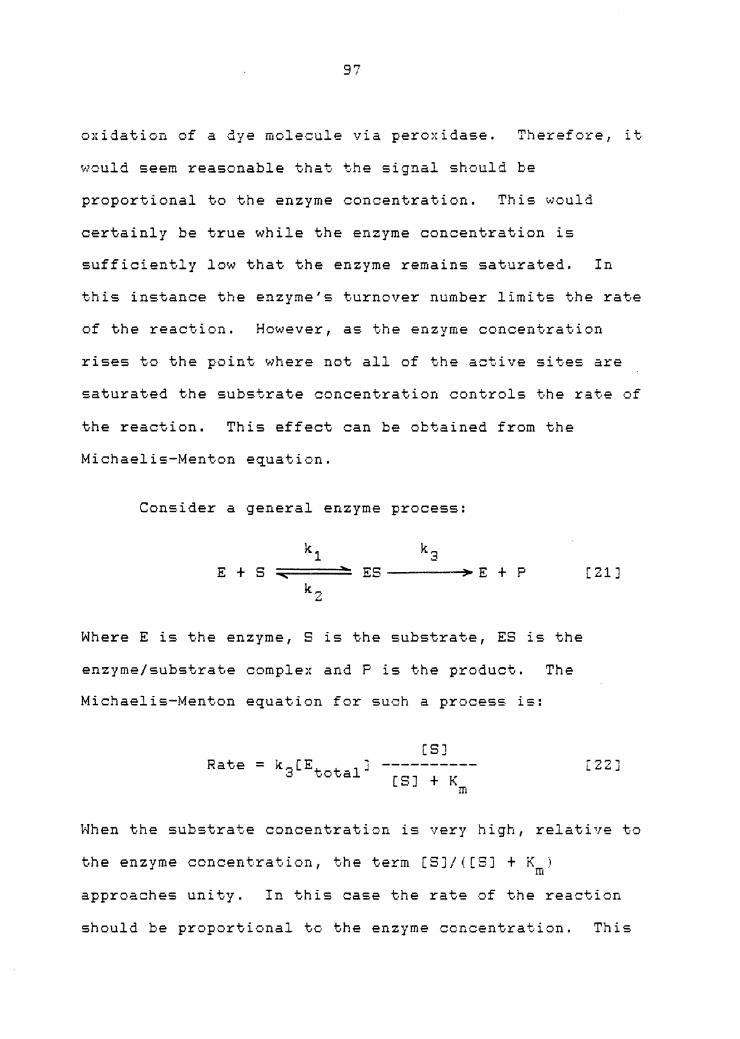
97
oxidation of a dye molecule via peroxidase. Therefore, it
would seem reasonable that the signal should be
proportional to the enzyme concentration. This would
certainly be true while the enzyme concentration is
sufficiently low that the enzyme remains saturated. In
this instance the enzyme's turnover number limits the rate
of the reaction. However, as the enzyme concentration
rises to the point where not all of the active sites are
saturated the substrate concentration controls the rate of
the react.ion. This effect can be obtained from the
Michaelis-Menton equation.
Consider a general enzyme process:
kl k3 E + s ES ------,~ E + p
k~ ~
Where E is the enzyme, S is the substrate, ES is the
enzyme/substrate complex and P is the product. The
Michaelis-Menton equation for such a process is:
Rate = k~[E~ t-lJ ~ \.•O a
[SJ
[SJ + K m
[21J
[22]
When the substrate concentration is very high, relative to
the enzyme concentration, the term [SJ/((SJ + K l m·
approaches unity. In this case the rate of the reaction
should be proportional to the enzyme concentration. This

98
can be seen in figure 15, which is derived from the
present work, for those enzyme concentrations below 0.1
mg/mL. Above 0.1 mg/mL the enzyme's active sites are
presumably not fully saturated, in which case the
[SJ/([SJ + K ) term starts to become dominant. m
With the constant substrate concentration used in
this work, one would expect the signal, above 0.1 mg/mL,
to also remain constant. However, as can be seen from
figure 15, there is a decrease in response at O.Z mg/mL.
This decrease in intensity could be attributable to an
effect that was observed by Kenten and Mann (32). They
suggested that excess peroxidase can complex with ·02- to
form an oxyferroperoxidase known as "Compound III". If
excess peroxidase begins to compete for ·o2 , the chain
reaction would be inhibited, which would in turn inhibit
the oxidation of the dye and therefore reduce the light
output.
Eosin concentration
From reactions (11] and [12) it can be seen that the
catalyzing phenol should be recyclable. One would
therefore expect the system response to be somewhat
independant of the dye concentration. However, as can be
seen from figure 16, which is derived from this work, the

99
response increases with increasing dye concentration.
This curve, in fact, resembles a Michaelis-Menton plot for
a normal enzyme/substrate reaction. This would imply that
the eosin, which is acting as the substrate ·for
peroxidase, is being irreversibly oxidized by the enzyme.
The nature of this oxidized product is not clear, although
some form of oxygenated dye molecule is likely.
Hydroxylation of aromatic substrates is well known for
certain classes of enzymes known as "oxygenases". An
oxygenase activity has been suggested as a possible
alternative mechanism for peroxidase during the oxidation
of IAA (31).
Oxygen requirement
There is some debate in biochemical circles as to the
exact sequence of events associated with this oxygenation
(35). One point of moderate agreement seems to centered
around the formation of an ES0 2 ternary complex. The
nature of the oxygen also seems to differ depending upon
the particular enzyme system in question. In some
instances it appears to be molecular oxygen, in others it
appears to be the superoxide anion and in others it is
believed to be derived from H2o.

100
It was found experimentally, during this study, that
when peroxidase was added to an acetate buffer solution
containing eosin and Mn 2+, there was a very distinct color
change from orange to red-orange. This would imply that
there is some sort of enzyme complex being formed. If
nitrogen is bubbled through the solution for about fifteen
minutes, the red-orange color disappeares leaving the
original orange color of the eosin/Mnz+ solution. The
red-orange color does not immediately return if oxygen is
then bubbled through the deoxygenated solution. However,
it was noticed that the red-orange color did return if the
solution was let stand over night. This behavior would
suggest that oxygen is somehow associated with the
enzyme/dye complex. It may be that the red-orange color
results from a peroxidase-eosin-02 ternary complex.
It was found that addition of oxygen to the
enzyme/dye/Mn2+ and NADH solutions depressed the intensity
of the luminescence peaks as can be seen in figure 18.
The question that arises is whether this added oxygen is
interfering with the enzyme/dye complex or whether it is
inhibiting some other aspect of the process.
If the enzyme/dye complex is indeed a ternary complex
involving o2 it would seem unlikely that additional oxygen
would have a marked inhibitory effect upon its
performance.
101
As can be seen from figure 26, reaction [13] requires
molecular oxygen. The addition of oxygen may speed up the
chain reaction of reactions [13] and [14]. The light
emitting reaction, proposed by Cilento et. al., is the
interaction of an eosin radical with an NAD radical (6).
eosin' + NAD' + H+ ------> [eosinJ* + NAD+
[eosin]* ------> eosin + light
[23]
[24]
An increase in the rate of the chain reaction would leave
less NAD radicals available to participate in the
luminescent process and therefore reduce the overall peak
intensity.
Eosin bleaching
Because of the bleaching of the dye that occurs as a
result of the light emitting process, this particular
chemiluminescent reaction did not realize the initial goal
of a recycling luminescent process. Two steps were,
however, somewhat successful in reducing the amount of
bleaching: (1) the addition of excess Mnz+ and (2) the
addition of hydroquinone. Both steps, unfortunately, also
quenched the luminescent reaction. The effect of a
relatively good radical scavenger such as hydroquinone
implies that the bleaching process may be a radical

102
reaction. However, it does not give any information on
the nature of the reaction.
The dismutation of superoxide anions has already been
discussed as a chain terminating step and the addition of
Mnz+ ions has been suggested as a means of reducing that
rate of dismutation. If the bleaching process is the
result of the reaction of eosin radicals and superoxide
anions, then Mn 2+ ions would perhaps be expected to
inhibit the bleaching process. Unfortunately, the
addition of superoxide dismutase to the reaction mixture
did not confirm that the superoxide anion is responsible
for the bleaching.
NADH response
Despite the fact that recyclability doesn't appear a
reality, the chemiluminescent reaction does show a linear
response to NADH over a two order of magnitude
concentration range. The minimum detectable quantity was
calculated to be 1x10⁻⁶M which is competitive with -6 absorption methods, which are useful down to the 1-5x10 M
range (36}. Traditionally, luminescence methods have been
capable of greater sensitivity than absorption methods.
However, in this particular case only a fraction of the
NADH is being channeled into the emitting process thus
103
reducing the overall luminous output. Because of this
relatively low light level it is unlikely that this
particular chemiluminescent reaction will supplant the
absorption methods.
Since NAD+ is a cofactor for many enzyme reactions,
they should be able to be coupled to the chemiluminescent
reaction to obtain a luminescence signal proportional to
substrate concentration. Those reactions which favor the
reduction of NAD+ to NADH have proven to be the most
viable due to their lower pH requirements.
Glucose-6-phosphate response
Glucose-6-phosphate dehydrogenase was found to be
such an enzyme system that reduces NAD+ and which can be
run at a neutral pH. Because of these favorable
conditions this enzyme system has been successfully
coupled to the chemiluminescent reaction. This pair of
reactions was found to give a linear response to
glucose-6-phosphate over a two order of magnitude
concentration range (figure 24). The requirement for a 30
minute incubation period is not unusual in enzyme
analyses. This incubation time could possibly be reduced
by the addition of a trapping agent for the
6-phosphogluconate which is a product of the first
104
reaction.
Glucose-6-phosphate dehydrogenase is an interesting
enzyme because it can be coupled with hexokinase to
produce an analysis for glucose.
HK glucose + ATP ------> G-6-P + ADP [25]
G-6-PDH G-6-P + NAD+ ---------> 6-PG + NADH [Z6J
The NADH produced by these two reactions could then be
analyzed with the chemiluminescent reaction to give a
luminescent signal proportional to the glucose
concentration. The range of linearity observed for the
chemiluminescent system corresponds fairly well within the
normal levels of glucose found both in serum and urine.
Unfortunately, a very strong competitor for the
chemiluminescent analysis of serum glucose is glucose
oxidase coupled with the luminol reaction. Considering
the much higher light output of the luminol reaction, it
would probably turn out to be the reaction of choice.
Formate response
Another enzyme system that was tried was formate
dehydrogenase. At low substrate concentrations it did
exhibit a linear response, although at high substrate

105
concentrations the response rolled off from linearity
quite badly. The exact cause of this non-linearity is not
clear at this point. One possible explanation could be
the inhibition of the enzyme by excess product. This
particular effect is not uncommon in biochemical
reactions, with the firefly enzyme,-luciferase, being a
classic example. The reasonably high solubility of co2
would allow a considerable accumulation of this product in
solution, therefore, posing a potential inhibition
problem. This problem of product inhibition could perhaps
be helped by the addition of a trapping agent for the
product molecule.
Even though the response to formate concentration has
been observed to be non-linear, this is not to say that it
cannot be analytically useful. The non-linearity simply
means that a larger number of standards would be needed to
characterize the shape of the curve. This would
particularly apply to the point on the curve where the
slope changes sharply.
SUMMARY
The purpose of this research was to investigate the
chemiluminescent oxidation of NADH by horse radish
peroxidase in the presence of eosin. This particular
reaction was chosen because it appeared to possess the
property of a recycling luminescing species. Such a
reaction merited investigation because it would provide
the first essential step necessary for the design of a
chemiluminescent probe that could be reuseable or would be
applicable to continuous monitoring.
An automated luminometer was designed and constructed
to facilitate the investigation of reaction conditions and
to test the reaction's analytical viability. A fully
automated delivery system was provided for the injection
of the sample, addition of reagents and the rinsing of the
system after a run. In addition to the reduction in
sample handling that was necessary, the automated
injection system also provided increased reproducibility v
over manual syringe injection. A pulse counting detector
system was used to provide improved sensitivity and signal
to noise ratio.
Each one of the major reaction parameters was
investigated individually in order to obtain insight into
the most favorable conditions under which to run the
reaction. The optimized conditions correspond to a pH of
106

107
4, enzyme concentration of 0.1 mg/mL, manganese
concentration of 5x10⁻⁴M and an eosin concentration of
During the course of the investigation it became
apparent that the eosin was being bleached. The bleaching
process was examined in order to learn what was causing it
and then take steps to prevent it. It soon became
apparent that those techniques that were successful at
reducing the degree of bleaching also quenched the
chemiluminescence. It is postulated that the bleaching is
a result of the reaction of eosin radicals and some form
of oxygen, perhaps the_superoxide anion. Because of the
severe degree of bleaching that occurs at high NADH
concentrations it is unlikely that substantial recycling
of the dye is possible.
Despite the lack of recyclability, this
chemiluminescent reaction ha~ proven to be a successful
analytical probe for the determination of NADH. The
response to NADH concentration is linear over two orders -6 -4 of magnitude between 5x10 M and 5x10 M with a calculated
limit of detection of 1x10⁻⁶M. This compares quite
favorably with established absorption techniques. The
analysis time is quite short, approximately three minutes,
and the average reproducibility is 5% RSD.

108
Because NAD+ is such a ubiquitous cofactor amongst
biochemical reactions, the chemiluminescent reaction
should be able to be used as an indirect sensor for the
substrates of these biological reactions.
Glucose-6-phosphate dehydrogenase has been successfully
coupled to the chemiluminescent reaction for the
determination of glucose-6-phosphate. Again response was
linear over approximately two orders of magnitude between
lx10-5M to lxl0-3M with better than 5% RSD
reproducibility.
Another biochemical system that was chosen for
coupling to the chemiluminescent reaction was formate
dehydrogenase. This particular system provided only about e
one order of magnitude of linearity, between 5x10-JM and -4 5x10 , with the response levelling off at formate
concentrations above 5xl0-4M. This levelling off could be
due to product inhibition of the enzyme at high substrate
concentrations. Even though the response curve is not
linear over a wide range the method could serve as an
analytical approach provided that sufficient calibration
points were available to define the shape of the
non-linear function.
In conclusion, it does not appear that this
particular chemiluminescent reaction will serve as the
first step in the design of a reuseable or continuous
109
chemiluminescent monitor. However, it has provided a
chemiluminescent method for the determination of NADH
which is simple, rapid and competitive with existing
absorption techniques in terms of sensitivity.
However, before chemiluminescent methods can
realistically take over from the absorption techniques for
the determination of NADH, the chemiluminescent reaction
employed must have a high luminescence efficiency and
utilize inexpensive, stable reagents. Firefly lucif erase
as well as a number of bacterial lucif erases have very
high quantum efficiencies and have been adapted to to the
determination of NADH, but they are still too expensive to
be competitive.
For the purpose of a reuseable or continuous
chemiluminescent monitor, one of the flavine
mononucleotide oxidoreductases from a luminous bacteria
such as Beneckea harveyi may be another promising
candidate (37). These enzymes reduce FMN to FMNH 2 with
concomitant oxidation of NADH to NAD+. The reduced FMNH~ w
can be reoxidized by firefly luciferase in the presence of
decanal and o2 to yield chemiluminescence. This type of
reaction sequence is now becoming more practical with the
recent commercial availability of the bacterial NADH:FMN
oxidoreductases.

REFERENCES
1. Hercules, D. M. Acct. Chem. Res. 1969, ~, 301-307.
2. Albrecht, H. O. ~ Physik. Chem. 1928, 135, 321-330.
3. Seitz, W. R.; Neary M. P. Anal. Chem. 1974, 46(2), 188A.
4. Simpson, J, S. A.; Campbell, A. K.; Woodhead, J. S.; Richardson, A.; Hart, R.; McCapra, F. In "Bioluminescence and Chemiluminescence : Basic Chemistry and Analytical Applications"; DeLuca, M. A.; McElroy, W. D.; Eds.; Acedemic Press: New York, 1981; pp 673-679.
5. Freeman, T. M.; Seitz, w. R. Anal. Chem. 1978, 50(9), 1242-1246.
6. Kachar, B.; Zinner, K.; Vidigal, C. C. C.; Shimizu, Y.; Cilento, G. Arch. Biochem. Biophys. 1979, 195(1), 245-247.
7. Seitz, W. R.; Suydam, W.W.; Hercules, D. M. Anal. Chem. 1972, 44(61, 957-963.
8. Seitz, W. R.; Hercules, D. M. Anal. Chem. 1972, 44(13), 2143-2149.
9. Olsson, T.; Bergstrom, K.; Thore, A.; "Bioluminescence and Chemiluminescence", (Academic Press, 1981) pp 659-665.
10. Shaw, F. Analyst 1980, 105, 11-17.
11. Auses, J. P.; Cook, S. L.; Maloy J. T. Anal. Chem. 1975, 47(2), 244-249.
12. Bostick, D. T.; Hercules D. M. Anal. Chem. 1975, 47(3), 447-452.
13. Branchini, B. R.; Hermes, J. D.; Salituro, F. G.; Post, N. J.; Claeson, G. Anal. Biochem. 1981, 111, 87-96.
14. Ikariyama, Y.; Aizawa, M.; Suzuki, S. J. Solid-Pha:.e Biochem. 1980, ~, 223-233.
110
111
15. Lee, Y.; Jablonski, I.; DeLuca, M. Anal. Biochem. 1977, 80, 496-501.
16. Lippman, R. D. Anal. Chim. Acta. 1980, 116, 181-184.
17. Vogelhut, P. O. US Patant No. 4,231,754, Nov. 4, 1980.
18. Akazawa, T.; Conn, E. E. 1...:.. Biol. Chem. 1958, 232, 403-415.
19. Yamazaki, I.; Piette, L. H. Biochim. Biophys. Acta. 1963, 77, 47-64.
20. Yokota, K.; Yamazaki, I. Biochim. Biophys. Acta. 1965, 105, 301-312.
Zl. Arrio, B.; Lecuyer, B.; Dupaix, A.; Volfin, P.; Jousset, M.; Carrette, A. Biochimie 1980, 6Z, 445-453.
22. Zinner, K.; Personal communication, (December, 1982).
23. "Handbook of Chemistry and Physics", 59th edition; Weast, R. C. Ed.; CRC Press: Boca Raton, 1978-1979; p C-284.
24. Graichen, C.; Molitor, J. C. J.A.O.A.C. 1959, 42(1), 149-160.
25. Marshall, P. N.; Lewis S. M. Stain Technology. 1974, 49(4), 235-240.
26. Hammett, L. P. In "Physical Organic Chemistry"; McGraw-Hill: New York, 1940; pp 330-336.
27. Shaked, Z.; Whitesides, G. M. 1..:_ Amer. Chem. Soc., 1980, 102, 7105-7107.
ZS. Lillie, R. D. In "H. J. Conn's Biological Stains", 9th edition; Williams and Wilkins: Baltimore, 1977; p 335.
29. O'Brien, P. J.; Bechara E. J. H.; O'Brien C. R.; Duran, N.; Cilento, G. Biochem. Biophys. Res. Comm. 1978, 81(1), 75-81.
30. Kalyanaraman, V. S.; Kumar, S. A.; Mahadevan, S. Biochem. 1...:.. 1975, 149, 577-584.
112
31. Ya.ma.zaki, I. In "Molecular Mechanisms of Q}~ygen Activation"; Ha.ya.ishi, O. Ed.; Acedemic Press: New York, 1974; pp 539-544.
3Z. Kenten, R. H.; Mann, P. J. G. Biochem. 2.:.. 1950, 46(1), 67-73.
33. Grzywacz, J.; Smagowski, H. ~ Naturforschung 1965, 2oa, 1358-1363.
34. Nagase, T.; Ohno, T.; Goto, T. 2.:.. Pharm. Soc. Japan., 1951, 73, 1033-1039.
35. Hayaishi, 0. In "Molecular Mechanisms of Oxygen Activation"; Haya.ishi, O. Ed.; Acedemic Press: New York, 1974; pp 1-ZS.
36. Nisselba.um, J. S.; Green, S. Ana.l. Biochem. 1968, 27, 212-217.
37. Jablonski, E.; DeLuca, M. Clin. Chem. 1979, 25(9), 1622-1627.
38. Marshall, P. N.; Bentley, S. A.; Lewis, S. M. Stain Technology. 1975, 50(2), 107-113.

APPENDI}<: A
SOFTWARE GLOSSARY
113

114
FORTH WORD
MEAN
TYPE
COLON
BLOCK
292
STACK
addr count -- mean )
Takes the arithmetic mean of a list of floating point numbers which begins at 'addr' and is 'count' numbers in length. The floating point mean is returned on the stack.
VARIANCE COLON Z9Z addr count variance
Calculates the variance of a list of 'count' floating point numbers stored in memory starting at address 'addr'. The floating point variance is returned on the stack.
STD.DEV COLON 292 ( addr count -- std.dev )
Returns, on the stack, the floating point standard deviation of the series of 'count' floating point numbers in memory starting at address 'addr'.
SCOPE-TASK TASK 308 ( -- addr
ODAC
lDAC
SCOPE-TASK is the multiprogrammed task which provides a continuous XY oscilloscope display of a data set.
CONST 308 -- addr
A mnemonic constant which returns the address of DAC 0
CONST 308 ( -- addr )
A mnemonic constant for the address of DAC 1.
DATP.-ADDR VARIABLE 308 ( -- addr )
A variable which is used to transmit the address of the data array to be displayed from the terminal task to the scope task.
#POINTS VARIABLE 308 ( -- addr
A variable which is used to pass the length of the data array to the scope task from terminal task.

1SCAN
SCOPE
115
CODE 308 addr count -- )
Outputs the contents of a 16 bit integer data array to an XY oscilloscope, once, as fast as possible. As each datum is transmitted to the DAC it is scaled by a factor of 0.06247 to prevent the display from wrapping prematurely.
COLON 308 ( addr count
Initiate the repetitive XY display of a 16 bit integer data array on an oscilloscope. This routine calls lSCAN on every third tick of the 60 Hz clock to keep the screen refreshed.
SUSPEND COLON 308 ( task -- )
This definition is used to suspend an active task. It assumes that there are no special task shut down procedures such as the disabling of hardware interrupts. The task is disabled by simply forcing it to execute STOP the next time the task is activated. SUSPEND is usually used to kill a task which has been activated erroneously.
TICKS/DATUM VARIABLE 309 ( -- addr )
This variable hold the number of clock B ticks which must occur before the counter is read. Since the Conder clock can only produce frequencies which are powers of ten, this variable provides a simple yet flexible means of synchronizing data acquisition at frequencies which are not powers of ten.
ELAPSED-TICKS VARIABLE 309 ( addr
ELAPSED-TICKS is the variable which hold the number of ticks which have to occur before the counter is read. When ELAPSED-TICKS has been decremented to zero the counter is read and ELAPSED-TICKS is reset to the value of TICKS/DATUM.
<PC-EXPECT> ISR 309 -- addr )
<PC-EXPECT> is not a user executable definition, but is the interrupt service routine (ISR) for the pulse counting clock. This interrupt service routine is responsible for fielding all clock B
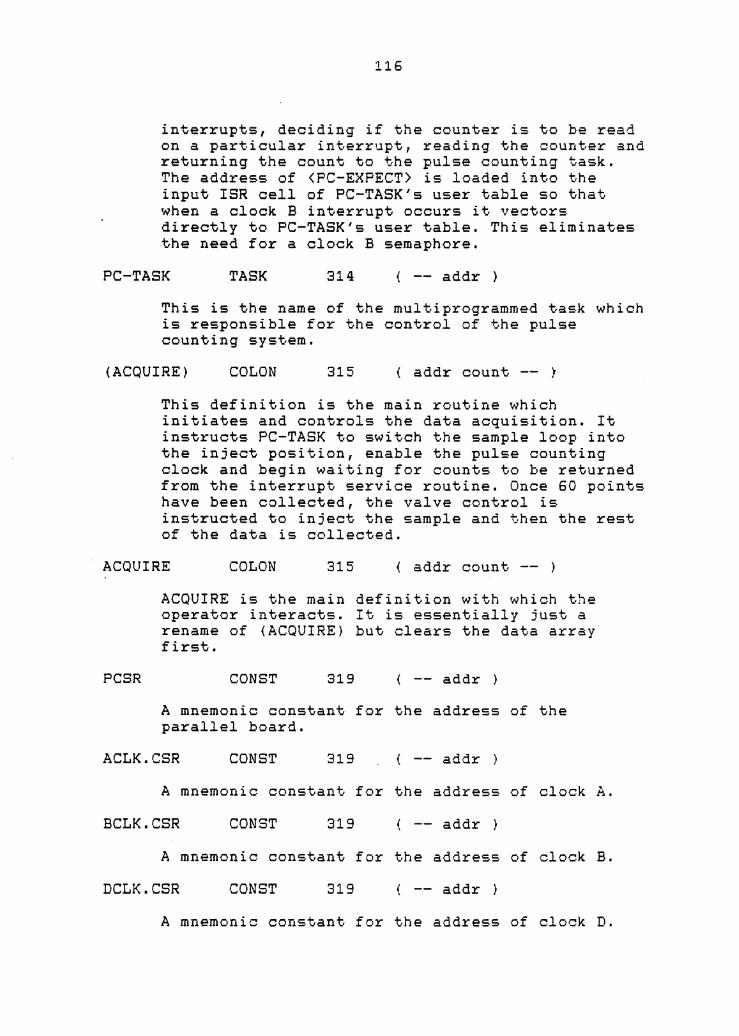
116
interrupts, deciding if the counter is to be read on a particular interrupt, reading the counter and returning the count to the pulse counting task. The address of <PC-EXPECT> is loaded into the input ISR cell of PC-TASK's user table so that when a clock B interrupt occurs it vectors directly to PC-TASK's user table. This eliminates the need for a clock B semaphore.
PC-TASK TASK 314 ( -- addr
This is the name of the multiprogrammed task which is responsible for the control of the pulse counting syst.em.
(ACQUIRE) COLON 315 ( addr count -- ~
This definition is the main routine which initiates and controls the data acquisition. It instructs PC-TASK to switch the sample loop into the inject position, enable the pulse counting clock and begin waiting for counts to be returned from the interrupt service routine. Once 60 points have been collected, the valve control is instructed to inject the sample and then the rest of the data is collected.
ACQUIRE COLON 315 addr count -- )
PCSR
ACQUIRE is the main definition with which the operator interacts. It is essentially just a rename of (ACQUIRE) but clears the data array first.
CONST 819 ( -- addr )
A mnemonic constant for the address of the parallel board.
ACLK.CSR CONST 319 ( -- addr )
A mnemonic constant for the address of clock A.
BCLK.CSR CONST 319 ( -- addr )
A mnemonic constant for the address of clock B.
DCLK.CSR CONST 319 ( -- addr )
A mnemonic constant for the address of clock D.

A CLOCK
VALVES
1VALVE
ZVALVE
117
VARIABLE 319 ( -- addr )
A semaphore used to contain the user table address of the task currently using clock A. When clock A is not in use this variable contains zero.
VARIABLE 319 ( -- addr )
This variable is a semaphore which is used to coordinate the concurrent operation of the clock A and clock D interrupt service routines and the valve control task. When a sample is injected the two Series 9 valves have to be open simultaneously which requires bot.h clock A and clock D to be enabled together. While both valves are open VALVES has a value of 2. When each of the two interrupt service routines recognize that it's time to close its respective valve each ISR will decrement VALVES. Whichever ISR decrements VALVES to zero is then the ISR responsible for reactivating the valve control task.
VARIABLE 319 ( -- addr )
1VALVE is the variable which contains the bit mask which the clock A interrupt service routine uses to tell which valve is to be controlled by clock A.
VARIABLE 319 ( -- addr )
Similar to 1VALVE, this variable contains the bit mask which the clock D ISR uses to tell which valve to open.
DAT-ADDR VARIABLE 319 ( -- addr )
This variable contains the absolute memory address of the most recently stored datum. When the VALVE-TASK is instructed by the PC-TASK to inject the sample, the value pointed to by DAT-ADDR is multiplied by Z to give an injection point marker in the data set ..
no name ISR 319 ( -- )
Lines 8 to 13 in block 319 define the clock A interrupt service routine.

D.CNT
D.CNTR
118
VARIABLE 320 -- addr
This variable serves as a flag to indicate to the clock D ISR when to begin acknowledging interrupts. When the interrupt enable bit is set, an interrupt occurs immediately. The time interval between this interrupt and the next interrupt does not necessarily represent one complete clock period. Consequently, D.CNT is initialized to -Z and is incremented each time an interrupt occurs. Once D.CNT has been incremented to zero the clock D ISR opens the valve and begins counting interrupts.
VARIABLE 320 ( -- addr )
D.CNTR holds the number of milliseconds for which the valve, being controlled by clock D, is to be held open. This variable is decremented on each interrupt and when it has been decremented to zero the ISR is responsible for closing the valve. The two variables D.CNT and D.CNTR are directly analogous to the user table variables CNT and CTR. VALVE-TASK's user table variables are unavailable to the clock D ISR because they are always used by the clock A ISR.
no name ISR 320 ( -- }
Lines 4 to 10 of block 320 define the clock D interrupt service routine.
(VALVE-ON) CODE 321 (maskl timel mask2 timeZ --
This routine is called by the valve control task to set up the masks and times for a particular valve operation, enables the appropriate clock(s) and then suspends the task until the valve operation is complete.
VALVE-ON COLON 321 (maskl timel maskZ timeZ -- }
VALVE-ON is just a high level version of (VALVE-ON) which also stores the address of VALVE-TASK's user table into the semaphore ACLOCK. Without this address the interrupt service routines would not know which task to reactivate after the completion of a valve operation.

MIX
INJECT
FILL
WASH
DRAIN
COLON 3 ,, .. w.J.
119
( -- }
Mixes the sample and the reagent streams by simultaneously opening the two Series 9 valves.
COLON 321 { -- )
Switch the sample loop into the inject position.
COLON 321 { -- )
Switch the sample loop back int.o the load position.
COLON 321 ( -- )
Open the sample stream injection valve to fill the cell with clean acetate buffer.
COLON 322 ( -- )
This definition is the one used to drain the cell of spent reactants. It could not be defined in terms of VALVE-ON because it requires three valves to be open simultaneously. Draining of the cell is not a time critical operation, therefore, it could be synchronized with the 60 Hz day clock.
VALVE-TASK TASK 322 ( -- addr )
RINSE
This is the multiprogrammed task which supervised the operation of all of the valves.
COLON 323 -- )
RINSE performs a complete rinse of the cell by draining, washing and redraining the cell.
LOAD-POSN COLON 323 ( -- )
A definition executed by PC-TASK to instruct VALVE-TASK to switch the sample loop into the load position.
INJECT-MARK COLON 323 ( -- )
INJECT-MARK is executed by VALVE-TASK to induce the injection point marker into the data set by doubling the datum pointed to by the variable DAT-ADDR.

lZO
INJECT-SAMPLE COLON 323 ( -- }
This definition is executed by PC-TASK and it instructs VALVE-TASK to inject the sample into the cell.
RINSE-CELL COLON 323 -- }
TAREA
RINSE-CELL is executed by PC-TASK to indicate to VALVE-TASK that the data acquisition is complete and that it should now rinse the cell. to inject the sample into the cell.
VARIABLE 325 -- addr
This is a floating point variable which holds the accumulated area during the integration of a peak.
BASELINE VARIABLE 325 -- addr )
HEIGHT
A floating point variable which hold the mean of the first 60 baseline values.
VARIABLE 325 -- addr
A floating point variable used in searching for the maximum value in a data array.
HEIGHTS COLON 325 ( addr -- }
PS HOW
Scans through a data array, calculates the mean baseline value, subtracts this mean baseline from the maximum value in the array to yield a corrected peak height and integrates the area of the peak.
COLON 325 ( sblk# eblk# -- )
Analyses a series of spectra which are stored contiguously, starting at block 'sblk#' and ending at block 'eblk#'.

tzt
S8NI~SI~ XHYM~AOS
S: iUCTN:Rdd'if
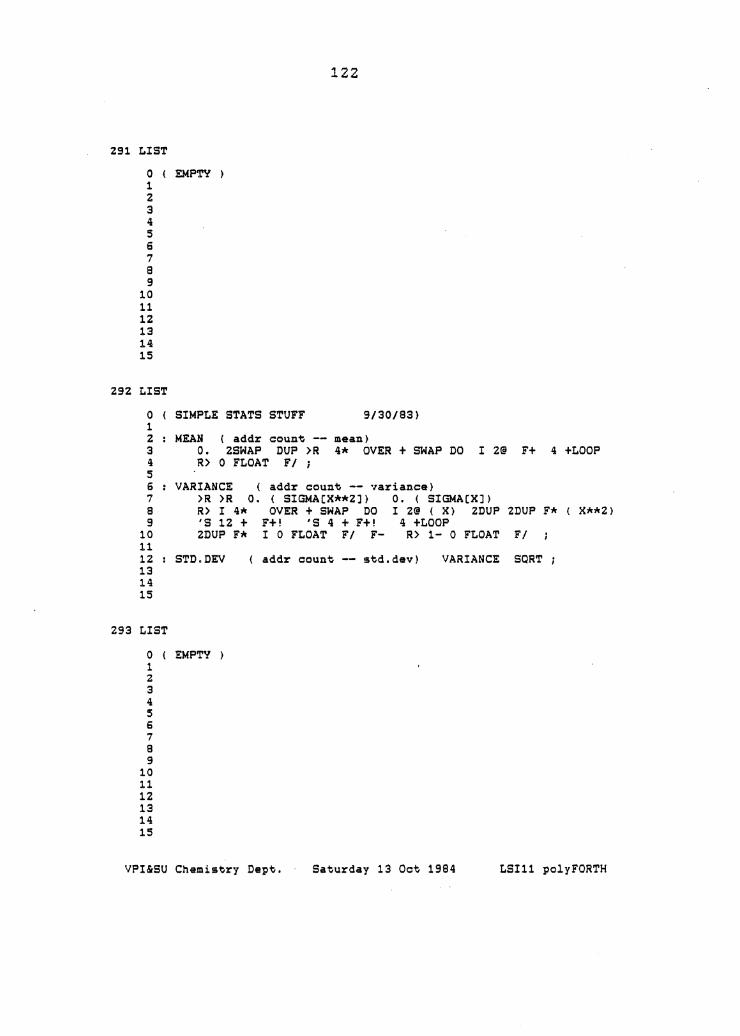
122
291 LIST
0 ( EMPTY ) 1 2 3 4 5 6 7 8 9
10 11 12 13 14 15
292 LIST
0 1 2 3 I}
s 6 7 8 9
10 11 12 13 14 15
293 LIST
SIMPLE STATS STUFF 9/30/83)
MEAN ( addr count mean) O. 2SWAP DUP >R 4* OVER + SWAP DO I 2@ R> 0 FI.OAT F/ ;
VARIANCE ( addr count -- variance) >R >R O. ( SIGMACX**2J) O. ( SIGMA(XJ) R> I 4* OVER + SWAP DO I 2@ ( X) 2DUP 'S 12 + F+! 'S 4 + F+! 4 +LOOP 2DUP F* I 0 FI.OAT F/ F- R> 1- 0 FLOAT
STD.DEV addr count -- std.dev) VARIANCE
0 EMPTY ) 1 2 3 4 5 6 7 8 9
10 11 12 13 14 15
F+ 4 +LOOP
2DUP F* ( X**Z>
Fl
SQRT ;
VPI&SU Chemistry Dept. Saturday 13 Oct 1984 LSI11 polyFORTH

306
307
308
123
LIST
0 EMPTY ) 1 2 3 4 5 6 7 8 9
10 11 12 13 14 15
LIST
0 EMPTY ) 1 2 3 4 5 6 7 B 9
10 11 12 13 14 15
LIST
0 ( SCOPE DISPLAY TASK) OCTAL 1 177560 160 300 TERMINAL SCOPE-TASK SCOPE-TASK CONSTRUCT 2 176760 CONSTANT ODAC ODAC 2 + CONSTANT 1DAC 3 VARIABLE DATA-ADDR VARIABLE #POINTS 4 5 6 7 B 9
10 11 12 13 14 15
CODE 1SCAN ( addr cnt -- ) R -) U MOV R -) 4 MOV 2 S >+ MOV 4 S >+ MOV ( load data address and count) U CLR ( set x coordinate to zero) 4 >+ TST BEGIN 0 4 )+ MOV 3777 t 0 MUL 77777 t 0 DIV ODAC 0 MOV
lDAC U MOV 4 )+ TST U 10 t ADD 2 SOB 4 R l+ MOV U R >+ MOV NEXT
SCOPE ( addr cnt -- ) #POINTS ! DATA-ADDR ! SCOPE-TASK ACTIVATE
BEGIN DATA-ADDR @ #POINTS @ lSCAN 60 MS 0 END SUSPEND ( task -- ) ACTIVATE STOP ; DECIMAL
VPI&SU Chemistry Dept. Saturday 13 Oct 1984 LSI11 polyFORTH

124
309 LIST
310
311
0 ( CLOCK INTERRUPT HANDLER 1 VARIABLE TICKS/DATUM
TO READ ORTEC 707) BASE @ OCTAL ( clock ticks to elapse between data) ( elapsed tick counter ) Z VARIABLE ELAPSED-TICKS
3 4 CREATE <PC-EXPECT> ASSEMBLER 5 6 7 8 9
10 11 1Z 13 14 15
LIST
0 1 z 3 4 5 6 7 8 9
10 11 1Z 13 14 15
LIST
0 1 z 3 4 5 6 7 8 9
10 11 1Z 13 14 15
U ' H @ # SUB ELAPSED-TICKS DEC O= IF
( point to head of user table ( collect data this tick ?
ELAPSED-TICKS TICKS/DATUM MOV ( reset tick counter R -> S MOV ( save interrupt user's param stack S STATUS 4 + U) MOV ( get calling user's param stack R -) S )+ MOV ( save calling user's return stack R -) S >+ MOV ( save calling user's instruct ptr R -) 0 MOV --> ( save all of the registers used
CLOCK INTERRUPT HANDLER R -) 1 MOV R -) Z MOV R -) 4 MOV Z lZ # MOV PCSR 1 # BIS BEGIN
PCSR TST O< END
TO READ ORTEC 707 cont.) ( ( ( ( ( ( ( (
load radi~ for number conversion initiate the readout sequence wait for "start data transfer"
( read the most significant digit ( mask off bits 4-15
) ) )
) ) ) ) ) ) )
S -) PCSR 4 + MOV S > 177760 # BIC S -) CLR 4 5 # MOV
( (
make it a double precision integer ) set up loop cntr for 5 more digits )
BEGIN -> ( convert the incoming BCD digits to a binary number by ( multiplying the 3Z bit integer on the stack by the radix
CLOCK INTERRUPT HANDLER TO READ ORTEC 707 cont.) ( and then adding in the next digit
0 Z S) MOV ( get low word of developing integer Z O MUL ( multiply it by ten Z S) 1 MOV ( restore low word of product R -) 0 MOV ( save the high word of product 0 S ) MOV ( get the high word of the integer Z 0 MUL ( multiply it by the radix S ) 1 MOV ( store low word of this product as
s R >+ ADD
S -) PCSR 4 + MOV S ) 177760 t BIC Z S) S )+ ADD
( high word of developing integer ( add any carry from the first mult. ( into the high word of the integer) ( get next digit from the counter ) ( mask off bits 4-15 ) ( add this digit into the integer )
S ) ADC --> ( not to forget the possible carry )
VPI&SU Chemistry Dept. Saturday 13 Oct 1984 LSill polyFORTH
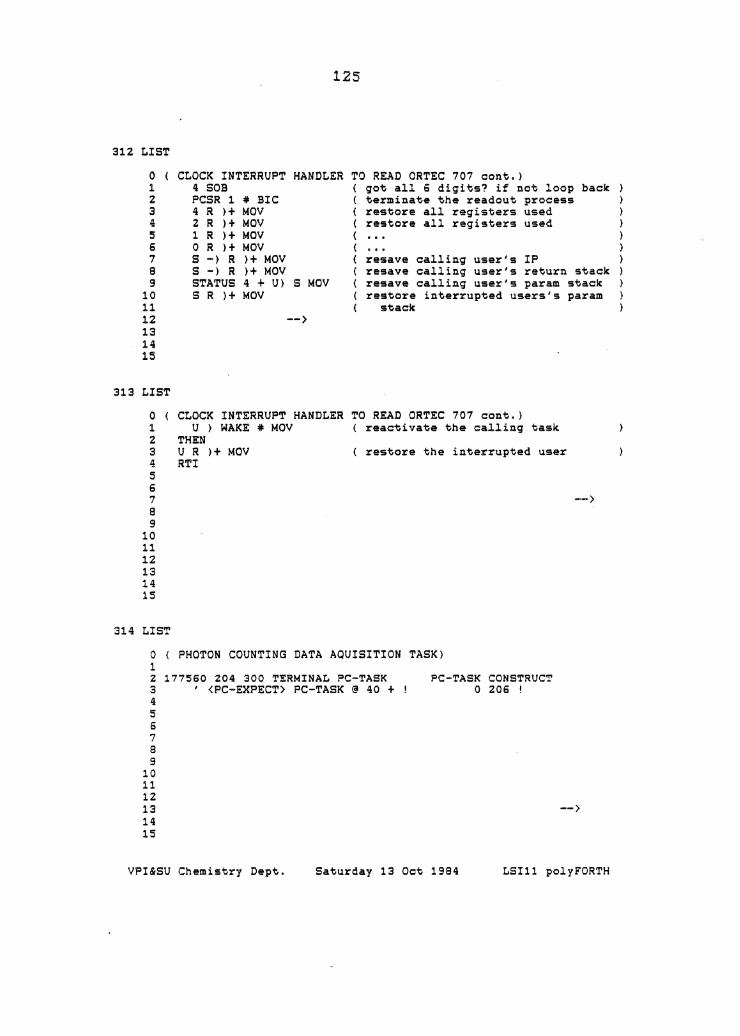
125
312 LIST
0 CLOCK INTERRUPT HANDLER TO RE.~D ORTEC 707 cont.) 1 4 SOB ( got all 6 digits? if not loop back 2 PCSR 1 # BIC ( terminate the readout process 3 4 R >+ MOV ( restore all registers used 4 2 R >+ MOV ( restore all registers used 5 1 R )+ MOV ( 6 0 R >+ MOV ( 7 s -) R )+ MOV ( resave calling user's IP 8 s -) R >+ MOV ( resave calling user's return stack 9 STATUS 4 + U) S MOV ( resave calling user's param stack
10 S R >+ MOV ( restore interrupted users's param 11 ( stack 12 --> 13 14 15
313 LIST
0 CLOCK INTERRUPT HANDLER TO READ ORTEC 707 cont,) 1 U ) WAKE # MOV ( reactivate the calling task 2 THEN 3 U R >+ MOV ( restore the interrupted user 4 RTI 5 6 7 -> 8 9
10 11 12 13 14 lS
314 LIST
0 PHOTON COUNTING DATA AQUISITION TASK) 1 Z 177560 Z04 300 TERMINAL PC-TASK PC-TASK CONSTRUCT 3 I <PC-EXPECT> PC-TASK @ 40 + ! 0 206 ! 4 s 6 7 8 9
10 11 12 13 --> 14 15
VPI&SU Chemistry Dept. Saturday 13 Oct 1994 LSI11 polyFORTH
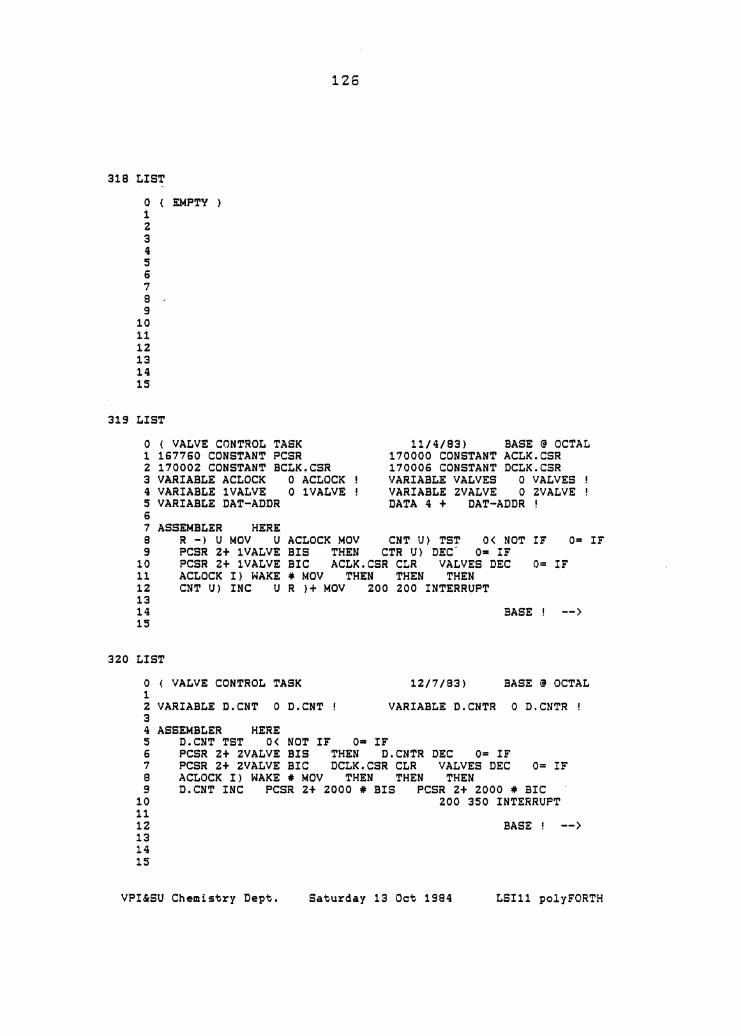
318
319
1Z6
LIST
0 EMF'TY ) 1 2 3 4 5 6 7 9 9
10 11 12 13 14 15
LIST
0 ( VALVE CONTROL 1 167760 CONSTANT 2 170002 CONSTANT 3 VARIABLE ACLOCK 4 VARIABLE lVALVE
TASK PCSR BCLK.CSR
11/4/83) BASE @ OCTAL 170000 CONSTANT ACLK.CSR 170006 CONSTANT DCLK.CSR VARIABLE VALVES 0 VALVES VARIABLE ZVALVE 0 ZVALVE DATA 4 + DAT-ADDR 5 VARIABLE DAT-ADDR
6 7 8 9
10 11 12 13 14 15
ASSEMBLER HERE R -) U MOV U PCSR 2+ lVALVE PCSR z+ lVALVE ACLOCK I) WAKE CNT U) INC U
0 ACLOCK 0 lVALVE
ACLOCK MOV CNT U) TST O< NOT IF O= IF BIS THEN CTR U) DEC' O= IF BIC ACLK.CSR CLR VALVES DEC # MOV THEN THEN THEN R >+ MOV 200 200 INTERRUPT
BASE
O= IF
-->
320 LIST
0 1
VALVE CONTROL TASK BASE @ OCTAL
2 VARIABLE D.CNT 3
0 D.CNT
12/7/93)
VARIABLE D.CNTR 0 D.CNTR !
4 5 6 7 8 9
10 11 12 13 14 15
ASSEMBLER HERE D.CNT TST O< NOT IF Oa IF PCSR 2+ 2VALVE BIS THEN D.CNTR DEC O= IF PCSR 2+ 2VALVE BIC DCLK.CSR CLR VALVES DEC ACLOCK I) WAKE # MOV THEN THEN THEN
O= IF
D.CNT INC PCSR 2+ 2000 # BIS PCSR Z+ 2000 # BIC 200 350 INTERRUPT
BASE ! -->
VPI&SU Chemistry Dept. Saturday 13 Oct 1994 LSI11 polyFORTH

127
321 LIST
0 VALVE CONTROL TASK 12/6/83) OCTAL 1 2 CODE (VALVE-ON) ( valve.mask.1 open.time.1 valve.mask.2 3 open.time.2 -- ) 4 D.CNTR s >+ MOV D.CNT -2 f. MOV 2VALVE S >+ MOV 5 O= NOT IF VALVES INC DCLK.CSR 103 f. MOV PCSR 100 f. BIS 6 THEN CTR U) S )+ MOV CNT U) -1 f. MOV lVALVE S l+ MOV 7 VALVES INC ACLK.CSR 103 f. MOV WAIT JMP DECIMAL 8 9 VALVE-ON A CLOCK GET (VALVE-ON) A CLOCK RELEASE
10 11 MIX 1 1300 2 800 VALVE-ON 12 INJECT 4 800 0 0 VALVE-ON 13 FILL 16 BOO 0 0 VALVE-ON 14 WASH 1 900 0 0 VALVE-ON 15 -->
322 LIST
0 1 2 3 4 s 6 7
VALVE CONTROL TASK
DRAIN ( -- ) 128 PCSR 2+ 448 PCSR 2+
64 PCSR 2+
200 MS 2000 MS
500 MS
12/6/83)
192 PCSR 2+ 192 PCSR 2+
0 PCSR 2+
200 MS 500 MS
8 OCTAL 9 177560 160 400 TERMINAL VALVE-TASK VALVE-TASK CONSTRUCT
DECIMAL 10 11 12 13 14 15
323 LIST
0 l z 3 4 s 6 7 8 9
10 11 12 13 14 15
VALVE CONTROL TASK lZ/7/83)
RINSE ( -- ) DRAIN FILL 500 MS WASH 1000 MS 1000 MS WASH 1000 MS DRAIN 1000 MS DRAIN ;
LOAD-POSN -- ) VALVE-TASK ACTIVATE INJECT STOP
INJECT-MARK ROT 2 ! ;
DAT-ADDR @ 4 - DUP Z@
INJECT-SAMPLE -- ) VALVE-TASK ACTIVATE INJECT-MARK MIX STOP ;
ZDUP
RINSE-CELL ( -- VALVE-TASK ACTIVATE RINSE STOP
-->
DRAIN
D+
VPI&SU Chemistry Dept. Saturday 13 Oct 1984 LS!ll polyFORTH

324
325
128
LIST
0 EMPTY ) 1 2 3 4 5 6 7 8 9
10 11 12 13 14 15
LIST
0 ( PEAK INTEGRATION TEST STUFF) 1 292 LOAD ( STATS STUFF)
2VARIABLE TAREA 2VARIABLE HEIGHT
ZVARIABLE BASELINE 2 3 4 5 6 7 8 9
HEIGHTS ( addr -- ) O. TAREA Z! O. HEIGHT 2!
10 11 12 13 14 15
PSHOW
DUP 50 MEAN BASELINE Z! DUP 992 + SWAP 224 + DO 2DUP TAREA F+! HEIGHT Z@
." Area=" TAREA Z@ E.
( sblk• dblk• -- )
I 2@ BASELINE 2@ F-FMAX HEIGHT 2! 4 +LOOP
Height =" HEIGHT Z@ E.
1+ SWAP DO CR I DUP 3 U.R 2 SPACES BLOCK AREA LOOP
326 LIST
0 EMPTY ) 1 z 3 4 5 6 7 8 9
10 11 12 13 14 15
VPI&SU Chemistry Dept. Saturday 13 Oct 1984 LSI11 polyFORTH

The vita has been removed from the scanned document

THE DESIGN AN APPLICATION
OF AN AUTOMATED LUMINOMETER
FOR CHEMILUMINESCENCE
by
Ian Chapple
(Abstract)
An automated luminometer was designed and constructed
to facilitate the investigation of reaction conditions and
quantitation of the chemiluminescence observed during the
oxidation of NADH by horse radish peroxidase in the
presence of eosin.
The luminometer design incorporates a computer
controlled reagent induction system, pulse counting
detector and real time display of luminescence profiles.
Each of the major reaction conditions was studied
individually to determine the most favorable conditions
for the analytical application of this reaction. In
addition, this chemiluminescent reaction was studied to
determine if the luminescing species is recycled. If this
were the case it would provide the first essential step
necessary for the future design of a chemiluminescent
probe that could be reuseable or be used for continuous
monitoring.
During the course of this investigation it was
observed that the luminescing species, eosin, was being

bleached. A number of experiments were undertaken to
determine the nature of the bleaching process. Those stef~
which suppressed the bleaching process, unfortunately,
also suppressed the emission process.
Despite the fact that this reaction does not appear
to recycle the luminescing species, it does provide a
chemiluminescent method for the determination of NADH over
the range 5x10⁻⁶M to 5x10⁻⁴M. This chemiluminescent
reaction has also been coupled to several enzyme systems,
which reduce NAD+ to NADH, in order to obtain a
chemiluminescent signal proportional to the substrate
concentration.