desirable dairy how innovation and agility drive ... · dano daily pushti, is a recent launch in...
TRANSCRIPT

Desirable dairy – how innovation and agility drive sustainability at Arla

42.8% Fresh dairy
23.4%Cheese
13.0%Butter and spreads
12.9%Milk powder and
Whey proteins
7.9%Other
Our productssplit by categories

Why sustainability?• Global temperature
expected to increaseby 4 ⁰C
• World population growing for 9 billions in 2050
• By now: 7.2 billions
• Demand for dairy products are expected to double by 2050
• IPCC: 1-6 ⁰C by the end of this century
• 20% reduction in GHG emissions 1990 - 2020
• EU climate and energypackage
The global (dairy) dilemma

Full report available at:
Most important environmental impact categories for Arla Foods –calculated via Environmental Profit and Loss Accounting (E P&L)
http://eng.mst.dk/media/176132/arla-foods-epl.pdf
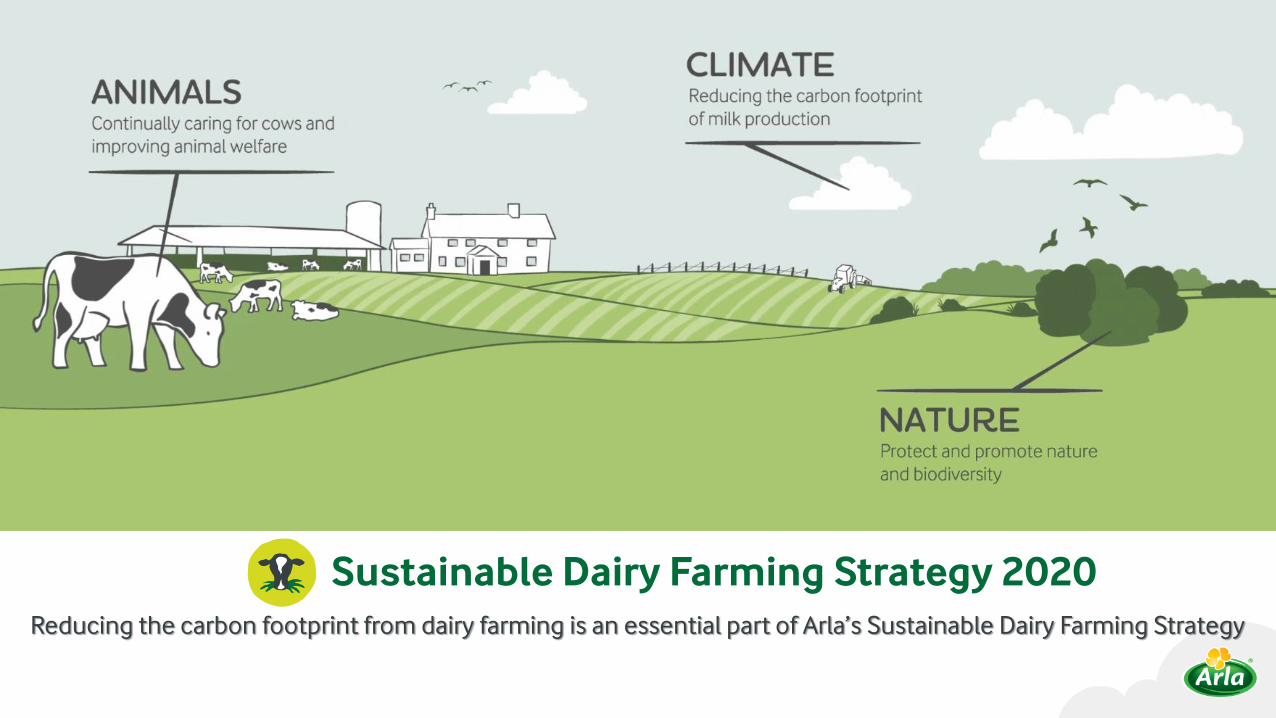
Sustainable Dairy Farming Strategy 2020Reducing the carbon footprint from dairy farming is an essential part of Arla’s Sustainable Dairy Farming Strategy
0
2
4
6
8
10
12
14
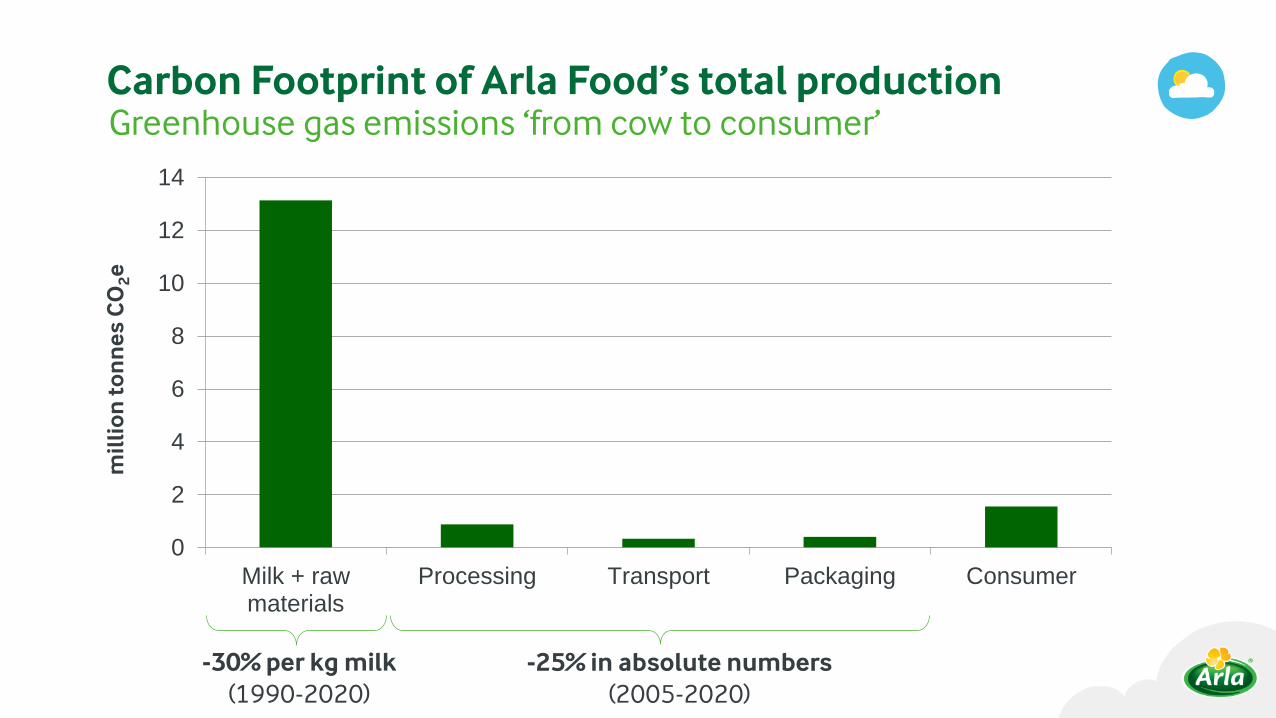
Milk + rawmaterials
Processing Transport Packaging Consumer
Carbon Footprint of Arla Food’s total productionGreenhouse gas emissions ‘from cow to consumer’
mil
lio
n t
on
ne
s C
O2e
-30% per kg milk(1990-2020)
-25% in absolute numbers(2005-2020)

Activities on farm level
* Germany, Luxembourg, Netherlands and Belgium
Carbon assessments, energy assessments, farm work shops
Carbon assessment Energy assessment Farm work shops
UK 2010-2016UK 2017
2433312
--
49659
Sweden 2013 – 2016Sweden 2017
54638
34824
55-
Denmark 2013 - 2016Denmark 2017
1011179
22-
39-
Central Europe* 2013-2016Central Europe 2017
48
--
-12
Total 2010 - 2017 4533 394 661
Over 4500 carbon assessments completed in the UK, Sweden and Denmark, Arla’s farmer owners have taken a significant step towards reaching the target of reducing their carbon footprint by 30 per cent in 2020, compared to 1990. In 2017 the carbon footprint from Arla farms was reduced by 23 per cent compared to 1990. From 2017, farmers in Germany and Benelux have joined the carbon assessments
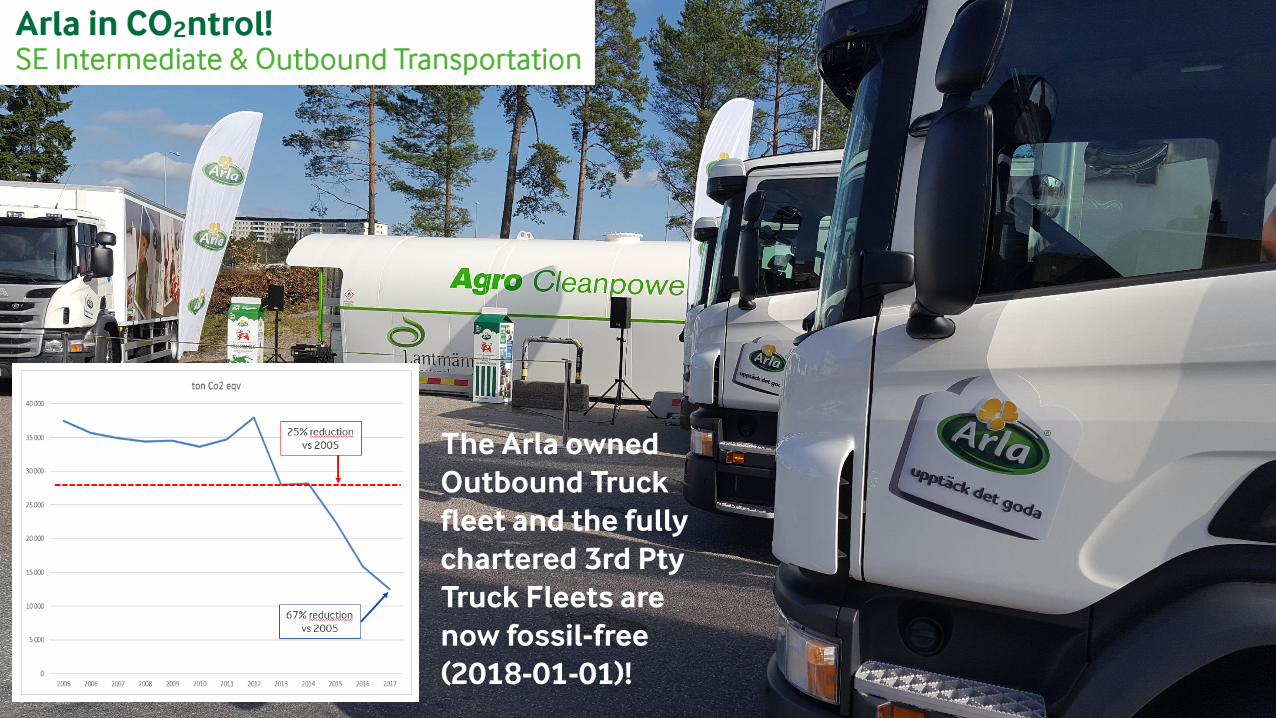
The Arla ownedOutbound Truck fleet and the fullychartered 3rd PtyTruck Fleets are now fossil-free (2018-01-01)!

Innovating sustainablyExample: Affordable nutrition for base-of-pyramid consumers
Our Research and NPD (new product development) teams work together to build on local knowledge, consumer tastes and regulatory networks to develop improved formulations for launch into a new market.
Dano Daily Pushti, is a recent launch in Bangladesh. It is produced from high quality milk ingredients. It is high in milk protein, calcium, vitamin A and vitamin D, the key ingredients for your family everyday health.
Nutritional education and sampling in schools & garment factories

Research activities in sustainable dairy farmingWhat we do today and what’s needed
Feed productionMethane (cow)Methane (manure)Nitrogen useAmmoniaDiesel (CO2)Electricity (CO2)Biogenic CO2PhosphorWaterEnvironmental footprintWaste
Future research topics linked to Arla’s sustainable dairy farming
Working in partnerships:

Thank You
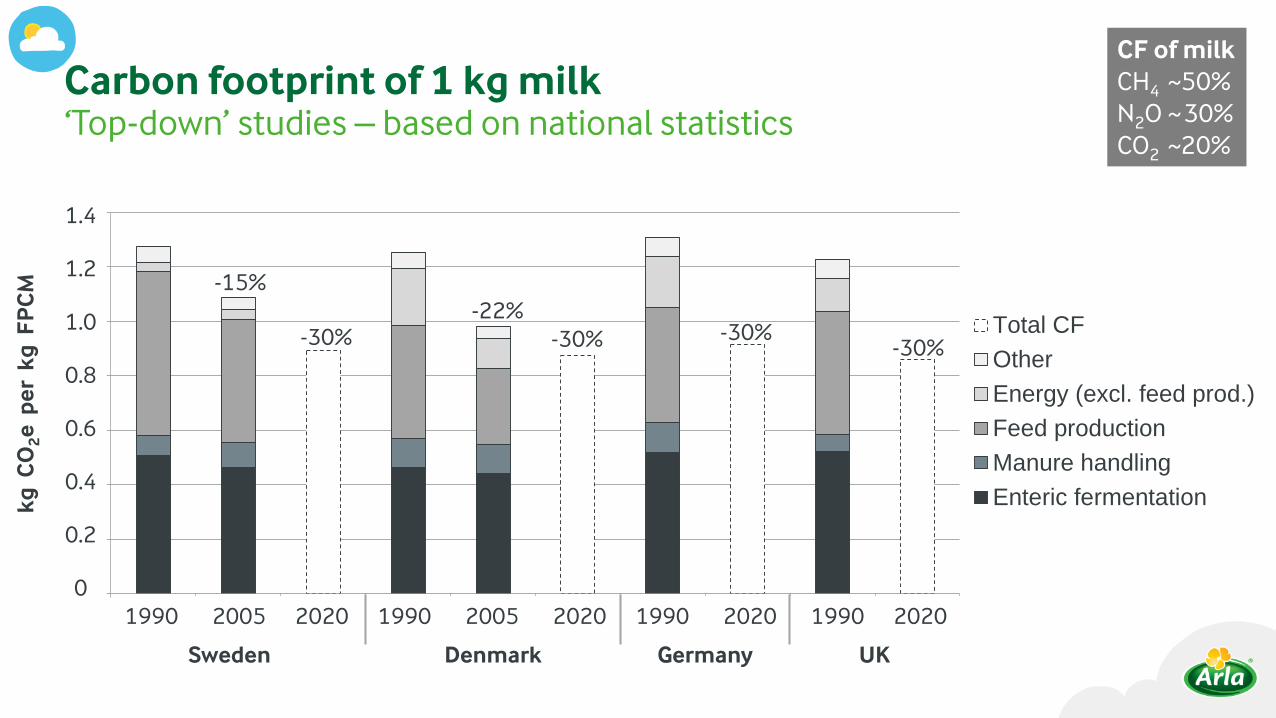
Carbon footprint of 1 kg milk‘Top-down’ studies – based on national statistics
0.0
0.2
0.4
0.6
0.8
1.0
1.2
1.4
1990 2005 2020 1990 2005 2020 1990 2020 1990 2020
Total CF
Other
Energy (excl. feed prod.)
Feed production
Manure handling
Enteric fermentation
1.4
1.2
1.0
0.8
0.6
0.4
0.2
0
kg
CO
2e
pe
r k
g F
PC
M
1990 2005 2020 1990 2005 2020 1990 2020 1990 2020
Sweden Denmark Germany UK
-15%-22%
-30% -30% -30%-30%
CF of milkCH4 50%N2O 30%CO2 20%
~~~
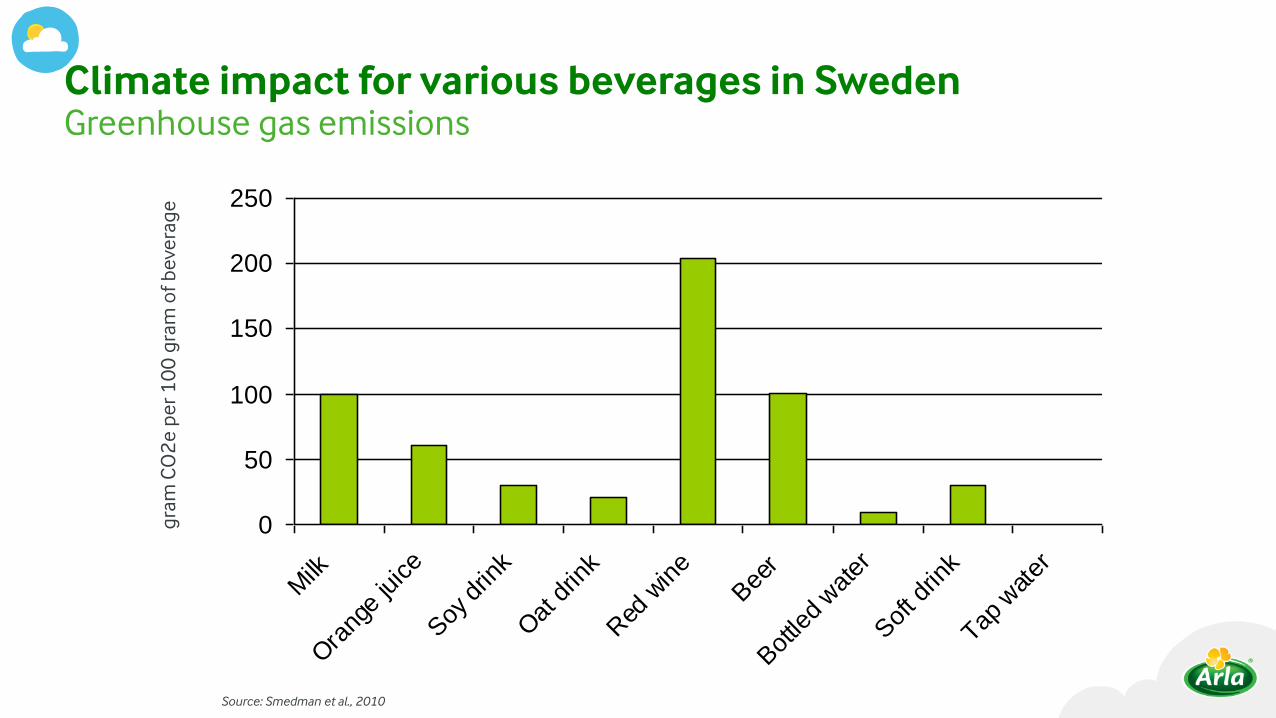
Climate impact for various beverages in Sweden
Source: Smedman et al., 2010
Greenhouse gas emissionsg
ram
CO
2e
pe
r 1
00
gra
m o
f b
eve
rag
e
0
50
100
150
200
250
Milk
Ora
nge
juice
Soy
drin
k
Oat
drin
k
Red
win
e
Bee
r
Bot
tled
wat
er
Sof
t drin
k
Tap w
ater

Nutrient density for various beverages in Sweden
0
10
20
30
40
50
60
Milk
Ora
nge
juice
Soy
drin
k
Oat
drin
k
Red
win
e
Bee
r
Bot
tled
wat
er
Sof
t drin
k
Tap w
ater
Source: Smedman et al., 2010

Lab scale Pilot scale Semi production scale
Towards sustainable protein supply for feed and food
Why? To cover the Danish need for protein in animal production
yield: 11.000 kg DM/ha and 2.500 kg protein/ha
4,4 mill t DM 1 mill t protein
Yearly consumption: 2,7 mill t protein
Production in DK: 1,7 mill t protein
Import: 1 mill t protein
Scenario: Clover/grass/lucerne on
400.000 ha