designing qc rules in the presence of laboratory bias ...qcnet.com/portals/0/events/aacc abst poster...
TRANSCRIPT
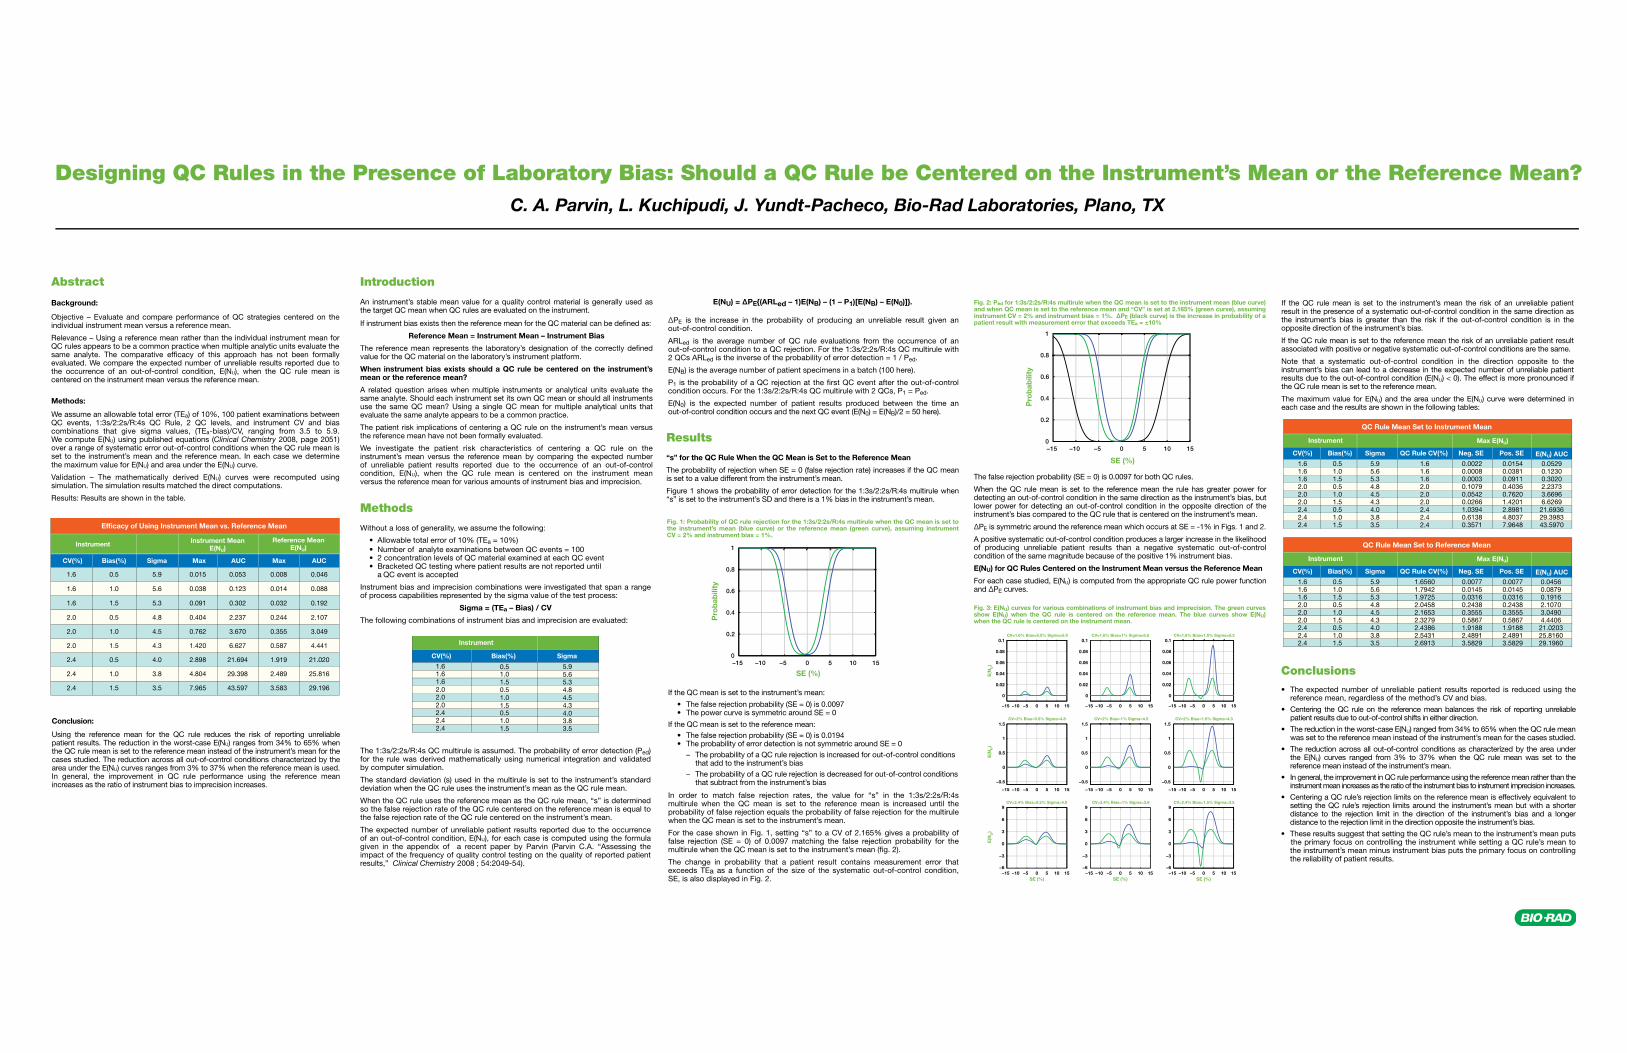
Designing QC Rules in the Presence of Laboratory Bias: Should a QC Rule be Centered on the Instrument’s Mean or the Reference Mean? C. A. Parvin, L. Kuchipudi, J. Yundt-Pacheco, Bio-Rad Laboratories, Plano, TX
Results
“s” for the QC Rule When the QC Mean is Set to the Reference Mean
The probability of rejection when SE = 0 (false rejection rate) increases if the QC mean is set to a value different from the instrument’s mean.
Figure 1 shows the probability of error detection for the 1:3s/2:2s/R:4s multirule when “s” is set to the instrument’s SD and there is a 1% bias in the instrument’s mean.
ΔPE is the increase in the probability of producing an unreliable result given an out-of-control condition.
ARLed is the average number of QC rule evaluations from the occurrence of an out-of-control condition to a QC rejection. For the 1:3s/2:2s/R:4s QC multirule with 2 QCs ARLed is the inverse of the probability of error detection = 1 / Ped.
E(NB) is the average number of patient specimens in a batch (100 here).
P1 is the probability of a QC rejection at the first QC event after the out-of-control condition occurs. For the 1:3s/2:2s/R:4s QC multirule with 2 QCs, P1 = Ped.
E(N0) is the expected number of patient results produced between the time an out-of-control condition occurs and the next QC event (E(N0) = E(NB)/2 = 50 here).
In order to match false rejection rates, the value for “s” in the 1:3s/2:2s/R:4s multirule when the QC mean is set to the reference mean is increased until the probability of false rejection equals the probability of false rejection for the multirule when the QC mean is set to the instrument’s mean.
For the case shown in Fig. 1, setting “s” to a CV of 2.165% gives a probability of false rejection (SE = 0) of 0.0097 matching the false rejection probability for the multirule when the QC mean is set to the instrument’s mean (fig. 2).
The change in probability that a patient result contains measurement error that exceeds TEa as a function of the size of the systematic out-of-control condition, SE, is also displayed in Fig. 2.
Abstract
Background:
Objective – Evaluate and compare performance of QC strategies centered on the individual instrument mean versus a reference mean.
Relevance – Using a reference mean rather than the individual instrument mean for QC rules appears to be a common practice when multiple analytic units evaluate the same analyte. The comparative efficacy of this approach has not been formally evaluated. We compare the expected number of unreliable results reported due to the occurrence of an out-of-control condition, E(NU), when the QC rule mean is centered on the instrument mean versus the reference mean.
Methods:
We assume an allowable total error (TEa) of 10%, 100 patient examinations between QC events, 1:3s/2:2s/R:4s QC Rule, 2 QC levels, and instrument CV and bias combinations that give sigma values, (TEa-bias)/CV, ranging from 3.5 to 5.9. We compute E(NU) using published equations (Clinical Chemistry 2008, page 2051) over a range of systematic error out-of-control conditions when the QC rule mean is set to the instrument’s mean and the reference mean. In each case we determine the maximum value for E(NU) and area under the E(NU) curve.
Validation – The mathematically derived E(NU) curves were recomputed using simulation. The simulation results matched the direct computations.
Results: Results are shown in the table.
Conclusion: Using the reference mean for the QC rule reduces the risk of reporting unreliable patient results. The reduction in the worst-case E(NU) ranges from 34% to 65% when the QC rule mean is set to the reference mean instead of the instrument’s mean for the cases studied. The reduction across all out-of-control conditions characterized by the area under the E(NU) curves ranges from 3% to 37% when the reference mean is used. In general, the improvement in QC rule performance using the reference mean increases as the ratio of instrument bias to imprecision increases.
Introduction
An instrument’s stable mean value for a quality control material is generally used as the target QC mean when QC rules are evaluated on the instrument.
If instrument bias exists then the reference mean for the QC material can be defined as:
Reference Mean = Instrument Mean – Instrument Bias
The reference mean represents the laboratory’s designation of the correctly defined value for the QC material on the laboratory’s instrument platform.
When instrument bias exists should a QC rule be centered on the instrument’s mean or the reference mean?
A related question arises when multiple instruments or analytical units evaluate the same analyte. Should each instrument set its own QC mean or should all instruments use the same QC mean? Using a single QC mean for multiple analytical units that evaluate the same analyte appears to be a common practice.
The patient risk implications of centering a QC rule on the instrument’s mean versus the reference mean have not been formally evaluated.
We investigate the patient risk characteristics of centering a QC rule on the instrument’s mean versus the reference mean by comparing the expected number of unreliable patient results reported due to the occurrence of an out-of-control condition, E(NU), when the QC rule mean is centered on the instrument mean versus the reference mean for various amounts of instrument bias and imprecision.
Methods
Without a loss of generality, we assume the following:
• Allowable total error of 10% (TEa = 10%) • Number of analyte examinations between QC events = 100 • 2 concentration levels of QC material examined at each QC event • Bracketed QC testing where patient results are not reported until a QC event is accepted
Instrument bias and imprecision combinations were investigated that span a range of process capabilities represented by the sigma value of the test process:
Sigma = (TEa – Bias) / CV
The following combinations of instrument bias and imprecision are evaluated:
The 1:3s/2:2s/R:4s QC multirule is assumed. The probability of error detection (Ped) for the rule was derived mathematically using numerical integration and validated by computer simulation.
The standard deviation (s) used in the multirule is set to the instrument’s standard deviation when the QC rule uses the instrument’s mean as the QC rule mean.
When the QC rule uses the reference mean as the QC rule mean, “s” is determined so the false rejection rate of the QC rule centered on the reference mean is equal to the false rejection rate of the QC rule centered on the instrument’s mean.
The expected number of unreliable patient results reported due to the occurrence of an out-of-control condition, E(NU), for each case is computed using the formula given in the appendix of a recent paper by Parvin (Parvin C.A. “Assessing the impact of the frequency of quality control testing on the quality of reported patient results,” Clinical Chemistry 2008 ; 54:2049-54).
Instrument
CV(%) Bias(%) Sigma Max AUC Max AUC
Instrument MeanE(NU)
1.6
1.6
1.6
2.0
2.0
2.0
2.4
2.4
2.4
0.5
1.0
1.5
0.5
1.0
1.5
0.5
1.0
1.5
5.9
5.6
5.3
4.8
4.5
4.3
4.0
3.8
3.5
0.015
0.038
0.091
0.404
0.762
1.420
2.898
4.804
7.965
0.053
0.123
0.302
2.237
3.670
6.627
21.694
29.398
43.597
0.046
0.088
0.192
2.107
3.049
4.441
21.020
25.816
29.196
0.008
0.014
0.032
0.244
0.355
0.587
1.919
2.489
3.583
Reference MeanE(NU)
Efficacy of Using Instrument Mean vs. Reference Mean
Instrument
CV(%) Bias(%) Sigma
1.61.61.62.02.02.02.42.42.4
0.51.01.50.51.01.50.51.01.5
5.95.65.34.84.54.34.03.83.5
The false rejection probability (SE = 0) is 0.0097 for both QC rules.
When the QC rule mean is set to the reference mean the rule has greater power for detecting an out-of-control condition in the same direction as the instrument’s bias, but lower power for detecting an out-of-control condition in the opposite direction of the instrument’s bias compared to the QC rule that is centered on the instrument’s mean.
ΔPE is symmetric around the reference mean which occurs at SE = -1% in Figs. 1 and 2.
A positive systematic out-of-control condition produces a larger increase in the likelihood of producing unreliable patient results than a negative systematic out-of-control condition of the same magnitude because of the positive 1% instrument bias.
E(NU) for QC Rules Centered on the Instrument Mean versus the Reference Mean
For each case studied, E(NU) is computed from the appropriate QC rule power function and ΔPE curves.
If the QC rule mean is set to the instrument’s mean the risk of an unreliable patient result in the presence of a systematic out-of-control condition in the same direction as the instrument’s bias is greater than the risk if the out-of-control condition is in the opposite direction of the instrument’s bias.
If the QC rule mean is set to the reference mean the risk of an unreliable patient result associated with positive or negative systematic out-of-control conditions are the same.
Note that a systematic out-of-control condition in the direction opposite to the instrument’s bias can lead to a decrease in the expected number of unreliable patient results due to the out-of-control condition (E(NU) < 0). The effect is more pronounced if the QC rule mean is set to the reference mean.
The maximum value for E(NU) and the area under the E(NU) curve were determined in each case and the results are shown in the following tables:
If the QC mean is set to the instrument’s mean:
• The false rejection probability (SE = 0) is 0.0097 • The power curve is symmetric around SE = 0
If the QC mean is set to the reference mean: • The false rejection probability (SE = 0) is 0.0194 • The probability of error detection is not symmetric around SE = 0 – The probability of a QC rule rejection is increased for out-of-control conditions that add to the instrument’s bias – The probability of a QC rule rejection is decreased for out-of-control conditions that subtract from the instrument’s bias
Pro
bab
ility
Conclusions• The expected number of unreliable patient results reported is reduced using the reference mean, regardless of the method’s CV and bias.
• Centering the QC rule on the reference mean balances the risk of reporting unreliable patient results due to out-of-control shifts in either direction.
• The reduction in the worst-case E(NU) ranged from 34% to 65% when the QC rule mean was set to the reference mean instead of the instrument’s mean for the cases studied.
• The reduction across all out-of-control conditions as characterized by the area under the E(NU) curves ranged from 3% to 37% when the QC rule mean was set to the reference mean instead of the instrument’s mean.
• In general, the improvement in QC rule performance using the reference mean rather than the instrument mean increases as the ratio of the instrument bias to instrument imprecision increases.
• Centering a QC rule’s rejection limits on the reference mean is effectively equivalent to setting the QC rule’s rejection limits around the instrument’s mean but with a shorter distance to the rejection limit in the direction of the instrument’s bias and a longer distance to the rejection limit in the direction opposite the instrument’s bias.
• These results suggest that setting the QC rule’s mean to the instrument’s mean puts the primary focus on controlling the instrument while setting a QC rule’s mean to the instrument’s mean minus instrument bias puts the primary focus on controlling the reliability of patient results.
SE (%)−15 −10 −5 0 5 10 150
0.2
0.4
0.6
0.8
1
Instrument
CV(%) Bias(%) Sigma QC Rule CV(%) Neg. SE Pos. SE E(NU) AUC1.61.61.62.02.02.02.42.42.4
0.51.01.50.51.01.50.51.01.5
5.95.65.34.84.54.34.03.83.5
1.65601.79421.97252.04582.16532.32792.43862.54312.6913
0.00770.01450.03160.24380.35550.58671.91882.48913.5829
0.00770.01450.03160.24380.35550.58671.91882.48913.5829
0.04560.08790.19162.10703.04904.440621.020325.816029.1960
Max E(NU)
QC Rule Mean Set to Reference Mean
Instrument
CV(%) Bias(%) Sigma QC Rule CV(%) Neg. SE Pos. SE E(NU) AUC1.61.61.62.02.02.02.42.42.4
0.51.01.50.51.01.50.51.01.5
5.95.65.34.84.54.34.03.83.5
1.61.61.62.02.02.02.42.42.4
Max E(NU)
QC Rule Mean Set to Instrument Mean
0.00220.00080.00030.10790.05420.02661.03940.61380.3571
0.01540.03810.09110.40360.76201.42012.89814.80377.9648
0.05290.12300.30202.23733.66966.626921.693629.398343.5970
Pro
bab
ility
SE (%)
−15 −10 −5 0 5 10 150
0.2
0.4
0.6
0.8
1
−15 −10 −5 0 5 10 15
0
0.02
0.04
0.06
0.08
0.1
0
0.02
0.04
0.06
0.08
0.1
0
0.02
0.04
0.06
0.08
0.1
E(N
U)
E(N
U)
E(N
U)
CV=1.6% Bias=0.5% Sigma=5.9
−15 −10 −5 0 5 10 15
CV=1.6% Bias=1% Sigma=5.6
−15 −10 −5 0 5 10 15
CV=1.6% Bias=1.5% Sigma=5.3
−15 −10 −5 0 5 10 15
−0.5
0
0.5
1
1.5
−0.5
0
0.5
1
1.5
−0.5
0
0.5
1
1.5CV=2% Bias=0.5% Sigma=4.8
−15 −10 −5 0 5 10 15
CV=2% Bias=1% Sigma=4.5
−15 −10 −5 0 5 10 15
CV=2% Bias=1.5% Sigma=4.3
−15 −10 −5 0 5 10 15−6
−3
0
3
6
9
−6
−3
0
3
6
9
−6
−3
0
3
6
9
SE (%)
CV=2.4% Bias=0.5% Sigma=4.0
−15 −10 −5 0 5 10 15SE (%)
CV=2.4% Bias=1% Sigma=3.8
−15 −10 −5 0 5 10 15SE (%)
CV=2.4% Bias=1.5% Sigma=3.5
E(NU) = ΔPE{(ARLed – 1)E(NB) – (1 – P1)[E(NB) – E(N0)]}.
Fig. 1: Probability of QC rule rejection for the 1:3s/2:2s/R:4s multirule when the QC mean is set to the instrument’s mean (blue curve) or the reference mean (green curve), assuming instrument CV = 2% and instrument bias = 1%.
Fig. 2: Ped for 1:3s/2:2s/R:4s multirule when the QC mean is set to the instrument mean (blue curve)and when QC mean is set to the reference mean and “CV” is set at 2.165% (green curve), assuming instrument CV = 2% and instrument bias = 1%. ΔPE (black curve) is the increase in probability of a patient result with measurement error that exceeds TEa = ±10%
Fig. 3: E(NU) curves for various combinations of instrument bias and imprecision. The green curves show E(NU) when the QC rule is centered on the reference mean. The blue curves show E(NU) when the QC rule is centered on the instrument mean.