designing operational excellence -...
TRANSCRIPT
DESIGNING OPERATIONAL EXCELLENCE
Financial and Service Performance Improvements and the Role of Intell igent, Model-Based Design and Visual izat ion Tools December 2012
WHITE PAPER
5 1 5 E . CR OS S V I LLE RD . S U I T E 1 5 0
R OS W E LL , GA 3 00 7 5 W W W . T H E M C D O N N E L L G R O UP . C O M
2
TABLE OF CONTENTS
DESIGNING OPERATIONAL EXCELLENCE . . . . . . . . . . . . . . . . . . . . . . . . . . . . . . . . . . . . . . .
EXECUTIVE SUMMARY . . . . . . . . . . . . . . . . . . . . . . . . . . . . . . . . . . . . . . . . . . . . . . . . . . . . . . . . . . . . . . . . . 3
FINDINGS ............................................................................................................... 3
BACKGROUND AND GOALS OF STUDY . . . . . . . . . . . . . . . . . . . . . . . . . . . . . . . . . . . . . . . . 6
PARTICIPANT DEMOGRAPHICS ........................................................................... 6
TODAY’S DESIGN LANDSCAPE . . . . . . . . . . . . . . . . . . . . . . . . . . . . . . . . . . . . . . . . . . . . . . . . . . . . 9
DRIVERS FOR CHANGE . . . . . . . . . . . . . . . . . . . . . . . . . . . . . . . . . . . . . . . . . . . . . . . . . . . . . . . . . . . . . 14
CRIT ICALITY OF DESIGN FUNCTION . . . . . . . . . . . . . . . . . . . . . . . . . . . . . . . . . . . . . . . . . . . 16
ADDRESSING UNIFORMITY AND DIVERSITY OF DESIGN SOLUTION
AND RELATED WORKFLOWS . . . . . . . . . . . . . . . . . . . . . . . . . . . . . . . . . . . . . . . . . . . . . . . . . . . . . . 18
INTEREST IN IMPROVED 3-D DESIGN, MODELING AND
VISUALIZATION TOOLS . . . . . . . . . . . . . . . . . . . . . . . . . . . . . . . . . . . . . . . . . . . . . . . . . . . . . . . . . . . . . . 22
OVERALL ORGANIZATIONAL IMPROVEMENTS AND
DESIGN’S ROLE . . . . . . . . . . . . . . . . . . . . . . . . . . . . . . . . . . . . . . . . . . . . . . . . . . . . . . . . . . . . . . . . . . . . . . . . 25
CONCLUSION . . . . . . . . . . . . . . . . . . . . . . . . . . . . . . . . . . . . . . . . . . . . . . . . . . . . . . . . . . . . . . . . . . . . . . . . . . 29
3
EXECUTIVE SUMMARY
Utilities are seeking to improve numerous workflows and address critical
workforce issues to optimize their financial and service performance. Outside of
capital equipment, fuel, and/or purchased power costs, personnel-‐related expenses
are among the largest expense categories at the typical electric utility and
equipping that workforce with the best possible tools is one of the strategies for
achieving performance optimization across the organization.
Although personnel involved in the design function across T&D and substations are
not a large group compared to other job functions at a utility, their activities have
major impact on the efficiency of many of the utility’s mission-‐critical workflows.
Better design tools yield cost savings within the design function itself, but also play
vital roles both in improving customer and stakeholder satisfaction and in enabling
systems that are key to ensuring reliability, safety, and operational excellence.
This research surveyed the improvements in best-‐in-‐class design, modeling, and
visualization tools and how they are contributing to overall change within the
utility’s critical design function that affects both service reliability and customer
satisfaction and the management of their increasingly complex asset base and O&M
activity mix.
FINDINGS
Participants universally recognized the importance of the design function, both for
meeting internal transmission, distribution, and substation department goals as
well as for meeting overall company goals.
In their relentless pursuit of optimized customer service, leading utilities described
their efforts to use design and modeling-‐related improvements to provide better
support for real-‐time operations and more accurate models of the T&D system.
4
Utilities have had to fine-‐tune how they manage risks associated with their capital
investments in response to today’s greater dynamism in the business, engineering
and regulatory landscapes. They can no longer rely on steady annual growth in the
asset base to mitigate risk but they believe employing 3-‐D visualization tools to
share potential designs with customers and stakeholders earlier in the approval
process, to optimize processes for fine-‐tuning designs prior to final approval, and
to more accurately predict project timelines will help in their overall risk
management strategy.
There are additional business drivers for improving design and modeling tools,
including better utilization of already lean-‐running staff, significant employee-‐
related benefits associated with improved recruitment and retention, optimization
of utilization of equipment and resources, greater uniformity of workflows and
processes, more effective transfer of standards and best practices from
experienced personnel nearing retirement, and shortened learning curve as newly-‐
hired designers reach full productivity months ahead of plan.
Respondents highlighted the importance of the engineering uniformity in the
various design tools being used across the organization, and process uniformity to
link these design tools to ERP, Work Management, and other systems. For them,
having the same design tool across distribution, transmission, substations, and
production is not as important as having a consistent set of processes supporting
the engineering standards embodied in the various design tools. Workflows that
maintain and help track compliance with standards are helping these utilities meet
operational excellence goals while minimizing costs.
Expanding on process uniformity benefits, respondents cited greater efficiency of
field and construction O&M work, deeper benchmarking of best practices,
reduction of costly “exceptions” out of O&M systems and processes, more accurate
data essential to network connectivity modeling, and lower training, daily support,
and integration/upgrade cycle costs.
Another benefit comes directly from the increasingly complex operating
environment. For example, a large investor-‐owned utility with multiple
5
subsidiaries in different states pointed out the importance of their uniform design
tool in lowering costs even though some state laws created significant differences
in labor costs for the same job. The standards-‐based design modeling engines
calculate these cost differences while employing compatible units that maximize
uniformity of other key processes and optimize material ordering, accounting, and
reporting. Absent a tool that could build bridges by means of standards and
compatible units, this company would still be facing higher expenses across most of
the above-‐listed items, even though it has standardized its design tools as well as
accompanying solutions associated with work order execution (ERM, EAM, etc.).
Utilities represented in the sample are seeking to increase the uniformity and
efficiency of workflows that employ data from design solutions across their current
mix of WMS/OMS/EAM/ERP and GIS solutions. All 31 participants recognized the
key role played by better design solutions, whether in distribution, transmission or
substations, emphasizing it as critical (55%), very important (40%) or important
(5%) to achieving service excellence while minimizing costs.
6
BACKGROUND AND GOALS OF STUDY
The goal of this research was to determine the value of optimized intelligent-‐model
based design solutions in helping utilities meet key goals. The survey sought
participant’s views regarding their organization’s use of design and related data
models, visualization tools, workflows and data sharing in support of T&D and/or
substation planning, design, and construction activities and in operations &
maintenance (O&M) activities.
Aside from new design work, workflows of interest also involved responding to
permitting requests and one-‐calls or the sharing/updating of drawings, schematics,
models, or the output of other visualization tools in relation to existing assets or
planned future designs.
The role of improved design solutions in helping utilities in their efforts to get
more value out of their enterprise software systems (ERP, EAM, WMS, OMS, and
new DMS and EMS systems) was also a focus area.
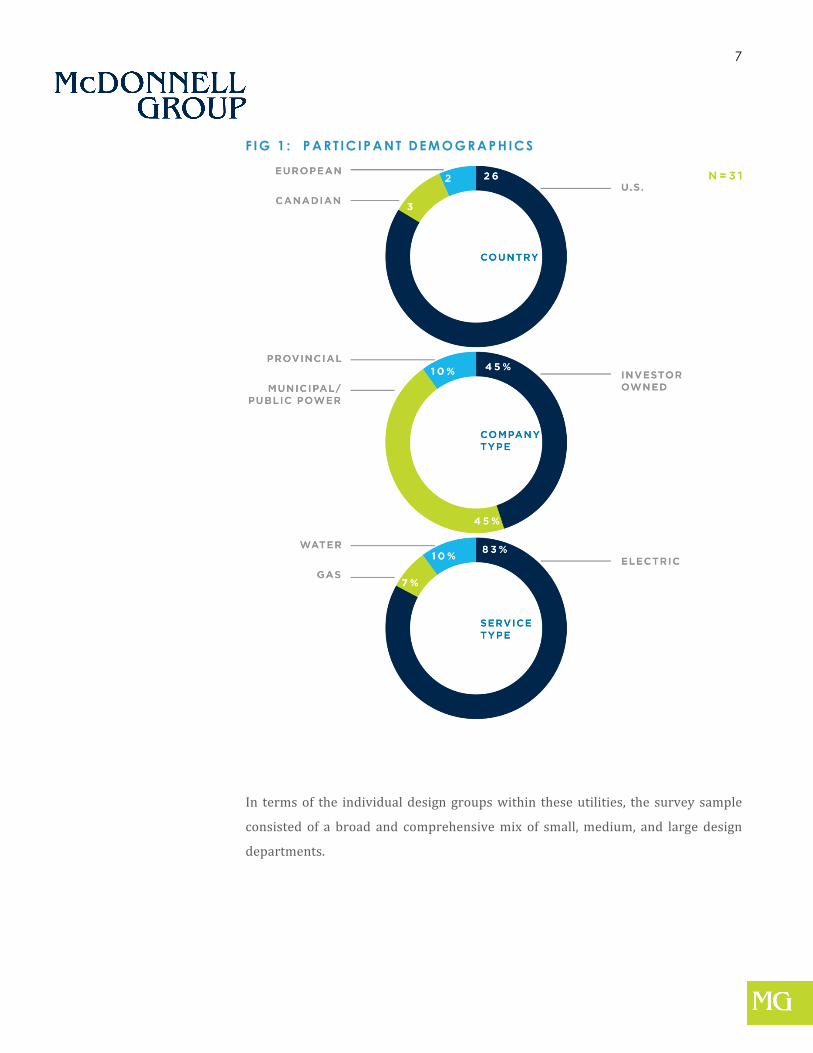
PARTICIPANT DEMOGRAPHICS The participants in the 31 surveys represented a diverse mix, as shown in Figure 1.
7
F IG 1 : P A R T IC IP A N T D E M O G R A P H IC S
In terms of the individual design groups within these utilities, the survey sample
consisted of a broad and comprehensive mix of small, medium, and large design
departments.
8
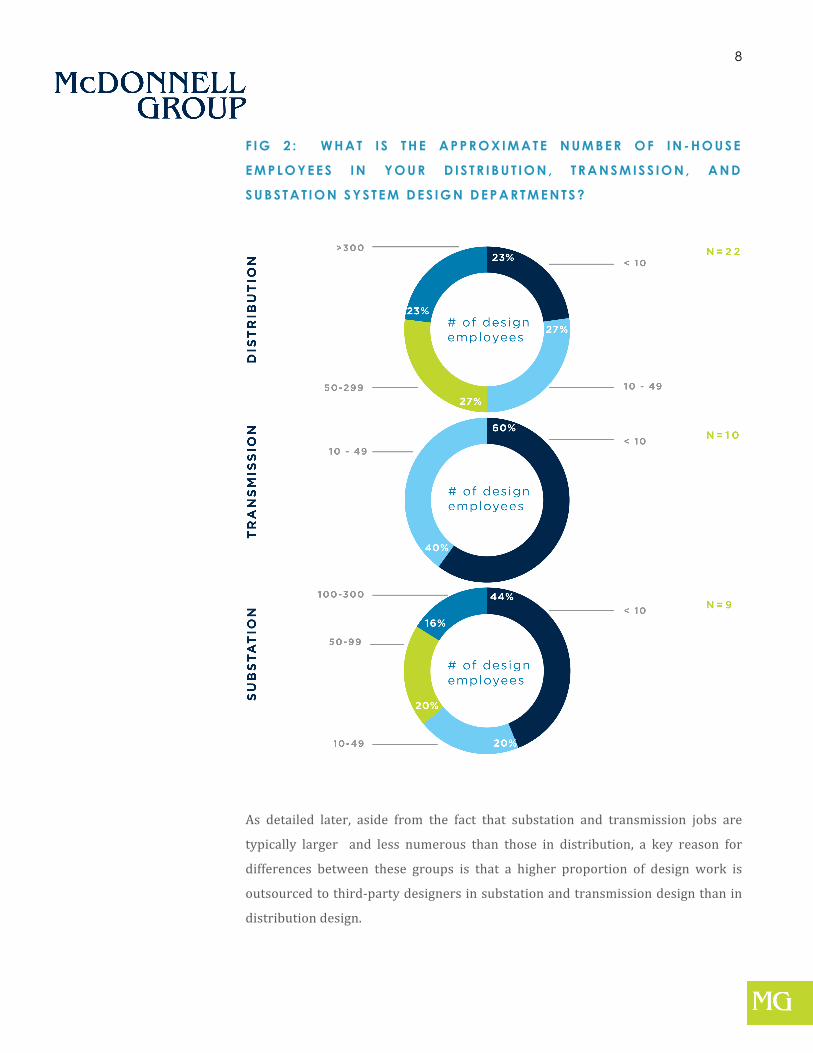
F IG 2 : W H A T I S TH E A P P R O X IM A TE N U M B E R O F IN-H O U S E
E M P LO Y E E S IN Y O U R D IS TR IB U T IO N , TR A N S M IS S IO N , A N D
S U B S TA T IO N S Y S TE M D E S IG N D E P A R TM E N TS ?
As detailed later, aside from the fact that substation and transmission jobs are
typically larger and less numerous than those in distribution, a key reason for
differences between these groups is that a higher proportion of design work is
outsourced to third-‐party designers in substation and transmission design than in
distribution design.
9
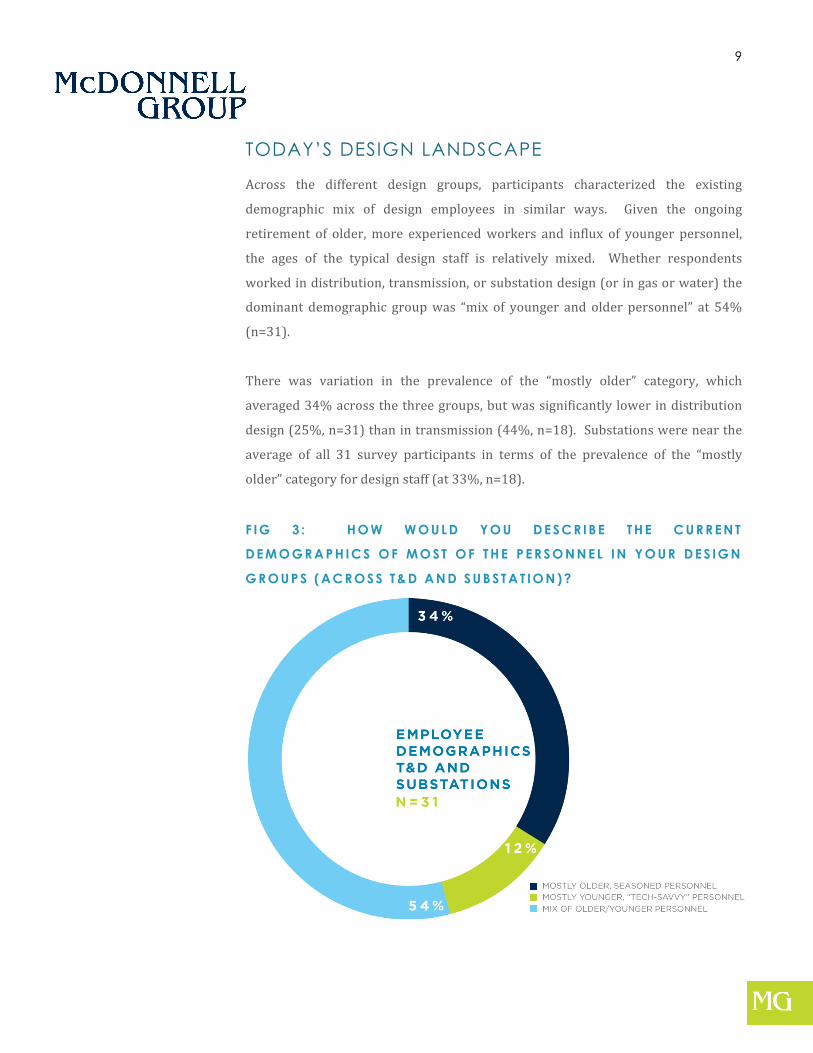
TODAY’S DESIGN LANDSCAPE
Across the different design groups, participants characterized the existing
demographic mix of design employees in similar ways. Given the ongoing
retirement of older, more experienced workers and influx of younger personnel,
the ages of the typical design staff is relatively mixed. Whether respondents
worked in distribution, transmission, or substation design (or in gas or water) the
dominant demographic group was “mix of younger and older personnel” at 54%
(n=31).
There was variation in the prevalence of the “mostly older” category, which
averaged 34% across the three groups, but was significantly lower in distribution
design (25%, n=31) than in transmission (44%, n=18). Substations were near the
average of all 31 survey participants in terms of the prevalence of the “mostly
older” category for design staff (at 33%, n=18).
F IG 3 : H O W W O U LD Y O U D E S C R IB E TH E C U R R E N T
D E M O G R A P H IC S O F M O S T O F TH E P E R S O N N E L IN Y O U R D E S IG N
G R O U P S (A C R O S S T& D A N D S U B S TA T IO N )?
10
Comments indicated that the incoming personnel need to be equipped with the
latest software for modeling, design and visualization not only because these tools
will help them be more productive and easier to train, but also because job
retention will be significantly increased, along with equally-‐important capabilities
to capture the know-‐how of older, more seasoned engineering and design
personnel, transfer it, and make it part of the institutional “memory” of the design
team.
Numerous survey participants said that the level of sophistication of the design
tools supporting these personnel can make a big difference in terms of the level of
employee retention.
Improving employee retention and lowering training costs are made more
significant by an additional research finding that distribution,
transmission and/or substation design staffs are typically a more
expensive resource than the average staff members of their respective
organizations.
Specifically regarding relative costs, when asked to compare the costs of
design employees in their department to the average employee’s salary in
that department, 53% of all respondents indicated a higher salary, 47%
said it was about the same, and none said that designers had below-‐
average salary levels.
Respondents indicated that within the design department, new design
tools have also led to cost savings resulting from better job retention.
In terms of ROI, comments indicated that employee retention is becoming
an increasingly important consideration. Departmental training costs are
a great deal higher if employee turnover is higher. This creates a strong
incentive (beyond efficiency and numerous other direct benefits) for upgrading to
the latest technologies in design related software solutions.
T h e m or e te ch s a vv y y ou n ger
n ew c om e rs h a v in g be en
s ur p r i s ed t o se e l e s s th a n t h e
l a t es t t ech n o l og y …
T h es e y ou n ge r e m p lo y ees …
in c rea s i n g l y fe e l le s s an d l e s s
l oy a l t y t o t h e i r em pl oy e r s .
A n y on e w h o th i nk s t h e u t i l i t y
in d u s t ry i s im m u n e to th i s i s l i v i n g
in a d rea m l an d b eca u se I ’ ve
b een s ee in g i t a t m a n y u t i l i t y
co m p an i es .
[ T h ey ] a re u p o n th e la t es t
t ech n o lo g ie s , an d w a n t to s ta y
t h at w ay . Th e y w i l l m o v e to
o th e r co m p an i es o r i n d us t r ie s i f
t h ey d o n o t f ee l t h ey a re s t ay i n g
u p to d at e in t h e i r w o rk b y u s i n g
t h e la t es t d es ig n t ech n o lo g ie s .
T h ey w a n t to fe e l t h ey a r e
a cco m pl i s h in g s om e th i n g , an d
w a n t to b e ch a l le n ged .”

11
In terms of younger personnel learning from older ones, there were multiple
instances of survey respondents who made comments about it being a two-‐way
street. For example some participants referenced the ability of younger personnel
to get up to speed faster than older ones who resisted new technologies.
However another participant emphasized that the push-‐back against new
technologies by older personnel was much more pronounced among field
workers than among design staff.
Regarding field personnel versus those working in the design function
behind a desk, one participant mentioned that the brain drain in the field
was as big of a loss as that in the office, and said their new design tool
contributing to better knowledge transfer between older experienced
employees and young new-‐comers was just as important outside the
design department as inside it.
Our research clearly indicated that
decision-‐makers who have seen the
benefits of intelligent, model-‐based design
tools view it as an opportunity that they can
better attract and retain new designers by
using leading-‐edge design tools as a way to
help address the significant demographic
shifts which are occurring in the work force.
Design tool leadership has a good influence
when it comes to dealing with to the influx of
younger, more tech-‐savvy personnel:
Our questions in this section delved deeper
into the make-‐up of utility staff, beyond age
and salary comparisons, by getting participants to estimate the relative size of
design staff compared to the groups being served by design teams. Specifically,
respondents were asked to estimate what percentage of overall department
headcount was represented by designers.
I n th e pa s t be fo re w e u pgr ad ed
o ur d es ig n s o l ut i on , i f a w o rk
p ack a ge’ s d ra w in g w as n ot 10 0
p erce n t a ccu r at e , y ou k ne w
s in ce y ou h ad m o re e x pe r ie n ced
f ie ld p er s on n e l , th a t t he y co u ld
s t i l l do t he w o rk cor rec t l y an d
m a rk u p t he d ra w in g to c or r ect
i t an d se nd i t b ac k. N ow , a s
p eo p l e a re c om i n g o n b oa rd
t h at h av e l e s s ex p er i en ce , i t
b eco m es m or e im p or ta n t t h at
t h e d es ign be m or e a ccu r at e f o r
t h e f i e l d w o rk e r s . A l so , n ow t h e
w o rk h a s to b e d on e in a t i m e l ie r
m a n n er , be cau s e y o u h av e v e ry
l im i t i n g c on s t r uc t i on s ch ed u les .
“ A s y ou ge t n ew en g i ne er s
co m in g on b oa rd i f y o u h av e a
re a l ly s t r on g d es i gn sy s t em an d
y o u ha v e g oo d com pa t i b le un i t s
t h ey b eco m e p ro du c t i v e m u ch
s oo n er , in s te ad o f i t ta k in g tw o
y ea r s f o r th e m f i gu re ou t h o w w e
d es ign ou r d i s t r ib u t io n s y s t em .
W e ca n u se t h e t ech n o lo gy to
b u i ld t h e i ns t i t u t i on a l k n o w le dg e
in t o t h e ap p l i ca t i on . So w h en
t h ey s i t d ow n at th e i r d es k t h ey
h av e a l l t ha t kn o w le d ge b u i l t
in t o i t i ns t ea d o f t he i r h av i ng to
l ear n at t h e k n ee of a m or e
ex p er ien c ed en g in ee r . ”
12
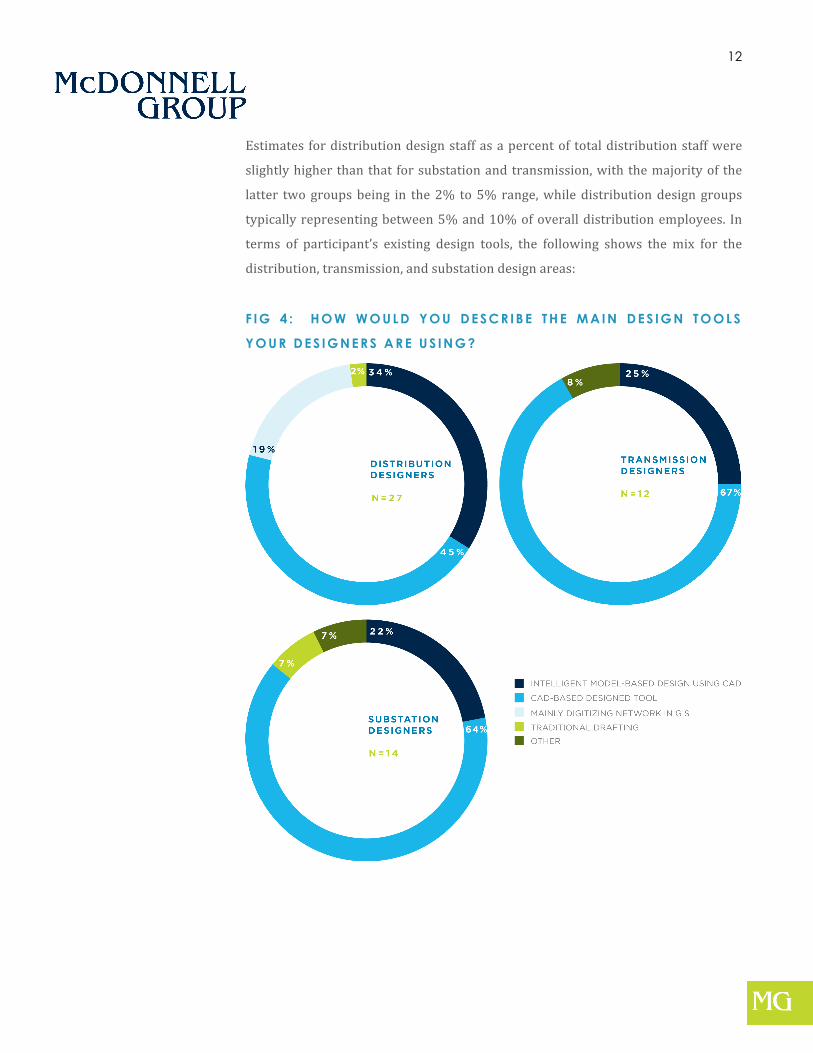
Estimates for distribution design staff as a percent of total distribution staff were
slightly higher than that for substation and transmission, with the majority of the
latter two groups being in the 2% to 5% range, while distribution design groups
typically representing between 5% and 10% of overall distribution employees. In
terms of participant’s existing design tools, the following shows the mix for the
distribution, transmission, and substation design areas:
F IG 4 : H O W W O U LD Y O U D E S C R IB E TH E M A IN D E S IG N TO O LS
Y O U R D E S IG N E R S A R E U S IN G ?
13
As shown in Figure 4, transmission and substation design teams report a lower
level of current use of intelligent-‐model-‐based design tools, and report no digitizing
of the network in GIS. It was only in distribution that the GIS option was given.
These respondents also indicated in some cases that they had partially
completed a planned path to utilizing an intelligent, model-‐based design
solution using a CAD tool.
Several participants described using blocks or CUs and are benefitting
from having these CUs linked directly to materials in their purchasing
system catalogue.
In addition, interest in 3-‐D design tools was high, with 92% of participants (n=26)
saying there was interest in adding new 3-‐D capabilities or upgrading/expanding
upon existing ones, and only 8% of decision-‐makers saying their companies saw no
value in 3-‐D capabilities or were undecided about adding more of them.
W e a re b r i n g in g in d at a f r om th e
G IS as a s ta r t in g p o i n t… s o w e d o
n ot h a v e c l i pp in g i s su es o r d a ta
a ge i s s u es …o n ce i m po r t ed t h es e
b eco m e o b j ec ts in a CA D
d ra w in g an d in o u r c on n ec t i v i t y
m o de l .
14
DRIVERS FOR CHANGE
Along with the dynamics of the changing workforce, other drivers for design
solution improvements often focused on better serving customers and improving
reliability and safety performance while optimizing costs, were made clear in the
research.
Technological improvements in integration and data sharing will enable utilities to
get more value out of their enterprise software systems that use GIS-‐based models.
Our research findings that highlight key impacts of design and modeling tools on
other parts of the organization become more significant given the fact that the
comparatively small number of personnel directly involved in the design function
is highly leveraged across the entire organization. Designers need to provide work
packages, drawings, schematics, and other output that uphold engineering
standards and help optimize downstream workflows.
Both the quantitative data, as well as comments by participants, confirmed the
impression that it is foolhardy to do anything that yields sub-‐optimal designs in the
name of potential cost savings based on increasing throughput in the design group.
Mistakes in work packages and inaccurate designs are much more costly and can
be much more detrimental to safety and reliability of service.
Having more accurate data and better real-‐time updates of the models built on that
data was given a high priority by survey participants, who frequently referenced
their initiatives to improve grid operations.
15
In addition, the research brought to the
forefront the importance leading utilities are
placing on the need to better communicate
about complex decisions and share real-‐time
data more effectively within a wider network.
Collaboration is becoming increasingly
important, given the involvement of numerous
stakeholders, external agencies, interested
parties and diverse business participants, and
the quality of the tools the utility employs for
these collaborative activities becomes a very
public element in the brand experience and
image the utility builds in the wider
community.
The quality of collaborative tools and related
tracking capabilities has more direct impact
on participants involved in the third party
contractor community, due to extensive
outsourcing of design and construction work
in transmission and substations, and the
desire for flexibility in outsourcing
construction and O&M work in distribution.
All of these things increase the need to share
information in and out of the utility.
T h i s m igh t s ee m s u rp r i s in g bu t w e
a re i n a p r e t t y go od s ta t e
a l re ad y re gar d i n g de s i gn
s o l ut i on a ccu ra cy , in t eg rat i on
a nd im p ro v ed w o rk f lo w s , ev en
t h ou gh t h ey ca n a l so b e
im pr ov ed , b u t w h at re a l ly m ak es
t h e d i f f e ren ce i n t h e rea l w o r ld
i s ho w c le ar ly an d e as i l y y o u
p res en t in f o rm a t i on . W h en y ou
u se t he b es t d es i gn an d
m o de l i n g t oo l s to m a k e t h os e
p res en t at i on s t o o t he r s ,
in c lu d in g h i gh - l ev e l
m a n ag em en t , t h e p re se n ta t io ns
h av e w o w ed t h em .
W e ca n a l w ay s im p ro v e on
in t eg ra t i on a nd ac cu ra cy an d
w o rk f lo w s , bu t w h ere t h e m o n ey
co n t i n u es to su p po r t t h e
p rog ra m bec au s e i t i s u se fu l ,
co m es d o w n t o t h e w a y s y ou
d i s p l ay i t , w h et h er i t i s ge t t i ng i t
o ut o n n o t ebo o ks t o t h e c r ew s in
t h e f i e ld o r re po r t in g to b oa rd
m e m be rs an d ex e cu t i v e
m a n ag em en t , ho w i t i s s ho w n
a nd s een i s c r i t ica l .
16
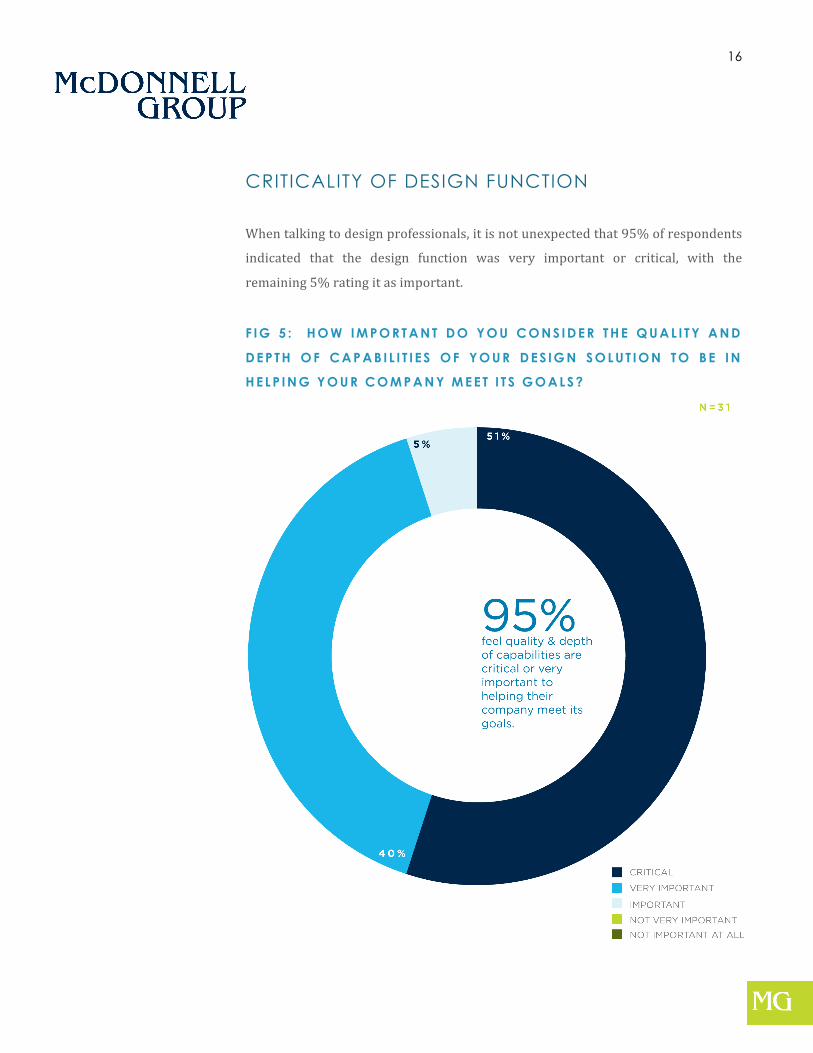
CRITICALITY OF DESIGN FUNCTION
When talking to design professionals, it is not unexpected that 95% of respondents
indicated that the design function was very important or critical, with the
remaining 5% rating it as important.
F IG 5 : H O W IM PO R TA N T D O Y O U C O N S ID E R TH E Q U A L I TY A N D
D E P TH O F C A P A B I L I T I E S O F Y O U R D E S IG N S O LU T IO N TO B E IN
H E LP IN G Y O U R C O M P A N Y M E E T I T S G O A LS ?
17
This recognition of the importance of the design function was clearly universal, not
merely within the context of meeting department goals for T&D or substation O&M
work, but in terms of meeting overall company goals as emphasized in this
question.
Significantly, the above 55% criticality rating showed little difference between the
three groups: 56% for distribution, 55% for transmission, and 58% for
substations. None of the respondents ranked the design function as “not very
important” or “not important at all”.
Drivers for this high level of importance for the design function
include the need to optimize customer service by better supporting
real-‐time operations and more accurate models of the T&D system, as
well as better utilization of already lean-‐running staff, equipment, and
resources.
T h e b ig ges t t h i n g y o u n ee d r igh t
n ow a re t o o l s t h at a re fu n ct io n a l
a nd re l ia b l e , t h at s u pp or t n ot
j us t t h rou gh p u t b u t q u a l i t y a n d
a l s o e n ab le y o u t o m o re q u ic k l y
ge t n ew p eo p le u p t o s pe ed .
D ra w in g s n eed to co m m u n ica t e
a nd t ra n s l a t e i n to re a l w o r ld
o pe rat i on a l co n s t ru c t i on
f u nc t i on s a n d r ea l w ork . T h i s
w a y y ou d o n ’ t ge t in t o t h os e
s i t u at io n s w h e re t h e c r ew s get
o ut i n th e f i e l d an d t h ey ca n n ot
co m p let e t he w o rk .
18
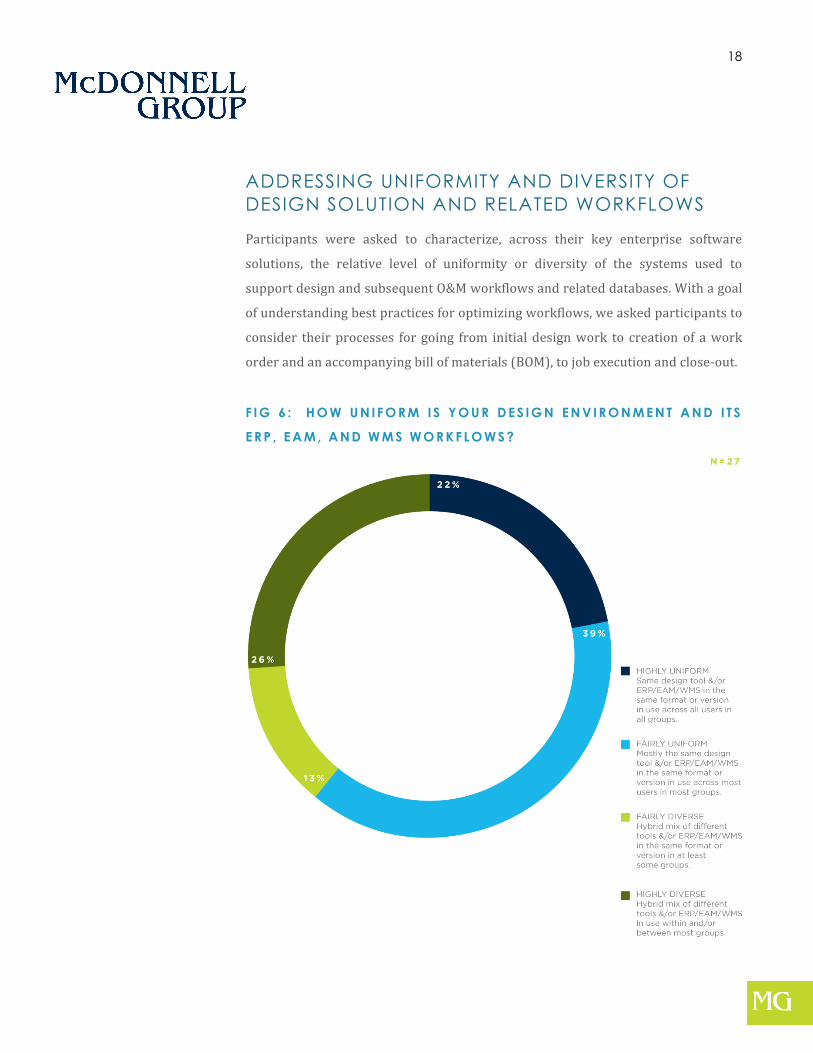
ADDRESSING UNIFORMITY AND DIVERSITY OF DESIGN SOLUTION AND RELATED WORKFLOWS
Participants were asked to characterize, across their key enterprise software
solutions, the relative level of uniformity or diversity of the systems used to
support design and subsequent O&M workflows and related databases. With a goal
of understanding best practices for optimizing workflows, we asked participants to
consider their processes for going from initial design work to creation of a work
order and an accompanying bill of materials (BOM), to job execution and close-‐out.
F IG 6 : H O W U N IFO R M IS Y O U R D E S IG N E N V IR O N M E N T A N D I T S
E R P , E A M , A N D W M S W O R K FLO W S ?
19
The research showed that uniformity of these processes is seen as a key source of
benefits in numerous areas.
Respondents highlighted the importance of the uniformity of their design solution
and its linkages to ERP and other systems in helping them to meet their goals to
optimize operational performance while minimizing costs. Key areas include:
• Uniformity of work orders and drawings, drives construction and field
O&M efficiency
• Better benchmarking of best practices
• Wrings costly “exceptions” out of O&M systems and processes
• Ensures accurate data key to network connectivity modeling
• Reduces training, daily support and integration /upgrade cycle costs
• Optimizes material ordering, accounting and reporting
• Design tool support of consistent standards compliance
Respondents said uniformity benefits were key value drivers, even in the
face of extremely complex environments. For example, a large investor-‐
owned utility holding company with multiple subsidiaries in different
states pointed out the importance of their uniformity of software tools in
lowering costs.
This company’s design tool builds bridges by means of standards and
compatible units, so it can now keep costs down, not only with wholesale
purchasing of the identical wood poles, but also in benchmarking best
practices, optimizing software integration and upgrades, and minimizing
costs for day-‐to-‐day support for the solutions.
Diversity was viewed as an undesirable necessity. Candid comments
included reference to the fact that much of the diversity came from having
installed systems in the past out of necessity. Such earlier systems
O ur W MS , d es i gn t o o l s , a nd o u r
G IS s y s te m are c om m on
t h rou gh o u t a l l ju r i s d i c t io n s , b ut
w e s t i l l ha v e a d iv e r s i t y o f p ar t s
a nd p i ece s w i t h in t h a t so f t w a re .
A s a n ex a m p le w e u s e
Co m p at i b l e U n i t s to o r de r p ar t s
a nd m a t e r i a l an d th e r e l at ed
l ab or . T h e W MS i s t h e sa m e , an d
t h e w o od p o l e m a y b e t he sa m e ,
b ut w e w i l l h av e a d i f f e re nt CU
in e ac h s y s te m , s in ce in o n e
re g io n a c rew th a t w ou l d s e t
t h at sa m e po le m ig h t b e a
d igg er d e r r i ck l i ne t ru ck w i t h tw o
em pl oy e es , a nd i n a n ot h er tw o
t ru ck s w i t h t h re e e m p lo y ee s . A
go od de s i gn to o l he lp s t h e
d es ign e r s p i ck t h e r igh t C U f o r
t h e i r j u r i s d ic t io n .
20
brought some benefits at the time, without
there having been a perspective of the overall
impact.
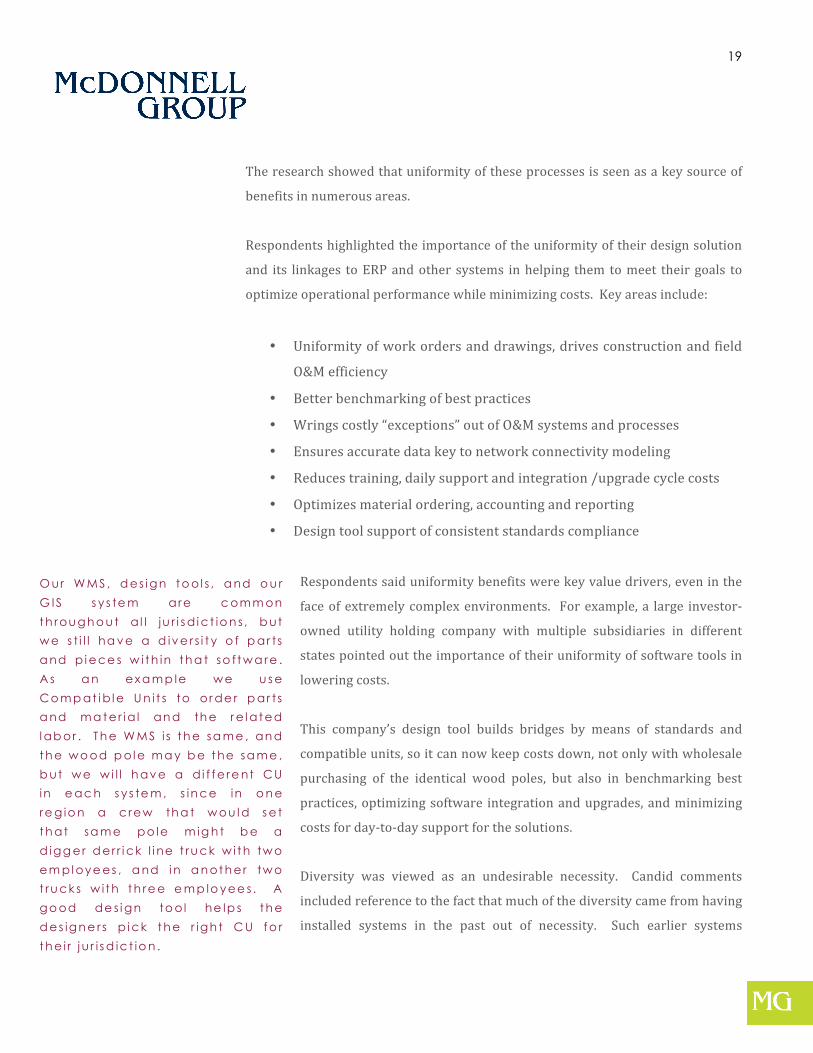
As of follow-‐on to the initial responses given
about uniformity between design and other
solutions described above, the following
question was posed as a follow-‐up for the 19
respondents who said they had less than
“highly uniform” design environments.
F IG 7 : FO R TH O S E N O T H IG H LY U N IFO R M , H A S TH E R E LA T IV E
LE V E L O F D IV E R S I TY B E E N B E N E F IC IA L?
W e are n ow op er at io n a l i z i n g
b es t p ra ct ice s , w h i l e i n th e pa st
2 0 o r 25 y ea r s , th e ea r l ie r
s y s t em s h a d b en ef i t s o f I T i t se l f
t h at w e re su ch a b ig b en ef i t w e
d id n o t h av e t o be a s p r oc ess
o r ie n te d. No w w e ar e get t in g a
n ex t -ge ne ra t i on s e t o f be n ef i t s .
21
Respondents highlighted the strategic focus of reducing diversity going
forward and that uniformity of these processes will be critical to
achieving company goals. And even when there is diversity (e.g. between
enterprise systems in one area such as distribution, versus transmission
or substations), there are benefits to minimizing diversity. As one
participant put it:
There is value in the idea of seeking to establish uniformity as high
“upstream” as possible, to integrate closer in the workflow to where the
job was being done. A result is to have given workflows a higher
uniformity. Flexibility of the standards-‐based design tools in this regard
allows greater benefits to be derived from the mix of diversity and
uniformity unique to each particular utility’s situation.
I w o u ld sa y t h e b igg est po in t o f
d iv e r s i ty i s i n o ur g r ap h ic de s i gn
p roc es se s , a c ro ss d i s t r i bu t io n ,
t ra ns m is s i on an d s u bs ta t io n s . Bu t
a s y ou p r og r es s fu r th e r a lo n g in
t h e w o rk o rd er p ro ce ss es i t
m e rges an d goe s in t o a m or e
co n s i s t en t f l ow , w h en y ou
p roc eed f rom t h e de s i gn
c r ea t i on t o s u bs eq ue n t m a t e r i a l
o rd er i n g , t o co n s t ru c t i on t o f ie ld
a cco un t i ng an d re po r t in g in
t h os e sy s t em s . S o i t b eco m es
m o re c on s i s te n t i n th o se la te r
s ta ges o f t h e w o rk f l ow s .
22
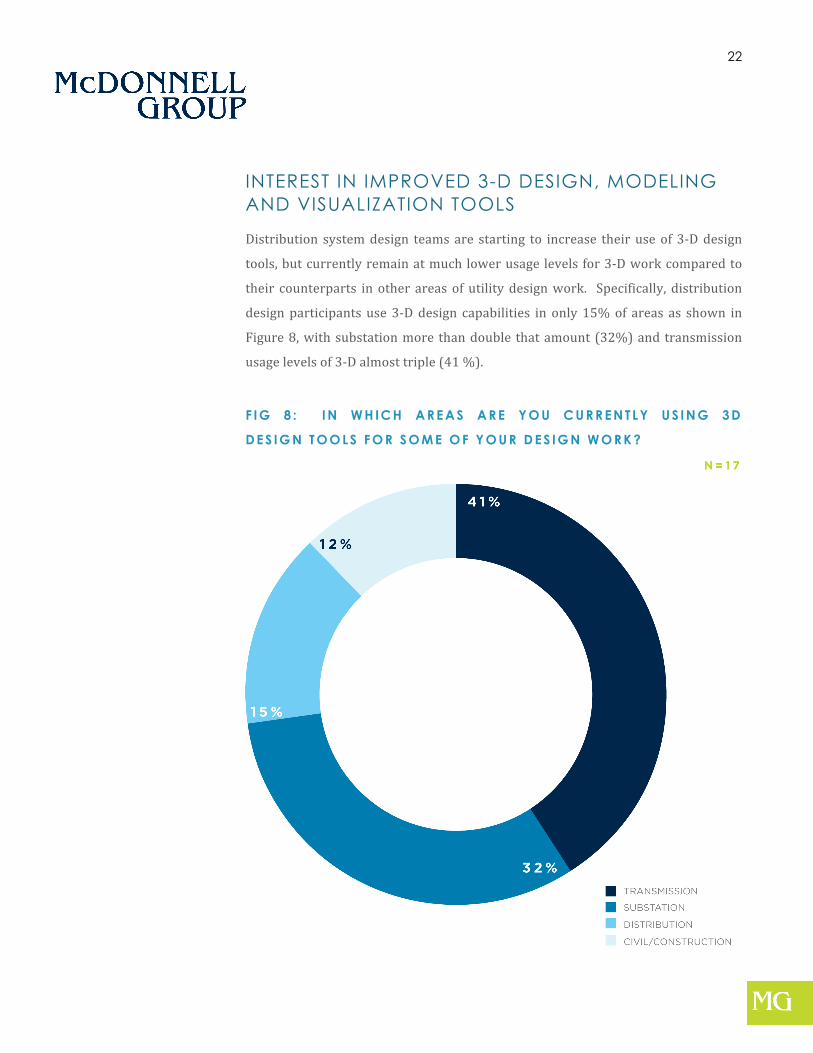
INTEREST IN IMPROVED 3-D DESIGN, MODELING AND VISUALIZATION TOOLS
Distribution system design teams are starting to increase their use of 3-‐D design
tools, but currently remain at much lower usage levels for 3-‐D work compared to
their counterparts in other areas of utility design work. Specifically, distribution
design participants use 3-‐D design capabilities in only 15% of areas as shown in
Figure 8, with substation more than double that amount (32%) and transmission
usage levels of 3-‐D almost triple (41 %).
F IG 8 : IN W H IC H A R E A S A R E Y O U C U R R E N TLY U S IN G 3 D
D E S IG N TO O LS FO R S O M E O F Y O U R D E S IG N W O R K ?
23
Demand for these tools is in part driven by the ability to see how designs will look
in three dimensions and to rotate them and analyze them from different
perspectives. An example of the typical comment by substation and transmission
design decision-‐makers regarding the value of 3-‐D involved the following areas of
importance among others:
• Substation rebuilds in constrained environments
• Clearances being better understood
• Being able to use 3-‐D to enable third-‐party stakeholders as well as
internal utility staff better visualize how prospective designs will look,
in advance of finalizing the design options.
Although current usage levels of 3-‐D in distribution are lower, as shown in Figure
9, interest levels are high, spanning both overhead and underground distribution
as well as smart grid initiatives and other aspects on the low voltage side of the
grid (e.g. renewables and other distributed generation).

24
F IG 9 : FO R E LE C TR IC U T I L I T I E S N O T C U R R E N TLY U S IN G A N Y 3 D
D E S IG N , M O D E L IN G A N D V IS U A L IZA T IO N TO O LS IN
D IS TR IB U T IO N , A R E Y O U IN TE R E S TE D IN M O V IN G TO W A R D TH E
U S E O F 3 D D E S IG N TO O LS ?
One commenter’s utility is a leader in the level of installation of fiber optic
on their distribution system-‐-‐an area where high accuracy and 3-‐D
capabilities are very important. The utility is doing a complete audit of all
of its distribution assets, and will increase data accuracy, and create a 3-‐D
BIM or network model, underscoring the increasing value and importance
utilities are placing on 3D technology.
H e lp i ng ev er y on e se e
p ros p ect iv e d es ign s i s o f g re at
v a l u e . Fo r e x am p le , a co up le o f
t im e s a m o n th w e d o a de s i gn
p res en t at i on s h ow i n g ev e ry
d es ign a n d w h a t w e in t en d to
b u i ld . I f y ou ca n p u t t h at i n 3 -D
i t su d de n ly be co m es v e r y r ea l
f o r t h e pa r t ic i p an t s ve r s us 2 D .

25
OVERALL ORGANIZATIONAL IMPROVEMENTS AND DESIGN’S ROLE
The survey also sought to determine which areas provide the greatest value
and benefit from improvement initiatives at utility companies.
The first question in this series did not focus on design solutions but instead was
specifically worded to elicit responses regarding any important recent or
upcoming improvement initiatives across T&D and/or substations. Participants
were asked to consider the following five job functions for T&D and substations:
1. Utility O&M (including construction) Field Workers and Field
Supervisors
2. Engineering and Planning
3. Designers and Design Engineering
4. Dispatchers, Schedulers, and Systems Operations personnel
5. IT Technicians, IT Engineering & Support (including GIS)
26
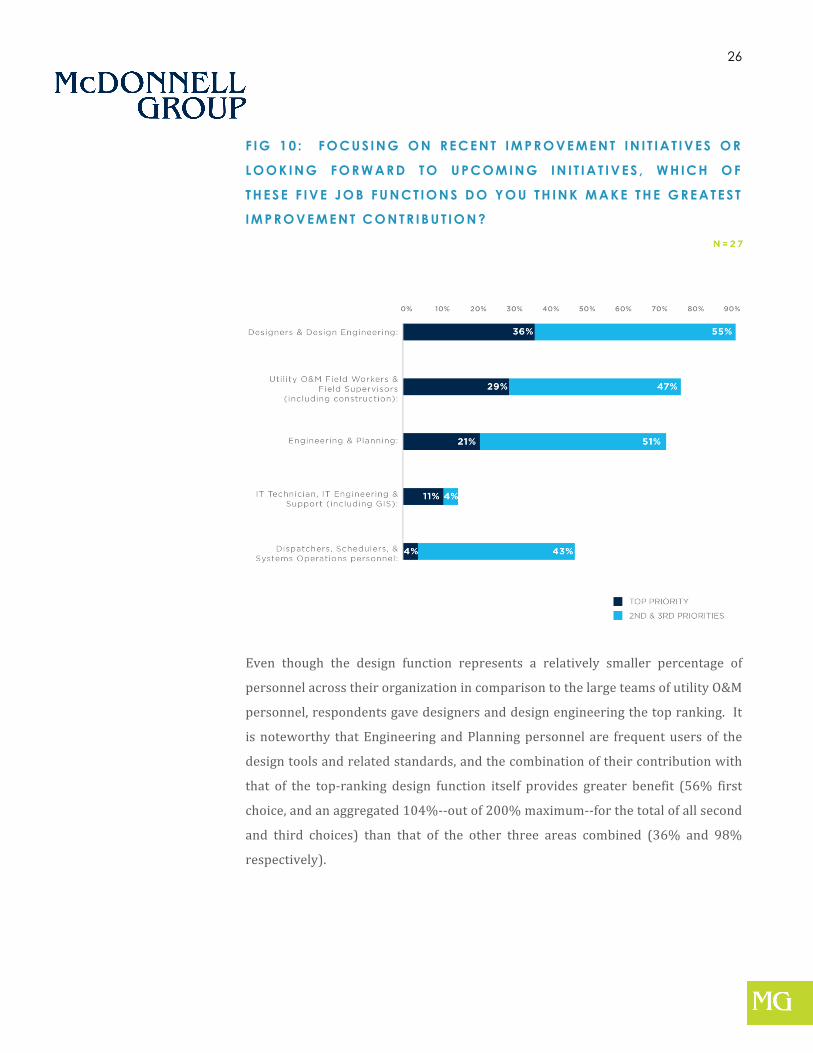
F IG 1 0 : FO C U S IN G O N R E C E N T IM P R O V E M E N T IN I T IA T IV E S O R
LO O K IN G F O R W A R D TO U P C O M IN G IN I T IA T IV E S , W H IC H O F
TH E S E F IV E JO B FU N C T IO N S D O Y O U TH IN K M A K E TH E G R E A TE S T
IM P R O V E M E N T C O N TR IB U T IO N ?
Even though the design function represents a relatively smaller percentage of
personnel across their organization in comparison to the large teams of utility O&M
personnel, respondents gave designers and design engineering the top ranking. It
is noteworthy that Engineering and Planning personnel are frequent users of the
design tools and related standards, and the combination of their contribution with
that of the top-‐ranking design function itself provides greater benefit (56% first
choice, and an aggregated 104%-‐-‐out of 200% maximum-‐-‐for the total of all second
and third choices) than that of the other three areas combined (36% and 98%
respectively).
27
Respondent comments frequently emphasized the importance of having
accurate and up-‐to-‐date data. For example, one IOU respondent who
selected “design” as their top choice described their focus on WMS and
OMS/trouble ticket performance improvements and the challenges of
getting distribution crews and supervisors to better use the new systems.
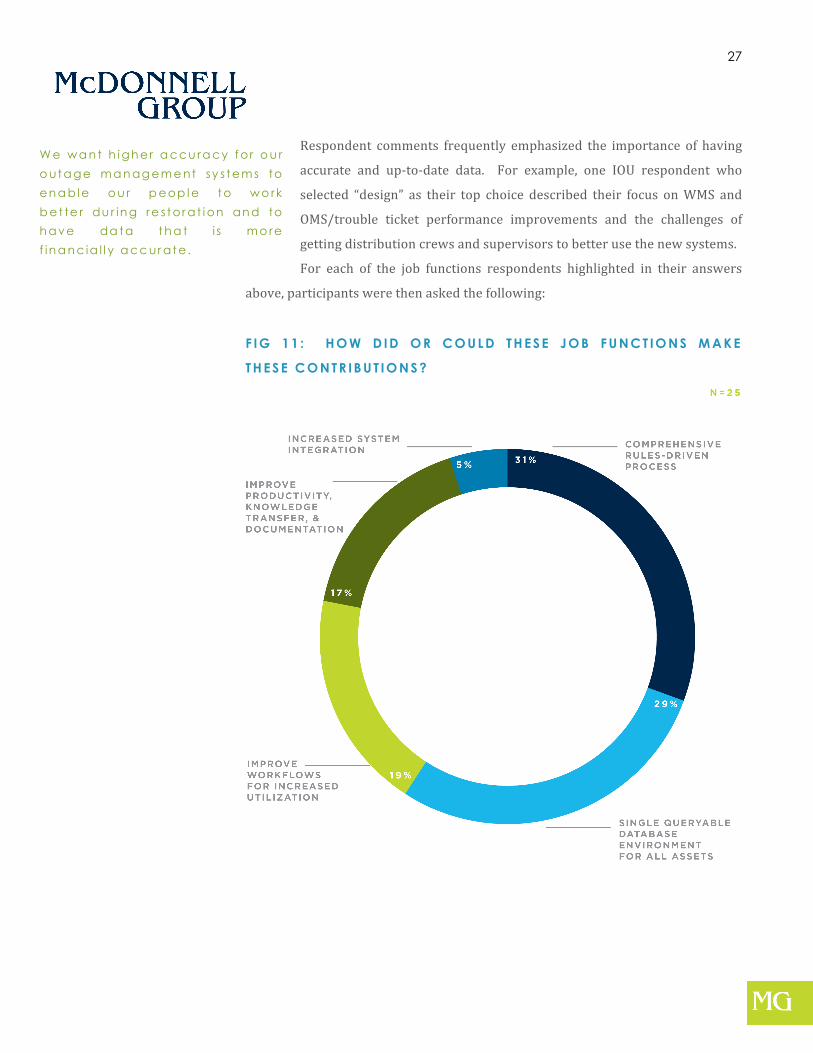
For each of the job functions respondents highlighted in their answers
above, participants were then asked the following:
F IG 1 1 : H O W D ID O R C O U LD TH E S E JO B FU N C T IO N S M A K E
TH E S E C O N TR IB U T IO N S ?
W e w a n t h i gh er a ccu ra cy f o r o u r
o ut a ge m a n ag em e nt sy s t em s to
en a b l e o u r p eop l e t o w o rk
b et te r du r in g re s t o r at i on an d to
h av e da t a t h a t i s m o re
f in a n c ia l l y a cc ur at e .

28
One participant reported that 160 of its people had just spent three years cleaning
up its GIS data, which involved more than 2,000 distribution feeders. Its
subsequent roll-‐out of new engineering tools along with prior AMI installations will
now enable them to focus on “true smart grid initiatives.”
Along these lines, another participant said, “Ultimately you need good data or it is
all meaningless. So having good data is paramount.”
29
CONCLUSION
Distribution system decisions are increasingly being driven by the need for greater
accuracy and more robust processes to support real time updates and job tracking-‐
-‐capabilities that have already been leading transmission and substation and civil
design teams to utilize more intelligent, model-‐based design tools.
As mentioned earlier, the way software systems have evolved at utilities, the
benefits being sought now are often part of a more comprehensive planning
process, while earlier software systems may have brought benefits without a
strong need to consider the overall impact. A telling comment in this regard
referenced the overall evolutionary context
that helped create the current hybrid
environments over the last few decades:
The newer, intelligent model-‐based design
tools are an important element of plans
leading utilities are putting in place to address
operating environments that have become
increasingly complex. Capital improvements
to plant in service are requiring greater design tool utilization to better track
projects and to collaborate in an increasingly complex environment where
stakeholders, customers, and third party contractors as well as utility personnel
need access to real-‐time information that must be accurate and reliable.
ABOUT MCDONNELL GROUP McDonnell Group is a strategic marketing leader that positions, protects, and propels our clients
in an ever-‐changing global marketplace. As the premiere strategic marketing partner driving
value for our leading energy and utility clients, we deliver integrated strategic marketing services
including: research, strategy, and marketing and communication programs.
W e are n ow op er at io n a l i z i n g
b es t p ra ct ic es , w h i l e i n th e pa s t
2 0 o r 2 5 y ea r s ago , t h e ea r l ie r
s y s t em s h a d b en ef i t s o f I T i t se l f
t h at w e re su ch a b ig b en ef i t w e
d id n o t h av e t o be a s p r oc ess
o r ie n te d. No w w e ar e get t in g a
n ex t -ge ne ra t i on se t o f b en e f i t s .