designing a nation-wide network of solar and wind · pdf filedesigning a nation-wide network...
TRANSCRIPT

ORIGINAL RESEARCH
Designing a nation-wide network of solar and wind-assisted parksfor Nigeria and for Ghana
Eugene C. X. Ikejemba1 • Peter C. Schuur1
Received: 3 September 2015 / Accepted: 21 January 2016 / Published online: 9 February 2016
� The Author(s) 2016. This article is published with open access at Springerlink.com
Abstract The further development of sub-Saharan Africa
is hinged on the possibility of the provision of uninter-
rupted power supply. Agriculture, education, and the
economy in general are greatly affected by the power
outage that has become difficult to comprehend. The
energy system is inauspicious that only one in five inhab-
itant has access to electricity. Having electricity is neces-
sary. Having access to clean energy is crucial. For
example, a large number of people in Nigeria have elec-
trical generators that release toxic fumes detrimental to the
human health. Utilizing clean energy is considered the way
of the future and to do that strategically locating the gen-
erating plants is important. Therefore, the introduction of
solar parks (SPs) as well as solar and wind-assisted parks
(SWAPs) on a wide scale is worthy of consideration since
it yields an effective way of generating clean energy. This
paper presents the application of a location model for SPs
and SWAPs from a country’s perspective. In particular, we
focus on Nigeria and Ghana. The power supply infras-
tructure of both countries, as well as the policies sur-
rounding the provision of off-grid energy are analyzed in
depth. We present the advantages and disadvantages of two
different methods (the grid approach and the problem
owner method). We choose a hybrid approach by com-
bining the grid and the problem owner method (POM). We
apply the grid method to regions with high population
density and utilize the POM for less populated areas.
Furthermore, we take into account power plants that are
operational or will be so in the near future. In the above
fashion we design two separate, capacitated networks of
SPs and SWAPs, one for Ghana, one for Nigeria. Each of
these is powerful enough to cover—in a sustainable way—
the energy requirement of the majority of households by a
facility within reasonable distance.
Keywords Renewable energy � Location theory �Mathematical programming � Solar parks � Wind parks
Introduction
In Ikejemba and Schuur [1], a multi-step approach—in-
cluding mathematical programming—was developed to
design a capacitated network of solar parks (SPs) as well as
solar and wind-assisted parks (SWAPs) (i.e., parks that
generate both solar and wind energy) in South-Eastern
Nigeria, taking into account geographical and demographical
characteristics. The present paper extends the application of
the SWAP model to a country’s perspective. Here, we focus
on Nigeria and Ghana. Let us start by defining some key
notions. Next, in ‘‘Generic concepts for selecting potential
locations’’ we introduce generic concepts that are used
throughout the paper. We present the advantages and dis-
advantages of the grid method (used in Ikejemba and Schuur
[1]) and the so-called problem owner method (POM, see
below) and their consequences on the energy status in Africa.
Definitions:
Grid method (GM): The GM in this context is a method
whereby potential locations are selected from points on a 2-
dimensional m� n grid graph Gm;n. In addition, it may be
described as a greenfield method, whereby the options of
selecting potential locations are not constrained by a public
office or a problem owner.
& Eugene C. X. Ikejemba
1 Department of Industrial Engineering and Business
Information Systems, University of Twente, PO Box 217,
7500 AE Enschede, The Netherlands
123
Int J Energy Environ Eng (2016) 7:177–198
DOI 10.1007/s40095-016-0203-7

Problem owner method (POM): The POM in this con-
text is a condition or a state, whereby the potential loca-
tions considered are provided by a public office, a third
party or an individual. It may be considered as a brownfield
method such that the potential locations are selected from
any existing locations.
Micro-grid: A micro-grid is a miniature power genera-
tion grid that can operate independently (off-grid) or in
concomitance with the area’s main electrical grid (on-grid).
Off-grid energy: Off-grid energy is energy that is pro-
vided by micro-grids to villages and communities that
are—generally—not connected to the main electrical or
national grid.
On-grid energy: On-grid energy is energy that is pro-
vided by national or main electrical grid.
Smart grid: Special case of a micro-grid where com-
munication technology and digital information are utilized
to control and optimize the grid in real time.
Generic concepts for selecting potential locations
The importance of selecting appropriate locations when
designing SWAPs is high. This indicates the line that
defines either the success or failure of the project. It pro-
vides more efficient service and reduces the cost of power
transportation and complications. At an interview carried
out with several decision-makers in the field of renewable
energy (RE) in sub-Saharan Africa (private communication
[2]), a vast majority did not consider the issue of deter-
mining optimal locations when installing solar PV smart or
micro-grids.
However, in the aspect of wind energy, determining the
appropriate locations is important as the direction of the
wind is essential. Nevertheless, more than 80 % of the
interviewees claim the only data they utilize in determining
the appropriate locations is retrieved from the meteoro-
logical department. The interview response shows that the
population, household distribution, community usage data
and several relevant characteristics are not taken into
consideration. It is known that many solar and wind energy
projects in Africa fail due to miscalculations, inappropriate
location selection, investor scare, vandalism, theft and
mismanagement of the resources. The number of failed
renewable energy projects in Africa over the last 20 years
is unacceptable, and verging on the irresponsible. These
failed projects have set back development by raising
aspirations and then failing to deliver. Particularly in sub-
Saharan Africa, the electric utility infrastructure necessary
for large-scale renewable energy power plants is lacking,
which leads to underdevelopment and poverty.
There are, however, multiple methods for selecting
potential location(s) for SWAPs, micro-grids or energy
generation systems, such as the grid method (as utilized in
[1]) and the problem owner method, whereby the problem
owner presents own potential location(s). Both methods
have advantages as well as disadvantages.
Advantages of the grid method:
• Takes into account all possible potential locations,
albeit within a grid structure.
• Directly takes into account geographical and demo-
graphical characteristics.
• With the GM, performing sensitivity analysis is
straightforward; so as to assess the impact that changes
in a certain parameter (grid dimensions) will have on
the conclusions of the experiment.
• Utilizing the GM and our mathematical model, we are
able to minimize the number of facilities required,
based on the demographical and geographical charac-
teristics of the target area.
• Requires less study towards application.
Disadvantages of the grid method:
• Requires a considerable amount of time to design and
determine the appropriate dimensions of the grid.
Sensitivity analysis can, however, be executed to assess
the impact that changes in grid dimensions will have on
the findings of the model.
• Variability in dimensioning grid.
Advantages of the problem owner method:
• Direct availability of potential locations.
• Computation times are short.
• Maximum control.
• Multiple changes can be implemented and experiments
can be carried out in shorter periods of time.
Disadvantages of the problem owner method:
• Does not take into account all possible/potential
locations.
• Probability of omitting better potential locations.
However, this can be curbed by executing an extensive
initial study.
• The number of facilities is dictated and does not
necessarily represent the required number when we
impose the constraint that every demand location is
within a pre-specified distance from a facility.
• The POM mainly focuses on the size of facilities and
may not necessarily consider the requirement of the
communities surrounding the facilities.
Given the absence of modern structural and urban
planning in most African cities, villages and communities,
it is important to select the appropriate locations for
facilities so as to promote the conservation of natural
reserve. However, in such situations of underdevelopment
the difficulty in selecting appropriate locations intensifies.
178 Int J Energy Environ Eng (2016) 7:177–198
123

In the present paper we design two separate, capacitated
networks of SPs and SWAPs, one for Ghana, one for
Nigeria. Each of these is powerful enough to cover—in a
sustainable way—the energy requirement of the majority
of households by a facility within reasonable distance.
The remainder of the paper is structured as follows:
‘‘Related work ’’ presents an overview of relevant litera-
ture. In ‘‘Model variations ’’, we discuss variants of the
SWAP model. In particular, we describe the fewest facil-
ities model, yielding the smallest number of facilities
enabling near-coverage of total demand. Starting from that
smallest number we introduce models for further opti-
mization. We do so both for the grid method as well as for
POM. In ‘‘Power supply infrastructure and SWAP options
in Nigeria and Ghana’’ we analyze the current energy sit-
uation in Nigeria and Ghana, respectively. In addition, the
policies surrounding the provision of off-grid energy (mi-
cro-grids) are discussed. In ‘‘Solution approach’’, we pre-
sent our solution approach where we also develop new
methods, variants and extensions of our model and discuss
their application to Nigeria and Ghana. We take into
account additional characteristics such as existing and
future/planned power plants and population characteristics
per local government area. In ‘‘Bringing our solution
method to practice’’, we implement our solution approach
to determine the appropriate locations for solar parks (SPs)
and solar and wind-assisted parks (SWAPs). In ‘‘Conclu-
sions and further research’’ we present a discussion of the
findings of our solution approach and experiments and
finally, we present the recommendations and conclusions to
the paper.
Related work
Research on location theory started in the early 1900s when
Alfred Weber examined how to locate a single warehouse
such that the total of all distances between the warehouse
and customers is minimal [3]. Following this embryonic
study, location theory was driven by some applications
which inspired researchers from different fields of study.
The development and investment in a new facility such as a
micro-grid or an off-grid energy system, is typically
expensive and a time-delicate project. Before a facility can
be established, candidate sites must be identified, suit-
able capacity specifications must be determined for the
facility, and large amounts of capital must be assigned.
While the main aim driving the location of such a system is
dependent on the individual firm or government, the
soaring costs associated with this action make almost any
location-allocation project a long-term investment. Thus,
SWAPs which are positioned today are anticipated to be
running for a long period of time. Natural changes during
the life-span of the facility can drastically affect the interest
of a particular location, twirling today’s optimal location
into an investment disaster. Therefore, establishing the best
sites for new SWAPs is an important strategic challenge
[4].
In the field of Operations Research, researchers have
created a vast number of mathematical models to solve a
wide range of location-allocation problems. A number of
different objective functions have been devised to make
such models applicable to different situations. Regrettably,
the produced models can be difficult to solve to optimality
[5]. The computational difficulty presented by intricate
location models has, until lately, limited most study in this
realm to fixed and deterministic problems. In the latter, all
inputs such as time, distances and demands are known
quantities and outputs are cited as zero–one decision values
[6]. While such problems can provide users with awareness
about generic location selection, modeling the uncertainties
that are important in making real-world decisions is
impossible for these models. In locating micro-grids and
off-grid energy (SWAPs)—providing either private or
public utility services—it is critical to assure that the
selected location sites serve the cause of minimizing
community cost or maximizing the benefits for the habi-
tants. Likewise, the capacity allocation to these SWAPs
possesses a direct impact on the system’s efficiency as a
whole.
The formulation of the location-allocation model rep-
resents an important role in energy utility planning, as it
yields a framework for exploring problems with regards to
accessibility, differentiating the caliber of previous loca-
tion decisions, and providing several solutions that change
and improve the existing system [7]. A crucial issue
highlighted during the course of this study is the selection
of a suitable objective function or measure. Formulating
the objective function highly depends on the ownership of
the SWAPs, both whether private or public and the con-
dition of the SWAPs, as has been earlier mentioned [8].
In addition, if we compare private to public, private
SWAPs are often cited to achieve stated organizational
objectives, such as maximize profit or minimize cost.
Contrary to private SWAPs, the goals and objectives of
public SWAPs are more strenuous to realize. However,
various possible criteria (objective functions) exist when
viewed from the perspective of location theory. The
problem owner is left to make the decision that aligns with
the proposed goal of optimizing profit, cost or public ser-
vice as the case may be. Furthermore, note that a vast
amount of recent literature exists for locating wind park
facilities, but, to the best of our knowledge no paper cur-
rently exists that discusses selecting the appropriate loca-
tions for SWAPs or Solar Parks in sub-Saharan Africa as
this is important from the perspective of designing a
Int J Energy Environ Eng (2016) 7:177–198 179
123

sustainable energy future for developing countries. Ike-
jemba and Schuur take into account a sense of security
based on distance by introducing a parameter D (maximum
allowed distance for serving a household from a park), as
well as transportation costs, demographical and geo-
graphical characteristics.
In the next section, we showcase the various types of
location models and their applicability in locating SWAPs.
Throughout the paper the following indices, parameters
and decision variables are used:
General list of parameters and decision variables:
Indices:
i ¼ index of demand location; i 2 I;
j ¼ index of potential facility location; j 2 J;
Parameters:
dij ¼ the distance between demand location i
and potential facility location j;
D ¼ maximum allowed distance for serving a demand
location from a facility;
Vi ¼ f jjdij �Dg ¼ set of potential facility locations
within distance D from demand location i;
p ¼ the number of facilities to be located;
hi ¼ demand at demand location i
Decision variables:
Xj ¼1 if a facility is allocated to a potential facility location j;
0 otherwise.
�
Yi ¼1 if demand location i is (fully) served;0 otherwise:
�
Yij ¼1 if demand location i is being served by a facility at j;
0 otherwise:
�
Location models
In this section, we present and review different models with
respect to location-allocation problems. In particular, we
analyze the Maximal Covering Location Problem (MCLP)
and the Basic p-Median Model.
Maximal covering location problem (MCLP)
The maximal covering location problem (MCLP) was first
proposed by Church and ReVelle [9] and is one of the most
familiar models utilized in the planning of public health-
care that seeks to maximize the population to be covered
given a restrained number of clinics. An ample amount of
research has been executed using MCLP to model facility
locations and several techniques—from heuristics to exact
methods—have been suggested to solve the problem.
Several researchers such as Oppong [10], Batta et al. [11],
and Li et al. [12] provide detailed descriptions of these
models. Lately, the MCLP has been utilized to successfully
solve larger problems with higher complexity and prob-
lems with more than one objective [13].
The MCLP aims to obtain the solution to the problem of
locating facilities such that the coverage of demand for
services within a given acceptable service distance is
maximized. Since the MCLP has been shown to be com-
binatorially complex, a number of heuristics have been
developed [14, 15]. Furthermore, the MCLP can be visu-
alized as an alternative formulation of other well-known
location models such as the location set covering model
and the p-Median model [16].
This problem can be formulated in the following way:
Maximize z ¼Xi2I
hiYi ð1Þ
subject to:Xj2J
Xj ¼ p ð2Þ
Xj2Vi
Xj � Yi 8i 2 I ð3Þ
Xj 2 f0; 1g 8j 2 J ð4Þ
Yi 2 0; 1f g 8i 2 I ð5Þ
The objective (1) is to maximize the number of people
served or ‘‘covered’’ within the desired service distance.
The number of facilities allocated is restricted to equal p in
constraint (2). Constraints of type (3) allow Yi equaling 1
only when one or more facilities are established at sites in
the set Vi. Constraints (4) and (5) are binary requirements
for the model variables.
The basic p-Median model
The basic p-Median model established by Hakimi [17] is
one of the most favored models for locating public facili-
ties [18]. According to Sleeb and McLaerty [19], it has
successfully been utilized in controlling the outbreak of
diseases. The model minimizes the distance between cus-
tomers and facilities and can be formulated as follows:
MinimizeXi
Xj
dijYij ð6Þ
subject to:Xj
Xj ¼ p ð7Þ
Xj
Yij ¼ 1 8i ð8Þ
Yij �Xj; 8i; j ð9Þ
Xj 2 f0; 1g 8j ð10Þ
180 Int J Energy Environ Eng (2016) 7:177–198
123

Yij 2 0; 1f g 8i; j ð11Þ
The objective function (6) minimizes the total distance
between demand locations and facilities. Constraint (7)
ensures that exactly p facilities are opened. Constraint (8)
stipulates that every demand location is assigned to pre-
cisely one facility. Constraint (9) authorizes assigning only
to places at which facilities have been located. Constraint
(10) and (11) are binary requirements for the model vari-
ables. A variation of the p-Median model is described as
finding the location of p facilities such that the total
demand-weighted distance between demand locations and
facilities is minimized [20]. Constraints are as above, but
the objective is in this case:
MinimizeXi
Xj
dijYijhi ð12Þ
This p-Median model is captivating since it captures the
fact that as the combined weighted distance of travel is
getting smaller, the more favorable it is for demand loca-
tions to be connected to the nearest facility. It has often
become a norm that the use of facilities decreases expe-
ditiously when the time for customers to reach these
facilities exceeds a specific time. According to Rahman
[21], this is the norm with the use of certain facilities in
rural areas in developing states.
Model variations
Policy makers or public officials (e.g., using the POM) may
have different objectives than those that can be obtained
with the SWAP model [1]. These objectives may lead to
variants of the SWAP model, with different constraints
and/or objective functions. We therefore examine model
variations to provide solutions to problems with different
objective functions that may exist in locating SPs and/or
SWAPs. The following two questions are crucial:
Q1: What is the smallest number of facilities for which
almost all the demand locations have a connection to the
selected facilities within a distance limit D?
Q2: Given a fixed number of facilities, how do we
allocate the facilities optimally? Here, the word ‘‘optimal’’
may refer to different objectives, such as minimal total
(weighted) distance, etc.
The fewest facilities model (FFM)
In this section we consider the question
Q1: What is the smallest number of facilities for which
almost all the demand locations have a connection to the
grid within a distance limit D?
‘‘Grid variant’’ focuses on the grid context. Next, ‘‘POM
variant’’ discusses the POM setting.
Grid variant
When working with a grid (as in Ikejemba and Schuur [1]),
distances between potential facility locations and demand
locations are easily generated. Thus, we may use the fol-
lowing model (which we refer to as FFM-grid):
MinimizeXj2J
Xj ð13Þ
subject to:Xi2I
Xj2Vi
hiYij � aXi2I
hi ð14Þ
Xj2Vi
Yij � 1 8i ð15Þ
Yij �Xj 8i8j 2 Vi ð16Þ
Xj 2 0; 1f g 8j ð17Þ
Yij 2 0; 1f g 8i8j 2 Vi ð18Þ
Objective (13) minimizes the number of facilities nee-
ded. Constraint (14) ensures that a fraction a of the total
demand is satisfied by facilities serving only demand points
within a distance D. Constraint (15) stipulates that every
demand point is at most assigned to one facility within the
specified distance limit D. Constraint (16) authorizes power
distribution only from locations—within a distance D—at
which facilities have been located. Constraints (17) and
(18) are binary requirements for the model variables.
POM variant
In the context of the problem owner method (POM), the
concept of distances is no longer that useful anymore. Let
us explain why. In the POM approach, the potential facility
locations are provided by experts from the Ministry of
Power. Actually, each of these POM locations is given by
the ministry as a sub-state of one of the states. Since every
potential facility location j is a sub-state, it makes sense to
represent the demand locations as sub-states as well. In the
same spirit, let us introduce for every demand location i the
set:
~Vi ¼ jjj is adjacent to if g
which can be conceived as a topological equivalent of the
set Vi introduced before. Here, ‘‘adjacent to’’ may mean
‘‘coinciding with’’ as well.
Now, to find the smallest number of facilities such that a
fraction a of the total demand is satisfied by facilities
serving only adjacent demand points, solve the integer
linear programming problem FFM-grid from the previous
section with Vi replaced by ~Vi. Let us denote the resulting
integer linear program problem by FFM-POM.
Int J Energy Environ Eng (2016) 7:177–198 181
123

Optimal allocation of a fixed number of facilities
Once we have found the preferred number of facilities from
question Q1, it is crucial to allocate the facilities ade-
quately. Hence the question:
Q2: Given a fixed number of p facilities, how do we
allocate the facilities optimally? Here, the word ‘‘optimal’’
may refer to different objectives. Focusing on the grid
variant, let us discuss three ideas:
• Idea 1: Maximizing the demand served with p facilities
and distance limit D.
• Idea 2: Minimizing the total weighted transmission
distance given a total of p facilities.
• Idea 3: Combining Idea 1 and Idea 2 as follows: (1) as
first-priority goal maximize the demand served with p
facilities and distance limit D (2) as second-priority
goal minimize the total weighted transmission distance
given a total of p facilities and given as constraint the
maximal demand served that was obtained as first-
priority goal.
Max hi model
Idea 1: Maximizing the demand served with p facilities
and distance limit D.
The model below is a proposed extension of the p-Me-
dian model. It deals with maximizing the service level in
the case of a distance limit. In Owen and Daskin’s [20]
paper, models exist for which the maximum distance
between demand locations and facilities is minimized. In
this section, we incorporate a distance limit for transmis-
sion from a facility to a demand location. The objective
function below maximizes the demand served with p
facilities and D distance limit.
MaximizeXi2I
Xj2Vi
hiYij
The constraint below ensures that exactly p facilities are
installed.
subject to :Xj2J
Xj ¼ p
The constraint below stipulates that every demand
location is at most assigned to a facility within the specified
distance limit D.Xj2Vi
Yij � 1 8i
The constraint below authorizes assigning only to places at
which facilities have been located within the distance limitD.
Yij �Xj 8i; 8j 2 Vi
The constraints below are binary requirements for the
model variables.
Xj 2 f0; 1g 8j
Yij 2 0; 1f g 8i; 8j 2 Vi
The Max hi model above always provides a feasible
solution since it does not stipulate that all demands have to
be met. Moreover, we know from FFM-grid, constraint
(14), that the objective has a lower bound given by aPi2I
hi.
Clearly, in a POM setting, to maximize the demand
served with p facilities serving only adjacent demand
points, one solves the above Max hi problem with Vi
replaced by ~Vi. Let us denote the resulting integer linear
program problem by Max hi-POM.
The minimum transmission distance model (MTDM)
Idea 2: Minimizing the total weighted transmission dis-
tance given a total number of p facilities. This is the
variation of the p-median model discussed in ‘‘Location
models’’ [20]:
MinimizeXi
Xj
dijYijhi
subject to :Xj
Xj ¼ p
Xj
Yij ¼ 1 8i
Yij �Xj 8i; j
Xj 2 f0; 1g 8j
Yij 2 0; 1f g 8i; j
Combining the max hi model with the MTDM model
Idea 3: Combine the Max hi model with the MTDM model
as follows:
MinimizeXi
Xj
dijYijhi
subject to :Xi
Xj2Vi
Yijhi ¼ optimal value ofMaxhi
Xj
Xj ¼ p
Xj
Yij � 1 8i
Yij �Xj 8i; j
Xj 2 f0; 1g 8j
182 Int J Energy Environ Eng (2016) 7:177–198
123

Yij 2 0; 1f g 8i; j
Of course, one should be careful when executing the Max
hi or the combined approach, because it could potentially
exclude coverage areas when dealing with a given p number
of facilities. In situations where all possible households are
to be covered, it is advisable to run the models with varia-
tions of p until the constraintP
j Yij ¼ 1 holds.
Power supply infrastructure and SWAP optionsin Nigeria and Ghana
In Ikejemba and Schuur [1] a multi-step approach—in-
cluding mathematical programming—was developed to
design a capacitated network of SPs and SWAPs in South-
Eastern Nigeria, taking into account geographical and
demographical characteristics. In this section, we examine
SWAP options for Nigeria and Ghana. We introduce con-
straints that take into account power stations, future
plans/expansion of power stations, current solar facilities
(if existing) and current wind statistics. Our research
focuses on the design of SWAPs to support existing power
infrastructure and to power off-grid communities. In
addition, when designing SWAPs for off-grid communities
and villages, the specific energy requirements are taken
into consideration from surveys and interviews.
‘‘Power supply in Nigeria’’ outlines the existing and
future power supply infrastructure in Nigeria, as well as the
options for renewable energy. The same is done in ‘‘Power
supply in Ghana’’ for Ghana. ‘‘Comparing the power sup-
ply infrastructure of Nigeria and Ghana’’ compares the
power supply infrastructure of both countries, as well as the
consequences thereof for our approach.
Power supply in Nigeria
The Federal Ministry of Power in Nigeria indicated that the
country’s peak power generation as of late 2014 was
approximately 3513.5 MW, against a peak demand of
12,800 MW. So, only 27 % of the peak demand was sat-
isfied [22]. Nigeria is currently ranked as the third largest
country without access to electricity by the International
Energy Agency (IEA), whereas recent specialized research
indicates that a 100 % steady power supply from renew-
able energy is conceivable in Nigeria [23]. The Nigerian
Government is prone to produce, transmit, and disperse
35,000–40,000 MW of electricity according to the devised
year 2020 goal which would entail a yearly investment of
approximately $4 billion over a period of (presumably)
7 years [24]. However, the proposed paramount mover of
this vault in generation is natural gas, ready to be saddled
from Nigeria’s tremendous reserves. As per the August
2013 Roadmap, the Federal Government of Nigeria aspires
to expand energy production from fossil fuel sources to
more than 20,000 MW by 2020. It is without doubt that
Nigeria is blessed with adequate RE assets to meet its
present and future development prerequisites. Be that as it
may, the hydropower plants are the main sustainable
resources currently being utilized. However, the inability
of the hydro power plants to work at installed capacity is
usually credited to subsequent causes such as: (1) seasonal
variation in flow to the reservoir; (2) inter-annual variation
in flow to the reservoir; (3) conflict among competitive
uses; (4) sediment trapped in the reservoir; (5) upkeep and
extra part issues; (6) insufficient fund; (7) human resources,
and (8) strategy/policy issues [25].
Figure 1 shows where the main power plants (produc-
tion) in Nigeria are currently located and also showcases
the sizes of power generating plants per city in the country.
This data is important in determining the appropriate
location for SWAPs in Nigeria as illustrated on a smaller
independent scale in Anambra State located in the south-
eastern part of the country. As of December 2014, the total
installed capacity of the power plants was 7445 MW.
Available capacity was 4949 MW (2014 Year in Review,
Presidential Task Force on Power, Pg. 53). Actual average
generation was significantly less than 3900 MW. Almost
all the gas-powered plants listed in Table 1 have consid-
erable gas shortages due to constraints in supply, thereby
adding to the impediment of power generation. There
currently are 81 registered licensed power generating
companies in Nigeria according to the Nigerian Electricity
Regulatory Commission with power generation ranging
from just 1 MW to approximately 3000 MW. However, it
is difficult to track down on actual generation as over 50 %
of the registered licensed organizations are off-grid and
there is no federal or state infrastructure or system in place
to determine which organizations actually generate power
or how much power is actually being generated.
Figure 2 depicts the Nigerian power grid source indi-
cating both the current principal power plants and the
future planned installations. The figure also shows the
transmission grids for both present and future. However,
when we analyze the current status and future outlook of
the transmission, we find that the current transmission
capability is substantially less than 6000 MW for the whole
country. More importantly, the current infrastructure has a
significantly high technical loss, which in power trans-
mission includes theft of electricity by felonious users
spouting the transmission lines (as explained in Ikejemba
and Schuur [1]), but is also attributed to poor equipment
maintenance, planning and calculation mistakes, misman-
agement of processes and accounting errors. In addition,
the current transmission infrastructure has a low infras-
tructure coverage of less than 40 % of the population and a
Int J Energy Environ Eng (2016) 7:177–198 183
123

low per capita generation of less than 25 W [26]. Ikejemba
and Schuur [1] indicate the high potential of solar energy in
Nigeria and sub-Saharan Africa in general. Nigeria’s geo-
graphical location is an advantage that facilitates energy
generation from the sun in a large quantity. It is also
important to note that if solar panels or modules were
utilized to cover 0.01 of Nigeria’s land area, the possibility
to generate 1850 � 103 GWh of solar electricity per year
is attainable; this is one hundred times more than the cur-
rent grid electricity consumption level in the country [27].
Currently, wind energy is not utilized as part of the
energy generation in Nigeria. What is accessible is artifacts
indicating its past use. Be that as it may, the determination
to implement a sustainable resolution to the energy crisis in
Nigeria has provoked the legislature and additionally
autonomous analysts to survey the country’s possibilities
for wind power generation [28]. Individual researchers on
their part have made various assessments of potentials and
availability to determine the magnitude of wind resources
as shown in Ikejemba and Schuur [1]. Research activities
on wind energy prospect in Nigeria, whatever the boundary
of their uncertainties, have identified that extraordinary
potential exists in wind energy for power generation in
Nigeria. However, it is established that the wind speeds are
frail in the southern part, except for the waterfront, coastal
and seaward locations which are blustery. Offshore terri-
tories from Lagos through Ondo, Delta, Rivers, Bayelsa to
Akwa Ibom States were accounted for to have possibilities
for reaping solid wind energy throughout the year. Within
the country, the wind speed in the northern region was
reported as the strongest. Moreover, the mountainous
landscape of the middle belt and northern border exhibit a
high potential for substantial wind energy. It was, however,
detected that, attributable to difference in topography and
irregularity in landscape, sizeable differences may be pre-
sent within the same area [29].
Most results [30] in the light of utilizing 40 years
(1968–2007) accessible average wind information from the
entire 44 wind stations covering the states of the country
indicate that, the nation’s wind jurisdiction is found to lie
Fig. 1 Power plants in Nigeria differentiated by plant capacity [45]
184 Int J Energy Environ Eng (2016) 7:177–198
123

between inferior and average. The southern states have
their average wind profile at 10 m height in the range
between 3.0 and 3.5 m/s, contingent upon the states, and
northern states fit with mean wind paces of between 4.0 and
7.5 m/s. This implies that Nigeria has great wind resources
in almost all locations within the country. In spite of the
fact that wind speeds in the southern states are low, they
can be utilized for standalone SWAPs to generate power
utilizing small-scale wind turbines [28]. This if utilized,
will be a noteworthy leap forward for the country and sub-
provincial territories not connected to the national power
grid. However, given the technological advances between
2007 and 2015, it is possible to implement wind technology
virtually in any location with minimal wind speed as cur-
rent technology (due to a confidentiality clause the names
of the wind technology have been omitted) utilizes mini-
mum wind speed to generate adequate power to small
villages and communities across sub-Saharan African
countries.
Power supply in Ghana
Energy supply in Ghana has worsened over the years,
impacting businesses, manufacturers, organizations and
households vigorously, with regulators blaming the crisis
on declined water levels in the dams coupled with gas
shortage to power Ghana’s thermal plants. In view of the
strew of information, it is relatively arduous to acknowl-
edge the actual installed capacity of power in Ghana.
Nevertheless, a selection of facts and information indicates
that it ranges between 2000 and 2800 MW with actual
power availability falling between 1200 [31] and
2000 MW [32]. This serves a population of 25 million that
is growing at 2.1 % per year. With a client base of roughly
1.4 million, it has been evaluated that 45–47 % of Ghana
households, including 15–17 % of the rural communities,
have access to grid power. All the regional capitals have
been anchored to the national grid (see Fig. 3). This fig-
ure also shows the small and medium hydro resources in
Ghana. Power utilization in the rural regions is assessed to
be higher in the waterfront region (27 %) and forest (19 %)
biological zones than in the savannah (4.3 %) regions of
the nation. Urbanization in Ghana was anticipated to
increase from around 40 % in 2000 to around 55 % in 2012
and in the long run to 60 % by 2020. Somewhat more than
33 % of the urban populace lives in Greater Accra and is
relied upon to stretch around 40 % by 2020 [34]. An
impressive amount of family spending goes into energy
usage. Power sources in urban zones are more enhanced
than in the rural regions, since access to different types of
commercial fuels and machines is higher in the urban zones
than in the country regions. Frequently the costs of power
alternatives are higher in the provincial regions than in the
urban areas where salaries are lower.
The government of Ghana have been seeking after a
national energy policy. However, a large portion of the
population stays without connection to the national power
grid. It is exceptionally expensive to construct long-interval
transmission lines to serve little groups, particularly when
these groups are generally poor and cannot sustain to pay
Table 1 Power plant availability versus energy requirement for the highly populated 16 states
State Power plant
available?
(yes/no)
Operational, partially
operational, not
operational
Peak plant
size (MW)
Minimum energy
requirement (MW)
Energy support
coefficient
New SWAP
required?
(yes/no)
Lagos Yes Partially operational 1080 2344 0.46 Yes
Kano No N/A 2430 ESC\ 1 Yes
Anambra No N/A 1053 ESC\ 1 Yes
Rivers Yes Partially operational 624 1350 0.46 Yes
Kaduna No N/A 1557 ESC\ 1 Yes
Imo Yes Non operational 1010 ESC\ 1 Yes
Katsina No N/A 1477 ESC\ 1 Yes
Akwa Ibom Yes Non operational 1014 ESC\ 1 Yes
Oyo No N/A 1450 ESC\ 1 Yes
Bauchi No N/A 1209 ESC\ 1 Yes
Abia Yes Partially operational 118 714 0.17 Yes
Jigawa No N/A 1105 ESC\ 1 Yes
Ebonyi No N/A 549 ESC\ 1 Yes
Benue No N/A 1083 ESC\ 1 Yes
Ekiti No N/A 614 ESC\ 1 Yes
Osun No N/A 879 ESC\ 1 Yes
Int J Energy Environ Eng (2016) 7:177–198 185
123

rates sufficiently high to take care of the expense of these
power services. In addition, there is little to no verification
of increased economic activities in areas or communities
that benefited from the national electrification scheme [33].
Micro-grids (smaller scale power generation) and provin-
cially installed generation systems such as solar panels,
wind turbines, batteries and so forth can be more reason-
able. In any case, it is expected that rural electrification will
continue to be a challenge for the nation. The Minister for
Power of the Republic of Ghana has, however, guaranteed
the country that the power catastrophe would be over
before the end of 2015 after various measures he said
government was executing [31]. Then again, numerous
individuals question the promise as this is not the first time
government authorities have given such affirmations of
ending the sporadic power supply going for a long time
now. With the heightened power problems in the nation,
government has opened up the area to permit private seg-
ment interest in power generation. In Ghana, the total
installed generation capacity as of December 2010 was
2186 MW [35]. However, currently the estimated installed
capacity is somewhat between 2000 and 2800 MW. This
includes:
• The Akosombo Hydroelectric Power Plant with an
installed capacity of 1020 MW. The Akosombo plant
has been retrofitted with the replacement of the old
turbine runners with new ones as well as electrome-
chanical works aimed at restoring the plant to its original
condition. The retrofit was completed in March 2005.
Fig. 2 Nigeria’s power grid source [present and future]—[46]
186 Int J Energy Environ Eng (2016) 7:177–198
123

Fig. 3 Ghana grid power source [46]
Int J Energy Environ Eng (2016) 7:177–198 187
123

• 160-MW Kpong Hydroelectric Power Plant.
• 550-MW installed thermal capacity at the Takoradi
Thermal Power Station.
• 126-MW Diesel Power Plant at Tema 1 and 50 MW at
Tema 2.
• 200-MW Sunon-Asogli (SAPP) thermal plant nd80-
MW Mines reserve plant (MRP)
A 125-MW Power Barge ‘‘the Osagyefo Power Barge’’
is also available and is currently berthed at Effasu Mangyea
in the Western Region with arrangements ongoing to
establish viable fuel sources for it. The Osagyefo Barge
was developed by the Ghana National Petroleum Corpo-
ration in order to utilize the natural gas available in the
Tano oil and gas fields for power generation. The barge has
been completed and is yet to go into commercial operation
[33]. It is difficult to ascertain the clear number of power
plants currently in Ghana because a substantial number of
power plants are known to exist or forecasted, but the
actual installed capacity and/or actual generation is
unknown. Adding to the difficulty, as is the case in Nigeria,
there are no mechanisms or infrastructure in place to
account for updated data on the issues surrounding the
power plants. However, a number of future thermal power
stations and hydro-electric power stations have been
planned for the country. This can be seen in Fig. 3. Until a
couple of years back, there was minimal financial enthu-
siasm for creating power from scaled down hydro plants in
Ghana, as an overabundance of inexpensive power from
the hydro power facilities at Akosombo and Kpong was
accessible. Therefore, a considerable number of the smaller
hydro locales that were discovered suitable for advance-
ment for the rural communities were not developed; and,
starting now, some of these rural communities have either
been connected with the main national grid or are within a
couple of kilometers from the national grid [36]. Subse-
quently, the improvement of these communities for elec-
trification has been debilitated impressively.
Just like Nigeria, Ghana is abundantly blessed with a
plenty of renewable energy forms. It is among the nations
in the Economic Community of West African States
(ECOWAS) with tremendous renewable energy potential.
All the major renewable energy resources like the sun,
wind, biomass and hydro can possibly enhance the power
generation for the nation. The average daily sun light level
of the nation ranges from 4 to 6 kWh/m2, with the most
astounding potential happening in the northern part of the
nation where the electrification rate is extremely low [37].
Wind speed over 6 m/s at a height of 50 m has been
determined for some locations, indicating the feasibility for
grid and off-grid power as well as for pumping water [38].
The largest photovoltaic (PV) project in Africa, the Nzema
project, that is being designed to be situated in Ghana, is
expected to provide electricity to more than 100,000
households [39]. The expected 155 MW plant will increase
Ghana’s electricity generating capacity by 6 %. Installation
of more than 630,000 solar PV modules was expected to
begin by the end of 2013 with electricity being generated
early in 2014 and due to reach full capacity at the end of
2015 [39].
Nevertheless, this has not been the case as the US
$350 million scheme has been delayed for unknown rea-
sons usually faulted on the issues of funding and in turn
delaying the project till 2017. This raises the hopes of
businesses and individuals who hope to gain from the
electrification and only to be let down by the delay caused.
Based on a short interview and survey carried out in Accra
(private communication [40]), a regular statement per-
ceived from households in villages and communities is:
‘‘So many foreign companies and organizations visit
us and carry out surveys on renewable energy and
provide us with hopes of electrification. However, for
so many years we have never heard from them and as
such we are tired of hearing about development
projects. We want the project to present itself’’.
Nonetheless, this does not affect the solar energy
potential that Ghana possesses as is the case in Nigeria. It is
the main goal of the Ghana power industry to have
approximately 10 % of its energies generated from RE
sources excluding large-scale hydropower by 2020 [41]. It
is also without doubt that Ghana has great wind resources
and locations of the high wind areas—such as the Accra
Plains, Nkwanta, Gambaga mountains and Kwahu. These
locations are similar to the locations in Nigeria with fea-
sible wind potentials based on the technology utilized. The
topmost energy that could be exploited from Ghana’s
available wind resource for power is estimated to be about
500–600 GWh/year according to the Arakis Energy Group
[42]. To give an example—according to the Energy
Commission of Ghana in 2011, the largest Akosombo
hydroelectric power station in Ghana produced 6495 GWh
of electricity and, including all Ghana’s geothermal power
stations in addition, total energy generated was
11,200 GWh in the same year [42]. However, these anal-
yses do not take into account further constraint factors.
Wind power in Ghana can possibly contribute altogether to
the nation’s energy industry giving the present advances in
wind energy innovation. It is doable and conceivable to
execute small-scale wind power generators to villages and
communities with negligible wind possibilities. Construc-
tive disposition of technologies for distributed energy
generation in rural areas where the renewable energy
resources are available can help quell the present energy
crisis in Ghana as is the case with our research. Expansion
of energy resources to incorporate renewable resources
188 Int J Energy Environ Eng (2016) 7:177–198
123

remains a key scheme of the government [43]. This pre-
sents high potential for grid and off-grid joint RE
applications.
Comparing the power supply infrastructure
of Nigeria and Ghana
The power supply infrastructure of Nigeria is quite similar
to that of Ghana, albeit that Ghana has more hydro power
in place. However, Ghana has a smaller population than
Nigeria that is primarily concentrated in the highly popu-
lated areas. Consequently, we apply a simpler approach to
Ghana than to Nigeria. In fact, we use only the grid
method. In the sequel, we confine our methodological
discussion to Nigeria. However, in the end, we present our
final findings for both countries.
Solution approach
In this section, we present diverging potential solution
approaches to be utilized in locating SWAPs so as to meet
the energy demand of each of the two countries. We take
into account geographical, demographical and meteoro-
logical characteristics.
Assumptions
In implementing our solution approaches we make the
following assumptions:
1. The population within a specific state with power
plants has priority to be served before power is
exported out of the state (i.e., households with the
closest proximity to the power plants are served first
until the capacity of the plant is fully utilized).
2. Energy requirement per state is approximated based on
the population and present and future energy plants of
the country.
3. For states with power plant(s) meeting the energy
requirement of the population no additional SWAPs
are considered.
4. The population per sub-state is uniformly distributed.
Solution approach 1—grid approach applied
cluster-wise
This solution approach is utilized for states with consid-
erably high population density and no set of power plants
meeting the energy requirement of the population within
the state. The approach is similar to that utilized by Ike-
jemba and Schuur [1]. However, for this approach to work
in the present context, it is important to demarcate the
locations within the countries into clusters representing the
states. For a specific cluster we proceed as follows:
Step 1: Construct a longlist of potential locations for
SPs and SWAPs. To this end we place a suitable grid over
the cluster. Each grid point is turned into a demand location
by identifying the number of households around it. For
potential SP locations, we take grid points that are com-
patible with current land use. For potential SWAP loca-
tions, we take grid points that—on top of that—have
enough wind potential.
Step 2: Construct a shortlist of potential locations for
SPs and SWAPs. Stipulate that any of the facilities on this
shortlist may only serve demand locations within a certain
distance D. In this step the longlist from Step 1 is reduced
by taking into account the major and minor urban areas and
the cost of transporting energy.
Step 3: Solve an integer linear programming problem
yielding a smallest subset of the shortlist (SPs and SWAPs
together) such that almost all (say 95 %) of the overall
energy requirement is covered.
Step 4: Solve an integer linear programming problem
yielding a smallest subset of the SWAPs appearing on the
shortlist from Step 2 such that a substantial part of the
overall energy requirement is covered. In this step we
concentrate on SWAPs, since these parks are preferable to
SPs.
Step 5: Combine the subsets found in Step 3 and Step 4
and let the facilities that are close coincide.
As in Ikejemba and Schuur [1], the model utilized in
Step 3 as well as in Step 4 to execute the grid approach is
given by FFM-grid (see ‘‘Grid variant’’).
Solution approach 2—POM approach
This solution approach is utilized for the collection S of
states with low population density and no set of power
plants meeting the energy requirement of the population
within the state. We start off from a list of potential loca-
tions for SWAPs. Since the POM approach is used, these
potential facility locations are provided by experts from the
Ministry of Power. From this list consider the set ~J of all
those locations that are situated within one of the states of
the collection S.
Recall from ‘‘POM variant’’ that each of these POM
locations is given by the ministry as a sub-state of one of
the states of S. Since every potential facility location j from~J is a sub-state, it makes sense to represent the demand
locations as sub-states as well.
Now, to ensure that a fraction a of the total demand of
all sub-states adjacent to a sub-state from ~J is satisfied,
solve the integer linear programming problem FFM-POM
from ‘‘POM variant’’.
Int J Energy Environ Eng (2016) 7:177–198 189
123

Bringing our solution method to practice
Focusing on Nigeria, we begin by analyzing the population
of the states and extracting the top 10 states with the largest
population. This is followed by further analysis on the
states with a large population density. Amongst the 36
states in Nigeria only three states appear on both lists of
most populated and with a high density. However, to
reduce the number of demand locations and variables for
our POM method (see ‘‘Solution approach 2—POM
approach’’), we opt to merge the list of most populated
areas with the highest density, thus obtaining a total list of
16 states.
Next, for each of these 16 states, we verify whether a
power plant is within the state and, if so, calculate the
energy support coefficient (ESC), which is the ratio of the
total energy provided by the plant to the total energy
required by the state. However, it should be noted that as of
May 2015, the Nigerian Electricity Regulatory Commis-
sion (NERC) reported that only five of the total power
Fig. 4 Proposed SWAPs for Bauchi state
190 Int J Energy Environ Eng (2016) 7:177–198
123

plants in Nigeria were functional. This has been attributed
to the shortage of gas to the plants and water management
problems at the hydro plants [44]. This fuels the need for
the country to develop and implement renewable resources
in a decentralized manner. From Table 1 it is clear that
each of these 16 states requires a SWAP to help satisfy the
energy requirement of the population.
Grid approach applied cluster-wise
In this section, we utilize the FFM-grid model for each of the
16 states considered highly populated and with a high pop-
ulation density. We solve the associated ILP (see ‘‘Grid
variant’’) for various values of a around 0.7 using advanced
integrated multidimensional modeling software. This is
Fig. 5 Proposed SPs and SWAPs for Akwa Ibom state
Int J Energy Environ Eng (2016) 7:177–198 191
123

Table 2 Selected facility locations for the highly populated 16 states
State No. of selected locations Energy requirement (MW) Sub-state locations Type Size (MW)
Lagos 3 1264 Epe SP 42
Kosofe SP 157
Badagry SWAPs 55
Kano 4 2430 Kibiya SWAPs 102
Dawakin Tofa SWAPs 181
Warawa SWAPs 97
Karaye SWAPs 106
Anambra 6 1157 Nnewi South SP 49
Ihiala SP 63
Orumba North SWAPs 36
Onitsha North SP 26
Awka North SWAPs 23
Anyamelum SWAPs 33
Rivers 1 726 Degema SWAPs 146
Kaduna 3 1557 Kaura SPs 82
Ikara SWAPs 92
Giwa SWAPs 138
Imo 2 1010 Ideato North SPs 93
Ohaji SPs 109
Katsina 3 1477 Batagarawa SWAPs 101
Faskari SWAPs 104
Musawa SPs 91
Akwa Ibom 6 1014 Etim Ekpo SPs 30
Ibeno SWAPs 21
Eastern Obolo SWAPS 17
Uruan SPs 33
Ibiono Ibom SPs 54
Etinan SPs 48
Oyo 2 1450 Oluyole SPs 207
Olorunsogo SPs 83
Bauchi 3 1209 Gamawa SWAPs 72
Toro SWAPs 87
Alkaleri SWAPs 83
Abia 2 596 Arochukwu SPs 79
Ukwa West SPs 41
Jigawa 3 1105 Biriniwa SWAPs 65
Ringim SWAPs 88
Garki SPs 69
Ebonyi 2 549 Ishielu SWAPs 54
Afikpo South SPs 56
Benue 3 1083 Oju SWAPs 84
Logo SWAPs 85
Apa SPs 48
Ekiti 2 614 Ikole SPs 62
Ekiti South West SPs 61
Osun 2 879 Odo-Otin SPs 99
Isokan SPs 77
192 Int J Energy Environ Eng (2016) 7:177–198
123

because given that the highly populated states have their
inhabitants mostly clustered within an area it is easy to cover
a higher number of the population with a low a value. The
solution is rather insensitive to a and is given by the fol-
lowing set of parks as seen in sample Figs. 4 and 5 for Bauchi
and Akwa Ibom state, respectively. Furthermore, Table 2
presents a compiled solution for each of the 16 states.
In Fig. 4 below, it can be seen that only SWAPs have
been allocated to the state. This represents a feasible
solution because Bauchi state is one of the states with an
excellent wind potential in the northern part of the country.
However, in Akwa Ibom state (see Fig. 5), a different
scenario is obtained for both SPs and SWAPs. SPs have
been indicated to perform better inland of the state.
Although there is potential for SWAPs given the mean
wind speed of the state, offshore SWAPs locations south of
the state will be preferable.
The computational results for the rest of the high-density
states can be seen in Table 2. The corresponding plant sizes
are attributed to the population of the sub-state together
with that of the surrounding sub-states. Let us clarify this.
Suppose after solving the FFM-grid problem for a certain
state we obtain Y�ij and X�
j as optimal values of the decision
variables. Then they cover two essential issues:
(1) the number of parks needed:P
j2J X�j
(2) the required capacity Fj per facility j
(3) Fj ¼P
i2WjhiY
�ij where Wj ¼ f ijdij �Dg
So, when we aim for an energy coverage of 70 % in the
highly populated states, then we need 47 facilities to
accomplish this, of which 24 are SPs (so there is not
enough wind), and 23 are SWAPs (enough wind). A mix-
ture of SPs and SWAPs is not occurring, primarily because
Fig. 6 Proposed locations for SPs and SWAPs for highly populated areas in Nigeria generating coverage of 70 %
Int J Energy Environ Eng (2016) 7:177–198 193
123

of lack of space. Figure 6 shows the locations of these 15
facilities.
POM approach applied on the set of less densely
populated states
In this section, we utilize the FFM-POM model for the rest
of the 20 states not included in the previous experiment
(i.e., the less densely populated states). However, in this
case we carry out a two step-approach. Hereby, we initially
utilize the FFM-POM model (see ‘‘POM variant’’). Having
obtained the minimal number (say p) of facilities needed,
we use this number in the Max hi-POM model to find the
set of p facility locations that maximizes the demand
covered.
We solve the FFM-POM problem with various values of
a using the advanced integrated multidimensional model-
ing software. The output (i.e., the number of SPs and
SWAPs to locate) based on the values of a can be seen in
Table 3. Next, we execute the Max hi-POM problem, the
output of which is represented by whether a location is
selected or not based on the result value of a.Let us illustrate the interpretation of the table. Suppose,
we aim for an energy coverage of 70 % in the lowly
populated states then we need 15 facilities to accomplish
this, of which six are SPs (so there is not enough wind),
four are a mixture of SWAPs and SPs (so wind is moder-
ate), and five are SWAPs (enough wind). Figure 7 shows
the locations of these 15 facilities.
Main results for Ghana
For brevity of exposition, let us only briefly indicate our
results for Ghana. For Ghana we used only the grid
approach since Ghana has a smaller population that is
primarily concentrated in the highly populated areas. Given
that Ghana has numerous hydro-power plants running short
of water, it is important that a backup system be introduced
for those plants. However, small-sized SPs and SWAPs
could be implemented in areas where power is unreachable
Table 3 SPs and SWAPs to be
located for the 20 lowly
populated stated for various
values of a
State POM locations Location selected (yes/no) Type Size (MW)
a = 0.6
p = 12
a = 0.7
p = 15
a = 0.8
p = 19
a = 0.9
p = 21
F.C.T Abuja Yes Yes Yes Yes SWAPs 103
Kogi Adavi Yes Yes Yes Yes SPs/SWAPs 52
Ondo Akure North Yes Yes Yes Yes SPs 50
Okitipupa No Yes Yes Yes SPs 44
Taraba Bali Yes Yes Yes Yes SPs/SWAPs 51
Cross river Biase Yes Yes Yes Yes SPs 61
Obudu No Yes Yes Yes SPs/SWAPs 47
Nasarawa Doma Yes Yes Yes Yes SWAPs 55
Enugu Enugu East Yes Yes Yes Yes SPs/SWAPs 49
Edo Etsako West No No No Yes SPs 36
Ovia North East No No Yes Yes SPs 40
Ogun Ewekoro Yes Yes Yes Yes SPs 64
Yobe Fune No No Yes Yes SWAPs 41
Adamawa Hong No No No No – –
Jada No No No No – –
Kwara Ilorin West No No No No – –
Pategi No No Yes Yes SPs 38
Plateau Jos South Yes Yes Yes Yes SPs 51
Langtang South No No No No SPs/SWAPs 27
Bayelsa Kolokuma No No No Yes SPs/SWAPs 36
Gombe Kwami Yes Yes Yes Yes SWAPs 59
Kebbi Maiyama No No No No – –
Zamfara Maru Yes Yes Yes Yes SWAPs 52
Delta Okpe Yes Yes Yes Yes SPs 67
Sokoto Sokoto North No No Yes Yes SWAPs 36
Sokoto Tambuwal No Yes Yes Yes SWAPs 44
194 Int J Energy Environ Eng (2016) 7:177–198
123

to people off-grid. Taking all the above into account in our
experiment, we found five locations for SWAPs and nine
for SPs. They are situated as indicated by Fig. 8.
Conclusions and further research
In this paper, we develop a hybrid approach to design a
nation-wide capacitated network of solar parks (SPs) as well
as solar and wind-assisted parks (SWAPs) (i.e., parks that
generate both solar and wind energy) for two separate
countries: Nigeria and Ghana. We take into account geo-
graphical, demographical and meteorological characteristics.
The power supply infrastructures of both countries, as
well as the policies surrounding the provision of off-grid
energy are analyzed in depth. In tackling the location
problems occurring, we present the advantages and disad-
vantages of the grid method—utilized in our previous
paper—and the so-called problem owner method (POM).
In the POM, each potential facility location is provided by
experts from the Ministry of Power, rather amply as a sub-
state of one of the states. Therefore, in the POM approach
we are forced to shift from the distance concept—used in
the grid method—to a more topological vicinity concept.
We choose for a hybrid approach by combining the grid
and the problem owner method. We apply the grid method
to regions with high population density and utilize the
POM for less populated areas. Furthermore, we take into
account power plants that are operational or will be so in
the near future.
In the above fashion we design two separate, capacitated
networks of SPs and SWAPs, one for Ghana, one for
Nigeria. For Nigeria, coverage of the lowly populated areas
varies from 60 % (if we place 12 facilities) to 90 % (if we
place 21 facilities). To accomplish 70 % coverage for the
whole of Nigeria we need: (1) 15 facilities for the lowly
populated areas, of which six are SPs (so there is not
enough wind), four are a mixture of SWAPs and SPs (so
wind is moderate), and five are SWAPs (enough wind); (2)
47 facilities for the highly populated areas, of which 24 are
SPs, and 23 are SWAPs. A mixture of SWAPs and SPs is
not feasible in the latter areas. As for Ghana, we found five
locations for SWAPs and nine for SPs
Thus we obtain a blueprint of a capacitated network of
SPs and SWAPs that satisfies—in a sustainable way—the
energy requirement of the majority of households by a
facility within reasonable distance. In our research we
make a number of assumptions. For instance, we assume
that the population within a specific state with power plants
has priority to be served before power is exported out of the
state. Currently, this is generally not the case, leading to
power loss due to long transmission lines. Moreover, we
assume that the population per sub-state is uniformly
distributed.
Fig. 7 Proposed locations for
SPs and SWAPs for lowly
populated areas in Nigeria
generating coverage of 70 %
Int J Energy Environ Eng (2016) 7:177–198 195
123
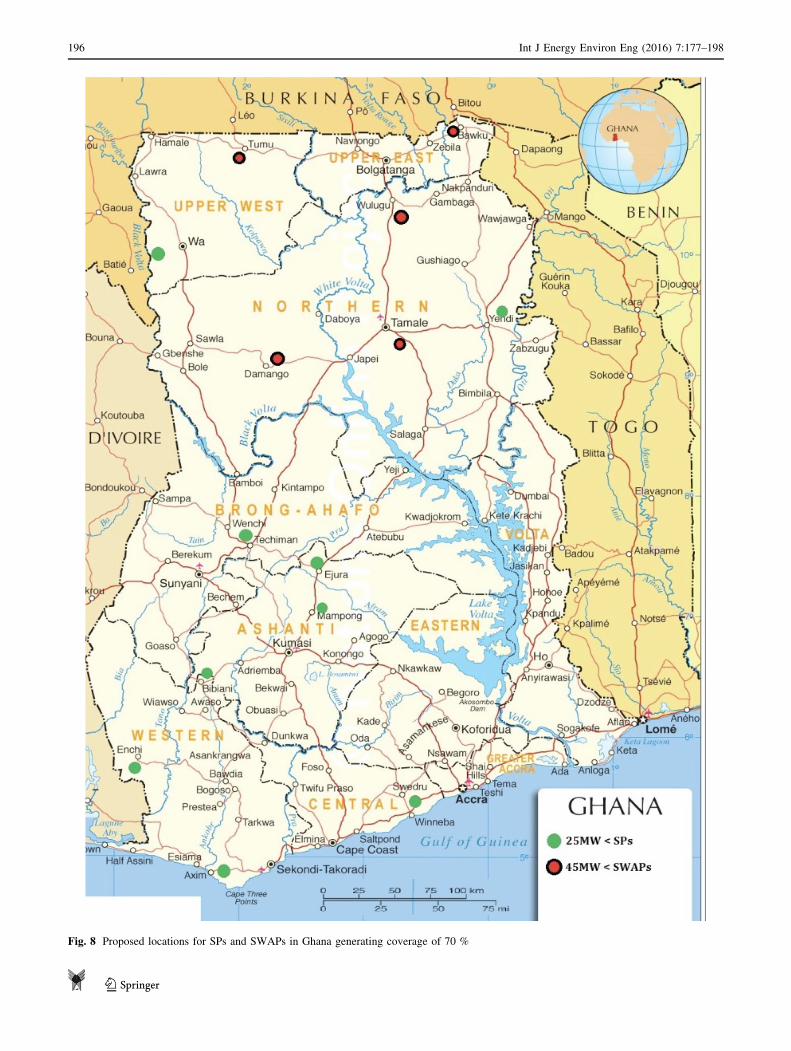
Fig. 8 Proposed locations for SPs and SWAPs in Ghana generating coverage of 70 %
196 Int J Energy Environ Eng (2016) 7:177–198
123
Future research may take into account a detailed anal-
ysis of the widely branching and intricate electricity dis-
tribution system including the inherent power loss. Also,
actual demographic data may be used. Another interesting
issue is the cost factor, which was left out. One may think
of a break-even analysis taking into account the higher
costs for wind parks. All in all, we are convinced that the
present study is both an enabler as well as a blueprint
towards a sustainable energy future for Nigeria as well as
Ghana.
Open Access This article is distributed under the terms of the
Creative Commons Attribution 4.0 International License (http://crea
tivecommons.org/licenses/by/4.0/), which permits unrestricted use,
distribution, and reproduction in any medium, provided you give
appropriate credit to the original author(s) and the source, provide a
link to the Creative Commons license, and indicate if changes were
made.
References
1. Ikejemba, E.C.X., Schuur, P.C.: Locating solar and wind parks in
South-Eastern Nigeria for maximum population coverage: a
multi-step approach. Renew. Energy. 89, 449–462 (2016)
2. Odim, F., Abu, R., Ahavi, A.: Interviewees, implementation of
PV plant projects in Africa. [Interview]. 15–25 September (2015)
3. Weber, A.: Alfred Weber’s Theory of the Location of Industries.
Chicago Press, Chicago (1929)
4. Ye, L., Chuang, Y.: Location set covering for waste resource
recycling centers in Taiwan. Resour. Conserv. Recycl. 55,979–985 (2011)
5. Meng, L., Ma, Q., Han, C., Wu, Q.: Determining the number of
facilities for large-scale emergency. Int. J. Comput. Sci. Math. 4,242–251 (2013)
6. Berman, O., Hajizedeh, I., Krass, D.: The maximum covering
problem with travel time uncertainty. IIE 45, 81–96 (2013)
7. Rahman, S., Smith, D.K.: Deployment of rural health facilities in
a developing country. J. Oper. Res. Soc. 50, 892–902 (1999)
8. Rushton, G.: Selecting the objective function in location-alloca-
tion analyses. In: Ghosh, A. (ed.) Spatial Analysis and Location-
Allocation Models. Ghosh and Rushton: New York (1987)
9. Church, R., Re Velle, C.: The maximal covering location prob-
lem. Reg. Sci. Assoc. 32, 101–118 (1974)
10. Oppong, J.: Accommodating the rainy season in third world
location-allocation applications. Socio-Econ. Plan. Sci. 30,121–137 (1996)
11. Batta, R., Lejeune, M., Prasad, S.: Public facility location using
dispersion, population, and equity criteria. Eur. J. Oper. Res. 234,819–829 (2014)
12. Li, X., Zhao, Z., Zhu, X., Wyatt, T.: Covering models and opti-
mization techniques for emergency response facility location and
planning: a review. Math. Methods Oper. Res. 74, 281–310
(2011)
13. Doerner, K., Focke, A., Gutjahr, W.J.: Multicriteria tour planning
for mobile healthcare facilities in developing countries. Eur.
J. Oper. Res. 179, 1078–1096 (2007)
14. AdensoDiaz, B., Rodriguez, F.: A simple search heuristics for
MCLP: application to the location of ambulance bases in a rural
region. Int. J. Manag. Sci. 25, 181–187 (1997)
15. Galvao, R.D., Espejo, L.A., Boffey, B.: A comparison of
lagrangian and surrogate relaxations for the maximal relaxations
for the maximal covering location problem. Eur. J. Oper. Res.
124, 377–389 (2000)
16. Church, R.L., ReVelle, C.S.: Theoretical and computational links
between p-median, location setcovering, and maximal covering
location problem. Geogr. Anal. 8, 406–415 (1976)
17. Hakimi, S.L.: Optimum locations of switching centres and the
absolute centres and medians of a graph. Oper. Res. 12, 450–459(1964)
18. Dantrakul, S., Likasiri, C., Pongvuthithum, R.: Appplied p-me-
dian and p-center algorithms for facility location problems.
Expert Syst. Appl. 41, 3596–3604 (2014)
19. Sleeb, J., McLaerty, A.: A weighted covering model to aid in
dracunculiasis eradication. Papers Reg. Sci. 71, 243–257 (1992)
20. Owen, S.H., Daskin, M.S.: Strategic facility location: a review.
Eur. J. Oper. Res. 111, 423–447 (1998)
21. Rahman, S.: Location-allocation modelling for primary health
care provision in Bangladesh (Unpublished Ph.D). University of
Exeter, Exeter (1991)
22. Punch Newspaper. 29 October 2014. [Online]. http://www.
punchng.com/business/businesseconomy/. Accessed 21 June
2015
23. Charles, A.: How is 100% renewable energy possible for Nige-
ria?. Global Energy Network Institute (GENI), California (2014)
24. Roadmap For Power Sector Reform. Office of The President of
Nigeria, Abuja, August 2013
25. Jimoh, O.D.: Operation of Hydropower Systems in Nigeria.
Federal University of Technology, Minna (2007)
26. Labo, H.S.: Current Status and Future Outlook of the Transmis-
sion Network. TCN, Abuja (2010)
27. Sambo, A.S., Bala, E.J.: Penetration of Solar Photovoltaic Into
Nigeria’s Energy. Energy Commission of Nigeria, Abuja (2000)
28. Oluseyi, A.: The potential for wind energy in Nigeria. Wind Eng.
34, 303–312 (2010)
29. Ajayi, O.O.: Assessment of utilization of wind energy resources
in Nigeria. Energy Policy 37, 750–753 (2009)
30. NIMET. Meteorological data. Oshodi: Nigeria Meteorological
Agency (2009)
31. Laary, D.: Electricity: Ghana’s power crisis deepens. 4 February
2015. [Online]. http://www.theafricareport.com/West-Africa/
electricity-ghanas-power-crisis-deepens.html. Accessed 28 July
2015
32. USAid. Ghana Energy Sector Overview. 15 July 2015. [Online].
http://www.usaid.gov/powerafrica/partners/african-governments/
ghana. Accessed 28 July 2015
33. Asante, F.A., Clottey, E.A.: Guide to Electrical Power in Ghana.
Resource Centre for Energy Economics and Regulation,
University of Ghana, Legon (2007)
34. RCEEG. Ghana’s Power Industry. Legon: University of Ghana
(2005)
35. GEC. Energy Supply and Demand Outlook for Ghana. Ghana
Energy Commission (2011)
36. Dernedde, S., Ofosu-Ahenkorak, A.K.: Mini Hydro Power in
Ghana. Ghana Energy Foundation, Accra (2002)
37. DLR. Solar and wind energy resource assessment (SWERA).
Deutsches Zentrum fur Luft- und Raumfahrt (DLR) 2004 (2004)
38. GEC. Preliminary data analysis report on wind resource assess-
ment of 60 m XHD wind masts at selected sites in Ghana. Ghana
Energy Commission (2011)
39. Vaughan, A.: Africa’s largest solar power plant to be built in
Ghana. 4 April 2012. [Online]. http://www.theguardian.com/
environment/2012/dec/04/africa-largest-solar-power-plant-ghana.
Accessed 30 July 2015
40. Asamoah, M., Mensah, S., Basil, F. Igor, K.: Interviewees. RE
Survey Implementation in Ghana. [Interview]. 10–14 August
2015
Int J Energy Environ Eng (2016) 7:177–198 197
123

41. EFG. Energy Foundation of Ghana. 23 April 2013. [Online].
http://www.ghanaef.org. Accessed 27 July 2015
42. AEG. Renewable energy—what is Ghana’s wind power potential.
23 Apil 2013. [Online]. http://arrakis-group.com. Accessed 30
July 2015
43. Gyamfi, S., Modjinou, M., Djordjevic, S.: Improving electricity
supply security in Ghana—the potential of renewable energy.
Renew. Sustain. Energy Rev. 43, 1035–1045 (2015)
44. Udo, B.: Nigeria’s energy crisis worsens; only 5 of 23 power
plants functional—NERC. 26 May 2015. [Online]. http://www.
premiumtimesng.com/news/headlines/183687-nigerias-energy-
crisis-worsens-only-5-of-23-power-plants-functional-nerc.html.
Accessed 14 December 2015
45. ArcGIS. [Online]. http://www.arcgis.com/home/. Accessed 21 07
2015
46. Global Energy Network Institute. 2014. [Online]. http://www.
geni.org/. Accessed 02 May 2015
198 Int J Energy Environ Eng (2016) 7:177–198
123